wear measurement - op.europa.eu
TRANSCRIPT

Wear measurement methodology and test facility to increase the
efficiency of hot stamping for high performance
component production(TESTTOOL)
Research and Innovation EUR 27568 EN
ISSN 1831-9424 (PDF)ISSN 1018-5593 (Printed)
EUR 27568
Wear m
easurement m
ethodology and test facility to increase the efficiency of hot stamping for high perform
ance component production (TESTTO
OL)
EU

Interested in European research?
RTD info is our quarterly magazine keeping you in touch with main developments (results, programmes, events, etc.). It is available in English, French and German. A free sample copy or free subscription can be obtained from:
Directorate-General for Research and Innovation Information and Communication Unit European Commission 1049 Bruxelles/Brussel BELGIQUE/BELGIË Fax +32 229-58220 E-mail: [email protected] Internet: http://ec.europa.eu/research/rtdinfo.html
EUROPEAN COMMISSION Directorate-General for Research and Innovation Directorate D — Key Enabling Technologies Unit D.4 — Coal and Steel
E-mail: [email protected] [email protected]
Contact: RFCS Publications
European Commission B-1049 Brussels

European Commission
Research Fund for Coal and SteelWear measurement methodology and test facility to increase the efficiency of hot stamping for high
performance component production (TESTTOOL)
Montserrat Vilaseca (Coordinator), Jaume Pujante, Daniel CasellasFundació CTM Centre Tecnològic (CTM) Plaça de la Ciència, 2. ES-08243 Manresa
Christine Dessain, Alexandre BlaiseARCELORMITTAL (ARC)
1, Route de St. Leu, FR-60761, Montataire
Mischa Bachmann, Michael AlsmannVolkswagen AG (VW)
Kassel Plant, DE-34219 Baunatal
Anwar Hamasaiid, Marine GrausemRovalma, S.A. (ROV)
Apol·lo n°5, ES-08228 Terrassa
Katarina Eriksson, Daniel BerglundGESTAMP HARDTECH AB (GES)Ektjärnsvägen 5, SE-971 25 Luleå
Agim Ademaj, Ursula Weidig, Kurt SteinhoffUniversität Kassel (UNI)
Dpt. Electrical Engineering & Comp. Science, DE-34109 Kassel
Jens Hardell, Göran Lindkvist, Sergej Mozgovoy, Hans Åhlin, Braham Prakash, Mats OldenburgLuleå University of Technology (LTU)
Universitetsområdet, Porsön, SE-97187 Luleå
Grant Agreement RFSR-CT-2011-00023 1 July 2011 to 31 December 2014
Final report
Directorate-General for Research and Innovation2014 EUR 27568 EN

LEGAL NOTICE
Neither the European Commission nor any person acting on behalf of the Commission is responsible for the use which might be made of the following information.
The views expressed in this publication are the sole responsibility of the authors and do not necessarily reflect the views of the European Commission.
More information on the European Union is available on the Internet (http://europa.eu). Cataloguing data can be found at the end of this publication. Luxembourg: Publications Office of the European Union, 2014
Print ISBN 978-92-79-53615-1 ISSN 1018-5593 doi:10.2777/90081 KI-NA-27-568-EN-CPDF ISBN 978-92-79-53614-4 ISSN 1831-9424 doi:10.2777/8461 KI-NA-27-568-EN-N
© European Union, 2014 Reproduction is authorised provided the source is acknowledged. Printed in Luxembourg Printed on white chlorine-free paper
Europe Direct is a service to help you find answers to your questions about the European Union
Freephone number (*):00 800 6 7 8 9 10 11
(*) Certain mobile telephone operators do not allow access to 00 800 numbers or these calls may be billed.

3
TABLE OF CONTENTS
1. FINAL SUMMARY ............................................................................................ 5
2. SCIENTIFIC AND TECHNICAL DESCRIPTION OF RESULTS ............................. 11
2.1. OBJECTIVES OF THE PROJECT ................................................................ 11
2.1.1. General objectives ............................................................................... 11
2.1.2. Detailed objectives of each work-package ............................................... 11
2.2. PROBLEMS ENCOUNTERED AND CORRECTIVE ACTIONS REQUIERED ............ 13
2.3. DESCRIPTION OF ACTIVITIES AND DISCUSSION ....................................... 14
2.3.1. WP1: Analysis of the thermo-mechanical and tribological conditions during
hot stamping ................................................................................................. 14
2.3.2. WP2: Analysis of the heat transfer between tool and workpiece in hot
stamping ...................................................................................................... 21
2.3.3. WP3: Effect of hot stamping process parameters on the thermo-mechanical
solicitations affecting the tool-workpiece interaction ........................................... 31
2.3.4. WP4: Design and set up of the test facility .............................................. 44
2.3.5. WP5: Establishment of a methodology for accurate wear measurement in hot
stamping tools ............................................................................................... 57
2.3.6. WP6: Wear measurement in tools from test facility .................................. 73
2.4. CONCLUSIONS ..................................................................................... 79
2.5. EXPLOITATION AND IMPACT OF THE RESEARCH RESULTS .......................... 83
3. LIST OF FIGURES .......................................................................................... 87
4. LIST OF TABLES ............................................................................................ 93
5. LIST OF ACRONYMS AND ABBREVIATIONS ................................................... 95
6. REFERENCES ................................................................................................. 97

4

5
1. FINAL SUMMARY
The main objective of this project is the development of a wear measurement methodology and setting up a test facility to evaluate the tribological and thermo-mechanical behaviour of the tool-workpiece system in hot sheet metal stamping. Knowledge of tool wear-related phenomena, limiting component quality and functionality, is achieved through the implementation of the test cycle that reproduces the relevant conditions and wear mechanisms found in the tool-workpiece interface during the industrial process, with an accelerated results acquisition rate. Thus, the developed methodology and test facility can be used for evaluating new combinations of sheet
metals, tool steels and coatings and for predicting tools performance, broadening the application range of high complex and functional hot stamped components.
To achieve this objective the work programme has been broken down into six work packages, which are further divided into specific tasks. A summary of work undertaken in each task is described below addressing the most significant aspects: objectives, results obtained and their usefulness, conclusions and possible applications.
In WP1 the thermo-mechanical and tribological conditions during hot stamping have been analysed in detail. The first task undertaken has been the analysis of current hot sheet metal
stamping process parameters affecting the quality and functionality of final components and tooling performances. The hot stamping process, also known as press hardening, uses boron and manganese alloyed steel blanks to obtain components with a very high tensile strength about 1500
MPa. Blanks are first austenized at approximately 900°C and transferred to the forming station where they are forced to adopt the desired geometry. The forming operation at elevated temperatures allows complex geometries to be obtained due to high formability of the hot material. The blank is cooled by heat transfer through its contact with the tool. The quenching results predominantly in a martensitic microstructure, provided that the cooling rate is sufficiently high. The hot stamping process currently exists in two different main variants: the direct and the indirect
hot stamping method. In the direct hot stamping process, a blank is heated up in a furnace, transferred to the press and subsequently formed and quenched in the closed tool. The indirect hot stamping process is characterised by the use of a nearly complete cold pre-formed part which is subjected only to a quenching and calibration operation in the press after austenitization. The most common hot stamping process is the direct process employing Usibor®AlSi blanks. The Al-Si coating is actually the most widespread coating-solution preventing scale formation on the steel during the direct hot stamping operation and providing excellent corrosion-protection. The 150
g/m2 double-sided Al-Si precoating, which partially diffuses in the base 22MnB5 steel during the austenitising heat treatment, prevents scaling and decarburization. The heating and transfer of the blanks is usually performed in not protective atmosphere (non-inert). Most of the typical tool damage mechanisms observed in other hot forming processes (such as plastic deformation, contact fatigue, mechanical fatigue, thermal shock, thermal softening or thermal fatigue) are not usually observed in hot stamping tools. This is a consequence of a combination of low contact pressures, low tool temperature and low tool thermal gradient during the production cycle. However, the main
damage mechanism in hot stamping tools is wear. In order to maintain the dimensional tolerances and the efficiency in heat transfer, desirable during hot stamping, the wear resistance of the tool material is an important issue. Main wear mechanisms acting on direct process of hot stamping industrial tools are adhesive wear-related. Material from the sheet metal coating is transferred to the die surface through combined mechanical and chemical interaction. This process was found to be dynamic, as adhesion wear and breakdown happened simultaneously to adhered layer formation
and growth, and could generate layers and localised lumps (more than 50 μm thick) on the tool surface. During hot stamping of uncoated UHSS abrasive wear and galling are the main tool wear mechanisms observed.
The main challenges regarding the hot stamping process future demands are to set the technical requirements for high-performance component production allowing extended possibilities in light weight construction and crash performance. Thus in future hot stamping processes the complexity and functionality of components will increase and detailed knowledge of the processes and its potential for development is necessary. Furthermore the sustainable reduction of the cycle time is required for productivity and environmental demands.
Taking into account the previous outlook on current and future process demands on hot stamped components, a reference tool from a direct hot stamping process was selected. The corresponding
tool selected for the reference component (a frame dash panel) is used as a tool along the project to experimentally validate the proposed methodology to quantify wear. This component is being obtained in direct hot stamping process of Usibor1500P ®AlSi. Tool steel material is hot work tool steel DIN 1.2367, with a thermochemical surface treatment of nitriding. As complement, a B-Pillar

6
serial production tool has also been selected to study wear when running uncoated boron steel (indirect process).
In the last task of WP1, the thermo-mechanical solicitations affecting the tool-workpiece interaction during hot stamping of the reference component have been obtained through the development of a
FE-model simulation. Calculated data is of assistance for identification of tool damaging mechanism in the industrial process. The calculation of relevant thermo-mechanical solicitations on the tools takes into account the change in mechanical properties of the blank due to the micro-structure evolution during quenching. The FE-model provides results concerning relative sliding velocities in representative points of the tool, pressure peak and temperature distribution on tools (upper and lower) and on blank. Regarding tribological solicitations in hot stamping processes temperature and pressure are moderate in average. However, it can be observed that both temperature and
pressure present considerable peaks in die radii and edges, where interaction is more intense. This correlates well with the observation of more intense adhesive wear in these locations in hot stamping of Al-Si coated boron steel. On the other hand, two different scenarios can be identified regarding sliding velocity where severe material transfer may take place. In the first, during die closing, sliding velocities can reach very high values. Even though the associated pressure is moderate (around 20 MPa), a long distance of sheet metal slides over the tool surface at high
temperature (blank is still near its initial temperature of approximately 800 ºC); this may translate
in very high amount of material transfer. The second takes place once the dies are near closing. Sliding velocities are drastically reduced to a very low speed of under 2 mm/s. However, pressure can be locally very high (80-90 MPa, but as high as 250 MPa along certain die edges), which may also enhance adhesion by chemical and mechanical means. The variety of wear mechanisms appearing on hot sheet metal forming implies that it is complicated to avoid wear. Based in partnership experience on failure mechanisms occurring in hot stamping and considering the
results obtained in simulation, wear mechanisms can be traced to mainly seven thermal, mechanical and tribological parameters: tool-component chemical affinity, tool and component hardness, tool surface finish, temperature, load and tool-component sliding.
Knowledge acquired in WP1 is useful for the design of a test cycle able to accurately reproduce the observed damaging mechanisms, but also to obtain a better understanding of the underlying wear mechanisms that allows the design of solutions to improve the efficiency of the industrial process.
The heat transfer through the tool–workpiece interface have been analysed in detail in the framework of WP2. A specific device has been designed and set up with the same tool and workpiece materials of the reference component-tool selected to determine thermal contact
resistance (TCR). An FE model of this experimental setup has been established to calculate the heat transfer coefficients (HTC). HTC values increase with the applied pressure. This increase is
linked to the flattening of the surface asperities of the blank on the tool leading to a higher contact between the surfaces and a reduced air trapped within the surface asperities of the interface. Blank coating hardness plays an important role during heat exchange. The evolution of the sub-layer structure in sheet metal coatings for hot stamping as a function of the applied heat treatment was studied for USIBOR® 1500P AlSi and USIBOR® 1500P GA (galvannealed coating). GA coatings have been also investigated as alternative materials because they provide active cathodic corrosion protection and their use is emerging in hot stamped components. It has been determined that AlSi
coating is harder than the steel substrate. This coating behaves similarly to a hard coating. The GA coating is softer than the AlSi coating, and also softer than the steel substrate. Failure load was also lower than in the case of the AlSi coating.
The TCR test facility has been adjusted for more accurate hot stamping heat transfer analysis incorporating heating cartridges. Heating cartridges have been optimized to obtain temperatures in the same range of industrial tools (previously measured on industrial tools thermally
instrumented). In the FE-model of the TCR-test the heating cartridges to heat up the tool are not included. Instead the initial temperature of the tool parts is set (in the model) in accordance with measured initial tool temperatures. This increased the performance of the model, i.e. decreased
simulation time. If cooling channels will be used in future simulations, the model can be easily adapted for that purpose. Increase of the tool temperature from room to 90°C has the effect to slightly increase the HTC.
Finally, the effect of using different materials and thermo-mechanical parameters on the heat transfer through the tool–workpiece interface has been investigated. High Thermal Conductivity Steels (HTCS®) have been proposed as alternative tool steel materials. Tool steel materials with two different thermal conductivities, HTCS®-130 and HTCS®-150, and a third modality of tool material composed of AlCrN coated HTCS®-130 have been evaluated in the TCR test. The reference material DIN 1.2367 has been evaluated in unnitrided and nitrided conditions. Behaviour

7
of USIBOR® 1500P GA blank has also been evaluated. The more efficient thermal exchange has been found in case of the GA coating, due to its lowest hardness at high temperature compared to
the AlSi coating, which improves the quality of the contact at the interface tool/blank even at low
pressure values, but also due to the highest conductivity of this coating. Nitriding treatment of tool steel has no influence on the HTC law with increasing pressure. Concerning different steel grades, it has not been detected an important difference on the heat exchange at the interface tool/blank for HTCS® materials compared to the standard steel, although the experience showed that with high thermal conductivity tool steels the holding time of the hot stamping process is reduced for a
given application, not only to high thermal conductivity but also to high thermal diffusivity (which are directly proportional).
Main findings in WP2 have been used as input in WP4 for test facility design and FE-model refinement.
The effect of hot stamping process parameters on the thermo-mechanical solicitations affecting the
tool-workpiece interaction has been studied in WP3. The identification and description of the main thermo-chemo-mechanical process parameters acting on hot stamping processes have been done on the “integrated thermo-mechanical process facility” (itmp-facility). This is a fully instrumented tribometer equipped with a computerized control system and data acquisition system, which
enables the control and recording of the sliding speed, sliding distance, loads, and temperatures. The workpiece strip is pre-heated in a furnace and then positioned between tool inserts of a flat drawing die. The operating principle is a combination of a strip drawing and a pulling test. The aim
of the given studies is the determination of the coefficient of friction (COF) for conventional direct hot stamping process with variations regarding the thermal and mechanical process parameters on the one hand and adapted process routes for partial hardening for the production of tailored tempered components on the other hand. Tests have been conducted on reference materials (DIN 1.2367 and USIBOR® 1500P AlSi). A furnace dwell time of 240 s (conventional press hardening route in fully austenized condition) yields the lowest coefficient. Higher furnace dwell times lead to
increasing coefficients of friction due to an increase in surface oxides, eventually leading to increased tool surface wear. Process routes for tailored tempered parts showed that the variant for non austenized material in combination with a low furnace temperature of 720 °C result in a non-alloyed FeAlSi coating with a high content of aluminium melt on the surface and, therefore, adhesive wear dominates. Inlaying temperature showed that low temperatures in this respect lead to high values for the coefficient of friction while high inlay temperatures decrease the coefficient of friction. An impact on the coefficient of friction caused by the sliding velocity was not detected.
In order to create a real process data map including all process relevant parameters during hot stamping, a modular U-shaped die equipped with temperature, load, travel and water-flow
measurement sensors has been manufactured and integrated into the itmp-cell. An FE-model of this U-shaped tool has been developed. Thermal sensors for tool surface temperature measurements as well as tactile thermal sensors for blank temperature measurements during closed-die holding time are utilized allowing the verification of FE-model through the obtained results by the experimental method. Tests were run with reference materials (DIN 1.2367 and USIBOR® 1500P AlSi). The main inputs to FE-model were the initial (pressing) temperature of the blank, forming velocity, contact force, water inflow temperature, water flow-rate and the cycle
time. The experiments were conducted for 20 continuous runs to reach a steady-state working temperature in the tools and data were sampled accordingly. Comparison between experimental and calculated values showed that FE simulation of the forming process in the itmp-facility produces reasonable consistency in results which are available as an input for WP4 and WP6.
Tests with standard materials and thermo-mechanical parameters in the itmp-facility have been run. Reference tool steel material has been tested in unnitrided and nitrided conditions sliding
against USIBOR® 1500P AlSi. Slight differences in COF can be observed only during the first trials, while with increasing test numbers the differences in COF decrease. Negligible differences regarding the coefficient of friction at different surface pressures were observed. When the same
tool steel materials are slid against USIBOR® 1500P GA measurements, increased deviations (stick-slip effect) regarding the COF with increasing contact pressure have been observed, which can be dedicated to an increased adhesion of the zinc-liquid onto the tool surface. Moreover, utilizing an unnitrided or nitrided tool surface shows differences in mean value of COF as well as on the COF distribution over the sliding distance. Trials with nitrided tool inserts against GA show a significant decrease of the stick-slip behaviour.
In the last task of WP3, tests with varying materials and thermo-mechanical parameters in the itmp-facility have been carried out. Comparing the resulting coefficient of friction for different tools steels obtained for AlSi-coated sheet material only negligible differences are obtained between

8
standard tool steel DIN 1.2367 and alternative tool steel grades (HTCS®130, HTCS®150 and HTCS®170). A major impact regarding the overall wear mechanism was observed between the
investigated sheet coating systems. HTCS®150 tool inserts with an applied AlCrN coating on the
tool surface have been also evaluated. The measurements for AlSi coated sheet material show a decreasing COF for AlCrN coated HTCS®150 tool steel. While for GA coated sheet material COF increases against AlCrN coated HTCS®150. Furthermore, the slip-stick behaviour and thereby the standard deviation decreases significantly compared to uncoated HTCS150 tool inserts. As conclusion, an improved tribological performance was obtained for AlSi coated material system
combined with HTCS®150 coated with AlCrN and for GA coated sheet material in the combination with standard tool steel DIN 1.2367 in nitrided conditions.
In WP4 a novel facility to evaluate the tribological and thermo-mechanical behaviour of the tool-
workpiece system in hot sheet metal stamping have been designed and set up. The new facility, named High Temperature Tribometer (HTTM), incorporates the knowledge generated during the TestTool project. As a first step of design, a FE-model of the facility have been developed in order to incorporate the thermo-mechanical solicitations to the test cycle. The simulation model of the HTTM uses input from WP1 (reference tool), WP2 (characterization of heat exchange) and WP3 (validation data from semi-industrial tool). Thermo-mechanical solicitations derived from simulation
of the reference tool (forming pressure, relative velocities and temperatures) are used as input to
the simulations. The calculated heat transfer coefficients for different tool and strip material combinations are used to model the tool strip interface. The semi-industrial tool (ITMP-facility) gives input to calculate 3-dimensional field data for thermo-mechanical solicitations in a forming process, which can be used for validation of the HTTM-model.
The HTTM is established at Tribolab, LTU, since Dec.’13. The basic configuration of the facility involves a pair of tool steel pins which are loaded against the workpiece strip surfaces (one from each side) and subsequently slid along the length of the heated strip. In order to enable long sliding distances to induce accelerated wear on the tool steel specimens, an automated pick and
place mechanism feeds in new strips from a tray containing 40. This allows a sliding distance of >30 m to be achieved without changing the tool specimens, which is representative of the sliding distance of an industrial tool (i.e. at sliding distance of 30 mm per stroke, 30 m after 1000 strokes, wear features may reach several micra on the industrial tool). Furthermore, it also allows post-test analysis of the strip surfaces so as to understand the changes in friction and wear with respect to a specific position on a given strip. The Al-Si coated and Zn coated UHSS workpiece materials can be heat treated and alloyed in the test facility. The resulting coating is fully alloyed and representative
of the hot stamping process. Different geometries of tool steel specimens were initially evaluated.
Finally a T-shaped specimen with a machined radius at the leading and trailing edges have been selected, which gives representative results in terms of friction levels and the possibility to study the effect of surface topography on friction and wear. The control and data acquisition software is Labview-based and enables control and monitoring of normal force, friction force, pre-tension force, sliding speed and specimen temperatures.
Continued refinements in HTTM facility, aimed at efficient testing through optimal control of test variables and improved accuracy in measurements, have been made throughout the project duration in the framework of the last task of WP4. These upgrades included optimization of heat
treatments of strips, in order to obtain AlSi and GA coatings with representative microstructure and composition similar to industrial process; tool geometry; tool specimen temperature measurements and revision of the numerical model of the HTTM. Tribological tests performed in WP6 incorporate these improvements.
In WP5 a methodology for accurate wear measurement in tools has been established. To accomplish this, different techniques for analysis of wear generated on hot stamping tools have
been evaluated. An incremental approach has been followed. Studies have begun on laboratory-produced samples and using the most precise (but less industrially applicable) techniques, such as scanning electron microscopy (SEM) and destructive analysis (cross-sections). With each step,
tribosystem size and complexity has been increased, and testing has been centred in the most industrially applicable techniques. Out of all of the studied techniques, topography analysis is the most flexible. It offers different possibilities depending on the wear mechanism encountered, from individual analysis of large or unique features to analysis of general surfaces or to characterize small volumes of wear distributed over a surface. Moreover, topography analysis offers enough information to identify the wear mechanisms acting on a system. Direct measurement through
confocal microscopy offers accurate measurements for laboratory and simulator test samples, and could therefore be applied to the HTTM inserts measurement. A replication technique has been developed in the framework of TestTool project to measure wear features on industrial tools. This technique consists in the application on tool surfaces of a viscous silicone-based compound which

9
cures in a few minutes into a high precision thermoset polymer replica of the surface topography. After curing, these replicas can be lifted off the surface and stored for future analysis. Details down
to 0.1 µm (height) are reproduced. The combination with surface replication allows topography
analysis to be applied up to the industrial tooling scale without loss of accuracy, in addition to some interesting secondary advantages such as keeping an historic record of the surface status from a tool. Other techniques, such as a magnetic induction gauge to measure thickness of adhered material presents important advantages when measuring industrial tools, but also limitations. Advantages include very fast measurements and little post-processing required. The main
disadvantage is that this technique is only able to measure adhesive wear, never loss of material, and need to recalibrate the gauge before measuring non-flat surfaces.
The different measuring techniques have been evaluated for accurate wear measurement in semi-
industrial and industrial processes. Worn inserts from the itmp-facility (WP3) and from a deep drawing process simulator (DDPS), which runs tests for hot stamping applications, have been analyzed with the different techniques. It has been validated that the presented techniques can be used to evaluate adhesion wear mechanism distributed over a surface. Additionally, industrial tools have been inspected by means of replication technique. The reference tool showed quite homogeneous material transfer. Flat horizontal surfaces showed discontinuous adhesion,
approximately 3-5 µm thick. Tool flanks showed material consistent with a combination of adhesion
and compaction of dust, and a thickness in the 10-15 µm range. Around the radii, material accumulated in features around 30 µm thick, even though measurements of up to 100 µm were recorded.
Finally, the methodology has been applied for accurate wear measurement in tools from test facility. In terms of quantitative results from inserts of HTTM, the best option is to take into account both worn area on the inserts and thickness of adhered material. An index has been proposed calculated from profilometry and stereo microscopy measurements. The techniques applied to calculate this index are precise and fast, and can be used for additional characterization,
such as identification of wear mechanisms. Additionally, preparation of cross-sectional samples and observation through SEM has also been valuable to identify the wear mechanisms and characterize the system. Even if this step is not always required, it may be interesting to apply this kind of analysis when tests using new materials or different parameters are performed. This methodology has been used in WP6 to characterise worn inserts tested in HTTM.
WP6 summarises the knowledge gained throughout TestTool project. First of all, test facility has been validated for accurately measuring wear in tools for hot stamping applications. The HTTM test
facility designed and setup in WP4 has been employed to determine high temperature friction and wear characteristics of tool-workpiece material pairs under press hardening process conditions. The
thermo-mechanical testing parameters (velocities and pressures) were extracted from numerical simulations of the industrial reference tool (WP1). Reference tool steel material (nitrided DIN 1.2367) has been test against USIBOR® 1500P AlSi. Cross-sectional analysis of the tool samples reveals that wear mechanisms correspond to the ones observed in industrial tools. The most important mechanism is material transfer from the coating to the tool inserts. The microstructure of transferred material shows mostly an appearance consistent with the accumulation and compaction of particles broken off from the coating. This is particularly visible in the surface near
the leading edge of the inserts. The middle of the inserts showed slightly different wear mechanisms. In this case, a thin layer of smeared material was observed to coat the surface. The test facility is capable of reproducing the wear mechanisms observed in press hardening. Accelerated wear can be induced on material pairs intended for application in industrial processes or interesting for investigation of their suitability.
Accelerated wear experiments on different combinations of tool-workpiece materials (which include
HTCS tool steels and both AlSi and GA coated blanks) using various thermo-mechanical parameters have been conducted. The main factor affecting tribological behaviour is the nature of blank coating, as found in previous WPs. For GA coated material, COF increases with each subsequently
tested strip at lower contact pressure. For AlSi coated material, the coefficient of friction drastically increases when severe material transfer takes place as ploughing occurs. The influence of different sliding velocities on COF is in general negligible, which was also observed during experiments in the itmp-facility in WP3, but the results here indicate that severe material transfer and ploughing do not seem to occur at higher sliding speeds in the case of AlSi coating. COF is generally lower at higher loads, independent of the materials in contact. In tests with different steel grades sliding
against AlSi, results show no clear dependence between measured material transfer and forming parameters. For instance, for the reference material (1.2367+Nitriding), material transfer appears to increase when load is increased from 500 to 1000 N. The same seems true for HTCS 130. However, HTCS150 does not show the same behaviour. When the different grades are compared, it

10
appears that HTCS steels show less material transfer. This might be related to reduced chemical affinity between the HTCS surface and AlSi based transfer. However, HTCS grades showed higher
degree of abrasive wear than the reference material. This behaviour could be improved with the
application of a nitriding treatment. When GA coated blanks are tested, no apparent effect can be detected between measured material transfer and forming parameters. Neither do the different tool steels show significant differences in their performance. The softer GA coating results in more contact between the two surfaces, as opposed to asperity interaction in the case of AlSi coatings. Therefore, contact between the two sliding counterparts would result in more material transfer.
Finally, the conversion of the test cycle time to actual tool lifetime has been explored. The designed test facility is able to reproduce wear mechanisms observed in hot stamping tools. The conditions tested show higher wear in the test facility when higher load is applied, as well as a complex
relationship with sliding speed. Comparison with wear in the industrial tool shows that areas subject to these conditions are tool radii and flanks, where sliding adhesion occurs: these areas show much more wear than areas of the tool subject to less severe loads. This indicates that the severity of the tests performed can be affected directly by modifying sliding parameters, as a function of the local forming conditions as determined through FE modelling.
It can be concluded that an estimation of the lifetime of hot stamping tools can be accomplished by
numerical simulations of the process. The lifetime of hot stamping tools can be estimated through quantification of the wear behaviour obtained during simulative experiments in the newly developed test facility. However, the methods for quantifying wear require careful evaluation and
validation. In this project, several methods have been presented, such as a wear index complemented with measurements based in the Archard model. In view of this, it is difficult to convert a test cycle time to actual tool lifetime that allows predicting the performance of forming tools for industrial applications and that enables the assessment of the manufacturing process from a technical as well as an economical point of view. Adhesive wear is generally the dominant wear process in press hardening, but abrasive wear, thermal fatigue and corrosive (tribochemical) wear
also play an important role and reduce the lifetime of the forming tools as they alter the contact conditions during forming. It is desirable to enhance the durability of forming tools and to extend their service life through adjustment of parameters during the process. A reliable wear prediction then enables sustainable manufacturing of more complex shaped components with increased functionality to meet the requirements of the automotive industry in the future.
About impact of results obtained within TestTool project, utilizing the test facility it is possible to obtain relevant results in an economic way in view of small and cheap test specimens and the
possibility to screen large number of test conditions and materials in relatively short time. Additionally, tests are performed in controlled conditions making the evaluation more accurate. The
achievement of project objectives has enabled the detailed study of wear phenomena affecting hot stamping processes, the evaluation of new combinations of sheet metal, tool steel and coatings and the prediction of tool failure, thus broadening the application range of high complexity and performance hot stamping components. There is general agreement that the best way for European industry to successfully compete is through the creation and development of value added products with high knowledge contents that fit the perspective of the automotive industry. The know-how developed within the project will contribute in introducing the forming processes of new
and advanced knowledge-based materials and lead to greater productivity at a lower economic and energy cost. Producing high-quality products at a competitive price is becoming an ever-tougher challenge as product life-cycles are getting shorter all the time and new products must be brought to market more rapidly. The need for new tools in response to these requirements is becoming more and more challenging. The possibility of testing new materials and solutions from the step design will provide the market with higher quality and more innovative products along with the
perspectives to increase of productivity and cost effectiveness of the investigated hot stamping
process in one hand. On the other hand, the understanding developed provides new tools and investigation orientations to the partners involved towards more innovation and creation. The resulting know-how and manufacturing practices will contribute to strengthening the relationship between the automotive components sector and the major motor manufacturers.
Results of the project have been disseminated by different means: 2 publications in scientific journals, 6 contributions in international conferences, webpage (http://testool.ctm.com.es/), several press releases and two PhD Thesis. However, there are foreseen more contributions to scientific journals and conferences in the near future.

11
2. SCIENTIFIC AND TECHNICAL DESCRIPTION OF RESULTS
2.1. OBJECTIVES OF THE PROJECT
2.1.1. General objectives
This project aimed at developing a wear measurement methodology and setting up a test facility to evaluate the tribological and thermo-mechanical behaviour of the tool-workpiece system in hot sheet metal stamping. The main objectives being tackled to this purpose can be summarised as
follows:
Identification of the phenomena affecting the functionality of the tool-component system; understanding the governing tool damage mechanisms and their time evolution in dependence of the thermo-mechanical process and sheet material conditions.
Determination of all relevant process parameters and thermal, chemical and thermo-mechanical solicitations acting on hot stamping tools.
Development of a methodology to accurately measure wear in tools.
Design and set up of a test facility able to reproduce the thermo-mechanical solicitations and wear mechanisms acting in industrial hot stamping processes. The generated data will improve the efficiency of this technology, through the determination of the relationship between the tool-workpiece contact quality, the final properties and shape of the workpiece and the damage acting on tools.
Achievement of these objectives will give rise to secondary objectives, related to increasing
component quality and preventing tool failure through materials modification:
Evaluation and design of new sheet steel grades and coatings compatible with tool materials
Optimisation of tool steels and hard coatings suited to the solicitations of hot stamping.
2.1.2. Detailed objectives of each work-package
WP1: Analysis of the thermo-mechanical and tribological conditions during hot stamping
Comprehensive review regarding the relevant process-plant variables affecting the final quality
and functionality of hot stamped components and tool performances, taking into account the expertise from the industrial partners of the consortium.
Generation of technical information regarding the range of tool-workpiece interacting thermo-mechanical parameters responsible for the final quality and functionality of hot stamped components.
Identification and comprehension of the damaging mechanisms that decrease the tribo-mechanical tool behaviour, as well as the most critical tool configurations during common hot
stamping processes.
Definition of current and future demands on hot stamped components complexity and functionality and tools lifetime.
Determination of the relevant thermo-mechanical solicitations acting on the tool-workpiece
interface during hot stamping of a selected reference component by means of FEM-simulations.
WP2: Analysis of the heat transfer between tool and workpiece in hot stamping
Comprehensive analysis of the heat exchange through the tool-workpiece interface and its influence on the sheet microstructure and the tool surface integrity.
Determination of the influence on heat transfer of the tool thermal conductivity, the presence of a hard coating, the workpiece geometry, thickness, the type of sheet coating, the contact pressure and the temperature, etc.
Upgrade relevant information concerning the interaction between the tool and the workpiece for a better comprehension of the tribological behaviour and the surface damage mechanisms in
tools.

12
WP3: Effect of hot stamping process parameters on the thermo-mechanical solicitations affecting the tool-workpiece interaction
Determination of all relevant hot stamping process parameters using a fully instrumented test facility for hot-sheet metal forming (integrated thermo-mechanical process facility – abbr.: “itmp-facility”).
Development of a special FE-model with included real-data mapping in order to identify by simulation the physical parameters (temperature, pressure….) which are not accessible by any parameter tracking or measurement in a purely experimental environment.
Identification and understanding of the tool-damage mechanisms acting at different thermo-mechanical conditions.
WP4: Design and set up of the test facility
Incorporating the thermo-mechanical operating conditions extracted from FEM-simulations of the reference component (task 1.3) from the process test cycle.
Design of a test facility for accelerated tests that simulates, through integration of the test
cycle, the same tribo-mechanical conditions experienced by the tool-workpiece interface in
industrial hot stamping processes.
Development of a prototype of the test facility, fully instrument it and commission it for accelerating wear testing of tool specimens.
WP5: Establishment of a methodology for accurate wear measurement in hot stamping tools
Definition of parameters capable for description of the surface condition of hot stamping tools.
Development of a methodology to quantify wear in hot stamping tools.
Validate the methodology in the reference industrial hot stamped component and in the
developed test facility.
Contribution in accelerating the wear data rate acquisition.
WP6: Wear measurement in tools from test facility
Employment of the newly developed wear test facility and conduct wear measurements in tools for hot stamping processes through quantification of the tool wear and characterisation of associated wear mechanisms.
Analysis of wear test results obtained from the new test facility and ascertain whether these results correlate well with those seen in the industrial hot stamping processes without altering the operating wear mechanisms.
Characterisation of the damage mechanisms in tools during hot stamping of different sheet materials and coatings.
Evaluation of the influence of materials properties and thermo-mechanical process parameters on tool wear results.
Estimation of the actual tool life based on wear predictions and lost of tool-workpiece contact quality for industrial hot sheet metal stamping applications. An accurate estimation of tools life will enable to assess the manufacturing process feasibility, from the technical as well from the
economical point of view, of more complex shaped components with increased functionality to satisfy the future requirements of the automotive industry.

13
2.2. PROBLEMS ENCOUNTERED AND CORRECTIVE ACTIONS REQUIERED
Problem encountered Corrective actions
Task 1.2: Component selection. A frame dash panel was selected to be studied during the project. This component is produced in a direct
hot stamping process with a tool made of a common hot work steel (DIN 1.2367) with a plasma nitriding process. Although nitriding is also a common operation performed on hot work tool steel for hot forming applications, it was not taken into account in the Technical Annex, and material preparation requires and additional step (time
consuming).
Tool steel inserts for WP2 and WP3 have been prepared in both conditions: unnitrided and nitrided in order to
investigate the influence of this surface treatment in the tribological behaviour at tool-workpiece interface. Although there has been a delay on material preparation, it has not affected the execution of further work.
Task 1.2: Component selection. Regarding the additional tools provided by GES, the Monoblock Bumper initially selected has been replaced by a B-Pillar tool, due to its higher availability.
In both cases, the tools are used for hot stamping of uncoated boron steel; therefore, the change will affect neither the work plan nor the results of the project.
Task 1.3: FE-model of the reference tool. This Task should be finished in June of 2012, nevertheless FE-model development delayed due to problems with blank positioning and blank geometry (which caused crashing of the model in
the final part of the simulations due to wrinkling and folding). As a consequence, Deliverables 1.2 and 1.3 were delayed.
A semi-working FE-model of the reference tool was ready in Dec’12. Can got pressure and temperature results. Del. 1.2 and Del. 1.3 were both finished in March’13.
Task 2.2: The sub-task corresponding to the FE-model development to characterise the heat exchange at the interface tool – workpiece in the
TCR was delayed during 2013 annuity due to model optimization.
FE-model was developed and validated with experimental data. Pressure dependence of the HTC parameters has
been optimized for each pressure used in the experimental tests to achieve the smallest possible residual error. This task finished in Dec’13 and Del. 2.1 was produced. It hasn’t implied a delay in
other tasks and provided a reliable model
to be used in Task 4.1.
Task 3.2: Development of a FE-model of the itmp-facility. This task was delayed during 2013 annuity because it was not possible to use elastic tools in cyclic simulations. As consequence no residual stress field was transferred between
steps for the tool, only temperature field was evolving with each step.
The model was developed in Dec.’13. Cyclic simulations have been done accurately: 6 cycles with rigid tools, after each step the final tool temperature is input as initial values in next step, final
temperatures after 6 cycles input as initial temperature in simulation with elastic tools. It hasn’t implied a delay in other tasks and provided a reliable model to be used in Task 4.1, however Del. 3.2 has been delayed until Dec.’14.
Deliverable 3.2: Retrieval of three-dimensional thermo-mechanical field data by an FE-model (of the itmp-facility), validated by experiments.
Although the main task work for this deliverable was finished in late Dec'13, the extraction of results for the deliverable and writing of the same
were postponed and delayed due to work with Task 4.1.
The quality of the simulation results (as can be seen in section 3.2.2) were adequate to be used in Task 4.1. The
submission delay of the deliverable didn’t affect Task 4.1, as data was readily available when comparison of simulation
results was on the agenda in the task.

14
Problem encountered Corrective actions
Task 4.1: Incorporation of the thermo-mechanical
solicitations to the test cycle. This Task was slightly off schedule because information from FE-models developed in Tasks 2.2 (Thermal Contact Resistance model) and 3.2 (semi-industrial hot
stamping process model, itmp-facility) was needed. Task 4.1 includes a FE-model of the test facility and the dynamics of the physical process was more challenging for the modelling part than expected. Defining a model that can give usable results was severely challenged due to numerical contact issues.
The main numerical issues have been
resolved and a usable model was available in Dec.’13.
Task 5.2: Inspection of semi-industrial and industrial processes was slightly delayed due to production needs. Regarding the additional tools provided by GES, only B-Pillar has been analyzed, initially foreseen sill outer tools were not
inspected. Main basic wear mechanisms from B-
Pillar tool have been identified and characterized, however the evolution of these mechanisms have not been done.
It doesn’t imply a delay in other tasks, and all relevant wear mechanisms have been properly identified and characterised. The evolution of wear mechanisms have been done with reference tool from VW.
Objectives of the project have been
accomplished.
2.3. DESCRIPTION OF ACTIVITIES AND DISCUSSION
Main activities have been described for each work package and task. Further information can be found in deliverables and previous Annual Reports (referenced). Innovations made have been highlighted in this section.
2.3.1. WP1: Analysis of the thermo-mechanical and tribological conditions
during hot stamping
Task 1.1: Analysis of current hot sheet metal stamping process parameters affecting the quality and functionality of final components and tooling performances [VW, GES, ROV, ARC]
The hot stamping process, also known as press hardening, uses boron and manganese alloyed steel blanks to obtain components with a very high tensile strength about 1500 MPa. Blanks are first austenized at approximately 900°C and transferred to the forming station where they are forced to adopt the desired geometry. The forming operation at elevated temperatures allows
complex geometries to be obtained due to high formability of the hot material. The blank is cooled by heat transfer through its contact with the tool. The quenching results predominantly in a martensitic microstructure, provided that the cooling rate is sufficiently high. The hot stamping process currently exists in two different main variants: the direct and the indirect hot stamping method. In the direct hot stamping process, a blank is heated up in a furnace, transferred to the press and subsequently formed and quenched in the closed tool (Figure 5.1a). The indirect hot
stamping process is characterised by the use of a nearly complete cold pre-formed part which is subjected only to a quenching and calibration operation in the press after austenitization (Figure 5.1b).
The most common hot stamping process is the direct process employing Usibor®AlSi blanks. The Al-Si coating is actually the most widespread coating-solution preventing scale formation on the steel during the direct hot stamping operation and providing passive corrosion-protection. The 150 g/m2 double-sided Al-Si precoating, which partially diffuses in the base 22MnB5 steel during the
austenitising heat treatment, prevents scaling and decarburization. The heating and transfer of the blanks is performed in not protective atmosphere (non-inert).

15
Figure 5.1.- Basic hot stamping process chains: a) direct hot stamping, b) indirect hot stamping [KAR10].
The main damage mechanism in hot stamping tools is wear. In order to maintain the dimensional tolerances and the efficiency in heat transfer, desirable during hot stamping, the wear resistance of the tool material is an important issue. Main wear mechanisms acting on hot stamping industrial tools were identified by Pujante et al. [PUJ11].
Direct process: The wear mechanisms observed in hot stamping of Al-Si coated 22MnB5 were adhesive wear-related. Material from the sheet metal coating was transferred to the die surface
through combined mechanical and chemical interaction. This process was found to be dynamic, as adhesion wear and breakdown happened simultaneously to adhered layer formation and growth, and could generate layers and localised lumps more than 50 μm thick on the tool surface.
Indirect process: In the case of uncoated 22MnB5, the main acting damage mechanisms observed were abrasive wear and galling. Abrasive wear was identified through the blurring and eventual removal of machining patterns on the tool surface, and was caused by the ploughing effect of sheet metal asperities and third body abrasion caused by oxide scale. Galling was identified as
macroscopic V-shaped lumps, up to 70 μm in height and more than 1 mm in diameter and formed
due to direct metal to metal contact in conditions of high load and temperature.
The main challenges regarding the hot stamping process future demands are the sustainable reduction of the cycle time with respect for environmental demands. Furthermore it is necessary to set the technical requirements for high-performance component production allowing extended possibilities in light weight construction and crash performance. Thus in future hot stamping processes the complexity and functionality of components will increase and detailed knowledge of
the processes and its potential for development is necessary.
The simulation of the hot stamping process is one key factor to future process optimization. The identification and measurement of the relevant process parameters are required for a successful simulation. In addition to several relevant material and thermodynamical parameters, detailed information about wear- and friction behaviour of the tool-workpiece system is strongly required to plan and run processes more efficiently.
New heating technologies could play a role for accelerated heating of the blanks. New steel grades
with lower austenitization temperature could save energy, cut cycle time and open the usage of alternative coatings.
High-performance components require high-performance tools. Cooling strategies, tool materials, surface technology and increasing functionalization are factors reflecting the complexity of the possibilities given by tool construction and manufacturing.
The results obtained in this project will improve the performance of hot stamping lines, allowing
even further increase in part quality and optimisation of the maintenance cycles in press shops. The knowledge gained on wear mechanisms will be useful for the design of laboratory wear tests which reproduce the same fundamental wear mechanisms observed in the industrial process, and for the design of wear preventive solutions for hot stamping tools.

16
Additional information on current and future process demands on hot stamped components can be found in Deliverable 1.1 Outlook on current and future process demands on hot stamped
components complexity and functionality and tools performance.
Task 1.2: Selection of a reference industrial hot stamped component [All]
Taking into account the outlook on current and future process demands on hot stamped components complexity and functionality and tools performance described in Task 1.1, a reference tool from a direct hot stamping process was selected (VW). The corresponding tool selected for the reference component (a frame dash panel) is used as a tool along the project to experimentally
validate the proposed methodology to quantify wear. The tool is built up of three segments in shell construction. The steel grade is DIN1.2367 with a hardness of 48+2 HRC (Figure 5.2).
Figure 5.2.- Selected reference tool (illustration from CAD).
Table 5.1.- Surface characteristics of Frame dash panel tool. Delivery status from tool
surface treatment provider.
Parameter ideal value
Surface hardness > 66 HRC
Diffusion depth > 0,3 mm
Change in material base hardness < -20 HB
Compound layer thickness > 10 µm
Surface roughness Rz < 1,5 µm
Surface layer condition after final finish Existing on complete functional area
Surface parameters like hardness and roughness are defined and set by a surface finishing process (see Table 5.1). A plasma nitriding operation was performed on tool. The range of the cooling system distance to the surface depends on the cooling strategy itself. The minimum surface distance is 8 to 15 mm.
Due to its complexity and several radii the wear is comparatively higher (see Figure 5.3, worn zones were labelled with white dashed lines). Thus the selected tool displays a good reference regarding the project objectives.
The tool was new manufactured to record the complete tool lifetime during the project. The tool was observed during production time and wear characteristics were reported.

17
Figure 5.3.- Images of a tool similar to the selected reference tool, worn areas are labelled.
The common process parameters are given in Table 5.2.
Table 5.2.- Common process parameters from Volkswagen press shop.
Heating parameters 300 – 360 sec at 900 – 950 °C
Transfer time 4-13 sec
Inlaying temperature 700 – 750 °C
Atmosphere without inert gas (oven equipped with inert gas)
Cooling > 27 K/s
Process Direct process
As complement to the VW reference tool, a B-Pillar serial production tool at Gestamp HardTech has also been selected for studies within the TestTool project. This second tooling is used in WP5 in order to study wear when running uncoated boron steel. A B-Pillar component can be seen in Figure 5.4. The work material is 1.4 mm uncoated 22MnB5 and the tool material QRO 90 Supreme, without surface treatment or coating. The heating is done in protective atmosphere in order to
avoid scale and decarburization.
Figure 5.4.- A B-Pillar component scheme from GES.

18
Task 1.3: Thermo-mechanical solicitations affecting the tool-workpiece interaction during hot stamping of the reference component [LTU]
Hot stamping process simulation of the frame dash panel part chosen as reference for determination of thermo-mechanical interaction parameters in the process has been done (see FE-model in Figure 5.5). Calculated data is of assistance for identification of tool damaging mechanism in the industrial process. The calculation of relevant thermo-mechanical solicitations on the tools takes into account the change in mechanical properties of the blank due to the micro-structure evolution during quenching.
Figure 5.5.- FE-model of frame dash panel tool and blank.
Results have been obtained for thermo-mechanical solicitations (relative sliding velocity, temperature and pressure) acting in the tool-work piece interface of the reference component during the simulated forming process. Maps of calculated tool and blank temperatures are directly available from the software. Likewise, pressure maps of peak/maximum pressure during the
simulation and also pressure time history is available and extracted from the calculated results. However, in the current version of the software used it is not possible to present a full map of the relative sliding velocity for parts of the blank-tool interface in contact. Instead contact nodes on the blank sliding over specified contact segments on the tool can be traced. Tracing the nodes over time made it possible to determine when contact was established and to calculate a relative sliding velocity. In Figure 5.6, three different points on the lower tool are shown. The points are located on tool surfaces with sharp curvature (radius points) and chosen as examples to extract data.
Figure 5.6.- A, B and C are points for measurement of pressure and relative velocity in simulation.
Some examples of data obtained from simulations are presented below: relative sliding velocity (for point A) in Figure 5.7, peak pressure map on the upper tool in Figure 5.8 and temperature map in Figure 5.9.

19
Figure 5.7.- Relative velocity and pressure point A.
Figure 5.8.- Peak pressure on UPPER tool for an initial tool temperature of 383 K. Scale in Pascal.
Figure 5.9.- Temperature distribution in UPPER tool for initial tool temperature 298K at time 4.2 seconds.
Deliverable 1.2 Determination of the thermo-mechanical solicitations on the reference industrial hot stamped component, includes a detailed description of the FE-model and results regarding relative sliding velocities in representative points of the tool, pressure peak and temperature distribution on tools (upper and lower) and on blank.
Most of the typical tool damage mechanisms observed in other hot forming processes (such as plastic deformation, contact fatigue, mechanical fatigue, thermal shock, thermal softening or thermal fatigue) are not usually observed in hot stamping tools. This was thought to be a consequence of a combination of low contact pressures, low tool temperature and low tool thermal gradient during the production cycle. These assumptions have been validated in the FE simulation work performed. With the lack of these damage phenomena, tool wear appears as the limiting factor for tool life and process efficiency. Deliverable 1.3 Determination of the tribo-
-20
0
20
40
60
80
100
-100
0
100
200
300
0 1 2 3 4 5
[MP
a]
[m/s
]
x 0
,00
1
[s]
Velocity A 298 K Tool
Velocity A 383 K Tool
Velocity A 443 K Tool
Pressure A 298 K Tool
Pressure A 383 K Tool
Pressure A 443 K Tool

20
mechanical solicitations on hot sheet metal stamping processes, summarizes the available knowledge about the tribological solicitations in the hot stamping process, obtained by expanding
the background of the research partners with results obtained during WP1 and the beginning of
WPs 2 and 5 of the TestTool project.
Regarding tribologial solicitations in hot stamping processes temperature and pressure are moderate in average. However, it can be observed that both temperature and pressure present considerable peaks in die radii and edges, where interaction is more intense. This correlates well with the observation of more intense adhesive wear in these locations in hot stamping of Al-Si
coated boron steel ([PUJ11], [VIL12]).
On the other hand, two different scenarios can be identified regarding sliding velocity where severe material transfer may take place. In the first, during die closing, sliding velocities can reach very high values. Even though the associated pressure is moderate (around 20 MPa), a long distance of sheet metal slides over the tool surface at high temperature (blank is still near its initial temperature of approximately 800 ºC); this may translate in very high amount of material transfer. The second takes place once the dies are near closing. Sliding velocities are drastically reduced to a
very low speed of under 2 mm/s. However, pressure can be locally very high (80-90 MPa in the studied point A, but as high as 250 MPa along certain die edges), which may also enhance
adhesion by chemical and mechanical means.
The variety of wear mechanisms appearing on hot sheet metal forming implies that it is complicated to avoid wear. Based in partnership experience on failure mechanisms occurring in hot stamping and considering the results obtained in Deliverable 1.2, wear mechanisms can be traced to mainly seven thermal, mechanical and tribological parameters: tool-component chemical
affinity, tool and component hardness, tool surface finish, temperature, load and tool-component sliding. These parameters have a complex relationship, often affecting various wear mechanisms in different ways. The effect of these parameters on wear mechanisms is summarised in Table 5.3.
Table 5.3.- Effect of various parameters on the main wear mechanisms in hot stamping.
Key: : increasing this parameter increases the wear mechanism
: increasing this parameter decreases the wear mechanism
*: This parameter has an indirect effect, see below
Knowledge acquired in WP1 will be useful for the design of a test cycle able to accurately reproduce
the observed damage mechanisms, but also to obtain a better understanding of the underlying wear mechanisms that allows the design of solutions to improve the efficiency of the industrial process.
Ch
em
ica
l
Aff
init
y
To
ol
Ha
rdn
es
s
Co
mp
on
en
t
Ha
rdn
es
s
To
ol
Su
rfa
ce
Ro
ug
hn
ess
Te
mp
era
ture
No
rma
l L
oa
d
Sli
din
g
Abrasion *
Adhesion
Dust Compaction
Galling *
Ploughing *
Scratches *
Smearing

21
2.3.2. WP2: Analysis of the heat transfer between tool and workpiece in
hot stamping
Task 2.1: Analysis of the heat transfer through the interface tool–workpiece by means of TCR tests [ARC, LTU, ROV, CTM]
Further information of WP2 tasks is detailed in Deliverable 2.1 Analysis of the heat exchange through the tool-workpiece interface and its influence on the thermo-mechanical solicitations affecting the sheet microstructure and surface quality, as well as the surface integrity and
damaging mechanisms of tools.
Thermal Contact Resistance (TCR) facility design and set up: To investigate the heat exchange between tool and workpiece interface in hot stamping process, a new device has been designed and machined with the same tool material (DIN 1.2367 unnitrided and plasma nitrided), corresponding to that of the reference component-tool pair selected in Task 1.2. A scheme of the device can be seen in Figure 5.10. Tools have been instrumented by welding thermocouples in the
depth of holes. The measurement quality depends on the instrumentation which should answer to three important criteria. First, the implantation of thermocouple wires must be relatively non-
intrusive to minimize the systematic errors of temperature measurement. Thermocouple wiring must also be very close to the surface in order to ensure a good compromise between the sensitivity and the measuring accuracy. Finally, thermocouple implantation should be robust enough to support the mechanical and thermal high strains that prevail in hot stamping process [ABD10, BLA13]. All the samples in Usibor® 1500P coated with AlSi have been performed by
electroerosion in the half thickness of the blank and a thermocouple has been welded in the depth of this hole. The tool has been instrumented with the same type of thermocouples K sheathed with silky glass and with a diameter of 500 m.
Figure 5.10.- a) Scheme of TCR device with the flat sample quenched between the flat punch and
the die, b) thermocouple schematic position in blank and tool (thermocouple tc1 is at 1.5 mm from the surface and tc2 at 3.5 mm from the surface).
The heating cycle in the furnace was 900°C during 6 min and 30 s, the samples were then transferred from the furnace to the surface of the die and deposed on the pins supported by springs to prevent early sample cooling during tool closing. The tools were then closed and maintained at the desired contact pressure during 20 seconds (see Figure 5.11). Following figures
show temperature evolution results obtained with tool material 1.2367 (unnitrided in Fig. 5.12 and
nitrided in Fig. 5.13) and blanks of 22MnB5 with AS150 coating, thickness: 1.5 mm. The decrease of the TCR can be noticed with the increase of the contact pressure due to a more efficient contact linked to the crushing of the asperities of the sheet coating on the surface of the tools.
Blank
Tool
Thermocouples
in tool
Thermocouple
in blank
T1
T2
T3
Inverse Technique Direct Problem
1st Step 2nd Step
TTS(t), (t) TB
S(t)
Registered data
(t)
TCR(t) =TT
S(t) - TBS(t)
(t)
Blank
Tool
Thermocouples
in tool
Thermocouple
in blank
T1
T2
T3
Inverse Technique Direct Problem
1st Step 2nd Step
TTS(t), (t) TB
S(t)
Registered data
(t)
TCR(t) =TT
S(t) - TBS(t)
(t)TCR(t) =
TTS(t) - TB
S(t)
(t)TCR(t) =
TTS(t) - TB
S(t)
(t)
SampleSample
a) b)

22
Figure 5.11.- TCR device experimental set-up.
Figure 5.12.- Temperature evolution in the blank (a) and in the die (b) with increasing contact
pressure values between 5 MPa to 30 MPa. Tool material 1.2367 unnitrided, blank 22MnB5 with AS150 coating, thickness: 1.5 mm.
Figure 5.13.- Temperature evolution in the blank (a) and in the die (b) with increasing contact pressure values between 5 MPa to 30 MPa. Tool material 1.2367 nitrided, blank 22MnB5 with
AS150 coating, thickness: 1.5 mm.
Establishment of an FE model allowing characterizing the heat exchanges at the interface tool – workpiece during the TCR tests: To create a FE-model of the TCR-test tool the initial step was to simplify the actual tool. In Figure 5.14 the complete tool is shown in a digital drawing, and only parts essential to the simulation results are kept. Only the punch (upper tool) and die (lower tool), blank, place holder pins and push pins are used in the simulation model.
Furnace
Acquisition
system
Amplifier
Cold box
Press
Force sensor
Max Press Force : 60kNMax displacement speed : 60mm/s Punch stroke : 210mm
a) b)
a) b)

23
In Figure 5.15 the FE-model of the tool and blank is shown. The blank is modelled with thermal shell elements and the punch and die with solid elements. Place holder pins with thermal shell
elements and spring loaded push pins with solid elements (spring constant 0.08 N/mm). The
software used is LS-DYNA [LSD13], and the material model for the blank is MAT_UHS_STEEL which includes temperature dependent material properties and enables calculation of component micro-structure evolution. The material properties used in the model for the blank corresponds to Usibor® 1500P. All data (chemical composition, activation energies, latent heat, thermal and mechanical properties etc.) necessary to calculate the blank properties are compiled from
numerous open sources (articles, data-sheets from steel manufacturers etc.). The model assumption is that the initial temperature of the blanks is above austenitization temperature. The blank thickness is 1.5 mm + 1%, taking thermal expansion into account when starting a simulation procedure. The material model for the tools was chosen as rigid material, where the thermal and mechanical data corresponds to the evaluated tool steels (DIN 1.2367, HTCS® 150 and HTCS® 130 with data supplied by Rovalma fact sheets). Although the tool material is considered rigid in the calculation, the contact stiffness is based on the given mechanical properties in order to
calculate contact pressure.
Figure 5.14.- Digital drawing (CAD) of
TCR test tool. Parts used in FE-model
marked with text boxes.
Figure 5.15.- FE-model of TCR test tool. Parts
corresponding to labelled parts in Figure 5.14.
Input parameters to the simulation model (such as tool velocity and initial temperature, holding times, force curves etc.) are extracted from experimental raw data supplied by ARC. All thermal velocity terms are scaled in the simulation model with a factor 100, i.e. enabling the use of faster tool speed (100 times original speed) and thereby shorter simulation time. The punch (upper tool) is displacement controlled and a counterforce is applied to the die to limit the pressure in the tool-work piece interface to the actual pressure used in the experimental tests. In order to speed up the
calculation the convective heat loss from the tool parts is not included in the model. Instead the upper most boundary nodes on the upper tool and the lower most boundary nodes on the lower tool are kept at a constant temperature (prescribed boundary condition) to enable thermal energy loss in the tool. Model employed for the blank cooling during the transfer of the blank from the furnace to the press and model for the blank cooling by contact with the flat tools are described in detail in Deliverable 2.1. To correlate FE-simulation results to measured data, temperature and
force time histories are compared. In the experimental tests temperatures are measured in punch,
die and blank according to Figure 5.10b. Measurement points T1 and T2 are located 3.5 mm and 1.5 mm below tool surfaces, respectively. Measurement point T3 is in the middle of the blank. All points are 10 mm from vertical tool surface (and 10 mm from blank edge). Point T1 and T2 are identical in punch and die. Tool force is measured by a force transducer. Simulation temperature results are extracted from points (nodes and/or elements) in the model approximately at the same positions as in the tests (somewhat dictated by element size and position), limited to position T2 in
the tools and the blank temperature (T3). Tool force is calculated as a global reaction force between model parts.
Based on temperature measurements retrieved by TestTool partner ARC the contact heat transfer coefficient (htc) in the tool-work piece interface is calculated by an optimization procedure. Due to the fact that the measured data is evaluated by the means of FE-simulations a suitable function,

24
describing the contact heat transfer as a function of pressure, were chosen to be optimized in order to calculate an estimate of the htc in the process. An estimate of the htc is calculated for each tool
material – blank material combination used in the experimental work. By using the measured blank
temperatures and tool temperatures in the outer most position (T3 and T2 positions in Figure 5.10b) and a FE-model of the process experimental tool the contact heat transfer is estimated by optimization.
The first trials included using a fully coupled numerical model of the experimental tool and blank (see Figure 5.15). This included a thermo-mechanical material model capable of capturing the
latent heat release in the blank when the blank material is transformed into martensitic structure during cooling (material model MAT_UHS_STEEL). In that case, a solution of the problem renders a calculation time of approximately 20 hours for each run. Because in the optimization procedure, using a sequential response surface method (SRSM) with the software LS-OPT [LSO13], it is needed to perform a vast number of simulations in order to construct a response surface, the fully coupled model is not feasible to use. A reasonable alternative is to use a thermal only model (with thermal properties according to the actual blank material) in the optimization process. Although the
model is not able to capture the latent heat release in the blank, the calculation time of approximately 20 to 30 minutes makes it a very feasible choice. Included in the thermal-only model is the use of a technique to avoid modelling the experimental tool at all. Details of the
optimization, pressure dependence of htc and boundary conditions can be found in Deliverable 2.1.
An example of model performance is shown in Figure 5.16, where results obtained from simulation are compared to experimental results.
Figure 5.16.- Measured and calculated tool temperature curves for 30 MPa contact pressure. Tool steel is DIN 1.2367 without nitriding and blank material is Usibor® 1500P AlSi. The model is fully
coupled.
Calculated HTC are all shown in Task 2.3.
Determination of coating properties: The microstructural, mechanical and tribological characterization of sheet metal coatings for hot stamping has been performed at CTM. Sheet metal strips 90x150 mm2 were obtained from USIBOR AlSi and USIBIOR GA sheet steel supplied by ARC.
Strips were subject to different heat treatments in an open atmosphere furnace. Table 5.4 offers a
summary of the applied heat treatments. Then the strips were quenched using a set of HTCS150 flat dies mounted in a 170 tm hydraulic pres. Transfer time (from the oven to the press) was approximately 6 s, similar to the industrial process. Quenching was done in-die for a time of 10 s under a nominal pressure of 5.44 MPa.

25
Table 5.4.- Summary of samples and heat treatments.
Conditions
Heat treatment Coating Temperature Time
AlSi1 AlSi as received
AlSi2 AlSi 900 ºC 390 s
AlSi3 AlSi 900 ºC 240 s
AlSi4 AlSi 720 ºC 390 s
AlSi5 AlSi 900 ºC 1800 s
GA1 GA as received
GA2 GA 880 ºC 330 s
GA3 GA 880 ºC 240 s
After heat treatment at the recommended temperature of 900 ºC, all samples show completely alloyed structure, consisting on five sub-layers. Grigorieva et al. [GRI11] identified the outermost and third sub-layers as Fe2Al5, the second and fourth sub-layers as the Al-Si-Fe ternary phase 1
and finally a diffusion layer between coating and substrate consisting mainly of an iron matrix with Fe3Al inclusions. Nanoindentation studies were performed on cross-sectional samples of the
recommended heat treatment (360 s at 900 ºC) and of an overaged one (1800 s at 900 ºC) in order to determine if heat treatment affected sub-layer properties (Figure 5.17). All layers are much harder than the base heat treated sheet steel, presenting hardness between 8 and 14 GPa, as opposed to the approximately 5.5 GPa of the base metal. Layers one and three, corresponding to the binary phase Fe2Al5 are slightly harder (13 GPa) than layers 2 and 4 (10 GPa), corresponding to the Al-Si-Fe ternary phase 1. The outermost part of the diffusion layer (layer 5)
showed lower hardness than the rest of the layers (7 GPa), but higher than the base steel. Heat treatment does not significantly modify the layer properties: hardness is the same for each phase in both studied samples.
Figure 5.17.- a) Distribution of sub-layers in the layer structure of USIBOR AlSi and b) Mechanical characterization in the sub-layers of the heat treated USIBOR AlSi. a) Sub-layer
structure; triangles indicate the different indented phases. b) Comparison of hardness of the five layers after different heat treatments.
In the as-received state, the GA coating has a thickness of approximately 11 µm, and columnar structure. The coating is completely reformed during heat treatment. Grains grow and tend to
spherical shapes. Presence of voids and structures similar to dendrites suggests that liquid phase is formed between grains. Additionally, diffusion of Fe into the coating and Zn into the substrate

26
results in increasing coating thickness with increasing heat treatment time (Figure 5.18). Semi-quantitative chemical analysis by means of EDX was performed on a sample after complete heat
treatment. Results show that the coating consists essentially in a Fe-Zn alloy, with minor additions
of Al and Si. After heat treatment, the Fe content of the coating reaches more than 60 % in weight. On the other hand, diffusion of Zn into the substrate is minimal. Nanoindentation measurements performed on the heat treated GA layers show that this coating is much softer than the heat treated AlSi, and also softer than the steel substrate (less than 4,5 GPa). Mechanical properties did not appear to be affected by heat treatment (Figure 5.18).
Figure 5.18.- a) Thickness measurement of the GA coating after different heat treatments. b) Mechanical characterization in the sub-layers of the heat treated USIBOR GA. Comparison of
coating hardness after heat treatments GA2 and GA3.
In order to characterise the high temperature tribological behaviour of the workpiece coatings, a novel high temperature scratch test was developed, based on the scratch test used for mechanical characterization of thin hard coatings on metal substrates. In this test, a hard indenter is slid on
the coated sample under increasing load. When the coating-substrate system fails, the failure load and failure mode are noted, and used to characterise the system. To allow testing at high
temperatures, the Rockwell C diamond indenter commonly used in scratch test was replaced by a carbide blade, able to withstand higher temperatures and easier to replace when damaged. Scratch test was performed on samples extracted from the heat treated strips. Tests were performed using a CETR UMT-2 multifunction tribometer equipped with a high temperature chamber. 600 ºC was chosen for performing the test: at this temperature, the diffusion of the species in the coating is
slow enough that heat treated samples can be reheated for their test without affecting the sub-layer structure [GHI11]. An example is presented in Figure 5.19, showing the measured COF and corresponding scratch track topography.
Table 5.5 summarizes the results obtained in high temperature scratch testing of USIBOR samples. In general terms, it can be observed that temperature has a very important effect on the tribological behaviour of the system, and that the AlSi coating is harder than the GA one.

27
Figure 5.19.- High temperature scratch test on USIBOR AlSi at 600 ºC. Coating failure load (Lc2) can be observed both (a) in the coefficient of friction and (b) by analysis of the scratch
track.
Behaviour observed in high temperature scratch test of USIBOR AlSi corresponds to a harder
coating on a softer substrate. Incremental load scratch test (ILST) was performed both at room temperature and at 600 ºC with good repeatability. In both conditions, failure load Lc2 could be determined from COF curves and scratch track analysis, corresponding to approximately 34 N at room temperature and 7.5 N at 600 ºC. In Constant load scratch test CLST, failure load between 5 and 7 N could be determined from scratch track analysis, but not from the COF curves.
Behaviour observed in high temperature scratch test of USIBOR GA corresponds to a soft coating on a substrate of similar or slightly higher hardness. ILST offered results difficult to analyse, with
no clear sign in the COF corresponding to the critical load and a shifted scratch track. CLST was more useful in determining a critical load Lc2 between 3 and 5 N.
Table 5.5.- High Temperature Scratch Test on USIBOR AlSi and GA: Summary of the determined failure load under different conditions.
Material Temperature Method Failure Load
USIBOR AlSi RT ILST 34 ± 4 N
USIBOR AlSi 600 ºC ILST 7.5 ± 0.5 N
USIBOR AlSi 600 ºC CLST 5 - 7 N
USIBOR GA 600 ºC ILST < 4 N
USIBOR GA 600 ºC CLST 3 - 5 N
Nanoindentation of Al/Si coating (after conventional heating and quenching) was performed in Michalex Company (tests managed by ARC). High temperature hardness characterization was performed in an instrument based on the technology developed by the French Aerospace Lab (ONERA) and Michalex. Hardness of steel evolution with temperature is shown in Figure 5.20. The hardness of the Usibor 1500P steel decrease significantly between 25°C and 700°C. Adhesion between indenter and sample was detected (Figure 5.20b). This material adhesion could play an important role on the shape of the load-displacement curves leading to an imprecise determination
of the elastic modulus and hardness. The Young modulus of the 22MnB5 material was 210 GPa at 20°C, 198 GPa at 500°C and reduced to 52 GPa at 600 °C. The last value of 75 GPa at 700°C was
LC2
a)
b)

28
really perturbed by the adhesion force between the tip and the substrate (F= 250 mN to take off the Berkovich indenter from the surface of the material).
Figure 5.20.- a) Hardness evolution of the substrate of the Usibor 1500P with the temperature
via Loubet model. b) 500 ºC indentations. Impressions show a white area around indents and light adhesion of the tip with the substrate.
A second serial of tests with a new quenched sample polished manually directly in its clamping device and tested with a new Vickers diamond indenter was performed. Hardness evolution with
temperature of both steel substrate and coating are shown in Figure 5.21. The decrease in hardness of the coating of the Usibor1500P is not very important between 20 and 500 °C, it presents a drastic drop between 500 °C and 600 °C. On the opposite, the hardness of the substrate decreased drastically between 20 °C and 500 °C and this decrease follows up regularly with the increase in temperature. At 700 °C, the hardness of both coating and substrate is close to 0.3 GPa.
Figure 5.211.- Evolution of the hardness of the substrate(S) and of the coating (C) of a Usibor 1500P with the temperature considering the indent print of a Vickers Tip in diamond.
Task 2.2: Adjustment of TCR test facility for more accurate hot stamping heat transfer analysis [ARC, LTU]
Trials with heating cartridges have been performed in this Task. To design tool heating channels the temperature of the industrial tools during production needed to be known accurately, in order
to optimize the heating channels and the heating system. GES performed a study on industrial tools thermally instrumented. Figure 5.22 shows that the maximum temperature is between 150-170 ºC and the minimum temperature between 90-95 ºC (in steady state condition and 1-2 mm beneath tool surface).
Hardness (GPa)
0
0,5
1
1,5
2
2,5
3
3,5
4
4,5
5
Steel 25oC Steel 500oC Steel 600oC Steel 700oCa)
b)

29
Figure 5.22.- Temperature measurement showing steady state conditions in an industrial tool from GES.
It was defined to machine the tool with heating cartridge for an imposed tool temperature of 90°C
at 1.5 mm from the surface of the tools (Figure 5.23). The dimensions and the power of the necessary heating cartridges have been calculated and a regulation box to apply a stable temperature in the punch and in the die have been developed.
Figure 5.23.- Heating cartridges in the tools to obtain a minimum temperature of the tool equivalent to 90°C at the beginning of the test and at 1.5 mm from the surface.
The temperature evolution in the blank with increasing contact pressure values between 5 MPa to 30MPa in this configuration with heated tools at 90°C is presented below:
Figure 5.24.- Temperature evolution in the blank (a) and in the die (b) with increasing contact pressure values between 5 MPa to 30 MPa with tools heated at 90 ºC. Tool material 1.2367
unnitrided, blank 22MnB5 with AS150 coating, thickness: 1.5 mm.
a) b)

30
The FE-model of the TCR-test is adapted for different initial temperatures of the tool. However, actual heating cartridges to heat up the tool are not included. Instead the initial temperature of the
tool parts is set (in the model) in accordance with measured initial tool temperatures. This
increased the performance of the model, i.e. decreased simulation time. If cooling channels will be used in future simulations, the model is easily adapted for that purpose.
Task 2.3: Effect of using different materials and thermo-mechanical parameters on the heat transfer through the tool–workpiece interface [ARC, ROV]
Figure 5.25 shows the calculated contact heat transfer coefficient for the different combinations of
tool-work piece interface. The values for different pressures are calculated from the optimized function for each combination of blank material and tool material, included indicated coatings and tool treatment. The numbers are rounded to at most three significant digits and have the units W/(m2K). The blank and tool material combinations are listed in the left column and the pressures in the top row.
Figure 5.25.- Contact heat transfer coefficient (htc) in tool-work piece interface for different blank and tool material combinations and pressures. Bar chart showing htc grouped for material
combinations at each applied pressure level in the tool.
The comparison of the Heat Transfer Coefficient values for all the modalities tested in the project highlights the difference of behaviour of the Usibor® 1500P GA comparatively to the Usibor® 1500P AlSi interface with tools leading to higher HTC values even at low pressure values.
As can be seen on Figure 5.25, the HTCS® materials show slightly lower heat transfer coefficient than conventional steel 1.2367 when tested against AlSi coated sheet. On the other hand, HTCS®-150 against GA sheet presents higher heat transfer coefficient than HTCS®-130, HTCS®-150 and
1.2367. This study shows that there is not an important difference on the heat exchange at the interface tool/blank for HTCS® materials compared to the standard steel, although the experience showed that with high thermal conductivity tool steels the holding time of the hot stamping process
is reduced for a given application, thanks not only to high thermal conductivity but also to high thermal diffusivity, as they are directly proportional. High thermal conductivity steels generally improved heat extraction by reducing tool temperature in the steady state. Additionally, it must be
taken into consideration that the USIBOR coating has low thermal conductivity, which dominates the overall contact behaviour, as can be deduced from the general expression for harmonic thermal conductivity in a contact:
21
111
h
Therefore, it is difficult to measure the actual contribution of tool steel thermal conductivity to the interface behaviour, as difference in measurements can be in the same order of magnitude as

31
noise. Surface finish of the counterparts may influence thermal conductivity. Even though the surface roughness of the tools has been carefully verified by ARC before tests, it was measured
again at CTM after tests in both specimens: tools and tested blanks. It was concluded that tool
roughness from studied tools (TCR tests) does not seem to be a significant factor in the measured HTC and test pressure does not seem to affect sheet roughness for AlSi samples. However, GA coating roughness is affected by test pressure and the coating is flattened during the test. The higher HTC for GA samples can be explained partly because of this different mechanical behaviour. Real area contact will be higher at low contact pressures, ensuring high HTC.
2.3.3. WP3: Effect of hot stamping process parameters on the thermo-
mechanical solicitations affecting the tool-workpiece interaction
Task 3.1: Identification and description of thermo-chemo-mechanical process parameters on “integrated thermo-mechanical process facility” (abbr.: itmp-facility) [UNI]
In order to conduct tests at near serial press hardening conditions with particular regard to
thermo-physical and tribological phenomena for various material systems as a function of process parameters, a special test unit, the test unit “integrated thermo-mechanical process facility” (itmp-
facility) developed in UNI, is available. The tribometer is fully instrumented and equipped with a computerized control system and data acquisition system, which enables the control and recording of the sliding speed, sliding distance, loads, and temperatures. Operating details can be found in Deliverable 3.1 Identification of the wear-affecting process conditions by in-situ monitoring of the thermo-physical state of the tool in dependence of the selected
thermo-mechanical process courses and resulting load situation. Additional off-line characterisation by optical, tactile and metallographic methods.
The process is given in Figure 5.26. The try-out and primarily trials were obtained through a flat forming tool inserts composed of the standard hot forming tool steel 1.2367 hardened to 48+2 HRC. The initial surface conditions were investigated through white-light interferometry (Veeco, type WYKO NT1100), Figure 5.27. The obtained values for Ra, Rz, Rq, and Rt are 0.262 μm, 5.40 μm, 0.33 μm, and 4.32 μm, respectively.
Figure 5.26.- Process route of the tribological test envirnment.
heating transfer
• continuous furnace
• primary heat-transfer-
system: heat radiation
• T furnace max. = 950°C
• protective gas atmosphere
possible
• specimen geometry:
500mmx50mmx1,5mm
• side roller for strip transfer
• transfer time (minimum): 2s
test bed
• f riction test bed
• calculation based on
Coulomb's approach
measurement data
• temperature-time-data
over the complete process
chain
• forces and travel
measurement sensors
• f low rate measurement
• furnace atmosphere
• tool temperature
measurement and control
transferheating / austenitizing coefficient of friction
measurement
D
Z
F
Fµ
2
FD
FZ

32
Figure 5.27.- Initial tool specimen and surface conditions as obtained through white-light
interferometry.
The aim of the given studies is the determination of the coefficients of friction for conventional press hardening process with variations regarding the thermal and mechanical process parameters on the one hand and adapted process routes for partial hardening for the production of functionally graded properties on the other hand. Test conditions are listed in Table 5.6.
Table 5.6.- Experimental test conditions investigated in Task 3.
With respect to the resulting coefficient of friction, the furnace dwell time constitutes a major impact and is studied as a function of the applied surface pressure. Dwell times considered within this respect are 240, 360, and 420 seconds and the surface pressure was varied in the range of 3,
6, and 12 MPa investigated with a constant drawing velocity of 60 mm per second. The resulting coefficients of friction are illustrated in Figure 5.28. For each trial a sliding distance of 180 mm was applied. A trend results from the experiments with regard to the impact of the furnace dwell time,
viz. for a constant surface pressure an increased dwell time results in an increased coefficient of friction. Nevertheless, for a surface pressure of 6 MPa only a negligible difference between 360 and 420 seconds dwell time is observed. The combination of 12 MPa surface pressure and 420 seconds dwell time resulted in a plastic deformation of the specimens and made investigations impossible. Moreover, for a constant dwell time of 240 seconds an increased surface pressure results in a slightly reduced coefficient of friction while for a dwell time of 360 seconds an increase of friction can be investigated.
Figure 5.28.- Influence of heating conditions on the tribological behaviour for Usibor®1500P + AlSi annealed at 930 °C, drawing velocity 60 mm/sec.
Ra = 0,262µm
Rz = 5,40µm
Rq = 0,33µm
Rt = 4,32µm
Surface conditions
Ra= 0.262µm
Rq= 0.35µm
Rz= 3.57µm
Rt= 4.88µm
Furnace
temperature
[ C]
Heating time
[sec.]
Inlay temperature
[ C]
Nominal surface pressure
[MPa]
Workpiece Tool material
720 360670
(transfer time 6.5sec.)
3
6USIBOR 1500PTM sheet AlSi
1.2367
(48+2HRC)
930
240
360
420
800
(transfer 6.5sec.)
550
(transfer time 55sec.)
3
6
12
USIBOR 1500PTM sheet AlSi 1.2367
(48+2HRC)
0.351 0.331 0.323
0.416 0.4280.472
0.442 0.425
0
0.1
0.2
0.3
0.4
0.5
0.6
0.7
3 6 12
co
eff
icie
nt
of
fric
tio
n µ
[-]
surface pressure [MPa]
Heating time: 240sec.
Heating time: 360sec.
Heating time: 420sec.

33
The influence of heating conditions with respect to maximum furnace temperatures of 720 °C and 930 °C, respectively, was investigated in a second step for a constant heating time of 360 seconds
and surface pressures of 3 and 6 MPa, resulting in a decrease of coefficient of friction with an
increased furnace temperature for both applied surface pressures, Figure 5.29. This effect results from an increased adhesive wear behaviour from the AlSi coating due to non-alloyed properties of the coating within the given temperature interval (see Fig. 5.30a). The intensive adhesive wear cannot be observed for the increased furnace temperature of 930 °C as for these heating conditions the alloyed properties of the coating are guaranteed (see Fig. 5.30b). Investigations of
the obtained coatings are performed through white-light interferometry and cross-sectional light optical microscopy, Figure 5.31.
Figure 5.29.- Influence of heating conditions on the tribological behaviour for Usibor®1500P + AlSi, drawing velocity 60 mm/sec.
Figure 5.30.- Tool surface with adhesive wear of the AlSi layer after 5 trials: a) 720 °C, 360 sec., 6 MPa; b) 930 °C, 360 sec., 6 MPa.
Figure 5.31.- The cross sectional images and surface conditions for AlSi-coated samples after the heat treatment.
The aforementioned influence of the inlay temperature is given in Figure 5.32. For a decreased inlaying temperature an increased coefficient of friction results both for a surface pressure of 3 and 6 MPa. The influence of pressure for constant inlaying temperature, however, is negligibly small. This effect results from an increased surface hardness at low temperatures.
0,475 0,497
0,416 0,428
0
0,1
0,2
0,3
0,4
0,5
0,6
0,7
3 6
co
eff
icie
nt
of
fric
tio
n µ
[-]
surface pressure [MPa]
Furnace temperature: 720°CDwell-time: 360sec.
Furnace temperature:930°CDwell-time: 360sec.
720 C, 360sec. 930 C, 240sec. 930 C, 360sec. 930 C, 420sec.
Coating thickness: 28µm
Surface conditions
Ra= 2.78µmRq= 3.60µm
Rz= 24.68µmRt= 29.97µm
Coating thickness: 32.5µm
Interdiffusion layer: 3.9µm
Surface conditions
Ra= 2.01µmRq= 2.50µm
Rz= 20.36µmRt= 23.63µm
Coating thickness: 35.8µm
Interdiffusion layer: 8.1µm
Surface conditions
Ra= 2.20µmRq= 2.83µm
Rz= 21.60µmRt= 25.40µm
Coating thickness: 37.6µm
Interdiffusion layer: 10.3µm
Surface conditions
Ra= 2.56µmRq= 3.46µm
Rz= 40.07µmRt= 44.14µm
B A

34
Figure 5.32.- Influence of inlaying temperature conditions on the tribological behaviour for Usibor®1500P + AlSi heat-treated at 930 °C, drawing velocity 60 mm/sec.
Figure 5.33 depicts the resulting coefficient of friction for different drawing speeds (20, 60 and 100 mm/sec) utilizing AlSi-coated sheet material. The results show no significant impact on the
coefficient of friction for the investigated sliding velocities.
Figure 5.33.- Influence of sliding velocity on the tribological behaviour for Usibor®1500P + AlSi.
More detailed information on this task can be found in Deliverable 3.1.
Task 3.2: Development of a FE-model for hot sheet metal forming on the itmp-facility [LTU, UNI]
In order to create a real process data map including all process relevant parameters during hot stamping a fully instrumented test facility has been build up. Therefore, a modular U-shaped die equipped with temperature, load, travel and water-flow measurement sensors has been
manufactured and integrated into the itmp-cell. Temperature surveillance during the press hardening process constitutes a key role for an efficient production of UHSS components for body
in white applications. Therefore, 13 temperature sensors in different positions within the active elements of the die are integrated. Thus, thermal sensors for tool surface temperature measurements as well as tactile thermal sensors for blank temperature measurements during closed-die holding time are utilized allowing the verification of FEM-model through the obtained results by the experimental method. Figure 5.34 depicts the flexible tool design utilized within the
course of this project phase containing integrated temperature, load, and travel sensors. The modular U-shape allows the implementation of different tool steels as well as different die geometries for investigating the process impact on tool wear phenomena during the hot stamping process. A thermal imaging camera was included into the prototype cell during the tests in order to obtain the thermal distribution of the blank as inserted into the tool and of the formed prototype directly after press opening.
0,416 0,4280,470 0,474
0
0,1
0,2
0,3
0,4
0,5
0,6
0,7
3 6
co
eff
icie
nt
of
fric
tio
n µ
[-]
surface pressure [MPa]
Inlay-temperature: 800°C
Inlay-temperature: 550°C
Substrate material: 22MnB5 (Usibor)
Coating: AlSi (150 g/m²)
Furnace temperature: 930 C
Heating-time: 360 sec
Transfer time: 6.5 sec
Inlay-temperature: ≈ 800 C
Contact-pressure: 6 MPa
Drawing velocity: 60 mm/sec
Tool steel: 1.2367

35
Figure 5.34.- Modular tool utilized within the course of the Test Tool project (left); amount
of integrated sensors and demonstrator dimensions (right).
A FE-model of the experimental set-up was developed. The relevant parts are shown in Figure
5.35, where the punch, die, blank holders and blank are the relevant parts. Note the cooling channels included in the model. To extract field information the tool parts must be modelled as elastic materials. Translation control of the punch and application of constraints on the die is modelled by attaching the elastic parts to rigid surfaces with tied contacts. Water cooling is modelled as convective boundary conditions on the cooling channel surfaces. The temperature
dependent convective heat transfer coefficients are calculated with relations for forced convection in turbulent flow in tubes. The tools are modelled with mechanical and thermo-physical properties corresponding to standard tool steel DIN1.2367. The blank is modelled with a thermo-mechanical model capable of calculating the phase transformation in the material. Mechanical and thermo-physical properties correspond to Usibor® 1500P. The software package used for calculations was LS-DYNA R7.0 [LSD13].
Figure 5.35.- Fe-model of itmp-facility with relevant parts displayed. Elastic tool parts are attached to rigid surfaces for motion control purposes.
From the set-up of the itmp-facility with test conditions according to Table 5.7 data was extracted
for use in FE-simulations to calculate the results presented in this summary.
Integrated process data mapping:
- 10 x temperature sensors type K for tool-surface temperature measurements
- 3 x tactile thermal sensors in order to obtain the blank temperature during closed-die holding time
- thermal imaging camera for temperature distribution- 1 x travel sensor- 1 x load cell
- 1 x ultrasonic water flow measurement- water in- and outflow temperature measurement
Dimensions of demonstrator in [mm]:
Load cell
Modular
tool inserts

36
Table 5.7.- Test conditions for the itmp-facility. Selected parameters used in FE-simulation of the forming process.
Blank material: 22MnB5 (Usibor® 1500P) AS
Heating-time: ≈ 360 sec
Furnace temperature: 930 °C Pressing-temperature: ≈ 780 °C - 800 °C
Transfer time: ≈ 8 sec Closed-die holding time: 12 sec
Forming velocity: 60 mm/sec Tool-coating: uncoated
Tool-steel: 1.2367 + 48 HRC Water inflow temperature: 21 °C
Cycle-time: ≈ 30 sec Water flow-rate: 40 l/min
Repetitions: 20 Contact pressure: 12.5 MPa (280 kN)
In order to achieve high temperature accuracy with the utilized thermal imaging camera investigations with welded thermocouples on the blank surface were carried out and based on the results the coefficient of emission was calibrated (see Figure 5.36).
The main inputs to FE-model were the initial (pressing) temperature of the blank (retrieved from measurement data from the itmp-facility), forming velocity, contact force, water inflow
temperature, water flow-rate and the cycle time. The experiments were conducted for 20 continuous runs to reach a steady-state working temperature in the tools and data were sampled accordingly. In Figure 5.37 the data collecting points in the tool are shown. In the FE-model data were sampled from nodes in approximately the same positions as in the physical tool. To decrease simulation time the forming velocity is increased 100 times (i.e 600 mm/s). The relevant thermal properties are automatically scaled accordingly to yield consistent results.
Figure 5.36.- Obtained process data (left) at different process stages (right).

37
Figure 5.37.- Data collecting positions in the itmp-facility. Data from FE-model sampled in corresponding positions.
To reach a steady state condition with the FE-model a number of forming simulations are performed. Selected field results from the final simulation are shown below.
Extraction of results was carried out in a multi-step procedure: 1) plot the fringe map of contact pressure in the tool, 2) do a section plot located in relevant areas (high pressure) correlated to the time of peak pressure during the simulation, 3) choose relevant time steps where the pressure is high, 4) do fringe and section plots of field data. Figure 5.38 shows the peak pressure for the die surface. Note that the peak pressure can be momentary and the fringe plot shows the pressure
during the whole simulation. As can be seen, the nominal forming pressure of 12.5 MPa is exceeded in the peek values shown in the figure. The section plane is indicated with a white line and the direction of the cut distance coordinates with a green arrow.
Figure 5.38.- Peak pressure fringe plot of the die tool part. Section cut indicated by white line.
Stress, strain and temperature data for the die tool part and stress and plastic strain for the blank. The results for the die are extracted after 18 seconds duration of the forming cycle (total time 30 s, or 0.3 s scaled time) and for the blank at the end of the simulation (30 s process time). Some selected results are shown in the following figures. Complete information can be found in Deliverable 3.2 Retrieval of three-dimensional thermo-mechanical field data by an FE-
Model, validated by experiments.

38
Figure 5.39.- Section plane fringe plot showing effective stress straight through the middle of the die tool part after 18s duration of a forming cycle.
Figure 5.40.- Section plane fringe plot showing the temperature straight through the middle of
the die tool part at the end of a forming cycle (30 s). Temperature in Kelvin [K].
Figure 5.41.- Effective (total) strain in blank upper outer (visible) surface at the end of a forming cycle (30 s).
To validate if the model is capable of (to some extent) replicating measured results temperature readings from the itmp-facility are compared with calculated temperatures from the simulation with elastic tools. In Figure 5.42 and Figure 5.43 measured and calculated tool temperatures for selected points are shown. The measured and calculated blank temperatures are shown in Figure 5.44. CTEx.x (CBEx.x) are calculated temperatures and TEx.x (BEx.x) are measured temperatures.

39
Figure 5.42.- Comparison of measured and calculated temperatures in die tool part. Labels are according to Figure 5.37. A leading C in the label means calculated value.
Figure 5.43.- Comparison of measured and calculated temperatures in punch tool part. Labels are according to Figure 5.37. A leading C in the label means calculated value.
Measured and calculated tool temperature show reasonable agreement with one exception. The
temperature node for CTE2.3 is significantly lower than measured temperature. This is explained by the fact that the node chosen for data extraction is close to the cooling channel in the die and cannot correctly describe the temperature history at that point.
Figure 5.44.- Comparison of measured and calculated temperatures in blank. Labels are according
to Figure 5.37. A leading C in the label means calculated value.

40
The blank temperature is measured with a tactile thermal sensor located in the tool whereas the calculated temperature is extracted from a nodal point in the blank. Hence the difference in
starting temperature as the sensor only registers temperature when the hot blank is in certain
proximity of the latter. The CBF1.3 ALT calculated value is added to the chart because the CBF1.3 value from the middle of blank is not quite representative for the cooling history. The latter node is contacting the tool in a zone with less contact area on one side of the blank due to a modelled fitting for the tactile sensor.
It is concluded that, although the process is complicated and modelling introduces a number of
simplifications, it is possible to simulate the forming process in the itmp-facility with reasonable consistency in results which are available as an input for WP4 and WP6.
Task 3.3: Running tests with standard materials and thermo-mechanical parameters in the itmp-facility [UNI, ROV, ARC, VW, GES]
This task entails frictional and wear investigations of standard materials considering typically applied thermo-mechanical parameters in hot stamping. Therefore, tests are carried out utilizing the aforementioned tribometer itmp-facility. This test unit is briefly described in Task 3.1.
Tribological investigations utilizing heat treatable steel 22MnB5 in the dimensions 550 mm x 50
mm x 1.5 mm with varying coating systems (AlSi and GA) were investigated against flat forming tools DIN 1.2367 hardened at 48+2 HRC with an adjusted surface roughness of Ra = 0.2 µm in uncoated and plasmanitrided surface conditions, Figure 5.45.
Figure 5.45.- Investigated tool and workpiece material systems in Task 3.3.
The choice of parameters is oriented on standard requirements on hot stamped components for automotive applications defined together with VW and GES and also based on the results obtained in Task 3.1. The investigations with varying tool surface and sheet coating have been carried out under the given test conditions in Table 5.8.
Table 5.8.- Test conditions for trials in Task 3.3 and varying material and tool surface conditions.
Test conditions Aluminum-Silicon
coated 22MnB5
GA coated 22MnB5
Tool-steel 1.2367 1.2367
Tool surface uncoated, plasmanitrided uncoated, plasmanitrided
Furnace temperature 930 °C 880 °C
Heating-time 360 sec 330 sec
Transfer time 6.5 sec 6.5 sec
Contact pressure 3 MPa, 6 MPa 3 MPa, 6 MPa,
Drawing velocity 60 mm/sec 60 mm/sec
Tool steel: DIN 1.2367
Hardness: 48+2HRCSurface roughness: Ra 0.2 µm

41
Figure 5.46 depicts the obtained coefficient of friction (COF) as a function of travel using AlSi-coated sheets. The measurements show a homogeneous pattern over the sliding distance. The
tests are run with five repetitions. Slight differences between uncoated and plasmanitrided tool
steel can be observed only during the first trials while with increasing test numbers the differences in COF decrease. Negligible differences regarding the coefficient of friction at different surface pressures were observed (not shown in this figure).
Figure 5.46.- Coefficient of friction as a function of sliding distance for AlSi coated steel substrate
against uncoated tool steel (left) and plasmanitrided tool steel (right). 5 repetitions.
Figure 5.47 depicts the obtained COF as a function of travel using GA-coated sheets under different load conditions. The measurements show increased deviations (stick-slip effect) regarding the
coefficient of friction with increasing contact pressure which can be dedicated to an increased adhering of the zinc-liquid onto the tool surface. Moreover, utilizing an uncoated or plasmanitrided tool surface shows differences in mean value of COF as well as on the COF distribution over the sliding distance. Trials with plasmanitrided tool inserts against GA show a significant decrease of the stick-slip behaviour.

42
Figure 5.47.- Coefficient of friction as a function of sliding distance for ZF (GA) coated steel
substrate against uncoated tool steel (left) and plasmanitrided tool steel (right) at different contact conditions. 5 repetitions.
The average coefficient of friction and standard deviation are calculated out of the measurements. Results are summarised in Figure 5.48.
Figure 5.48.- Coefficient of friction for different substrate coatings and tool surface conditions.
Task 3.4: Running tests with varying materials and thermo-mechanical parameters in the itmp-facility [UNI, ROV, ARC]
This task entails trials of a broader range of material combinations considering workpiece coating systems and especially tool steel grades with particular regard to tribological behavior. Aluminum-Silicon and GA coated heat treatable steel 22MnB5 is investigated on the hardware-simulator HS++ utilizing different types of tool steel grades; HTCS130, HTCS150 and HTCS170; provided by
Rovalma. Based on the obtained results both sheet coating systems are investigated against AlCrN
nitrided tool steel 1.2367uncoated tool steel 1.2367
Contact pressure: 3 MPa Contact pressure: 3 MPa
Contact pressure: 6 MPa Contact pressure: 6 MPa
0,42 0,43 0,44 0,45
0,330,27 0,29
0,19
0
0,1
0,2
0,3
0,4
0,5
0,6
0,7
3 MPa 6 MPa 3 MPa 6 MPa
Tool surface uncoated Tool surface plasmanitrided
co
eff
icie
nt
of
fric
tio
n µ
[-]
AlSi
GA

43
coated HTCS tool steel grade. The choices of parameters utilized during the trials in Task 3.4 are summarized in Table 5.9.
Table 5.9.- Test conditions for trials in task 3.4 considering different types of sheet coatings and tool material.
Test conditions Aluminium-Silicon coated 22MnB5
GA coated 22MnB5
Tool-steel HTCS130, HTCS150, HTCS170
HTCS130, HTCS150, HTCS170
Tool surface uncoated, 1 HTCS grade + AlCrN
uncoated, 1 HTCS grade + AlCrN
Furnace
temperature 930 °C 880 °C
Heating-time 360 sec 330 sec
Transfer time 6.5 sec 6.5 sec
Contact pressure 6 MPa 6 MPa
Drawing velocity 60 mm/sec 60 mm/sec
Figure 5.49 shows the average coefficient of friction and the standard deviation for different tool – workpiece combinations. Comparing the resulting coefficient of friction for different tools steels obtained for AlSi-coated sheet material only negligible differences are obtained between standard tool steel DIN 1.2367, HTCS130 and HTCS170 with µ in the range of 0.42 and 0.43. However, only
HTCS150 tool shows a clear increased coefficient of friction resulting in an average value of 0.46. For Zinc coated sheet metal a decreased average coefficient of friction is obtained with clear differences between the utilized tool steel grades. Furthermore, increased standard deviation and stick-slip behaviour is obtained during all trials, respectively, indicating an increased adhering of on the tool surface.
Figure 5.49.- Coefficient of friction for different substrate coatings and tool steel grades.
Based on the results obtained for the different steel grades it was decided to run further trials using HTCS150 tool inserts with an applied AlCrN coating on the tool surface. Before performing the trials the surface topology was analyzed through white light interferometry. In initial state differences regarding the tool surface roughness are observed showing a decreased roughness for
the AlCrN-coated tool inserts. Figure 5.50 summarizes the obtained COF using AlSi and GA coated sheets against uncoated and AlCrN coated HTCS150, and DIN 1.2367. The measurements for AlSi coated sheet material show a decreasing coefficient of friction for AlCrN coated HTCS150 tool steel. While for GA coated sheet material the coefficient of friction increases against AlCrN coated HTCS150. Furthermore, the slip-stick behaviour and thereby the standard deviation decreases significantly compared to uncoated HTCS150 tool inserts.
0,43 0,430,46
0,42
0,27
0,34 0,310,26
0
0,1
0,2
0,3
0,4
0,5
0,6
1.2367 HTCS130 HTCS150 HTCS170
Tool steel grade
co
eff
icie
nt
of
fric
tio
n µ
[-]
AlSi
GA

44
Figure 5.50.- Coefficient of friction for different sheet coatings, tool steel grades and tool surface conditions.
Further details can be found in Deliverable 3.1. The investigated tool inserts and selected sheet samples have been analysed in WP5.
2.3.4. WP4: Design and set up of the test facility
Task 4.1: Incorporation of the thermo-mechanical solicitations to the test cycle [LTU, UNI, ROV]
The main objective of this Task is to develop the simulation model of the High Temperature
Tribometer (HTTM). To incorporate the thermo-mechanical solicitations to the test cycle, inputs from other WPs are needed. In Figure 5.51 the relations between different WPs are apparent. The simulation model of the HTTM uses input from WP1 (reference tool), WP2 (characterization of heat
exchange) and WP3 (validation data from semi-industrial tool). Thermo-mechanical solicitations derived from simulation of the reference tool (forming pressure, relative velocities and temperatures) are used as input to the simulations. The calculated heat transfer coefficients for
different tool and strip material combinations are used to model the tool strip interface. The semi-industrial tool (ITMP-facility) gives input to calculate 3-dimensional field data for thermo-mechanical solicitations in a forming process, which can be used for validation of the HTTM-model. Ideally, the simulation model described in this task should yield as output parameters suitable to apply in real tests in the facility.
0.46
0.31
0.380.430.43
0.27
0.45
0.19
0
0.1
0.2
0.3
0.4
0.5
0.6
AlSi GA
co
eff
icie
nt
of
fric
tio
n µ
[-]
Sheet coating system
HTCS150 uncoated HTCS150 + AlCrN
1.2367 uncoated 1.2367 plasmanitrided

45
Figure 5.51.- Concept map showing relations between the simulation model of the HTTM and other WPs.
A finite element model of the test facility is developed. The FE-model is simplistic in order to
achieve short simulation times and only the very essential parts are modelled. The test strip (blank), basic tool parts and simplified holders are the only parts included. In Figure 5.52 the strip and a tool part are shown. One end of the test strip is fully constrained in all directions. The other end is constrained in x-y directions and free to move in z-direction. In the latter direction a force is applied on the strip to achieve a pre-stretch. Heating of the strip is not modelled as such; instead an initial temperature is pre-set as initial value in the simulation. One of the tool holders is
constrained in x-y direction and on the other a normal force is applied. After the load is applied the complete tool is moved in the sweeping direction with prescribed velocity. The actual tool is modelled as rigid material in some calculations and as elastic material in some. See Figure 5.53 for details. Two different tools were taken into account for testing in the HTTM (see Task 4.2). The tool chosen for simulations is T-shaped with a flat contact surface and chamfers on the leading and trailing edge. The main reason for the choice is the more even contact pressure and reduction of edge effects on the strip (tool is wider than strip).
Figure 5.52.- Overview and detail of FE-model for high temperature tribometer.

46
Figure 5.53.- Detail of sliding tool and holders. Boundary conditions and applied force direction is indicated. Tool parts are modelled as rigid material and as elastic material in different simulations.
Simulations have been performed with settings according to test-runs in the HTTM and also with settings translated from the reference tool chosen in WP1 (see below). Results are extracted from the strip and (mainly) from the tool model. Data extraction points on the tools are shown in Figure 5.54. In general, field results (temperature, velocities, pressure etc.) and local results are possible to extract from the model.
Results from the FE-model of the reference tool are in the form of relative velocities between tool parts and blank, pressure and temperature. Data is extracted from specific points, corresponding to
points chosen for replica casting in the tool, i.e. points on the tool exposed to relatively high wear (see WP5). The corresponding points in the FE-model are shown in Figure 5.55.
Figure 5.54.- Detail of sliding tool part with indicated sweeping direction and numbered nodal points chosen for extraction of results.
The relative velocity in specific points in the tool is challenging to extract from the simulation. In this case a special method is applied. SPH (spherical hydro dynamics) nodes are applied on the tool and blank, on top of the general thermo-mechanical finite elements. In each specific point on the tool the relative velocity (in relation to the point on the tool, which also can move in some cases) of the blank is measured within a radius of 5 mm from the actual point. Pressure and temperature
are also extracted from calculated nodal values at the chosen points.
Figure 5.55.- Areas for extraction of results from FE-simulation of reference tool.

47
Heat transfer is modelled between the heated strip and surroundings, by convection/radiation boundary conditions. Further, a pressure dependent heat transfer coefficient (htc) is modelled
between the strip and the surfaces of the T-shaped tools. The htc-formulation is derived in WP2
(see Deliverable 2.1) for several different tool steel and strip material combinations. Finally, a heat transfer coefficient (constant) is modelled between the T-shaped tools and rigid tool holders.
A comparison for validation purposes was made with data from Deliverable 3.2 (3-dimensional field data extracted from simulation of the ITMP-facility investigated in WP3). The effective stress levels in the model of the tools in the HTTM are compared with stress levels in the ITMP-facility during
forming. The important friction parameters used in the simulation model (coefficient of static and dynamic friction) was estimated based on discussions in the LTU group.
In Table 5.10 settings for a simulation with extracted data from point F above are shown. A constant velocity is chosen and the applied normal force is chosen to yield a contact pressure of approximately 10 to 15 MPa for a velocity of 0.25 m/s. The force is ramped to maximum value in 0.1 s and after 1 s simulation time the tool starts to slide along the test strip.
Table 5.10.- Settings for simulation of tribometer run. The settings correspond to data from point
F in the tool above.
Start temperature tool 300 K
Start temperature test strip 1053 K
Force tool 2520 N
Travel velocity tool 0,25 m/s
Static friction coefficient 0,4
Dynamic friction coefficient 0,4
Tension force specimen 200 N
The tool parts are modelled as elastic materials, taking into account the deformation. The strip is modelled with an elasto-plastic thermo-mechanical material model capable of calculating phase
changes in the material during cooling and heat transfer to the tools. In the model the assumed values for static friction and dynamic friction is 0.4. These values are adapted after more testing done (see Task 4.3). Selected results below are for pressure (according to chosen points shown in Figure 5.56).
Figure 5.56.- Contact pressure in selected point in tribometer tool. Node numbers correspond to Figure 23 (Pressure [Pa], Time [s]).
The expected pressure was 10 to 15 MPa and the results show a pressure range of approximately 7.5 to 25 MPa. All curves are filtered to make a reduction of the oscillations in the data. Part of the

48
oscillations of the contact forces are due to the contact implementation in the FEM software and should be possible to reduce with further optimization of the model.
In general, the FE-model gives results that can be compared with future tests in the tribometer using settings according to data from WP1 reference tool simulations.
Task 4.2: Design of the test facility [All]
The test facility, named high temperature tribometer (HTTM), is established at Tribolab, LTU, since Dec.’13 and constitutes Deliverable 4.1 A novel test facility that closely simulates the tool wear encountered during tool-workpiece interaction in hot stamping process.
An overview of HTTM developed is shown in Figure 5.57. The basic configuration of the high temperature tribometer involves a pair of tool steel pins which are loaded against the workpiece strip surfaces (one from each side) and subsequently slid along the length of the strip.
Figure 5.57.- Overview of new high temperature tribometer (HTTM).
Figure 5.58 shows the salient features of the high temperature tribometer. The tool steel specimens are mounted in a moving assembly driven by a ball screw for swiping them along the strip. The normal load on the tool steel specimens is applied through a pneumatic bellow. In order
to enable long sliding distances to induce accelerated wear on the tool steel specimens, an automated pick and place mechanism feeds in new strips from a tray containing 40 strips to the hydraulically actuated clamping jaws holding the strip and removes the worn strips and places them back in the tray. This allows a sliding distance of >30 m to be achieved without changing the tool specimens. Furthermore, it also allows post-test analysis of the strip surfaces so as to understand the changes in friction and wear with respect to a specific position on a given strip. There are two separate heating systems for the pin as well as the strip specimens. The pin
specimens are heated by means of resistive heaters up to a temperature of 700 °C. The heating of the strip is achieved via the Joule effect by passing a current through the strip up to a maximum temperature of 1000 °C. There is also the possibility of cooling/quenching the workpiece strip by means of pressurised air nozzles. The workpiece strip is pre-tensioned using a pneumatic cylinder to keep it straight during heating.

49
Figure 5.58.- Detailed overview of new high temperature tribometer and its features.
The main specifications of the high temperature tribometer are given in Table 5.11. The test procedure is schematically shown in Figure 5.59. The workpiece strips are loaded in the specimen tray and the tool steel pins are mounted in their respective holders. After setting the desired test parameters on the control software the test sequence is initiated. The workpiece strip is lifted into position and clamped by the hydraulic jaws. The pre-tension force is then applied and the heating
of the strip and/or tool steel pins is started. When the desired temperature is reached the normal load is applied and sliding is started. Upon completion of the sliding, the tool assembly is reversed back to its home position, the workpiece strip is removed and put back in the tray and the cycle restarts with a new workpiece strip being fed into position.
Table 5.11.- Technical specifications of the high temperature tribometer.
Parameter Range
Load 50 – 5000 N
Speed up to 0.25 m/s
Temperature (strip) up to 1000 °C
Temperature (tools) up to 700 °C
Quenching rate >35 °C/s
Strip length 900 – 1100 mm
Strip thickness 1 – 3 mm
Strip width 8 – 16 mm
Tool steel pins 10x10x20 mm (width x depth x height)
Figure 5.59.- Schematic of the test procedure.

50
Two different geometries of the tool steel specimens have been evaluated, Figure 5.60. One is a T-shaped specimen with dimension as shown in Figure 5.60b. This geometry provides reduced edge
effects since it is wider compared to the strip and also better possibilities to evaluate the influence
of surface topography of the tool steel specimen. The other geometry is a pin 10x10x20 mm (width x depth x height) provided with a double radius of 50 mm at one end. This geometry enables higher contact pressures and easy alignment of the tool steel specimen against the flat steel strip surface.
Figure 5.60.- a) Tool steel specimens for the high temperature tribometer, b) geometry and
dimensions of tool steel specimens for the high temperature tribometer.
The workpiece strip clamping jaws are provided with strain gauge force transducers in order to enable friction force measurements during sliding. In addition to this, the pre-tension force is also measured by a strain gauge force transducer. The temperature of each tool steel pin specimen is measured by means of type-k thermo couples positioned close to the sliding surface inserted from the back of each pin specimen. The temperature of the workpiece strip is measured by a movable type-k thermo couple and a pyrometer. Additional sensors include acoustic emission, contact
potential and on-line pin wear using LVDT sensor. The control and data acquisition software is Labview-based and enables control and monitoring of normal force, friction force, pre-tension force, sliding speed, specimen temperatures, acoustic emission, contact potential, strip current and on-line wear.
Continued refinements in the prototype wear test facility have been made throughout the project duration in the framework of Task 4.3.
Task 4.3: Set up of the test facility [LTU]
Initial set up of HTTM is described in Task 4.2. In present Task 4.3 continued refinements in the prototype wear test facility aimed at efficient testing through optimal control of test variables and improved accuracy in measurements have been made throughout the project duration, and some of them have been incorporated in the FE model of the facility.
The heating conditions for the heat treatment tests were selected based on the temperatures and soaking times recommended by steel supplier (ARC) and hot stamping industry (VW, GES). The
initial heating conditions are given in Figure 5.61.
(a) (b)

51
Figure 5.61.- Initial heating profiles for the Al-Si as well as Zn coated workpiece materials.
The heat treatments were carried out using the new test facility and the test specimens were sent to ARC for analysis of microstructure and composition. The results from the analysis of the Al-Si
coated UHSS are given in Figure 5.62a. The analysis concluded that the coating is fully alloyed but the Si-rich tau-1 phase is present on the coating surface which leads to a partially smoother surface than expected. This was, however, considered to be acceptable and the samples could be
used for the tribological tests. Figure 5.62b shows the results from the analysis of the Zn coated UHSS. The Zn coated sample was also found to be fully alloyed but taking into account the total soaking time of the Zn coated steel, limited galvanic protection was expected. The recommendation from ARC was to reduce the soaking time for the Zn coated UHSS to six minutes. The results from the second set of heat treatment experiments involving the Zn coated UHSS is shown in Figure 5.62c. The coating was considered to have a more representative galvanic
protection, similar to that found after heat treatment in a furnace, and could be used for the tribological tests.
Figure 5.62.- Cross-section micrographs of (a) the Al-Si coated UHSS sample and (b) Zn coated UHSS sample after heat treatment in the test facility. c) Zn coated UHSS sample after heat
treatment using shorter soaking time.
Two different geometries of tool steel specimens were initially evaluated as described in Task 4.2.
One was a T-shaped specimen with chamfered leading and trailing edges and the other geometry was a rectangular pin provided with a double radius at one end. The T-shaped geometry was found to give good results in terms of friction levels and the possibility to study the effect of surface topography on friction and wear. The chamfered edges on the T-shaped pin specimen was, however, found to initiate excessive material transfer and it was decided to evaluate a T-shaped
(a) (b) (c)

52
specimen with a 2 mm radius at the leading and trailing edges, Figure 5.63. This geometry improved the performance and was selected as the geometry for the tribological tests in WP6.
Figure 5.63.- Modified T-shaped tool steel specimen geometry.
The test facility is provided with a single colour pyrometer to measure the temperature of the workpiece strip specimen during the heating sequence as well as during sliding. This solution is working well but requires calibration for the temperature range that will be used. This is mainly in view of the fact the emissivity of the coated UHSS workpiece surface is changing with temperature. An evaluation of a two colour pyrometer was performed to assess its usefulness in measuring the
temperature of the workpiece strip. The results showed that the two colour pyrometer was able to accurately measure the temperature over a wide range (450 – 900 °C) without calibration. The results also revealed that the two pyrometers (single colour and two colours) gave very similar values (within ± 5 °C) at the temperature interval where the single colour pyrometer was calibrated.
The numerical model of the HTTM has been thoroughly revised. It has gone through several modification stages mainly related to the shape of the tool parts and the process of getting the
numerical contact formulation to work. The modification of the tool parts is in accordance with the development of the physical tools in the test facility. The T-shaped tool, covering more than the width of the heated strip, gives a more even surface contact pressure both in the numerical model and the physical HTTM. The final design is the T-shaped tool where the chamfers on the leading and trailing edge were replaced with a smoother radius.
The simulation procedure basically follows a real test in the HTTM. Some numerical considerations
must be made when the forces are applied on the tools and strips. The initial temperature of the
tools is 375 K and the strip initial temperature is 1120 K (in all simulations, to achieve a reasonable steady state tool temperature). The forces are applied as follows. First a tension force of 200 N is applied (ramped during 1 s) on the strip at the end that is free to move. This is a pre-tension that stabilizes the strip during the tool movement. Next, a tool force is applied (ramped during 1 s) perpendicular to the strip on one of the tools (the other tool and tool holder is fixed in position). Next, after the 2 seconds of force application, the tool holders start to move along the strip. The
velocity is ramped to final velocity during one second and kept constant for further two seconds. This yields a total sweeping time of the tools against the strip of 3 s.
Numerical results, in the form of segment surface pressure and nodal pressure values in the contact between T-shaped tools and strip, are extracted from the tool model according to Figure 5.64. The sweeping direction along the strip is indicated in the figure. Tool temperatures are extracted from nodes in approximately the same positions as the thermocouples in the physical HTTM. See Figure 5.65 where the sensor positions are shown (observe that the tool is split in half
in the transversal direction to show the nodal point).

53
Figure 5.64.- Chosen surface segments (upper) and nodal points (lower) for surface pressure calculations in the HTTM-model.
Figure 5.65.- Nodal positions (measurement nodes) for extraction of tool temperature values.
Positions correspond approximately to thermo-couple positions in physical HTTM.
An example of results is shown below. Table 5.12 with simulation parameters is followed by figures with extracted results. The set of results is large and in this summary only a subset is shown.
Results are extracted for input data corresponding to tool material HTCS150 and strip material Usibor AlSI.
Table 5.12.- Simulation parameter set example.
Start temperature tool 375 K
Start temperature test strip 1120 K
Force tool 1000 N
Travel velocity tool 0,1 m/s
Static friction coefficient 0,4
Dynamic friction coefficient 0,3
Tension force specimen 200 N
Material Strip Usibor
Material Tool HTCS 150

54
Figure 5.66.- Segment pressure on T-shaped tool (Pressure [Pa], Time [s]).
Figure 5.67.- Nodal pressure on T-shaped tool (Pressure [Pa], Time [s]).
Figure 5.68.- Normal (x-force) and friction (z-force) force in tool strip contact extracted from simulations (Force [N], Time [s]).

55
Comparisons of the temperature on the measurment nodes is done with reference to different tool material and strip material combinations. Figure 5.69 shows a diagram of the compared material
combinations.
Figure 5.69.- Calculated temperature at node 138335 for different tool and strip material
combinations.
The influence of thermal expansion/shrinkage of the strip material on contact pressure is investigated below. If the thermal shrinkage of the strip material is active the pressure distribution in the tool strip contact is affected (all results are calculated with active thermal shrinkage). Figure 5.70 shows pressure distribution on the tool surface for stationary tool but with transversal tool force active. The upper image is with active thermal shrinkage and the lower image is without
thermal shrinkage.
Figure 5.70.- Pressure distribution in stationary tool. Active strip material shrinkage in upper image and inactive in lower image (Pressure [Pa]).

56
Figure 5.71 shows pressure distribution in the same order but with the tool drawn (swept) along the strip and transversal force applied. The sweeping direction is upwards in the figure (leading
edge of the tool is the upwards). The pressure levels are of course different for active and non-
active thermal shrinkage. The shrinkage of the strip material during cooling in combination with tool movement gives a very noisy numerical solution with respect to calculated pressure distribution. However, it is vital to include in the simulations.
Figure 5.71.- Pressure distribution in moving tool. Active strip material shrinkage in upper
image and inactive in lower image (Pressure [Pa]).
In WP3 simulations of the ITMP-facility were performed (see Deliverables 3.1 and 3.2). The simulations were correlated with experimental results and from the simulations 3-dimensional field information were possible to extract (temperature distributions, stress distributions etc.). For validation purposes, calculated effective (von Mises) stress levels in the lower tool of the ITMP-
facility (simulation model) is compared with stress levels in the T-shaped tool (simulation model). Although the forming processes are not completely equal the stress levels should be comparable in order for the physical HTTM to replicate or simulate actual forming process conditions. Effective stress levels are extracted from a plane cut along the lower tool in the ITMP-model at two different times. The first time is when the blank is pushed to the bottom of the tool (maximum stress) and the second is just before forming force release after quenching in the tool. Figure 5.72 shows the
stress levels in the ITMP-facility (stress unit is [Pa]). The first point in time is the upper image. The levels on the edges is around 35-60 MPa in the upper image and 20-30 MPa in the lower image.
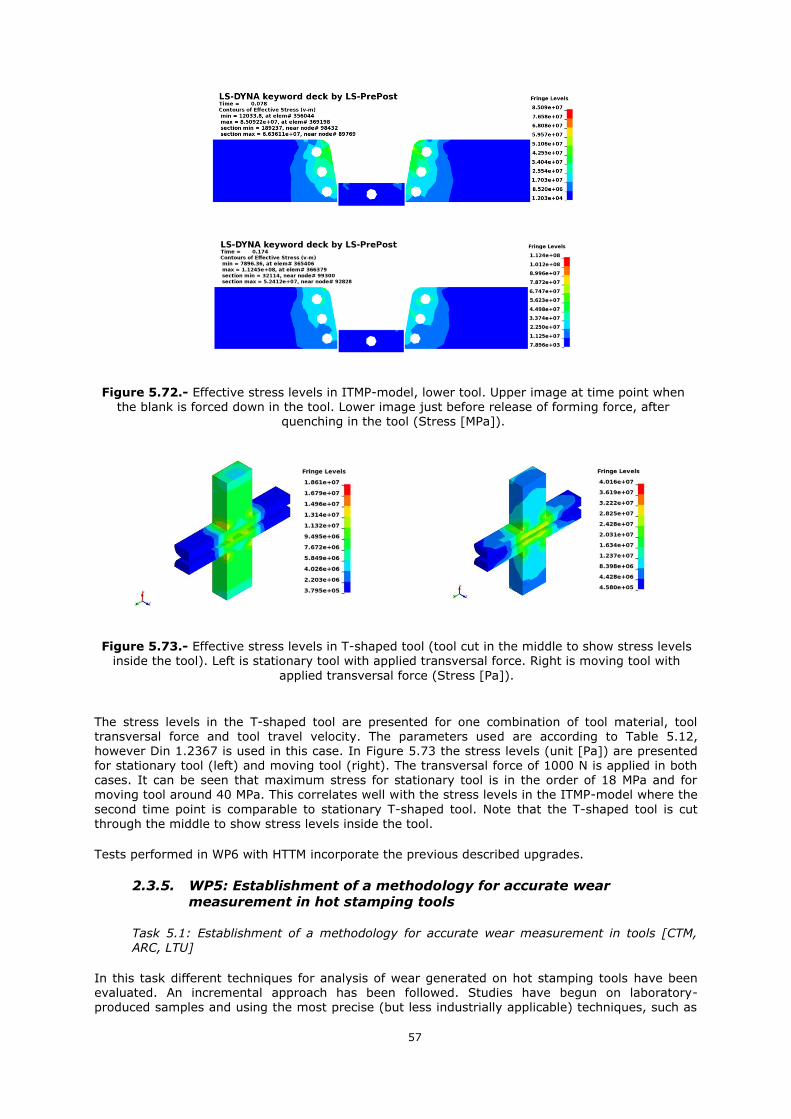
57
Figure 5.72.- Effective stress levels in ITMP-model, lower tool. Upper image at time point when the blank is forced down in the tool. Lower image just before release of forming force, after
quenching in the tool (Stress [MPa]).
Figure 5.73.- Effective stress levels in T-shaped tool (tool cut in the middle to show stress levels inside the tool). Left is stationary tool with applied transversal force. Right is moving tool with
applied transversal force (Stress [Pa]).
The stress levels in the T-shaped tool are presented for one combination of tool material, tool transversal force and tool travel velocity. The parameters used are according to Table 5.12, however Din 1.2367 is used in this case. In Figure 5.73 the stress levels (unit [Pa]) are presented for stationary tool (left) and moving tool (right). The transversal force of 1000 N is applied in both cases. It can be seen that maximum stress for stationary tool is in the order of 18 MPa and for moving tool around 40 MPa. This correlates well with the stress levels in the ITMP-model where the
second time point is comparable to stationary T-shaped tool. Note that the T-shaped tool is cut
through the middle to show stress levels inside the tool.
Tests performed in WP6 with HTTM incorporate the previous described upgrades.
2.3.5. WP5: Establishment of a methodology for accurate wear
measurement in hot stamping tools
Task 5.1: Establishment of a methodology for accurate wear measurement in tools [CTM, ARC, LTU]
In this task different techniques for analysis of wear generated on hot stamping tools have been evaluated. An incremental approach has been followed. Studies have begun on laboratory-produced samples and using the most precise (but less industrially applicable) techniques, such as

58
SEM and destructive analysis. With each step, tribosystem size and complexity has been increased, and testing has been centred in the most industrially applicable techniques. Figure 5.74 offers a
summary of the studied methodologies and systems; which are explained in more detail in
Deliverable 5.1 Review of wear measurement techniques and parameters to characterise tribological behaviour of hot metal stamping operations.
Figure 5.74.- Summary of the methodologies studied on different systems and scales.
Four basic techniques have been studied in this task: cross-sectional analysis, SEM, topography
analysis (in all its variants) and magnetic induction gauge measurement. The auxiliary technique of surface replication has also been evaluated. Additionally, residual stress measurements by means of X-Ray diffraction (XRD) have been evaluated during the last annuity.
Cross-sectional analysis: Even though the aim of the task was the study of non-destructive analysis techniques, some samples were subject to destructive analysis in order to validate results. Cross sectional analysis was performed only on samples purposely generated to be destroyed or with
relatively low production cost: laboratory samples and wear simulator inserts.
Figure 5.75.- Cross-section obtained from a Hardware Simulator insert. Contours of
adhered material and original surface (red contours) are detected using Analysis software, and thickness of adhered material measured.
SEM analysis: Scanning Electron Microscopy allows observing samples at a very high magnification and, through Backscattered Electron imaging (BSE), it is possible to obtain images with contrast related to the chemical composition. SEM equipment counts with built-in EDX systems, which can be used to semi-quantitatively characterise the chemical composition. SEM has been used mainly in
laboratory test samples and has been very important in the first characterization of the various
wear mechanisms appearing in hot stamping of boron steels (see Del 1.3), and in verifying simulative laboratory tests. The large chambered SEM at ROV has been used to inspect semi-industrial U-tooling from the itmp-facility, and confirm that appearing wear mechanisms correspond to the observed in other system scales. However, SEM analysis is not suitable for industrial tool inspection.
Topography analysis (optical profilometry): The main technique used for surface inspection was topography analysis. For these studies a Sensofar Plµ 2300 confocal microscope was used as
optical profilometer. This equipment allowed obtaining a precise 3D topography of the studied surfaces without having to contact the samples and even obtaining images from different fields and stitching them into a single topography of a larger area. Once acquired, topographies were

59
analysed in various manners. Feature-based analysis was used to study individual wear-generated features in order to identify the acting wear mechanisms, when few large features are generated
(for instance, layers of adhered material in hot stamping of Al-Si coated boron steel) and to obtain
semi-quantitative data about the wear features generated on a tool zone (such as thickness of adhesion lumps on a die radius). Roughness parameters can be also quantified.
Surface replication: This technique consists in the application on the surfaces to be inspected of a viscous silicone-based compound which cures in a few minutes into a high precision thermoset polymer replica of the surface topography. After curing, these replicas can be lifted off the surface
and stored for future analysis. Details down to 0.1 µm are reproduced. Surface replication has been used for a long time for analysis of microstructure [JAN95] and corrosion [FOR07] of components in service. Application to study of wear in industrial tools has been proposed by CTM in the last years [PUJ11, VIL12] and is still a developing technique. Figure 5.76 shows surface replication applied to a Hardware Simulator (UNI) insert.
Figure 5.76.- Obtaining of a replica from a Hardware Simulator insert (obtained from UNI tasks in
WP3). a) Steel insert covered with replica resin (green); after less than 5 minutes the replica is cured and can be lifted. b) and c): Overview of tool (b) and replica (c).
In TestTool project surface replication is used as an auxiliary technique for topography analysis. Surface replicas allow studying in the laboratory industrial tools which are too big or heavy for the analysis equipment (large samples will not fit the SEM chamber or the confocal microscope
platform), or components which cannot be ordinarily accessed (industrial tools cannot usually be retired from production for long enough to be studied due to scheduling and economic reasons). Additionally, surface replicas can be stored for future reference.
Magnetic induction gauge: A magnetic induction gauge is a portable device used to measure the thickness of a non-ferromagnetic layer on top of a ferromagnetic substrate. It works by generating a magnetic field from a probe that is put in contact with the material surface; the device uses this
field to calculate the distance between the probe tip and the ferromagnetic material (Figure 5.77). Its most usual application is measuring the thickness of paint or similar coatings on steel
components. However, its working principles suggest it could also be suitable for measuring adhesion on tools for hot stamping of coated boron steel, as long as transferred material is non-ferromagnetic and tools are made of tool steel or other ferromagnetic compositions.
a)
b) c)
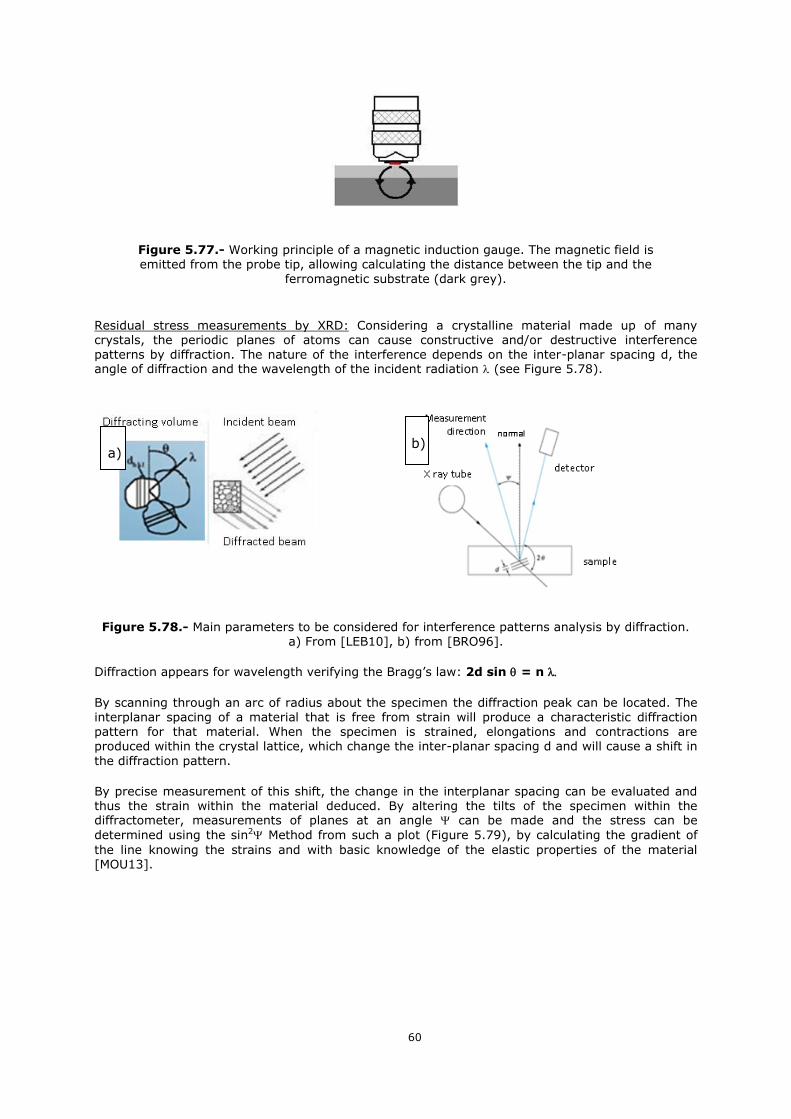
60
Figure 5.77.- Working principle of a magnetic induction gauge. The magnetic field is emitted from the probe tip, allowing calculating the distance between the tip and the
ferromagnetic substrate (dark grey).
Residual stress measurements by XRD: Considering a crystalline material made up of many crystals, the periodic planes of atoms can cause constructive and/or destructive interference
patterns by diffraction. The nature of the interference depends on the inter-planar spacing d, the angle of diffraction and the wavelength of the incident radiation (see Figure 5.78).
Figure 5.78.- Main parameters to be considered for interference patterns analysis by diffraction. a) From [LEB10], b) from [BRO96].
Diffraction appears for wavelength verifying the Bragg’s law: 2d sin = n
By scanning through an arc of radius about the specimen the diffraction peak can be located. The interplanar spacing of a material that is free from strain will produce a characteristic diffraction pattern for that material. When the specimen is strained, elongations and contractions are produced within the crystal lattice, which change the inter-planar spacing d and will cause a shift in
the diffraction pattern.
By precise measurement of this shift, the change in the interplanar spacing can be evaluated and thus the strain within the material deduced. By altering the tilts of the specimen within the diffractometer, measurements of planes at an angle can be made and the stress can be
determined using the sin2 Method from such a plot (Figure 5.79), by calculating the gradient of
the line knowing the strains and with basic knowledge of the elastic properties of the material [MOU13].
a) b)

61
Figure 5.79.- a) Diffraction peak and corresponding analysis, b) sin2 Method [LAM12, AFN99].
Equipment and parameters employed are shown in Figure 5.80.
Figure 5.80.- Set –X diffractometer from the ICA. Parameters : , = 0 , = 36,27 - 2= 156 °
- Time acq = 30 s/pt – 9 pt – Source : Chrome - I = 20A V = 30 V - Softwares SetXAcq© and StressDiff© Version 2.0 – 2004 - The diffraction analysis was performed in direction {2, 1, 1} of Fe
considering E=210GPa, = 0,29 and r = 1,39.
Task 5.2: Validation of the methodology for accurate wear measurement in semi-industrial and industrial processes [CTM, UNI, ARC, VW, GES, ROV]
Techniques developed in Task 5.1 are being used to measure wear phenomena from different tool inserts tested in two semi-industrial facilities, the itmp-facility in UNI (output from Task 3.3) and the deep drawing process simulator (DDPS), managed by ARC. These studies were further
described in Deliverable 5.1 Review of wear measurement techniques and parameters to characterise tribological behaviour of hot metal stamping operations.
Validation of the methodology with itmp-facility worn inserts: An example of the study of an insert used against AlSi coated boron steel deliberately subject to incomplete heat treatment in WP3 (390 s at 720 ºC) is summarised here. The coating had not attained the full sub-layer structure and increased material transfer appeared. This experiment was useful to evaluate the techniques in the presence of thick adhesion. Several zones were selected (Figure 5.81) and subject to direct
profilometry, surface replication, magnetic induction thickness gauge and cross-sectional analysis; examples are shown in Figure 5.82. Additionally, SEM was performed on the samples, to better characterize wear mechanisms appearing on the system.
a) b)

62
Figure 5.81.- Stereo microscopy overview of Hardware Simulator flat insert. Complex
surface topography related to adhesive wear mechanisms can be observed. Zones A to E, labelled on the image, were selected to perform the study.
Figure 5.82.- Analysis of zone A of UNI Hardware Simulator sample AlSi01: a) direct profilometry measurement; b) replica profilometry (vertically inverted for greater
clarity); c) cross-sectional analysis.
Table 5.13.- Result of different measurement techniques performed on the severely worn hardware simulator insert. Measured parameter: thickness of adhered material.
Zone Profilometry (direct)
Profilometry (replica)
Cross-sectional analysis
Thickness Gauge
A 161 µm 154 µm 154 ± 7 µm 132 ± 11 µm
A' 82.2 µm 79.6 µm 89 ± 9 µm 17 ± 10 µm
B 81.5 µm 80.9 µm 95 ± 3 µm 81 ± 5 µm
C 20.7 µm 22.4 µm 22 ± 2 µm 25 ± 3 µm
D 9.37 µm 8.14 µm - 11 ± 2 µm
E 155 µm 151 µm 150 ± 8 µm 73 ± 10 µm
F 7.71 µm 7.83 µm 8.7 ± 3 µm 11 ± 5 µm
The AlSi-worn flat insert shows good correspondence between all measurement techniques (Table 5.13). Direct and indirect (replica-based) topography measurements show very similar values, also equivalent to cross-sectional measurements. Recorded differences can be attributed to the difficulty of selecting the exact same zone to be measured. This good precision is observed for the whole range of morphologies and thickness studied. Thickness gauge measurements offered are
overall correct, but they reflect several limitations. The probe is calibrated to a certain range of thicknesses, and measurements far from this range are increasingly imprecise: this explains the
A' A
A
B
C
D
F
E
a) b)
c)

63
larger deviations observed for the thickest features. Also, complex morphologies (E) and small areas (A') are difficult to measure, as the probe has a somewhat large size (2 mm diameter).
Wear measurement techniques have been also used to validate inserts slid against the strip subjected to the standard heat treatment (Usibor1500P ®AlSi, 390 s at 900 ºC) resulting in much reduced material transfer, and slid against USIBOR® 1500P GA (Zn-based adhesion). See Del. 5.1 and Annual Report 2013 for further details. It was proved that the presented techniques could be used to evaluate adhesion wear mechanism distributed over a surface.
Validation of the methodology with Deep Drawing Process Simulator (DDPS) worn inserts: In DDPS
facility, a continuous high temperature wear test specific for hot stamping is performed by inserting a resistance heating module and a cooled die set. Pre-alloyed steel strips slide over a die radius to simulate stamping conditions. A scheme of the DDPS facility is shown in Figure 5.83.
Figure 5.83.- Diagram of the Deep Drawing Process Simulator (DDPS) and detail of the hot strip
sliding on the die radius.
3 tool steel materials have been used to make tool inserts. The main features are listed in Table 5.14.
Table 5.14.- Die insert characteristics of tested materials.
Tool steel material Roughness Surface treatment
DIN 1.2367 Ra < 0.3 µm, Rz < 1.5 µm
DIN 1.2367 nitrided Ra < 0.3 µm, Rz < 1.5 µm Diffusion layer 146 µm
HTCS® 150 + AlCrN Ra < 0.3 µm, Rz < 1.5 µm Coating thickness 4 µm
Because of the cylindrical shape of the die radius, it is not straightforward to quantify wear loss and material transfer. A methodology based on profilometric measurements was defined to assess the
relative amount of adhesion and abrasion on the die radius surface (see Figure 5.84). On each sub-angular section, three profiles were measured along the longitudinal direction of the die radius, using a white-light confocal microscope.

64
Figure 5.84.- Definition of measured profiles on die radius.
Figure 5.85 defines wear criteria to distinguish abrasive and adhesive wear on a straightened
profile [BOH12]. The reference line is the mean plane of the unworn zone and Lp is the length of the worn part on the die radius. The following parameters are defined:
- Transfer wear area Stt: total area in green, above the reference line
- Material loss area Stu: total area in red, below the reference line
- Transfer regularity: Tr = (Stt·Htmax)/Lp
Figure 5.85.- Wear criteria definition.
Figure 5.86.- Transfer wear, material loss and transfer regularity (homogeneity) after 1000 and 2000 cycles for DIN 1.2367, DIN 1.2367 nitrided and HTCS® 150 + AlCrN tool inserts.
Profiles of worn radii were obtained after 1000 and 2000 cycles tests. Results are shown in Figure 5.86. Highest wear resistance is shown by nitrided DIN 1.2367 which presents also the highest transfer homogeneity, whereas the best resistance against material transfer or adhesion is found for the DIN1.2367 grade. Finally, the best compromise between transfer and abrasion resistance is
obtained for the HTCS®150+PVD tool. This classification is observable since the first 1000 cycles.

65
Residual stresses of unworn and worn inserts were measured by means of XRD. Tests were performed with a Set-X diffractometer on different inserts tested and non-tested with the DDPS
wear facility of ICA Albi (managed by ARC), see Figure 5.87. Measured residual stresses are shown
in Figure 5.88. The shear stresses (sxz, syz) (± 20 MPa) were considered negligible compared with longitudinal stress sxx and transverse stress syy.
Decrease in the residual stresses in compression according to the number of cycles
DIN 1.2367 (A) : from -450 to -400 MPa
Nitrided DIN1.2367 (B) : from -870 to -500 MPa
Causes of this decrease in the residual stresses on the nitrided sample
Hyp. 1: Thermal load effect
Hyp. 2: Mechanical effect
Hyp. 3: difference of initial stresses sxx between samples B1 and B2
DIN 1.2367 Nitrided DIN 1.2367
Sample referenced A2 :
0 cycle
Sample referenced A3 : 2000 cycles
Sample referenced B1 :
0 cycle
Sample referenced B2 : 2000 cycles
Figure 5.87.- Analysed samples.
Figure 5.88.- Residual stresses measured by XRD on DDPS inserts in DIN 1.2367 with and without nitriding treatment – Influence of the nitriding treatment.
For the naked sample (A): The relative reduction in the residual stresses of compression between
the initial state and 2000 cycles is of the order of -150Mpa, however the sample presents considerable plastic distortions (Figure 5.89a). For the nitrided sample (B): The advantage of the
nitriding treatment, which creates a compression on the surface of the sample seems cancelled out because the values following x measured on B1 are of the order of -350MPa, which are close to the initial values measured on the naked sample A1. There is therefore a relative reduction in the residual stresses of compression depending on the number of sliding cycles of about -550MPa. This reduction in residual stresses of compression due to the nitriding treatment seems to have been
obtained without the microstructure being plasticized (Figure 5.89b).
The feasibility of this method of measurements by XRD of the residual stresses on small naked and nitrided DIN 1.2367 worn samples with reference state was validated: this method can be usable on tools in production. Nevertheless, the trials on large inserts of the industrial tool were not carried out because there was not a second set of tools to replace a segment in VW and the risk of interrupting the serial production was too high and could not be taken.
n, z
xx
xx
yy
n, zBlank sliding y
x
n, z
xx
xx
yy
n, zBlank sliding y
x

66
Figure 5.89.- Cross section of 1.2367 inserts after 2000 cycles test on DDPS. a) non-nitrided and b) nitrided.
Industrial tools inspection: Industrial tools inspection by means of replication technique has been described in detail in Deliverables 5.1 Review of wear measurement techniques and parameters to characterise tribological behaviour of hot metal stamping operations and 6.2 Tool life predictions based on experimental wear results for industrial hot stamping tools. A summary of main results
obtained in hot stamping of AlSi coated blanks and uncoated blanks is described below.
Hot stamping of USIBOR AlSi: Frame dash panel reference tool from VW has been periodically inspected by means of replication technique in order to evaluate the main wear mechanisms present. Replica technique is a suitable methodology to inspect industrial tools because these cannot be retired from production for long enough to be studied due to scheduling and economic reasons, and obviously samples cannot be cut. Six critical regions have been selected for their inspection, taking into account results obtained in FE simulation of reference tool in WP1and VW
experience. These critical zones include radii and flat zones which have high sliding velocities during workpiece contact. Figure 5.90 shows the critical zones on punch (Fig. 5.90a in pressure distribution obtained in FE simulations and Fig. 5.90b in industrial tool). The same critical zones
(mirror image) have been selected for die.
Figure 5.90.- Critical zones of reference tool (punch) inspected by means of replica technique, a) identified in pressure distribution map of FE simulation and b) in the industrial tool (replicas
are black, some additional areas have been inspected).
a) b)

67
Figure 5.91.- Parts produced vs production week. Red points indicate replica obtaining (after
the corresponding week).
Different inspections have been carried out along the project. Figure 5.91 represents parts produced and when replicas from industrial tool have been obtained. Replicas were always acquired before maintenance tasks.
Figure 5.92 shows a detailed lens image from a worn tool surface replica, where several features can be noticed: a flat, regular surface (1), large, rough craters on this surface (2), a more irregular surface which is lower in height than the first (3), a series of high lumps (4) and,
finally, metallic-looking particles entrapped on the replica (5). It must be noticed that not all of the replicas show such an extensive degree of wear; this particular image was chosen as an example of the features which can be found on the tool surface.
Figure 5.92.- 10x image of a replica from a severely worn surface.
By observing all of these features together, and with the knowledge that the coating from the Al/Si
coated boron steel the studied tools work with is prone to adhering on tool surfaces, it is possible
to comprehend the mechanisms giving rise to this surface topography. The difference in height between surfaces (1) and (3) could only be explained by a transfer of material from the workpiece to the tool in surface 1 or a loss of material in surface 3. The craters in surface 1 show that the material in this zone breaks in the form of large, thick scales, thus indicating that surface 1 does not consist in tool steel, but in thick a buildup of adhered material, formed on top of the original
tool surface (3). This is further confirmed by the entrapped particles (5), which can be identified as the scales of material which break off leaving the aforementioned craters (3), and by the appearance of lumps (4) in the lower surface, another consequence of this adhesion mechanism.
Therefore, it can be deduced that wear mechanisms acting on the studied set of tools are adhesive wear-based, and that the different features observed in the tool surface correspond to different solicitations or geometries of the tool.
5 2 1
3
4

68
The reference tool showed quite homogeneous material transfer. Flat horizontal surfaces showed discontinuous adhesion, approximately 3-5 µm thick. Tool flanks showed material consistent with a
combination of adhesion and compaction of dust, and a thickness in the 10-15 µm range. Around
the radii, material accumulated in features around 30 µm thick, even though measurements of up to 100 µm were recorded. Main adhesive wear mechanisms observed and their distribution on industrial tool are simplified in Figure 5.93.
Figure 5.93.- Main adhesive wear mechanisms observed and their distribution on industrial tool.
Hot stamping of uncoated UHSS: The chosen tools correspond to a set of B-Pillar hot stamping dies from GES. The work material is 1.4 mm uncoated 22MnB5 and the tool material QRO 90 Supreme, without surface treatment or coating. FEM simulation (provided by GES) was used to determine the tool regions most critical in terms of wear. A drawing of the tool with the critical points
identified can be seen in Figure 5.94figure. Regions 1, 2 and 3 are located in the lower die, while regions 4 and 5 are located on the upper die. Regions 3 and 4 are two corresponding zones in the upper and lower die. Region 5 is not particularly critical, but it was deemed interesting because of its geometry, among other things.
Figure 5.94.- Wear-critical areas spotted in FEM simulation of the forming process.
Replicas from each of the five critical spots were periodically taken, in order to study the evolution of wear mechanisms. A total of four sets of replicas were obtained during the investigation. The sets and the corresponding number of production cycles are summarized in Table 5.15.

69
Table 5.15.- Index of replica sets and corresponding cycle numbers.
Replica set no. S01 S02 S03 S04
Cycles 2092 2194 2700 2500
Total of cycles 2092 4286 6986 9486
Figure 5.95 shows the typical aspect of the worn tool surface. The milling marks corresponding to the original tool surface can still be recognised (1). However, in some zones, these marks are starting to fade or can no longer be recognised (2); these areas can therefore be identified as worn. Finally, some clusters of irregular lumps can be spotted on certain areas of the tool surface
(3).
Figure 5.95.- 10x lens image from a tool surface replica.
The main tool wear mechanisms identified on this production process were abrasive wear and
galling.
Replication technique allowed laboratory topography analysis of the tool surfaces without retiring the dies from production. Results obtained include the characterisation of wear mechanisms and their evolution in time (not shown).
Task 5.3: Application of the methodology for accurate wear measurement in tools from test facility [CTM, LTU]
This task uses the knowledge and results obtained in Tasks 5.1 and 5.2. It uses inserts generated
during WP4 and WP6 to measure wear in tools from the test facility (HTTM). Studies have been performed on inserts subject to different processes, as summarized in Table 5.16. The aim of this is to ensure that the techniques used are able to detect differences in performance, and somehow reflect the results that have been qualitatively obtained. Detailed description of techniques and results obtained can be found in Deliverable 5.2 Specification of wear measurement technology. A summary is reported below.
1
2
3

70
Table 5.16.- Identification of inserts tested in HTTM.
Insert id Material Load [N] vs [m/s]
AlSi1 1.2367+Nit 500 0,1
AlSi2 1.2367+Nit 500 0,1
AlSi3 1.2367+Nit 500 0,25
AlSi4 1.2367+Nit 500 0,25
AlSi5 1.2367+Nit 1000 0,1
AlSi6 1.2367+Nit 1000 0,1
GA1 1.2367+Nit 500 0,1
GA2 1.2367+Nit 500 0,1
GA3 1.2367+Nit 500 0,25
GA4 1.2367+Nit 500 0,25
GA5 1.2367+Nit 1000 0,1
GA6 1.2367+Nit 1000 0,1
Measurement of affected area: The first approach was to measure the area covered in adhered material, by means of Stereo Microscopy. After acquiring a 10x overview of the whole worn
surface, the area covered by material transfer was delimited and measured using image analysis software. Figure 5.96 shows an example of a worn and Figure 5.97 shows obtained quantitative results.
Figure 5.96.- Stereo microscopy overview of insert AlSi01.
Figure 5.97.- Results corresponding to stereo microscopy measurements.
This technique is sensitive to the amount of area covered in material transfer, but not the thickness of material accumulated. Differences were spotted for AlSi-slid samples. However, GA-slid samples showed mostly equal results: all samples were completely covered in Zn-based transfer.
Cross-sectional measurement : Cross-sectional insert samples parallel to the sliding direction were cut and metallographically prepared, in order to be inspected by OM and SEM/BSE imaging. This is a destructive technique. The aim is to evaluate the damage mechanism and, if possible, measure
the amount of transferred material. Two samples were prepared in cross-section, one slid against
AlSi-coated strip and the second one slid against GA strip. Two sample images are provided below.

71
a) b)
Figure 5.98.- SEM/BSE images from the Cross-sectional analysis of the samples slid against: a) AlSi-coated USIBOR; b) USIBOR GA.
This was not deemed a suitable technique for test facility insert analysis. Due to the morphology and thickness of adhered material, it was not possible to obtain quantitative measurements for a while insert length. Moreover, one single profile is analysed with each cross section, so multiple specimens need to be prepared if representative results are expected. However, it was useful to
observe that both AlSi and GA inserts show material transfer under the level of the original surface, in the areas where abrasion grooves appear. This means that measurements of adhesion over the surface level will not completely account for the amount of material transfer. Cross-sectional analysis of the samples was useful to verify that the generated wear mechanisms correspond to those expected in the industrial process, and would be useful to identify said mechanisms if the rig is used to investigate the effect of different parameters (e.g. strip or tool material, temperature,
load...).
Optical profilometry: A Sensofar Plµ2300 confocal microscope was used to perform topography measurements on the inserts. Two 19x2 image fields were acquired at x100 magnification, and reconstructed into 19.6x1.82 mm2 strips (Figure 5.99a). These strips were acquired at 0.5 mm
distance from the border of the insert flat sections, in order to avoid possible border effects (thick, inhomogeneous adhesion on the insert border, generated by mechanical interaction). Afterwards, profiles perpendicular to the sliding direction (parallel to the long axis of the measured fields) were
extracted using topography analysis software (more than 750 profiles), and the mean profile of those was calculated. Finally, the same software was used to calculate the area under the mean profile obtained, taking as a reference the non-worn surface captured in the strips. This area is an estimation of the volume of transferred material (Figure 5.99c). The average from each pair of inserts tested in the same conditions was calculated, resulting in the plot shown in Figure 5.100.
Figure 5.99.- a) Schematic showing the areas measured by means of optical topography; b) Mean height profile along the horizontal axis and area of adhered material, as calculated from the mean
height profile.
a) b)

72
Figure 5.100.- Material transfer as measured through optical profilometry.
This process was fast and simple, and resulted in a large amount of information. Not only the volume of material was obtained, but also the morphology of material transfer was observed in the resulting three dimensional images. Additionally, measurements were demonstrated in Deliverable
5.1 to be precise and robust in features with the thickness and morphology of material transfer. Direct optical profilometry offers a large amount of information with a relatively simple and speedy procedure. Results obtained are quantitative. Additionally, by investing more time in the analysis of the inserts (or by using more advanced equipment) it is feasible to capture the entire wear surface in a single topography, resulting in full topographical information using one single analysis.
The main limitation of this technique is measurement of material transfer under the level of the
original surface- this mechanism was observed in the cross-sectional analysis, resulting in material accumulating inside cavities formed by insert abrasion or material loss.
Surface replication: Replicas were obtained from two of the inserts; AlSi01 and GA01. Profiles were
extracted analogously to optical profilometry measurement of inserts. Results obtained were very similar to results obtained by direct profilometry, with the differences to be expected due to the area measured not being exactly the same. However, it must be pointed out that surface replication is worse than direct profilometry in this case. Replica casting and extraction involves an
additional step of sample processing, and handling and analysis of the replicas is more complicated than direct analysis of the inserts, which are more rigid and regular-shaped. The main advantages of the replicas are negated here, as the inserts are small laboratory easily manipulated and measured.
Combined adhesion index: After the various techniques had been applied, it became clear that none of the studied techniques completely characterized adhesion. The two best options were considered to be:
Stereo microscopy: delivering information about the amount of area affected, but not about the thickness of transferred material
Optical profilometry: delivering precise measurements, but unable to measure very thin layers or material adhered under the surface
Additionally, both methods provided information about the wear morphology. It was decided to combine these two methods in a single index, taking into account the measured thickness of
transfer and area coverage. After some trials, the index was defined as:
w
mtp
WWWW
AAtAWI
Where:

73
WI: Wear index
AW: Worn area, in [mm2], measured as described in measurement of affected area.
tw: Thickness of wear, in [µm]
Amtp: Area of the Mean Transversal Profile, calculated as described in optical profilometry.
WW: Width of the worn area, calculated from either the transversal profile or the stereo miscoscopy image (in this study, this is equal to 15 mm).
The obtained index would roughly correspond to an estimation of the total volume of adhered material (area of adhered material * thickness of adhered material). However, given that it is an
abstract estimation, it has been considered better to present it as a dimensionless index, instead of using the volume units that would theoretically result. One advantage of this methodology is that it will allow using the same methodology for systems where the main wear mechanism is not material transfer (e.g. uncoated boron steel). The only modification is that the area of the mean transversal profile will be a negative area, resulting in the WI having a negative value.
Figure 5.101.- Wear in the different studied inserts measured using the defined Wear Index, in arbitrary units.
2.3.6. WP6: Wear measurement in tools from test facility
Task 6.1: Validation of the test facility for accurately measuring wear in tools for hot stamping applications [LTU, CTM, ROV, ARC, VW, GES]
In order to validate the newly developed test facility (HTTM) for accurately measuring wear in tools for hot stamping applications, it is important to reproduce the mechanisms that govern their wear as well as the surface damage. Another important aspect to consider in laboratory experimentation of press hardening is the interaction between a fresh sheet surface and a repeatedly utilised tool,
which is difficult to achieve in conventional tribological testing equipment. Therefore, the HTTM test facility was designed in WP4 to determine high temperature friction and wear characteristics of
tool-workpiece material pairs under press hardening process conditions. Wear measurements in tools from the test facility have been carried out according to the most suitable wear measurement methodology developed in WP 5. The thermo-mechanical testing parameters (velocities and pressures) were extracted from numerical simulations of the industrial reference tool (WP1). Detailed description of tests can be found in Deliverable 6.1 Tool wear results obtained from
simulative accelerated wear experiments by using the newly developed test facility on different (selected) combinations of tool-workpiece materials (both with and without coatings) using various thermo-mechanical parameters.
Figure 5.102 shows a schematic representation of the tool-workpiece contact in the developed test facility. The tangential forces occurring during sliding are measured by two strain gauge force transducers connected to the hydraulic clamping jaws of the workpiece strip. The applied normal

74
force is also measured by a strain gauge force transducer. All these strain gauge force transducers enable in obtaining the coefficient of friction by using the following equation:
N
PF
2F
FFμ
where FF is the friction force, FP is the pretension force and FN is the applied normal force.
Figure 5.102.- Schematic showing specimen dimensions and test configuration of the newly
developed test facility employed in simulative, accelerated wear experiments.
The workpiece material was obtained as unhardened, Al-Si precoated sheet strips with a thickness of 1.5 mm, a width of 15 mm and a length of 1000 mm, as shown in Figure 5.102. The initial microstructure consisted of ferrite-pearlite and these 22MnB5 steel sheet strips were used in their as-delivered surface condition. The tool steel specimens were T-shaped pins. Pin specimens were accepted for experimentation when their average surface roughness Ra was between 0.2 and 0.3 µm. Further, a surface lay (texture) perpendicular to the sliding direction was obtained after
grinding, which was a in accordance with the decision of the project consortium. A total of five sheet strips, which corresponds to a sliding distance of 2.5 m, were put in the sheet specimen tray for testing. The test parameters are summarised in Table 5.17. Each combination of test parameters given was run twice.
Table 5.17.- Test parameters used in the newly developed test facility; *values taken from numerical simulations of the industrial tool.
Parameter Value
F [N] 500*, 1000*
p [MPa] 5.5, 11.1
v [m/s] 0.1*, 0.25*
T (strip) [°C] 825
T (tools) [°C] 25
s [m] 0.5
Figure 5.103 shows the coefficient of friction as a function of time for the plasma nitrided reference material 1.2367 sliding against Al-Si coated 22MnB5 steel under a load of 500 N at a velocity of
0.1 m/s (a), under a load of 500 N at a velocity of 0.25 m/s (b) and under a load of 1000 N at a
velocity of 0.1 m/s (c). It can be observed that the coefficient of friction is independent of the applied normal load or the sliding velocity when the contact conditions do not change. Some fluctuations at the end of the sliding process at a load of 500 N and at a speed of 0.25 m/s and at a load of 1000 N and at a speed of 0.1 m/s indicate changes in the friction behaviour. As friction is defined as the force opposing sliding motion between two surfaces in contact, it is an energy dissipating process. Furthermore, sliding friction has two components i.e., an adhesive and a
ploughing one. One explanation of the observed increase in the coefficient of friction is that adhesive friction originates from the formation of atomic bonds between the surfaces. Thereby, a higher chemical affinity between the materials leads to an increase in friction. Another is the ploughing component which can occur when one of the surfaces is harder than the other and/or hard particles entrapped between the two surfaces plough through one or both the surfaces. In all likelihood, both phenomena are occurring as friction and wear are highly dynamic and stochastic

75
processes. This means that they can be initiated by one mechanism and proceed with another one. The dramatic increase in the friction coefficient for the fifth strip at a load of 1000 N and a velocity
of 0.1 m/s can be traced back to its position on the workpiece strip specimen as illustrated in
Figure 5.103d. The initially large areal contact is reduced to a smaller, concentrated area through material transfer of the coating onto the tool surface resulting in increased ploughing action.
Figure 5.103.- Coefficient of friction as a function of contacting time for plasma nitrided 1.2367 sliding against Al-Si coated 22MnB5 under (a) a load of 500 N at 0.1 m/s, (b) a load of 500 N at
0.25 m/s and (c) a load of 1000 N at 0.1 m/s. (d) Photograph of the ploughing groove occurring on the Al-Si coated workpiece surface.
Cross-sectional analysis of the tool samples revealed that wear mechanisms corresponded to the ones observed in industrial tools. The most important mechanism was material transfer from the coating to the tool inserts (Figure 5.104 a). The microstructure of transferred material showed
mostly an appearance consistent with the accumulation and compaction of particles broken off from the coating, as described in Deliverable 1.3. This was particularly visible in the surface near the leading edge of the inserts, with adhered material reaching thickness over 10 µm. The middle of the inserts showed slightly different wear mechanisms. In this case (Figure 5.104 b), a thin layer of smeared material less than 2 µm thick was observed to coat the surface. This is also consistent with mechanisms described in Deliverable 3.1.
(a) (b)
(c) (d)

76
a) b)
Figure 5.104.- AlSi-based material transfer observed on the tool inserts after testing. a) Thick accumulation of material. b) Thin smeared layer.
It can be concluded that wear mechanisms generated reproduce those observed in the industrial application.
Task 6.2: Wear measurement in tools from test facility with varying materials and thermo-mechanical parameters [LTU, CTM, ROV, ARC]
Simulative, accelerated wear experiments on different (selected) combinations of tool-workpiece
materials (with and without coatings) using various thermo-mechanical parameters have been conducted in the framework of this Task, see Table 5.18.
Table 5.18.- Combinations of tool steel- work piece materials and test parameters tested.
Tool steel material Strip coating
Load [N] Velocity [m/s]
1,2367+Nit GA 500 0,1
1,2367+Nit GA 500 0,25
1,2367+Nit GA 1000 0,1
HTCS130 AlSi 500 0,1
HTCS130 AlSi 500 0,25
HTCS130 AlSi 1000 0,1
HTCS130 GA 500 0,1
HTCS130 GA 500 0,25
HTCS130 GA 1000 0,1
HTCS150 AlSi 500 0,1
HTCS150 AlSi 500 0,25
HTCS150 AlSi 1000 0,1
HTCS150 GA 500 0,1
HTCS150 GA 500 0,25
HTCS150 GA 1000 0,1
HTCS170 AlSi 500 0,1
HTCS170 AlSi 500 0,25
HTCS170 AlSi 1000 0,1

77
Tool steel material Strip
coating
Load [N] Velocity
[m/s]
HTCS170 GA 500 0,1
HTCS170 GA 500 0,25
HTCS170 GA 1000 0,1
An example of the coefficient of friction as a function of time for the plasma nitrided reference
material 1.2367 sliding against Zn coated 22MnB5 is shown below. Further results with other material combinations can be found in Del. 6.1. In Figures 5.105 (a) and (b), it can be seen that the coefficient of friction of the plasma nitrided reference tool steel 1.2367 increases with each successively tested workpiece strip. A possible explanation for this behaviour is that a transfer layer is formed on the tool steel surface and subsequent sliding results in increased adhesion and friction. On the contrary, it can be observed in Figure 5 (c) that the plasma nitrided reference tool steel 1.2367 exhibits a lower and more stable steady state coefficient of friction at higher loads.
One explanation is that the tangential (friction) force reaches a steady state level and becomes almost constant. This means that when the normal load increases, the coefficient of friction will decrease.
Figure 5.105.- Coefficient of friction as a function of contacting time for plasma nitrided 1.2367
sliding against Zn coated 22MnB5 under (a) a load of 500 N at 0.1 m/s, (b) a load of 500 N at
0.25 m/s and (c) a load of 1000 N at 0.1 m/s.
Quantitative measurements of wear on different combinations of material, strip and sliding parameters are studied in Deliverables 6.1 and 6.2. An example, corresponding to different materials sliding against AlSi-coated steel sheet is shown in Figure 5.106.
(a) (b)
(c)

78
Figure 5.106.- Wear measured in HTTM inserts sliding against AlSi coated material. Reference condition (Wear=100) corresponds to 1.2367Nitrided sliding against AlSi-coated 22MnB5 at
0.1m/s, 500N load.
Task 6.3: Conversion of the test cycle time to actual tool lifetime [LTU, CTM, UNI]
This Task summarises the knowledge gained throughout TestTool project (earlier work packages) that culminates in a synthesis in Deliverable 6.2 Tool life predictions based on experimental
wear results for industrial hot stamping tools. The main objective is to assess the feasibility of predicting hot stamping tool lifetime. The applicability of wear results obtained from simulative experiments using the test facility developed in WP4, with help of the methodology for accurate wear measurements in hot stamping tools established in WP5, as input to forming simulations will be assessed. The conversion of the test cycle time to actual tool lifetime should allow predicting the performance of tools for industrial applications. The aim is to enable the assessment of the manufacturing process from a technical as well as an economical point of view. A reliable prediction
enables sustainable manufacturing of more complex shaped components with increased
functionality to meet the requirements of the automotive industry in the future.
In press hardening, an optimum and stable level of friction is necessary to achieve the desired deformation of the workpiece. However, the relative motion between the austenitised steel sheet and the forming tools leads to wear during forming. Hence, the contact conditions during the forming step are altered due to the occurrence of wear. Consequently, the friction between the
workpiece and the forming tools will get affected by these changes in contact conditions during subsequent forming. If wear reaches a critical level, it often results in failure, which has considerable economic significance [STU99]. The severe contact conditions encountered in press hardening occur due to a combination of repetitive mechanical loading, cyclic thermal loading and relative motion between forming tools and workpiece. The elevated temperatures required for the hot forming process also introduce several new challenges. When the forming tools get in contact with the austenitised workpiece, thermal shock loading of the tools occurs through heat transfer
from the hot sheet to the tools. As a result of the increased temperature as well as the interaction with the workpiece surface and generated wear debris, tribochemical layers form on the surfaces of the tools. Oxidation and reactions between oxide layers and coatings on blanks or tools can cause
material loss in the form of wear and/or material transfer onto the tool surfaces. These phenomena have a vital influence on the manufacturing process as they affect the dimensional accuracy and surface quality of produced components [2]. Adhesive wear is generally the dominant wear process in press hardening, but abrasive wear, thermal fatigue and corrosive (tribochemical) wear also play
an important role and reduce the lifetime of the forming tools. It is therefore desirable to enhance the durability of the tools and to extend their service life. This can be achieved by simulative testing of new tool materials with or without surface engineering. The obtained wear data can be utilised for tool wear prediction through numerical forming simulations. In metal forming processes, the wear model developed by Archard [ARC53] is generally employed for the prediction of wear.

79
Experiments in the newly developed test facility were carried out according to the methodology described in detail in Deliverable 6.1. From initial and final weights, an average specific wear rate
was calculated for each testing condition, each workpiece strip material and each tool steel grade
according to Archard’ s wear law as follows:
sρF
)m(mK
N
fi
where mi is the average, initial mass in grams, mf is the average, final mass in grams, ρ is the
density of the material (iron in these calculations) in grams per cubic millimetres, FN is the applied normal load in Newton and s is the sliding distance in metres. Thereby, the weight changes of four tool pins that were tested under the same running conditions were averaged in order to minimise stochastic deviations.
Wear is usually defined as the removal of material from contacting surfaces, but material that is removed from one surface can be transferred to the other one instead of being completely
removed from the contact. This means that wear is a dynamic and stochastic process. Adhesive
wear is the result of formation and breakage of atomic bonds between the contacting surfaces that leads to removal or transfer of material whereas abrasive wear occurs when hard protuberances plough and scratch a softer surface. Two-body abrasion can occur owing to build-up of transferred material whereas three-body abrasion results from entrapped hard debris. In view of this, wear volumes were not only determined through weight change measurements, but also through optical means according to the methodology for accurate wear measurements established in WP5. A
suitable method for the prediction of tool wear can then be chosen when employing a certain tool steel grade.
The wear model describing tool wear as a function of sliding velocity and load can then be incorporated into finite element (FE) forming simulations. By updating the geometry of the FE-model through nodal displacement depending on the dominant wear mechanism (material build-up or material loss) the tool wear (and its predicted service life) can be obtained already during the product development stage. If the nodal displacement due to wear further reaches a predefined
critical level, the service life of forming tools can be predicted. Hence, the quantification of wear through simulative testing is a key point for the prediction of wear in numerical simulations. The points of interest on an industrial reference component tool (WP1) might help in defining a critical
level of adhesion during the material transfer process that give an indication about which nodal displacements in FE-simulations to expect. Furthermore, the use of thermo-mechanical process parameters that were retrieved from FE-simulations of an industrial tool assures that
experimentation is carried out under press hardening conditions. However, some challenges still remain as they require validation through experiments. It is unclear when and how often the geometry in FE-simulations should be updated. This is mainly due to the fact that numerical simulations are time consuming and running the simulation of an actual component with geometry updating for hundreds or thousands of cycles most probably surmounts any acceptable time frame. Though, it seems that linear extrapolation of nodal displacements to save time will require careful evaluation as the contact conditions, namely contact pressure, will change rather significantly.
A predictive approach to tool lifetime in the press hardening process can be achieved through experimentation in conjunction with FE-simulations. The newly developed test facility allows economic evaluation of tool steel-workpiece material pairs intended for press hardening applications and experimental, tribological results are highly relevant for the press hardening process as they help in accurately predicting wear when fully implemented in FE-simulation
models. For that matter, experimental determination of wear data under press hardening conditions is crucial for the prediction of tool lifetime in hot stamping.
2.4. CONCLUSIONS
The main achievements made in WP1 include an outlook on hot stamped components demands and, according to this, the selection of a reference tool from a direct hot stamping process (frame dash panel from VW) and from an indirect process (B-Pillar tool from GES). Hot stamping process simulation of the frame dash panel part for determination of thermo-mechanical interaction
parameters in the process has been done. Calculated data is of assistance for identification of tool damaging mechanism in the industrial process. A combination of inspection of industrial tools, simulative wear tests and thermo-mechanical simulation has been used to identify and characterise

80
the main wear micromechanisms affecting hot stamping tools, and trace them to the main material and process parameters affecting their appearance. Seven micromechanisms were described: two
material loss mechanisms; abrasion and scratching, and five material transfer mechanisms;
adhesion, debris compaction, galling, ploughing and smearing. The main factors identified as affecting wear were chemical affinity, tool hardness, component hardness, tool surface roughness, temperature, normal load and sliding.
In WP2 the main conclusions reached are the development (ARC) of a specific test to measure accurately the thermal contact resistance (TCR) of the Usibor® 1500P AlSi and GA coated with
several different tool steel grades representative to the serial conditions of the hot stamping processes. The blank and tools temperature evolution curves of the TCR tests have been employed to develop a model of the TCR and of the obtaining of heat transfer coefficients (HTC). The validation of the TCR tests simulations has been carried out by experimental tests using Usibor® 1500P AlSi coated sheet against a conventional hot work tool steel DIN 1.2367 (unnitrided and nitrided) selected as reference material in WP1. Additionally, heating cartridges (at a mean temperature of 90°C which is the usual steady state in industrial hot forming tools), have been
added to the TCR test facility. HTC values increase with the applied pressure. This increase is linked to the flattening of the surface asperities of the blank on the tool leading to a higher contact between the surfaces and a reduced air trapped within the surface asperities of the interface. The
nitriding treatment has no influence on the HTC law with the pressure. Increase of the tool temperature from room to 90°C has the effect to slightly increase the HTC.
The other steel grades tested in WP2 were High Thermal Conductivity Steels (HTCS®). Tool steel materials with two different thermal conductivities, HTCS®-130 and HTCS®-150, have been
provided by ROV. A third modality of tool material composed of AlCrN coated HTCS®-130 has also been evaluated in the TCR test. The HTCS® materials show slightly lower heat transfer coefficient than conventional steel 1.2367 when tested against AlSi coated sheet. On the other hand, HTCS®-150 against GA sheet presents higher heat transfer coefficient than HTCS®-130, HTCS®-150 and 1.2367. This study shows that there is not an important difference on the heat exchange at the interface tool/blank for HTCS® materials compared to the standard steel, although the experience
showed that with high thermal conductivity tool steels the holding time of the hot stamping process is reduced for a given application, thanks not only to high thermal conductivity but also to high thermal diffusivity, as they are directly proportional. The more efficient thermal exchange in case of the GA coating is due to the highest conductivity of this coating but also to its lowest hardness at high temperature compared to the AlSi coating which improves the quality of the contact at the
interface tool/blank even at low pressure values. Blank hardness and blank coating hardness play an important role during heat exchange. The evolution of the sub-layer structure in sheet metal
coatings for hot stamping as a function of the applied heat treatment was studied for USIBOR® 1500P AlSi and USIBOR® 1500P GA (ARC, CTM). In the case of USIBOR® 1500P AlSi, it was found that the complete five-layer structure only formed with heat treatment at the recommended temperature (900 ºC), but not at a lower temperature (720 ºC). At 900 ºC, as heat treatment progressed, the coating grew into the substrate, while two of the sub-layers (composed by a ternary Al-Si-Fe intermetallic) grow in expense of the rest. For USIBOR® 1500P GA, the coating presents a single phase, consisting in a Fe matrix with Zn in solid solution. Round grains and
dendrite-like microstructures can be observed, suggesting that liquid phases have formed during heat treatment. As seen in USIBOR® 1500P AlSi, the coating in USIBOR® 1500P GA grows into the substrate as heat treatment progresses. Mechanical properties of the various sub-phases were investigated by means of nano-indentation. All sublayers in the treated AlSi coating have hardness higher than the steel substrate; however, Si-rich layers are slightly softer (10 GPa) than Fe2Al5 (13 GPa). The Fe-Zn-based GA coating is softer than the base steel, with a hardness of approximately
4 GPa. In both cases, heat treatment does not affect the mechanical properties of each individual
phase, only their proportion. Tribo-mechanical properties of the coated sheet steel at 600 ºC were investigated using a novel high temperature test based in the standard scratch test configuration. The AlSi coating is harder than the steel substrate. This coating behaves similarly to a hard coating: scratch track becomes suddenly deeper and wider as soon as the coating is pierced. The GA coating is softer than the AlSi coating, and also softer than the steel substrate. Failure load was also lower than in the case of the AlSi coating.
The influence of different process parameters on tribological behaviour has been studied in WP3 by means of the “integrated thermo-mechanical process facility” (itmp-facility) developed in UNI. A furnace dwell time of 240 s (conventional press hardening route in fully austenized condition) yields the lowest coefficient. Higher furnace dwell times lead to increasing coefficients of friction due to an increase in surface oxides, eventually leading to increased tool surface wear. Process routes for tailored tempered parts showed that the variant for non austenized material in

81
combination with a low furnace temperature of 720 °C result in a non-alloyed FeAlSi coating with a high content of aluminium melt on the surface and, therefore, adhesive wear dominates. Inlaying
temperature show that low temperatures in this respect lead to high values for the coefficient of
friction while high inlay temperatures decrease the coefficient of friction. An impact on the coefficient of friction caused by the sliding velocity was not detected.
Within the course of WP3 the tribological interaction between different sheet and tool steel materials was investigated. The obtained results show only negligible differences regarding tribological performance of the investigated tool steel grades. A major impact regarding the overall
wear mechanism was observed between the investigated sheet coating systems. AlSi coated sheet samples showed an increased coefficient of friction and an increased homogeneous pattern over the sliding distance with very stable fiction level between the trials. For GA coated sheet material a significant increase of the standard deviation was detected resulting in stick-slip behaviour and increased adhesive tool wear caused by zinc-liquid adhering on the tool surface. An improved tribological performance was obtained for AlSi coated material system combined with HTCS®150 coated with AlCrN and for GA coated sheet material in the combination with standard tool steel DIN
1.2367 in nitrided conditions.
Based on experimental testing with the itmp-facility standard tool materials a FE-model of the
experimental set-up has been developed which has been used for validation purposes in other WPs.
In WP4 a novel High Temperature Tribometer (HTTM) has been developed for simulating the tool-workpiece interaction at elevated temperatures during hot sheet forming. The tribometer has been setup and commissioned at LTU. TestTool project findings have been taken into account to design the test facility. The basic configuration of the high temperature tribometer involves a pair of tool
steel pins which are loaded against the workpiece strip surfaces (one from each side) and subsequently slid along the length of the strip. In order to enable long sliding distances to induce accelerated wear on the tool steel specimens, an automated pick and place mechanism feeds in new strips from a tray containing 40 strips. This allows a sliding distance of >30 m to be achieved without changing the tool specimens. The Al-Si coated and Zn coated UHSS workpiece materials can be heat treated and alloyed in the test facility. The resulting coating is fully alloyed and
representative of the hot stamping process. Two different geometries of tool steel specimens were initially evaluated. One was a T-shaped specimen with chamfered leading and trailing edges and the other geometry was a rectangular pin provided with a double radius at one end. The T-shaped geometry was found to give good results in terms of friction levels and the possibility to study the
effect of surface topography on friction and wear. The chamfered edges on the T-shaped pin specimen was, however, found to initiate excessive material transfer and it was decided to evaluate a T-shaped specimen with a 2 mm radius at the leading and trailing edges.
A simulation model HTTM has been developed in the framework of WP4. This model uses input from WP1 (reference tool), WP2 (characterization of heat exchange) and WP3 (validation data from semi-industrial tool). Thermo-mechanical solicitations derived from simulation of the reference tool (forming pressure, relative velocities and temperatures) are used as input to the simulations. The calculated heat transfer coefficients for different tool and strip material combinations are used to model the tool strip interface. The semi-industrial tool (ITMP-facility) gives input to calculate 3-dimensional field data for thermo-mechanical solicitations in a forming process, which can be used
for validation of the HTTM-model. Ideally, the simulation model described in this task should yield as output parameters suitable to apply in real tests in the facility. The tools are modelled as elastic bodies in the simulations, so the elastic deformation is taken into account in the simulations. Simulations are run using a thermo-mechanical material model. Potential phase transformations and heat transfer are considered in the simulation. Comparison of temperature for one material
combination with different applied normal forces and velocities show that the model takes this
effect into account. Thermal expansion of strip material, in simulations, has a noticeable influence on surface pressure outline.
Different techniques for analysis of wear generated on hot stamping tools have been evaluated in the framework of WP5, in order to establish a methodology for accurate wear measurement. Out of all of the studied techniques, topography analysis is the most flexible, even though it requires manpower and long post-processing time. It offers different possibilities depending on the wear mechanism encountered, from individual analysis of large or unique features to analysis of general
surfaces or to characterize small volumes of wear distributed over a surface. Moreover, topography analysis offers enough information to identify the wear mechanisms acting on an unknown system. Direct measurement through confocal microscopy offers accurate measurements for laboratory and simulator test samples, and could therefore be applied to the HTTM developed in the project. The

82
combination with surface replication allows topography analysis to be applied up to the industrial tooling scale without loss of accuracy, in addition to some interesting secondary advantages such
as keeping an historic record of the surface status from a tool. The use of a magnetic induction
gauge presents important advantages, but also limitations. Advantages include very fast measurements and little post-processing required. This technique is also capable of measuring the thickness of adhered material even when the original surface cannot be recognised. The main disadvantage is that this technique is only able to measure adhesive wear, never loss of material, and need to recalibrate the gauge before measuring non-flat surfaces.
In terms of quantitative results from inserts of HTTM, the best option is to take into account both worn area on the inserts and thickness of adhered material. An index has been proposed calculated from profilometry and stereo microscopy measurements. The techniques applied to calculate this index are precise and fast, and can be used for additional characterization, such as identification of wear mechanisms. Additionally, preparation of cross-sectional samples and observation through SEM has also been valuable to identify the wear mechanisms and characterize the system. Even if this step is not always required, it may be interesting to apply this kind of analysis when tests
using new materials or different parameters are performed.
Finally, WP6 summarises the knowledge gained throughout TestTool project. The developed HTTM
has been used to evaluate tribological behaviour of reference materials as well as different combinations of alternative materials. The tool wear results from the test facility and the associated surface damage mechanisms were analysed and compared to those found in actual tools from industrial hot stamping processes. Cross-sectional analysis of the tool samples revealed that wear mechanisms corresponded to the ones observed in industrial tools. The most important mechanism
was material transfer from the coating to the tool inserts. The microstructure of transferred material showed mostly an appearance consistent with the accumulation and compaction of particles broken off from the coating. This was particularly visible in the surface near the leading edge of the inserts, with adhered material reaching thickness over 10 µm. The middle of the inserts showed slightly different wear mechanisms. In this case, a thin layer of smeared material less than 2 µm thick was observed to coat the surface. The test facility is capable of reproducing the wear
mechanisms observed in press hardening. Accelerated wear can be induced on material pairs intended for application in industrial processes or interesting for investigation of their suitability. The main factor affecting tribological behaviour is the nature of blank coating, as found in previous WPs. For Zn coated material, the friction coefficient increases with each subsequently tested strip at lower contact pressure. For Al-Si coated material, the coefficient of friction drastically increases
when severe material transfer takes place as ploughing occurs. The influence of different sliding velocities on the coefficient of friction is in general negligible, which was also observed during
experiments in the itmp-facility in WP 3, but the results here indicate that severe material transfer and ploughing do not seem to occur at higher sliding speeds in the case of Al-Si coated 22MnB5. The coefficient of friction is generally lower at higher loads, independent of the materials in contact. In tests with different steel grades sliding against AlSi, results show no clear dependence between measured material transfer and forming parameters. For instance, for the reference material (1.2367+Nitriding), material transfer appears to increase when load is increased from 500 to 1000 N. The same seems true for HTCS 130. However, HTCS150 does not show the same behaviour.
When the different grades are compared, it appears that HTCS steels show less material transfer. This might be related to reduced chemical affinity between the HTCS surface and AlSi based transfer. However, HTCS grades showed higher degree of abrasive wear than the reference material. This behaviour could be improved with the application of a nitriding treatment. When GA coated blanks are tested, no apparent effect can be detected between measured material transfer and forming parameters. Neither do the different tool steels show significant differences in their
performance. The softer GA coating results in more contact between the two surfaces, as opposed
to asperity interaction in the case of AlSi coatings. Therefore, contact between the two sliding counterparts would result in more material transfer.
It can be concluded that an estimation of the lifetime of hot stamping tools can be accomplished by numerical simulations of the process. The lifetime of hot stamping tools can be estimated through quantification of the wear behaviour obtained during simulative experiments in the newly developed test facility. However, the methods for quantifying wear require careful evaluation and
validation. In this project, several methods have been presented in Deliverable 5.2, and have been used in Deliverable 6.2 complemented with measurements based in the Archard model. In view of this, it is difficult to convert a test cycle time to actual tool lifetime that allows predicting the performance of forming tools for industrial applications and that enables the assessment of the manufacturing process from a technical as well as an economical point of view. Adhesive wear is generally the dominant wear process in press hardening, but abrasive wear, thermal fatigue and

83
corrosive (tribochemical) wear also play an important role and reduce the lifetime of the forming tools as they alter the contact conditions during forming. It is desirable to enhance the durability of
forming tools and to extend their service life through adjustment of parameters during the process.
A reliable wear prediction then enables sustainable manufacturing of more complex shaped components with increased functionality to meet the requirements of the automotive industry in the future.
2.5. EXPLOITATION AND IMPACT OF THE RESEARCH RESULTS
The development of a measuring methodology and the set-up of a test facility to evaluate the
tribo-thermo-mechanical behaviour of the tool-workpiece system provide the possibility for simulative testing of friction and wear at high temperatures with applications in hot sheet metal forming. The results are relevant for the intended application and have potential to be used for prediction of hot forming tool life. This will have a significant impact on process economy since in view of easier optimization and selection of tool materials.
In absence of the developed test facility it is impossible to get this type of data from the actual hot
sheet metal forming process. Utilizing the test facility it is possible to obtain relevant results in an
economic way in view of small and cheap test specimens and the possibility to screen large number of test conditions and materials in relatively short time. Additionally, tests are performed in controlled conditions making the evaluation more accurate.
The achievement of project objectives has enabled the detailed study of wear phenomena affecting hot stamping processes, the evaluation of new combinations of sheet metal, tool steel and coatings and the prediction of tool failure, thus broadening the application range of high complexity and
performance hot stamping components. The European automotive industry is facing increasingly tough competition from low cost and emerging countries particularly China and India. There is general agreement that the best way for European industry to successfully compete is through the creation and development of value added products with high knowledge contents that fit the perspective of the automotive industry. The know-how developed within the project will contribute in introducing the forming processes of new and advanced knowledge-based materials and lead to greater productivity at a lower economic and energy cost. Producing high-quality products at a
competitive price is becoming an ever-tougher challenge as product life-cycles are getting shorter all the time and new products must be brought to market more rapidly. The need for new tools in response to these requirements is becoming more and more challenging. The possibility of testing
new materials and solutions from the step design will provide the market with higher quality and more innovative products along with the perspectives to increase of productivity and cost effectiveness of the investigated hot stamping process in one hand. On the other hand, the
understanding developed provides new tools and investigation orientations to the partners involved towards more innovation and creation. The resulting know-how and manufacturing practices will contribute to strengthening the relationship between the automotive components sector and the major motor manufacturers.
Furthermore, European best practice will play a role in avoiding the displacement of automotive component manufacture to third countries and keeping Europe in a privileged position over its competitors. European cars need to be more economical and more environmentally friendly than
those of global competitors to gain competitive advantage. This competitive advantage will lead to a global increase in the sale of European cars, resulting in an increase of production and a consequent increase of employment in Europe. Europe is the world's largest motor vehicle producer. More than 250 automobile manufacturing plants in the EU are supporting over 12 million families directly employing 2.3 million Europeans (and indirectly supporting a further 10 million
jobs in related sectors). Europe produced nearly 20% of the world’s passenger cars in 2013. TestTool results will help to strengthen European position and leadership in the global market.
The project was initially directed to automotive industry demands of light components with higher performance with lower costs. Besides the automotive sector, other sectors will benefit from TestTool achievements in the future, as surface transportation, agriculture and mining, machine building, white goods manufacturing, etc. For instance, previously experiences prove the use of UHSS in locomotives and railways components can lead to more than 25% weight reduction. Also the use of these materials in containers for road transport can lead to reductions of 10.000 l of fuel
and 26 Tons of CO2 emissions yearly.

84
Dissemination of results
Following, a list of the dissemination activities (publications, conferences, web, press releases, etc)
carried out during the project is given.
Contributions in scientific journals:
Jaume Pujante, Nuria Cuadrado, Montserrat Vilaseca, Christine Dessain, Daniel Casellas Maria Dolors Riera. “Characterization of Al-Si Coatings for Hot Stamping of Boron Steel”. Journal of Materials Processing Technology (under review).
M. Vilaseca, J. Pujante, G. Ramírez, D. Casellas. “Investigation into adhesive wear of PVD
coated and uncoated hot stamping production tools”. Wear 308 (2013), 148-154.
Contributions in conferences:
S. Mozgovoy, J. Hardell, L. Deng, M. Oldenburg, B. Prakash. “Simulative High Temperature Friction and Wear Studies for Press Hardening Applications”. 5th International Conference on Hot Sheet Metal Forming of High Performance Steel CHS2 2015, 31 May – 3 June 2015, Toronto,
Canada.
S. Mozgovoy, J. Hardell, B. Prakash. “High temperature friction and wear studies on tool
coatings under press hardening contact conditions”. International Tribology Conference 2015, 16 – 20 September 2015, Tokyo, Japan.
Hardell, J., Mozgovoy, S., Dube, A., Oldenburg, M. & Prakash, B., “A Novel High Temperature Tribometer for Hot Sheet Metal Forming Applications”, 5th ASIATRIB, 17-20 February 2014, Agra, India.
J. Pujante, G. Ramirez, M. Vilaseca, D. Casellas, “Laboratory Investigations about the Mechanisms of Aluminium Transfer on Hot Forming Tools”, 16th Nordic Symposium on Tribology
NORDTRIB2014,10-13 June 2014, Aarhus, Denmark (Poster contribution).
J. Pujante, G. Ramírez, A. Ademaj, K. Steinhoff, C. Dessain, M. Vilaseca, D. Casellas. "Measurement of Adhesive Wear on Hot Forming Tools", Proceedings of the 4th International Conference on Hot Sheet Metal Forming of High Performance Steel CHS2 2013, 10-12 June 2013 in Luleå, Sweden. ISBN 978-3-942267-82-3, pp. 371-378.
M. Vilaseca, J. Pujante, G. Ramírez, D. Casellas, "Adhesive wear analysis of PVD coated and
uncoated hot stamping tools", 15th Nordic Symposium on Tribology NORDTRIB2012, 12-15 June 2012, Trondheim, Norway (Poster contribution).
Web:
http://testool.ctm.com.es/
Press releases:
- Newspaper (printed material): Regió 7, 8th July 2011, language: Catalan.
- Magazine: Fundació CTM Centre Tecnològic, Nº14 (Nov. 2011) pp. 13, languages:
Catalan, Spanish and English.
- Magazine: Fundació CTM Centre Tecnològic, Nº22 (Dec. 2014) pp. 8-9, languages:
Catalan and Spanish.
PhD thesis and Diploma/Bachelor thesis:
Author: J. Pujante
Title: Wear Phenomena in Hot Forming Tools: Mechanisms and Laboratory Reproduction
Institution: Universitat Politècnica de Catalunya (Spain)

85
Year: to be submitted in 2015
Author: Sergej Mozgovoy
Title: High Temperature Friction and Wear in Press Hardening
Institution: Luleå University of Technology
Year: 2014
ISBN: 978-91-7583-040-7

86

87
3. LIST OF FIGURES
Figure 5.1.- Basic hot stamping process chains: a) direct hot stamping, b) indirect hot stamping [KAR10].
Figure 5.2.- Selected reference tool (illustration from CAD).
Figure 5.3.- Images of a tool similar to the selected reference tool, worn areas are labelled.
Figure 5.4.- A B-Pillar component scheme from GES.
Figure 5.5.- FE-model of frame dash panel tool and blank.
Figure 5.6.- A, B and C are points for measurement of pressure and relative velocity in
simulation.
Figure 5.7.- Relative velocity and pressure point A.
Figure 5.8.- Peak pressure on UPPER tool for an initial tool temperature of 383 K. Scale in Pascal.
Figure 5.9.- Temperature distribution in UPPER tool for initial tool temperature 298K at time 4.2
seconds.
Figure 5.10.- a) Scheme of TCR device with the flat sample quenched between the flat punch and the die, b) thermocouple schematic position in blank and tool (thermocouple tc1 is at 1.5 mm from the surface and tc2 at 3.5 mm from the surface).
Figure 5.11.- TCR device experimental set-up.
Figure 5.12.- Temperature evolution in the blank (a) and in the die (b) with increasing contact pressure values between 5 MPa to 30 MPa. Tool material 1.2367 unnitrided, blank 22MnB5 with AS150 coating, thickness: 1.5 mm.
Figure 5.13.- Temperature evolution in the blank (a) and in the die (b) with increasing contact pressure values between 5 MPa to 30 MPa. Tool material 1.2367 nitrided, blank 22MnB5 with AS150 coating, thickness: 1.5 mm.
Figure 5.14.- Digital drawing (CAD) of TCR test tool. Parts used in FE-model marked with text boxes.
Figure 5.15.- FE-model of TCR test tool. Parts corresponding to labelled parts in Figure 5.14.
Figure 5.16.- Measured and calculated tool temperature curves for 30 MPa contact pressure.
Tool steel is DIN 1.2367 without nitriding and blank material is Usibor® 1500P AlSi. The model is fully coupled.
Figure 5.17.- a) Distribution of sub-layers in the layer structure of USIBOR AlSi and b) Mechanical characterization in the sub-layers of the heat treated USIBOR AlSi. a) Sub-layer structure; triangles indicate the different indented phases. b) Comparison of hardness of the five layers after different heat treatments.
Figure 5.18.- a) Thickness measurement of the GA coating after different heat treatments. b) Mechanical characterization in the sub-layers of the heat treated USIBOR GA. Comparison of coating hardness after heat treatments GA2 and GA3.
Figure 5.19.- High temperature scratch test on USIBOR AlSi at 600 ºC. Coating failure load (Lc2) can be observed both (a) in the coefficient of friction and (b) by analysis of the scratch track.
Figure 5.20.- a) Hardness evolution of the substrate of the Usibor 1500P with the temperature
via Loubet model. b) 500 ºC indentations. Impressions show a white area around indents and light adhesion of the tip with the substrate.
Figure 5.212.- Evolution of the hardness of the substrate(S) and of the coating (C) of a Usibor 1500P with the temperature considering the indent print of a Vickers Tip in diamond.
Figure 5.22.- Temperature measurement showing steady state conditions in an industrial tool from GES.
Figure 5.23.- Heating cartridges in the tools to obtain a minimum temperature of the tool
equivalent to 90°C at the beginning of the test and at 1.5 mm from the surface.

88
Figure 5.24.- Temperature evolution in the blank (a) and in the die (b) with increasing contact pressure values between 5 MPa to 30 MPa with tools heated at 90 ºC. Tool material 1.2367
unnitrided, blank 22MnB5 with AS150 coating, thickness: 1.5 mm.
Figure 5.25.- Contact heat transfer coefficient (htc) in tool-work piece interface for different blank and tool material combinations and pressures. Bar chart showing htc grouped for material combinations at each applied pressure level in the tool.
Figure 5.26.- Process route of the tribological test environment.
Figure 5.27.- Initial tool specimen and surface conditions as obtained through white-light
interferometry.
Figure 5.28.- Influence of heating conditions on the tribological behaviour for Usibor®1500P + AlSi annealed at 930 °C, drawing velocity 60 mm/sec.
Figure 5.29.- Influence of heating conditions on the tribological behaviour for Usibor®1500P + AlSi, drawing velocity 60 mm/sec.
Figure 5.30.- Tool surface with adhesive wear of the AlSi layer after 5 trials: a) 720 °C, 360 sec., 6 MPa; b) 930 °C, 360 sec., 6 MPa.
Figure 5.31.- The cross sectional images and surface conditions for AlSi-coated samples after the heat treatment.
Figure 5.32.- Influence of inlaying temperature conditions on the tribological behaviour for Usibor®1500P + AlSi heat-treated at 930 °C, drawing velocity 60 mm/sec.
Figure 5.33.- Influence of sliding velocity on the tribological behaviour for Usibor®1500P + AlSi.
Figure 5.34.- Modular tool utilized within the course of the Test Tool project (left); amount of integrated sensors and demonstrator dimensions (right).
Figure 5.35.- Fe-model of itmp-facility with relevant parts displayed. Elastic tool parts are attached to rigid surfaces for motion control purposes.
Figure 5.36.- Obtained process data (left) at different process stages (right).
Figure 5.37.- Data collecting positions in the itmp-facility. Data from FE-model sampled in corresponding positions.
Figure 5.38.- Peak pressure fringe plot of the die tool part. Section cut indicated by white line.
Figure 5.39.- Section plane fringe plot showing effective stress straight through the middle of the die tool part after 18s duration of a forming cycle.
Figure 5.40.- Section plane fringe plot showing the temperature straight through the middle of the die tool part at the end of a forming cycle (30 s). Temperature in Kelvin [K].
Figure 5.41.- Effective (total) strain in blank upper outer (visible) surface at the end of a forming cycle (30 s).
Figure 5.42.- Comparison of measured and calculated temperatures in die tool part. Labels are
according to Figure 5.37. A leading C in the label means calculated value.
Figure 5.43.- Comparison of measured and calculated temperatures in punch tool part. Labels are according to Figure 5.37. A leading C in the label means calculated value.
Figure 5.44.- Comparison of measured and calculated temperatures in blank. Labels are according to Figure 5.37. A leading C in the label means calculated value.
Figure 5.45.- Investigated tool and workpiece material systems in Task 3.3.
Figure 5.46.- Coefficient of friction as a function of sliding distance for AlSi coated steel
substrate against uncoated tool steel (left) and plasmanitrided tool steel (right). 5 repetitions.
Figure 5.47.- Coefficient of friction as a function of sliding distance for ZF (GA) coated steel substrate against uncoated tool steel (left) and plasmanitrided tool steel (right) at different contact conditions. 5 repetitions.
Figure 5.48.- Coefficient of friction for different substrate coatings and tool surface conditions.
Figure 5.49.- Coefficient of friction for different substrate coatings and tool steel grades.
Figure 5.50.- Coefficient of friction for different sheet coatings, tool steel grades and tool surface conditions.

89
Figure 5.51.- Concept map showing relations between the simulation model of the HTTM and other WPs.
Figure 5.52.- Overview and detail of FE-model for high temperature tribometer.
Figure 5.53.- Detail of sliding tool and holders. Boundary conditions and applied force direction is indicated. Tool parts are modelled as rigid material and as elastic material in different simulations.
Figure 5.54.- Detail of sliding tool part with indicated sweeping direction and numbered nodal points chosen for extraction of results.
Figure 5.55.- Areas for extraction of results from FE-simulation of reference tool.
Figure 5.56.- Contact pressure in selected point in tribometer tool. Node numbers correspond to Figure 23 (Pressure [Pa], Time [s]).
Figure 5.57.- Overview of new high temperature tribometer (HTTM).
Figure 5.58.- Detailed overview of new high temperature tribometer and its features.
Figure 5.59.- Schematic of the test procedure.
Figure 5.60.- a) Tool steel specimens for the high temperature tribometer, b) geometry and
dimensions of tool steel specimens for the high temperature tribometer.
Figure 5.61.- Initial heating profiles for the Al-Si as well as Zn coated workpiece materials.
Figure 5.62.- Cross-section micrographs of (a) the Al-Si coated UHSS sample and (b) Zn coated UHSS sample after heat treatment in the test facility. c) Zn coated UHSS sample after heat treatment using shorter soaking time.
Figure 5.63.- Modified T-shaped tool steel specimen geometry.
Figure 5.64.- Chosen surface segments (upper) and nodal points (lower) for surface pressure
calculations in the HTTM-model.
Figure 5.65.- Nodal positions (measurement nodes) for extraction of tool temperature values. Positions correspond approximately to thermo-couple positions in physical HTTM.
Figure 5.66.- Segment pressure on T-shaped tool (Pressure [Pa], Time [s]).
Figure 5.67.- Nodal pressure on T-shaped tool (Pressure [Pa], Time [s]).
Figure 5.68.- Normal (x-force) and friction (z-force) force in tool strip contact extracted from
simulations (Force [N], Time [s]).
Figure 5.69.- Calculated temperature at node 138335 for different tool and strip material combinations.
Figure 5.70.- Pressure distribution in stationary tool. Active strip material shrinkage in upper image and inactive in lower image (Pressure [Pa]).
Figure 5.71.- Pressure distribution in moving tool. Active strip material shrinkage in upper image
and inactive in lower image (Pressure [Pa]).
Figure 5.72.- Effective stress levels in ITMP-model, lower tool. Upper image at time point when the blank is forced down in the tool. Lower image just before release of forming force, after
quenching in the tool (Stress [MPa]).
Figure 5.73.- Effective stress levels in T-shaped tool (tool cut in the middle to show stress levels
inside the tool). Left is stationary tool with applied transversal force. Right is moving tool with applied transversal force (Stress [Pa]).
Figure 5.74.- Summary of the methodologies studied on different systems and scales.
Figure 5.75.- Cross-section obtained from a Hardware Simulator insert. Contours of adhered material and original surface (red contours) are detected using Analysis software, and thickness
of adhered material measured.
Figure 5.76.- Obtaining of a replica from a Hardware Simulator insert (obtained from UNI tasks in WP3). a) Steel insert covered with replica resin (green); after less than 5 minutes the replica is cured and can be lifted. b) and c): Overview of tool (b) and replica (c).

90
Figure 5.77.- Working principle of a magnetic induction gauge. The magnetic field is emitted from the probe tip, allowing calculating the distance between the tip and the ferromagnetic
substrate (dark grey).
Figure 5.78.- Main parameters to be considered for interference patterns analysis by diffraction. a) From [LEB10], b) from [BRO96].
Figure 5.79.- a) Diffraction peak and corresponding analysis, b) sin2
AFN99].
Figure 5.80.- Set –X diffractometer from the ICA. Para -
- Time acq = 30 s/pt – 9 pt – Source : Chrome - I = 20A V = 30 V - Softwares SetXAcq© and StressDiff© Version 2.0 – 2004 - The diffraction analysis was performed in
Figure 5.81.- Stereo microscopy overview of Hardware Simulator flat insert. Complex surface topography related to adhesive wear mechanisms can be observed. Zones A to E, labelled on the image, were selected to perform the study.
Figure 5.82.- Analysis of zone A of UNI Hardware Simulator sample AlSi01: a) direct
profilometry measurement; b) replica profilometry (vertically inverted for greater clarity); c)
cross-sectional analysis.
Figure 5.83.- Diagram of the Deep Drawing Process Simulator (DDPS) and detail of the hot strip sliding on the die radius.
Figure 5.84.- Definition of measured profiles on die radius.
Figure 5.85.- Wear criteria definition.
Figure 5.86.- Transfer wear, material loss and transfer regularity (homogeneity) after 1000 and
2000 cycles for DIN 1.2367, DIN 1.2367 nitrided and HTCS® 150 + AlCrN tool inserts.
Figure 5.87.- Analysed samples.
Figure 5.88.- Residual stresses measured by XRD on DDPS inserts in DIN 1.2367 with and without nitriding treatment – Influence of the nitriding treatment.
Figure 5.89.- Cross section of 1.2367 inserts after 2000 cycles test on DDPS. a) non-nitrided and b) nitrided.
Figure 5.90.- Critical zones of reference tool (punch) inspected by means of replica technique, a) identified in pressure distribution map of FE simulation and b) in the industrial tool (replicas are black, some additional areas have been inspected).
Figure 5.91.- Parts produced vs production week. Red points indicate replica obtaining (after the corresponding week).
Figure 5.92.- 10x image of a replica from a severely worn surface.
Figure 5.93.- Main adhesive wear mechanisms observed and their distribution on industrial tool.
Figure 5.94.- Wear-critical areas spotted in FEM simulation of the forming process.
Figure 5.95.- 10x lens image from a tool surface replica.
Figure 5.96.- Stereo microscopy overview of insert AlSi01.
Figure 5.97.- Results corresponding to stereo microscopy measurements.
Figure 5.98.- SEM/BSE images from the Cross-sectional analysis of the samples slid against: a)
AlSi-coated USIBOR; b) USIBOR GA.
Figure 5.99.- a) Schematic showing the areas measured by means of optical topography; b)
Mean height profile along the horizontal axis and area of adhered material, as calculated from the mean height profile.
Figure 5.100.- Material transfer as measured through optical profilometry.
Figure 5.101.- Wear in the different studied inserts measured using the defined Wear Index, in arbitrary units.
Figure 5.102.- Schematic showing specimen dimensions and test configuration of the newly
developed test facility employed in simulative, accelerated wear experiments.

91
Figure 5.103.- Coefficient of friction as a function of contacting time for plasma nitrided 1.2367 sliding against Al-Si coated 22MnB5 under (a) a load of 500 N at 0.1 m/s, (b) a load of 500 N at
0.25 m/s and (c) a load of 1000 N at 0.1 m/s. (d) Photograph of the ploughing groove occurring
on the Al-Si coated workpiece surface.
Figure 5.104.- AlSi-based material transfer observed on the tool inserts after testing. a) Thick accumulation of material. b) Thin smeared layer.
Figure 5.105.- Coefficient of friction as a function of contacting time for plasma nitrided 1.2367 sliding against Zn coated 22MnB5 under (a) a load of 500 N at 0.1 m/s, (b) a load of 500 N at
0.25 m/s and (c) a load of 1000 N at 0.1 m/s.
Figure 5.106.- Wear measured in HTTM inserts sliding against AlSi coated material. Reference condition (Wear=100) corresponds to 1.2367Nitrided sliding against AlSi-coated 22MnB5 at 0.1m/s, 500N load.

92

93
4. LIST OF TABLES
Table 5.1.- Surface characteristics of Frame dash panel tool. Delivery status from tool surface treatment provider.
Table 5.2.- Common process parameters from Volkswagen press shop.
Table 5.3.- Effect of various parameters on the main wear mechanisms in hot stamping.
Table 5.4.- Summary of samples and heat treatments.
Table 5.5.- High Temperature Scratch Test on USIBOR AlSi and GA: Summary of the determined failure load under different conditions.
Table 5.6.- Experimental test conditions investigated in Task 3.
Table 5.7.- Test conditions for the itmp-facility. Selected parameters used in FE-simulation of the forming process.
Table 5.8.- Test conditions for trials in Task 3.3 and varying material and tool surface conditions.
Table 5.9.- Test conditions for trials in task 3.4 considering different types of sheet coatings and
tool material.
Table 5.10.- Settings for simulation of tribometer run. The settings correspond to data from point F in the tool above.
Table 5.11.- Technical specifications of the high temperature tribometer.
Table 5.12.- Simulation parameter set example.
Table 5.13.- Result of different measurement techniques performed on the severely worn hardware simulator insert.
Table 5.14.- Die insert characteristics of tested materials.
Table 5.15.- Index of replica sets and corresponding cycle numbers.
Table 5.16.- Identification of inserts tested in HTTM.
Table 5.17.- Test parameters used in the newly developed test facility; *values taken from
numerical simulations of the industrial tool.
Table 5.18.- Combinations of tool steel- work piece materials and test parameters tested.

94

95
5. LIST OF ACRONYMS AND ABBREVIATIONS
AHSS: Advanced High Strength Steel
Al/Si, AlSi: Aluminium/Silicon coating of Usibor® 1500P AlSi
AR: Annual Report
ARC: ARCELORMITTAL (BEN2)
bc:s: boundary conditions
CETR UMT-2: Tribometer acquired at Center of Tribology (Bruker Nano Surfaces Division), settled at CTM installations and employed in Tasks 2.1 and 5.1
CLST: Constant Load Scratch Test
CTM: Fundació CTM Centre Tecnològic (CO1)
FE-model: Finite Element Model
GA: galvannealed coating on Usibor® 1500P blanks, named Zn-Fe Usibor® 1500P GA
GES: GESTAMP HARDTECH AB (BEN5)
HTC: Heat Thermal Coefficient
HTCS®: High Thermal Conductivity Steel
HTTM: High Temperature Tribometer. Test facility developed in the framework of TestTool project.
ILST: Incremental Load Scratch Test
Itmp-facility: integrated thermo-mechanical process facility, settled at UNI and used in WP3.
LTU: Luleå University of Technology (BEN7)
ROV: Rovalma, S.A. (BEN4)
TCR: Thermal Contact Resistance device, settled at ARC and employed in WP2.
UHSS: ultra high-strength steels
UNI: Universität Kassel (BEN6)
Usibor1500P ®AlSi: Aluminized boron steel (based on 22MnB5), commercialized under the trade name of Usibor®1500P.
VW: Volkswagen AG (BEN3)

96

97
6. REFERENCES
[ABD10] B. Abdulhay, B. Bourouga, C.Dessain, Experimental approach to simulate the blank cooling during the hot stamping process, International Journal of Material Forming IFJO, DOI 10.1007/s12289-010-0687-2, 2010.
[AFN99] Essais non destructifs : Méth. d'essais pour l'analyse des cont. résid. par dif. des ray. X, XP A 09-285, AFNOR , Mai, 1999.
[ARC53] J.F. Archard, Contact and Rubbing of Flat Surfaces. J Appl Phys 24 (1953); pp 981-988.
[BLA13] A. Blaise, Theoretical and experimental study of the heat transfer in the Hot Stamping
process of the Usibor® 1500P using partially heated tools, PhD thesis of the University of Nantes, 29th of november 2013, 79-80.
[BOH12] C. Boher, S. LeRoux, L. Penazzi, C. Dessain, Experimental investigation of the tribological behavior and wear mechanisms of tool steel grades in hot stamping of a high-strength boron steel, Wear 294–295 (2012) 286–295.
[BOW01] F.P. Bowden, D. Tabor, The friction and Lubrication of Solids, Revised edition (2001),
Oxford University Press.
[BRO96] N. Broll, Caract risation des solides cristallisés par diffraction X, Tech. De l'Ingénieur, p1080, Avril, 1996.
[FOR07] E. Forlerer, R. CastilloGuerra, E. Ermini, "Use of topographic polymeric replica to characterize electric corrosion failure", Wear 263 (2007), pp 1508-1512.
[GHI11] A. Ghiotti, S. Bruschi, F. Borsetto, Tribological characteristics of high strength steel sheets under hot stamping conditions, Journal of Materials Processing Technology 211 (2011) 1694-1700.
[GRI11] R. Grigorieva, P. Drillet, J.M. Mataigne, A. Rediaïmia, Phase Transformations in the Al-Si Coating during the Austenization Step, Solid State Phenomena 172-174 (2011) 784-790.
[HAR08] J. Hardell, B. Prakash, High-temperature friction and wear behaviour of different tool steels during sliding against Al-Si coated high-strength steel, Tribology International 41(7) (2008), 663-671.
[HEI02] E. van der Heide, Lubricant Failure in Sheet Metal Forming Processes. Doctoral Thesis, Universiteit Twente (2002).
[JAN95] S. Jana, "Non-destructive in-situ replication metallography", Journal of Materials Processing Technology 49 (1995), pp. 85-114.
[KAR10] Karbasian, H., Tekkaya, A.E., A review on hot stamping, Journal of Materials Processing Technology 210 (2010) 2103-2118.
[LAM12] P. Lamesle, Cours Ingénierie des Surfaces – Analyses des surfaces, Mines Albi Carmaux, 2012.
[LEB10] J.L.Lebrun, ENSAM Paris Tech –LAMPA- PMD, 2010.
[LSD13] Livermore Software Technology Corporation (LSTC). LS-DYNA R7.0. Keyword User’s Manual (2013). Vols. I-III. Revision: 2449.
[LSO13] Livermore Software Technology Corporation (LSTC). LS-OPT Version 5.0. User’s Manual (2013).
[MOU13] K. Moussaoui, influence de l’usinage sur la durée de vie en fatigue de pièces a ronautiques en alliage de Titane, Thèse de l’Universit de Toulouse, ED MEGeP, 2013.
http://thesesups.ups.ups-tlse.fr/2064

98
[PUJ11] Pujante, J., Vilaseca, M., Eriksson, K., Clobes, J., Alsmann, M., Casellas, D., Wear mechanism identification on hot stamping tools, in Proc. of 3rd International Conference on Hot
Sheet Metal Forming of High-Performance Steel (Eds. M. Oldenburg, K. Steinhoff, B. Prakash),
Kassel, Germany (2011), 377-384.
[STU99] S. Stupkiewicz och Z. Mróz, A model of third body abrasive friction and wear in hot metal forming, Wear 231 (1) (1999), 124-138.
[VIL12] Vilaseca, M., Pujante, J., Ramírez, G., Casellas, D., Adhesive wear analysis of PVD coated and uncoated hot stamping tools, in Proceedings of 15th Nordic Symposium on Tribology
NORDTRIB 2012, Trondheim, Norway (2012).

HOW TO OBTAIN EU PUBLICATIONS
Free publications: • one copy:
via EU Bookshop (http://bookshop.europa.eu);
• more than one copy or posters/maps: from the European Union’s representations (http://ec.europa.eu/represent_en.htm); from the delegations in non-EU countries (http://eeas.europa.eu/delegations/index_en.htm); by contacting the Europe Direct service (http://europa.eu/europedirect/index_en.htm) or calling 00 800 6 7 8 9 10 11 (freephone number from anywhere in the EU) (*). (*) The information given is free, as are most calls (though some operators, phone boxes or hotels may charge you).
Priced publications: • via EU Bookshop (http://bookshop.europa.eu).

The main objectives of the project have been the development of a measuring methodology and the set-up of a test facility to evaluate the tribo-thermo-mechanical behaviour of the tool-workpiece system in sheet metal hot stamping. To reach these objectives all relevant aspects concerning hot stamping processes have been taken into account: in WP1 the thermo and tribo-mechanical solicitations acting on the tool-workpiece interface during hot stamping of an industrial reference component have been identified. The heat exchange between tool and work piece has been analysed and tribo-mechanical properties of the sheet coatings have been studied in WP2. The effect of process parameters on thermo-mechanical solicitations affecting tool-workpiece interactions has been studied in WP3. The TestTool facility has been designed and built-up in WP4. Different techniques for analysis of wear generated on hot stamping tools have been evaluated and verified in WP5. Finally, in WP6 the developed TestTool facility has been validated for accurately measuring wear in tools for hot stamping applications and lifetime of hot stamping tools estimation.
The achievement of project objectives has enabled the detailed study of wear phenomena affecting hot stamping processes, the evaluation of new combinations of sheet metal, tool steel and coatings and the prediction of tool failure, thus broadening the application range of high complexity and performance hot stamping components.
Studies and reports
EUR 27568
Wear m
easurement m
ethodology and test facility to increase the efficiency of hot stamping for high perform
ance component production (TESTTO
OL)
EU
ISBN 978-92-79-53614-4
doi:10.2777/8461
KI-NA-27568-EN
-N