wearable monitoring system for assistance dogs · wearable monitoring system for assistance dogs...
TRANSCRIPT

Jeremie De Seabra
Licenciado em Ciências da Engenharia Electrotécnica e de Computadores
Wearable Monitoring System for Assistance Dogs
Dissertação para obtenção do Grau de Mestre em
Engenharia Electrotécnica e de Computadores
Orientador: Yves Rybarczyk, PhD, Faculdade de Ciências e Tecnologia da Universidade Nova de Lisboa
Co-orientador: Arnaldo Batista, PhD, Faculdade de Ciências e Tecnologia da Universidade Nova de Lisboa
Júri:
Presidente: Prof. Doutor José António Barata de Oliveira Arguente: Prof. Doutor Raúl Eduardo Capelo Tello Rato
Vogal: Prof. Yves Philippe Rybarczyk
Novembro 2014


III
Wearable Monitoring System
for Assistance Dogs
Dispositivo vestível de monitorização de Cães de Assistência
Copyright © Jeremie De Seabra, FCT/UNL, UNL
A Faculdade de Ciências e Tecnologia e a Universidade Nova de Lisboa têm o direito,
perpétuo e sem limites geográficos, de arquivar e publicar esta dissertação através de
exemplares impressos reproduzidos em papel ou de forma digital, ou por qualquer outro
meio conhecido ou que venha a ser inventado, e de a divulgar através de repositórios
científicos e de admitir a sua cópia e distribuição com objetivos educacionais ou de
investigação, não comerciais, desde que seja dado crédito ao autor e editor.
Copyright © Jeremie De Seabra, FCT/UNL, UNL
Faculdade de Ciências e Tecnologia and Universidade Nova de Lisboa have the perpetual
right with no geographical boundaries, to archive and publish this dissertation through
printed copies reproduced on paper or digital form or by any means known or to be
invented, and to divulge through scientific repositories and admit your copy and
distribution for educational purposes or research, not commercial, as long as the credit
is given to the author and editor.

IV

V
Acknowledgement
I would like to express my deepest appreciation to Professor Yves Rybarczyk and
to Professor Arnaldo Batista for the opportunity of doing this dissertation, as well as for
all the help, advice, support and encouragement that was transmitted to me throughout
the year.
I would also like to thank Professor Raquel Almeida and Professor António
Urgueira for lending their facilities and equipment, and also for their availability.
I would like to thank Joana Siro for providing the two dogs used during the
experimental parts of this thesis, without whom most of the concept validation would not
had been possible. I would also like to thank Shiva and Shrek, the two dogs, which are
very well trained and behaved in an exemplar manner. They provided excellent data and
tested the robustness of the device to the limit!
I would like to thank all my friends that always supported and guided me, and
especially to Républica dos Bananas family that offered me many years of great
companionship, fun and work.
A special thanks to all my family for caring and supporting me since forever.
A very big and special thank for Raquel Marques for putting up with me since so
long, and for providing help, advice, comfort, good humor and joy every day.

VI

VII
Abstract
Despite the recent progresses in robotics, autonomous robots still have too many
limitations to reliably help people with disabilities. On the other hand, animals, and
especially dogs, have already demonstrated great skills in assisting people in many daily
situations. However, dogs also have their own set of limitations. For example, they need
to rest periodically, to be healthy (physically and psychologically), and it is difficult to
control them remotely. This project aims to “augment” the Assistance dog, by developing
a system that compensates some of the dog weaknesses through a robotic device mounted
on the dog harness. This specific study, involved in the COCHISE project, focuses on the
development of a system for the monitoring of dogs activity and physiological
parameters.
Key-Words:
Assistance-Dog, Wearable devices, Remote monitoring, Assistive technologies,
Wireless, Signal processing, Respiratory Rate, Heart Rate, Behavior.

VIII

IX
Sumário
Apesar dos recentes avanços na área da robótica, os robôs autónomos ainda
apresentam demasiadas limitações para poderem assistir com segurança pessoas
portadores de deficiência. Por outro lado, vários animais, de entre os quais com especial
destaque o cão, já demonstraram grande capacidade em assistir pessoas em diversas
tarefas do dia-a-dia. No entanto, os cães também têm as suas limitações. Por exemplo,
precisam de descansar periodicamente, precisam de estar de boa saúde (física e
psicológica), e é complicado controlá-los remotamente. Este projeto visa “aumentar” o
cão de assistência, ao desenvolver um sistema que compensa algumas das fragilidades do
cão através de um dispositivo robótico montado no arnês do cão. Este estudo em
particular, enquadrado no projeto COCHISE, foca-se no desenvolvimento de um sistema
de monitorização da atividade e de parâmetros fisiológicos de cães.
Palavras-Chave:
Cão de Assistência, Dispositivo vestível, Monitorização remota, Tecnologias de
assistência, Sem-Fios, Processamento de sinal, Ritmo Respiratório, Ritmo Cardíaco,
Comportamento.

X
XI
TABLE OF CONTENTS
1. Introduction .............................................................................................................. 1
1.1. Motivation .......................................................................................................... 2
1.2. Goals .................................................................................................................. 2
1.3. Dissertation Structure ........................................................................................ 2
2. State Of The Art ....................................................................................................... 3
2.1. Assistance Dog .................................................................................................. 3
2.2. Augmented Dog ................................................................................................. 3
2.3. Dogs Health ....................................................................................................... 4
2.4. Measurements Invasiveness ............................................................................... 4
2.5. Measurement and Observation .......................................................................... 4
2.6. Data Acquisition and Processing ....................................................................... 5
2.7. Sensor Types and Characteristics ...................................................................... 6
2.8. Communication .................................................................................................. 7
2.9. Signal Analysis .................................................................................................. 8
2.9.1. Wavelets ..................................................................................................... 8
2.9.2. Common-mode rejection ............................................................................ 9
3. Proposal .................................................................................................................. 11
4. Development ........................................................................................................... 13
4.1. Selecting Components ..................................................................................... 13
4.2. First Version .................................................................................................... 14
4.2.1. Hardware .................................................................................................. 14
4.2.2. Software .................................................................................................... 16
4.2.3. Tests & Results ......................................................................................... 18
4.3. Second Version ................................................................................................ 20
4.3.1. Hardware .................................................................................................. 21

XII
4.3.2. Software .................................................................................................... 24
4.3.3. Tests & Results ......................................................................................... 25
4.4. Third Version (Final) ....................................................................................... 28
4.4.1. Hardware .................................................................................................. 28
4.4.2. Software .................................................................................................... 32
5. Experimental Results .............................................................................................. 39
5.1. Activity Detection ............................................................................................ 39
5.2. Respiratory Rate and Heart Rate ..................................................................... 40
5.3. Other Results .................................................................................................... 41
6. Conclusions & Future Work ................................................................................... 43
7. Publications & Presentations .................................................................................. 45
8. References .............................................................................................................. 47
Appendix ………....………………………………………............................................A1

XIII
FIGURE INDEX
Figure 1 - Schematic of signal transmission and reception between the dog and the owner.
.......................................................................................................................................... 1
Figure 2 - Difference Amplifier [C. Kitchin and L. Counts, A Designer’s Guide to
Instrumentation Amplifiers, 3rd Edition. Analog Devices, Inc, 2006, pp. 1–5] .............. 9
Figure 3 - Schematic of the connection between the Arduino Board and the JY-MCU
Bluetooth module. The dotted wire represents a pull-up resistor that is only connected
when the Bluetooth module needs to be programmed. .................................................. 14
Figure 4 - Schematic of the connection between the Sensors and Bluetooth Module with
the Arduino Board. ......................................................................................................... 15
Figure 5 – First application developed to assist during the sensors testing, with main
features identified: 1 – connection options, 2 – Channel selection, 3 – Signal window, 4
– FFT window, 5 – Data Analysis window. ................................................................... 17
Figure 6. Diagram of the experiment. The laboratorial equipment is represented in Blue,
while the Prototype elements are represented in Orange. The visualization tool is
represented in Green. The Green and Orange arrow represents the wireless Bluetooth
connection between the devices. The black arrows represent electrical connections
between components, while the black rectangle represents a physical connection between
the Shaker and the Sensor. .............................................................................................. 18
Figure 7. Permanent Magnet Shaker. Sensor fixated to the Shaker moving axis (Right
picture). ........................................................................................................................... 18
Figure 8. Signal Generator (Left) and Universal Counter (Right). ................................ 19
Figure 9. Example (@4,48Hz) of data acquired during the experiment. Original Signal
(top), FFT (bottom), peak Frequency detected (encircled in red). ................................. 19
Figure 10 - Shield Schematic.......................................................................................... 21
Figure 11 - Arduino with developed shield to connect the sensors and the Bluetooth
module, and 6xAA batteries to power the ensemble. ..................................................... 22
Figure 12 - Schematic of the protective Box made for the board. The base (left) and the
cover (right). ................................................................................................................... 22
Figure 13. The board inside the protective Box. Closed Box (large picture) and opened
Box (small picture). ........................................................................................................ 23

XIV
Figure 14 - Box, sensors and battery pack attached to the reflective coat using Velcro
Strips. .............................................................................................................................. 23
Figure 15 – Second application developed to assist during the sensors testing, with main
features identified: 1 – connection options, 2 – Channel selection, 3 – Signal window, 4
– FFT window, 5 – Data Analysis window. ................................................................... 24
Figure 16 - Shiva with the device installed on her back. ................................................ 25
Figure 17 - Accelerometer axis orientation, as they were placed on the dogs. .............. 25
Figure 18 - Y Axis read by the accelerometers. Blue: Walking, Red: Running. [Signal
length: 14s @25Hz]. (Vertical Axis: Amplitude; Horizontal Axis: Samples) ............... 26
Figure 19 - Y Axis read by the accelerometer (Median). A: Standing, A-B: Seating, B-C:
Seating more vertically, C-D: Standing. [Signal length: 1m 20s @25Hz]. (Vertical Axis:
Amplitude; Horizontal Axis: Samples) .......................................................................... 27
Figure 20 - Respiratory Rate. Blue: Z2-Z1 axis. Red: Median of the signal. [Signal length:
20s @25Hz]. (Vertical Axis: Amplitude; Horizontal Axis: Samples) ........................... 27
Figure 21 - Schematic of the developed board. .............................................................. 29
Figure 22 - Final board. .................................................................................................. 30
Figure 23 - Sensor/RJ45 adaptor schematic (left) and board (right). ............................. 30
Figure 24 - Finished boards. Main board with Bluetooth module on the left, and adaptor
with sensor on the right. ................................................................................................. 31
Figure 25 - Schematic of the protective Box made for the last version of the board. Base
(left) and cover (right). ................................................................................................... 31
Figure 26 - Final system placed on the dog harness. ...................................................... 32
Figure 27 - GUI showing the data captured by the accelerometers in real time. In the top
left signal, the option to display the FFT was activated. ................................................ 33
Figure 28 - Representation of the Activity identification rules. ..................................... 34
Figure 29 – Visualization of cmr. ................................................................................... 35
Figure 30 – Virtual dog representation. From drawing to 3D model. ............................ 36
Figure 31 – Rigged model ready for animation. ............................................................. 36
Figure 32 - Live information Window. .......................................................................... 37
Figure 33 - Example of the statistics made available to the user. .................................. 38
Figure 34 - System placed on Shiva, a female Pit-bull. ................................................. 39
Figure 35 – Wavelet analysis of a portion of the signal logged during an experiment with
the dogs. .......................................................................................................................... 40

XV
TABLE INDEX
Table 1. Short comparative between the relative range, power consumption, bandwidth
and price of Bluetooth, ZigBee, Wi-Fi, GSM/GPRS, IrDA, MICS devices. ................... 7
Table 2 - Tested Frequency (TF) Vs. Measured Frequency (MF). TF is the inputted
frequency in the motor, and MF is the Frequency at which a spike is detected in the FFT
performed by the PC. ...................................................................................................... 20
Table 3 - Activity transition Detection time. .................................................................. 39
Table 4 - Component cost distribution. .......................................................................... 41

XVI
1
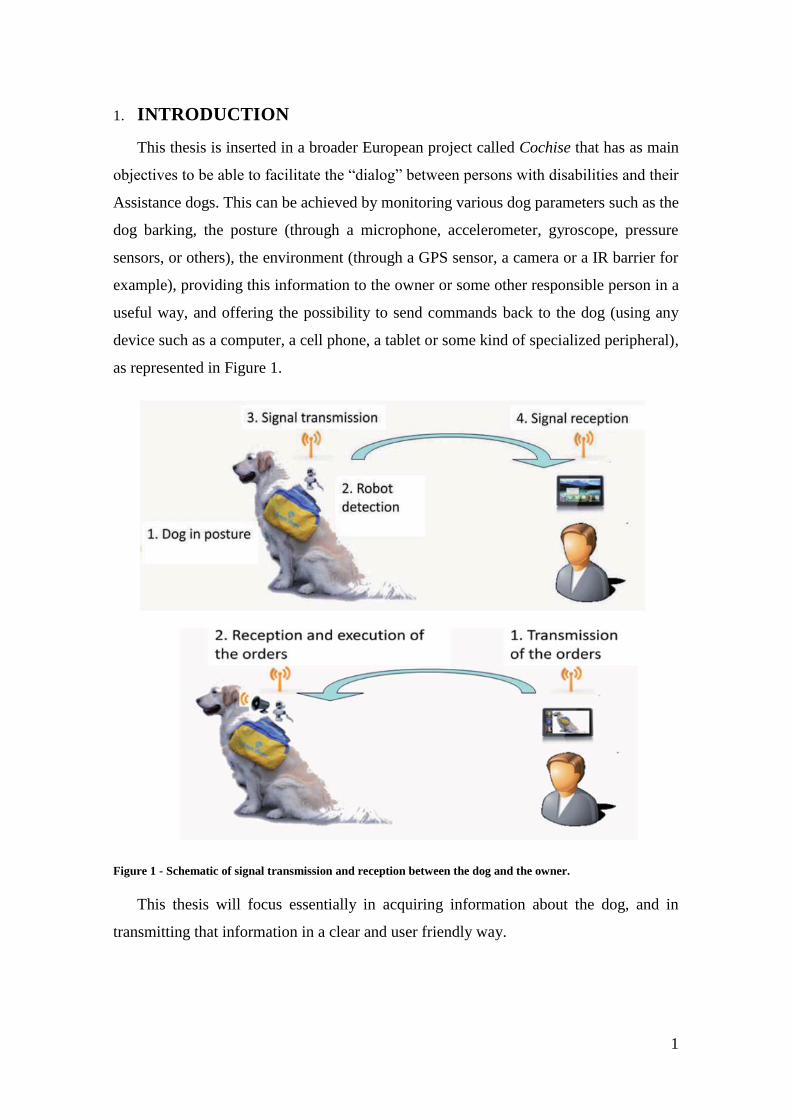
1. INTRODUCTION
This thesis is inserted in a broader European project called Cochise that has as main
objectives to be able to facilitate the “dialog” between persons with disabilities and their
Assistance dogs. This can be achieved by monitoring various dog parameters such as the
dog barking, the posture (through a microphone, accelerometer, gyroscope, pressure
sensors, or others), the environment (through a GPS sensor, a camera or a IR barrier for
example), providing this information to the owner or some other responsible person in a
useful way, and offering the possibility to send commands back to the dog (using any
device such as a computer, a cell phone, a tablet or some kind of specialized peripheral),
as represented in Figure 1.
Figure 1 - Schematic of signal transmission and reception between the dog and the owner.
This thesis will focus essentially in acquiring information about the dog, and in
transmitting that information in a clear and user friendly way.

2
1.1. Motivation
Inclusion and accessibility are concepts that are increasingly important in our
society, as well as the notions of animal well-being and respect. This dissertation offers
not only a way to work on both of those subjects, but also an opportunity to study,
understand, and maybe improve the millennial and very successful companionship and
relationship between dogs and humans.
1.2. Goals
The main goal of this thesis is to develop a device to study and analyse the
behaviour, health, and general well-being of dogs in real-time and continuously in order
to potentiate the Human/Dog relationship. With this goal in mind, the gathered
information should also be made available in a user friendly manner on a normal Personal
Computer (PC) and/or mobile device.
1.3. Dissertation Structure
The Second Chapter of this thesis will define the concepts of Assistance Dog,
Augmented Dog, Dogs Health, and Invasiveness as well as review the current state of
existing dog monitoring devices and the technology that is typically used for this kind of
devices, and for the one that it is aimed to be developed in this project.
In the Third Chapter the project proposal is presented by defining the kind of
device that will be developed as well as more specific goals that ought to be achieved.
The Forth Chapter describes the development stages of this project, with all
prototype versions, and intermediate results with respective conclusions.
The Fifth Chapter contains the experimental results achieved with the last version
of the device that was developed, followed by the conclusions and future work are
provided in the Sixth chapter.
3
2. STATE OF THE ART
2.1. Assistance Dog
In the European Union, in 2002, 16.4% of the population in working-age (16-64
years old) reported that they had a long standing health problem or disability [1]. One of
the existing ways to improve the mobility, autonomy, self-esteem and safety of this
significant portion of the population is through the use of assistance dogs.
The term Assistance Dog corresponds to the national (Portugal) and international
harmonized terminology to designate the various categories of assistance dogs for people
with disabilities, including guide dogs, earing dogs and service dogs [2]. In 2008, solely
in the European Union, over 13,000 people already benefited from this type of aid [3]. To
be able to have the assistance dog status, the animal must be educated and trained in an
establishment that meets quality and ethics standards, and that uses specially qualified
trainers [2], thus seeking to maximize the safety of every person involved, and also to
ensure the well-being of the animal.
2.2. Augmented Dog
Despite major advances in robotics, particularly in emulation and simulation of
mechanical behavior and intelligence of various types of animals, such robots still have
too many limitations in order to be able to assist people with disabilities. By contrast,
animals, among which the dog, have already demonstrated to be able to reliably assist
people in many everyday tasks. However, similarly to the robots, the dog also has its own
limitations [4], being one of the most important ones the necessity of guaranteeing the
dog’s well-being - both physical and psychological.
In order to take advantage of the strengths and minimize the weaknesses of each (the dog
and the robot) the concept of Augmented Dog arises. The aim is to “augment” the dog, to
facilitate human-dog interaction and vice-versa. This is done by placing, on the dog, a
small robot whose task is to mediate the interaction between the dog and the human. This
robot analyzes and interprets various behavioral and/or physiological signals from the
dog, and transmits them to the human. In turn, the human can react to this data by sending
a command to the robot that will trigger a reaction in the animal through a predetermined
stimulus for which the dog has been trained to react appropriately [4].

4
2.3. Dogs Health
Dogs can suffer from many kind of health problems, and while it’s obvious why
physiological and physical problems can directly impact the assistance dog performance
of its daily tasks, psychological problems can also lead to indirect consequences. For
example dogs can experience stress (both acute and chronic) due to a wide range of
situations such as a noisy environment, being restraint, an inappropriate training,
transportation, or housing, the presence of strangers, or when faced with completely new
or/and unexpected situations. In response, the animal may have a physiological or
behavioral reaction, both of them, or even one as a consequence of the other [5][6]. Many
behavioral indicators may be considered. For instance, tremors, circular locomotion,
posture, sighs, vocalizations, urination, the tail’s agitation (its frequency and direction),
and the panting [7]. Similarly, various physiological indicators can also be considered,
such as changes in the body temperature and heart rate [8], the heart rate variability [9],
the ratios between cortisol and creatinine, and also the amounts of catecholamine,
epinephrine, and norepinephrine measured in the urine [7][10].
2.4. Measurements Invasiveness
In order to study the different symptoms, both physiological and behavioral,
numerous methods can be used, some of which are more or less intrusive than the others.
There are three main categories that differentiate the degree of invasiveness of the
procedure: Non-invasive, invasive, and minimally-invasive. The non-invasive methods
are defined as those which do not require piercing the skin, do not require any contact
with mucous membranes, and do not require entrance trough body cavities – neither
natural nor artificial body cavities. Opposed to these methods are the invasive ones, which
are defined as those that require entrance through a body cavity, that disrupt normal bodily
functions, or as those which result in body perforation. Minimally-invasive methods are
invasive methods that attempt to perform the same procedure using techniques that allow
them to be accomplished through the smallest possible incision [11][12].
2.5. Measurement and Observation
As mentioned in section 2.3, stress in dogs may manifest itself through various
behavioral or physiological symptoms. Several methods are commonly used in order to
monitor each one. For instance, in order to study behavioral stress related symptoms, one

5
of the most common technique employed is through the usage of video recordings
[13][14] or photographs [15], or by observing directly the subject of the study. The
observation may or may not be made in real time, and may be made by one or more
persons [16][17], and it may also be made by strangers (in the dogs perspective) – the
persons conducting the study, professional veterinary personnel, or simply volunteers –
or directly by the owners through the completion of questionnaires [8][18]. In order to
study physiological symptoms, slightly more invasive techniques are typically used, such
as blood sample collection, the usage of electrodes that require to shave and clean areas
of the dog to perform ECG [9] and EMG [19] analysis, or to obtain blood pressure data
[5]. Other common ways are through urine sample collection, which usually require the
presence of a person in order to acquire a mid-stream sample [10], or by measuring the
body temperature – typically measured through rectal temperature – which requires a
momentary restraint of the dog [8].
2.6. Data Acquisition and Processing
In order to acquire signals from the real world into the devices that will process,
analyze and interpret them, specialized data acquisition systems (DAQ) or
Microcontrollers can be used. A DAQ device acts as a bridge between a computer and
the signals that are to be analyzed. In order to accomplish that, three main features are
used: The signal conditioning circuitry, the analog-to-digital converter (ADC), and the
computer bus. The signal conditioning component task is to manipulate the signal so that
it has an adequate form to input into an ADC, by using amplification, attenuation, filtering
and isolation circuitry. The task of the ADC is to sample periodically an analog signal in
such a way that it can be reconstructed after being transferred over the computer bus that
manages the communication between the DAQ device and the computer to which it is
connected. Typically they are connected through an USB, PCI, PCI Express or Ethernet
port, but can also be connected wirelessly through Wi-Fi [20].
For more dedicated functions, embedded systems can be preferable. Embedded Systems
are microprocessor or microcontroller based systems that are designed to a very specific
task and to be not reprogrammable by the end user [21][22]. While microprocessors
usually have a much higher processing power than microcontrollers, the fact that they
need to be assembled with external RAM, ROM, buffer, I/O ports, and more, makes them

6
more costly to design and develop. Since microcontrollers already have almost everything
built-in, this leads to more compacts and less costly products, making them a very good
choice for applications where very high processing power is not required [23].
2.7. Sensor Types and Characteristics
Choosing the correct sensor for the desired application is absolutely vital, as it can
be the difference between achieving the established goals or not.
Several types of sensors can be used as part of wearable health-monitoring
systems, and each type of sensing technology produces different kind of data about
different bio signals. One of the most commons (for humans) is the usage of Skin
electrodes that measure the electrical activity of the heart showing the contraction and
relaxation phases of the cardiac cycle, producing an Electrocardiogram (ECG). Similarly
the Heart rate and the Oxygen saturation can both be measured through a pulse oximeter,
allowing to measure the frequency of the cardiac cycle and the oxygenation level present
in the blood. Another very important measurement is the body’s ability to generate heat
as well as the ability to get rid of it. Generally the measurement of the body temperature
is made using temperature probes or skin patches. The Respiration rate is also many times
measured as a way of determining the number of respiration cycles (inspiration and
expiration) in a given time unit, generally using piezoelectric/piezoresistive sensors. To
measure the brain activity electrodes can be placed on the scalp in order to obtain an
electroencephalogram (EEG). To measure the electrical signals produced by the muscular
activity skin electrodes can be used, producing an electromyogram (EMG). The heart
sounds can also be obtained using a phonocardiograph. The heart sound (and indirectly
heart rate) is obtained by placing on the chest a microphone (stethoscope). The body
movement can also be measured by placing accelerometers in key points to measure the
acceleration forces produced by those movements [24].
An exhaustive list of sensor types is almost impossible to produce, as almost
anything can be used to measure directly or indirectly many variables that can be
indicative of the subjects health. For each situation, context, and respective requirements
(subject, mobility, autonomy, comfort, accuracy, etc.) a sensor can be more or less
adequate, and several options may be available.

7
2.8. Communication
Several technologies and different protocols are available to send data wirelessly
from a microcontroller to a mobile device such as through Bluetooth (IEEE 802.15.1),
ZigBee (IEEE 802.15.4), Wi-Fi (IEEE 802.11), GSM/GPRS, Infrared (IrDA) or the
Medical Implant Communication Service (MICS), each of which as some advantages and
disadvantages over the others depending of the application [24], as it is summarized in
the table below (Table 1).
Table 1. Short comparative between the relative range, power consumption, bandwidth and price of Bluetooth,
ZigBee, Wi-Fi, GSM/GPRS, IrDA, MICS devices.
Range Power
Consumption Bandwidth Price
Bluetooth Medium Low Medium Low
ZigBee Short Medium Low Low
Wi-Fi Medium High High High
GSM/GPRS Long Medium Medium High
IrDA Short Low Medium Low
MICS Short Low Low -
An exhaustive list of communication technologies and protocols would be almost
impossible to compile as a lot of protocols exist for almost every application, some of
which are proprietary. For each application one or more technologies may be more or less
suitable.

8
2.9. Signal Analysis
For many applications, signal processing is absolutely essential. This is especially
true in biomedical applications, where many times the signals that ought to be analyzed
are very low energy signals that can be easily lost amongst other signals or even noise.
Some techniques can simply consist of calculating the mean, power, or energy of
a signal. Many kind of filters can also be applied in order to extract the information that
is desired, but not everything can be filtered, and it’s one of the reasons that spectral
analysis, such as the Fast Fourier Transform (FFT), is very important to understand what
is being analyzed. Other tools can be used in different scenarios, such as Wavelets or the
Common-Mode rejection property.
2.9.1. Wavelets
While the FFT can be a very useful and powerful tool in signal analysis, it has its
own limitations. If the signal is non-stationary (i.e. the signal has time varying
frequencies), it may not be possible to determine if a signal component exists at a given
time. For non-stationary signals, the Short Fourier Transform (STFT), can be used. This
method performs FFT analysis on short windows of time where the signal is considered
stationary, producing a time-frequency result where it is possible to observe the changes
in frequency at a given time. [25] However the STFT also has a limitation. It has a uniform
resolution all along the time-frequency plane, meaning that some information may be lost
in both low and high frequency sides of the spectrum.
The Wavelet Transform (WT), similarly to the STFT, offers a decomposition of
the data in a time-frequency representation, with the difference that the WT adapts the
window size to the frequency, meaning that the time-frequency plane is non-uniformly
partitioned and more suitable for many real-world signals [26]. Various functions that
control how the resolution will change on the plane exist, and for that reason different
wavelets can be applied to a signal in order to obtain different results.

9
2.9.2. Common-mode rejection
Common-Mode rejection (CMR) is a very prevalent feature in electronics, and
particularly in biomedical electronics since it is at the core of instrumentation and
difference amplifiers (Figure 2).
Figure 2 - Difference Amplifier [C. Kitchin and L. Counts, A Designer’s Guide to Instrumentation Amplifiers,
3rd Edition. Analog Devices, Inc, 2006, pp. 1–5]
“An instrumentation amplifier is a device that amplifies the difference between
two input signal voltages while rejecting any signals that are common to both inputs”
[27]. While Instrumentation amplifiers offer superior isolation comparatively to
difference amplifiers they both perform the same operation. The property of canceling
out any signal that are common while amplifying differential signals is called Common-
Mode rejection (CMR). Many different implementations of the Common-Mode rejection
can be made, both electronically or in software.

10

11
3. PROPOSAL
During this thesis work, a device will be developed that shall allow the acquisition of
various kind of signals in order to be able to monitor remotely a wide range of parameters
from the dog. Since this thesis will focus on the acquisition and the transmission of
information, the system that will be developed does not need yet to take into account the
other systems that will be developed in other works of project Cochise group, which will
allow, remotely, the reception of instructions for the dog.
By developing this device, a clear objective is traced of reproducing the best from the
majority of existing monitoring/observation devices and techniques, and trying to answer
directly to their weak points and flaws.
To solve the insufficiencies from existing monitoring systems, several requirements
must be met. It must be low-cost, so that it is easily available to a large segment of the
population. So that we can monitor the dog permanently, it must be light and small,
wireless, and non-invasive. The device should also be able to produce scientifically
accurate data in real-time about the dog’s activity, behavior, and some physiological
parameters. Remote monitoring tools should also be made available, so that professionals
can scrutinize more acutely the dog’s health at any time, from anywhere. Since the
potential public for this kind of devices can be of different age groups and can be of
different backgrounds a clear and friendly user interface (UI) will have to be included in
this project. Summarizing, the device should have the following characteristics:
Low Cost
Light/Small
Wireless
Non-Invasive
Accurate and Unbiased
Real time analysis capabilities
Activity, physiological and Behavioural Monitoring
Friendly/Clear UI;

12
Ultimately, the objective is to produce a tool that is not only useful for granting the
dog’s well-being and for providing information to the owner, but also a tool that is useful
for dog trainers, healthcare professionals, ethologists and other scientists.

13
4. DEVELOPMENT
4.1. Selecting Components
To begin with, it was important to select the three main components that the device
needed to have: Data acquisition, Sensors and Wireless communications.
Firstly, the sensors had to be chosen since depending on the type of data and
communication protocols from the sensors, different data acquisition devices could be
more or less suitable. After considering several options, it was decided to use two
MPU6050 accelerometer/gyroscope. The fact that accelerometers do not need to be in
direct contact with the dog skin was the main motivation for using this type of sensors,
because it means that it is possible to perform measurements without shaving the dog,
and consequently it implies that it is easier to place it correctly and for longer periods of
time. Other characteristics were also considered for this decision, such as the small form
factor of this kind of sensors, the robustness, and the lightness. Choosing, more
specifically, the MPU6050 happened since it offers good performance and sensibility at
a low cost. The fact that it encompasses also a gyroscope meant that more useful data
could be extracted.
Having selected the sensor, it was now possible to choose a data acquisition
device. The choice fell on the popular Arduino Uno. It offers enough processing power,
good communication option, and it is cheap. Overall it is a good prototyping tool, easy to
program with extended documentation available and with a very comprehensive set of
free open source libraries.
To communicate wirelessly, the chosen option was to use a Bluetooth module,
since it offers a good range/power-consumption ratio. They are also cheaply available,
and with the price in mind as a differentiating factor the preferred Bluetooth module was
a JY-MCU.
Having selected all three main components it was now possible to start building
the device, always keeping in mind the system requirements previously defined in the
project proposal.

14
4.2. First Version
Not only it was necessary to setup the devices, but also the real capabilities and
sensibility of the sensors were unknown and needed to be explored. To accomplish this,
some hardware and software had to be put together.
4.2.1. Hardware
Main Components:
(1) Breadboard;
(1) Arduino UNO;
(1) JY-MCU Bluetooth Module;
(2) MPU6050.
Initially an Arduino board was connected to the computer through a Serial
connection. The microcontroller (MC) was programmed to send a simple text message to
the computer. Once the text was successfully received the Bluetooth module was added
on a breadboard and connected to the Arduino.
Figure 3 - Schematic of the connection between the Arduino Board and the JY-MCU Bluetooth module. The
dotted wire represents a pull-up resistor that is only connected when the Bluetooth module needs to be
programmed.
The MC was then programmed to send the same text message to the computer,
but now using the Bluetooth module instead. On the computer, the terminal emulator
PuTTY was configured to receive the Bluetooth data with the following parameters:
10 K
ST
AT
E
RX
D
TX
D
GN
D
VC
C

15
Speed (baud): 9600
Data bits: 8
Stop Bits: 1
Parity: None
Flow Control: None
After having successfully received the text message, connecting the pull-up
resistor (as shown in Figure 3), the command AT+BAUD8 was sent to the Bluetooth
device to change its baud rate to 115200. Changing the previous configuration of PuTTY
to include the new baud rate, the message was again successfully received, confirming
that the baud rate had indeed changed. Having the communication set and running, the
system was now ready to start reading data from the sensors.
Both MPU6050 accelerometer/gyroscope sensors were simultaneously connected
to the Arduino Board, using initially a small breadboard to simplify the connections
between the sensors and the board. Both sensors share almost every wire with the
exception of the AD0 pin, as represented in Figure 4. This difference in the AD0
connection defines if the sensor will be set to use the default I2C address (0x68) or the
alternative one (0x69) when set as high, as defined in the MPU6050 Arduino library. In
this case it is desired that both sensors run simultaneously, therefore they must have
different addresses.
Figure 4 - Schematic of the connection between the Sensors and Bluetooth Module with the Arduino Board.
After setting up the connections as described above, the MC was programmed to
read the data from the 3 accelerometer axis and the 3 gyroscope axis of both sensors, and
to send those twelve variables via Bluetooth. Re-using the configurations previously used,
VCC (3,3V)
GND
SCL
SDA
16
the data was successfully read again in the computer. With everything connected and
communicating correctly an exact sample rate had to be defined in order to be able to read
the data without suffering any aliasing errors due to incorrect down sampling operations.
From all the signals that are going to be analyzed, the one that has the widest range
of frequencies is the respiratory rate. The respiratory rate of a dog can fluctuate between
0.16 Hz and 4 Hz (for an average resting dog the breathing rate is approximately 0.4 Hz)
[28], and knowing that the maximum frequency value that the FFT comprises
is 𝑓𝑠𝑎𝑚𝑝𝑙𝑖𝑛𝑔/2, the minimum sample rate would need to be 12 Hz. To play on the safe
side, and to be able to observe other phenomena, it was decided that the sample rate should
be 25 Hz.
Initially the Arduino function millis was used to measure the time elapsed, and to
read and send the sensors data each 1/ 𝑓𝑠𝑎𝑚𝑝𝑙𝑖𝑛𝑔 seconds, but after some initial tests it
was quickly established that this method lacked the precision required.
The program was then re-written to use the MC timer interrupts instead of millis.
In order to avoid possible aliasing problems, the sample rate of the sensors was lowered
changing the RA_SMPLRT_DIV register to 0x27 (0x27 = 39d, and 10000/ (39+1) = 25
Hz). The main loop of the program reads the data as fast as it can, and when the Interrupts
fires the program sends the data over Bluetooth. On the Arduino side, using the function
millis to print the elapsed time between Interrupts, it was verified that the precision was
very high. Nevertheless the time between the incoming data on the computer was the real
important variable, and in order to make these measurements some software had to be
written.
4.2.2. Software
In order to measure the elapsed time between messages, a program was written in
C# to record a text file containing the system time on each message received. Analyzing
that data in Excel it was possible to verify that the data arrived with very precise intervals
of time. Several frequencies were tested changing the Interrupt Timer value, and the
results kept following the expected values. After this first validation, some additional tests
had to be done, which required a more elaborate program to be written.
In this new program a graphical user interface (GUI) was developed to enable a
real time analysis of the data read, and to allow a intuitive correlation with the actions
performed on the sensors. When the user launches the program he must establish the
connection with the device. For that a Bluetooth icon is placed on the lower left corner of

17
the window (identified as feature 1, in Figure 5 below), where after being clicked it
expands a small menu prompting to choose between the devices that the program find
connected to the computer. In the same area, a small recording button is placed to enable
or disable the file recording option. After having successfully established the connection
between the PC and the device, the user should select which axis signal from which
accelerometer should be displayed (feature 2, in Figure 5). After selecting one or more
options the signal is displayed in real time in the Signal window (feature 3, in Figure 5),
and simultaneously the FFT Window (feature 4, in Figure 5) displays also in real time the
FFT performed over a 125 samples window (5 seconds @25Hz). Separately in the Data
Analysis window (feature 5, in Figure 5) for the same 125 samples window, the extracted
signal mean value, power, energy, and two main signal frequencies are displayed.
Figure 5 – First application developed to assist during the sensors testing, with main features identified: 1 –
connection options, 2 – Channel selection, 3 – Signal window, 4 – FFT window, 5 – Data Analysis window.
Multitasking capabilities had to be implemented, using Background Workers in order to
preserve the flow of incoming data without losing the ability to display the data in real
time.
After having completed this tool everything was ready to test the system has a
whole.
2
3
4 1
5

18
4.2.3. Tests & Results
Having passed successfully the intermediate tests that were performed along the
build, a final one was devised. This last test consisted on placing one of the sensors on a
Permanent Magnet Shaker (PMS) (Figure 7) set to shake at a predetermined frequency
and measuring the frequency of the received signal using a Fast Fourier Transform (FFT),
as shown below, in Figure 6.
Figure 6 - Diagram of the experiment. The laboratorial equipment is represented in Blue, while the Prototype
elements are represented in Orange. The visualization tool is represented in Green. The Green and Orange
arrow represents the wireless Bluetooth connection between the devices. The black arrows represent electrical
connections between components, while the black rectangle represents a physical connection between the Shaker
and the Sensor.
Before starting the experiment, one of the sensors was attached to the PMS (LDS V406)
Figure 7 - Permanent Magnet Shaker. Sensor fixated to the Shaker moving axis (Right picture).
Signal Generator
Shaker Sensor
Microcontroller BT PC

19
The Permanent Magnet Shaker (PMS) oscillation frequency was controlled using
a signal generator outputting a sinusoidal wave at a determined frequency. For each
frequency tested, the frequency was fine-tuned using a universal counter to visualize its
exact value, as depicted in Figure 8.
Figure 8 - Signal Generator (Left) and Universal Counter (Right).
Keeping the amplitude of the generated wave always constant, the frequency was
progressively increased, from 0.5 Hz to 5 Hz, increasing 0.5 Hz on each step. The signal
measured by the sensors is transmitted via Bluetooth to the PC where a program displays
the original signal, the FFT of the signal (performed continuously on a 128 samples
window), as well as the two main frequencies detected. The two main frequencies are
displayed to be able to identify the peak frequency of the signal when the DC component
(0 Hz) is bigger than the amplitude of the imputed signal by the PMS, this can happen
since those operations were performed on an unfiltered signal (Figure 9).
Figure 9- Example (@4,48Hz) of data acquired during the experiment. Original Signal (top), FFT (bottom),
peak Frequency detected (encircled in red).

20
The results of this experiment, for every tested frequency, are shown in the table below
(Table 2) where it is possible to observe the little difference between the inputted and the
measured frequencies.
Table 2 - Tested Frequency (TF) Vs. Measured Frequency (MF). TF is the inputted frequency in the motor,
and MF is the Frequency at which a spike is detected in the FFT performed by the PC.
TESTED
FREQUENCY (HZ)
MEASURED
FREQUENCY (HZ)
0,48 0,56
0,99 0,97
1,49 1,56
2,00 2,10
2,50 2,40
3,00 3,10
3,50 3,51
4,00 3,90
4,48 4,49
5,06 5,07
Having achieved the expected quality, some changes to the board had to be done in
order to be able to proceed to the next phase of the project. Also, despite having obtained
satisfactory results, some software problems were identified. The program became very
slow after some time, or if selecting more than one signal do display, and sometimes it
even froze or lost the connection. All of these problems were to be addressed in the next
version of the program.
4.3. Second Version
After the first test, and needing to test the sensors on dogs, the breadboard and all
the messy wiring on it needed to disappear. The fastest way to transfer the breadboard
wiring and connections to a cleaner setup in order to be able to test it on the field, was to
develop a shield for the Arduino Board.

21
4.3.1. Hardware
Main Components:
(1) Arduino UNO;
(1) JY-MCU Bluetooth Module;
(2) MPU6050;
(1) Perfboard;
(1) 6xAA Battery holder.
To make the shield, connectors were placed to fit correctly on the Arduino board,
and then the other connectors (for the Bluetooth (BT) module and for the sensors cables)
were also soldered to a Perfboard, as shown in Figure 10. In this figure we can also see,
in yellow and in red, how the 3,3V and 5V lines, respectively, are distributed on the board.
The communication connection are shown in green (serial connection between the BT
module and the Arduino, and I2C between the sensors and the Arduino).
Figure 10 - Shield Schematic.

22
Figure 11 - Arduino with developed shield to connect the sensors and the Bluetooth module, and 6xAA batteries
to power the ensemble.
Each connection was verified with a Multimeter before placing the shield on the
Arduino Board, and before connecting the accelerometers and the BT module. After this,
the board was powered and the VCC and Ground values of each header were verified
(3,3V for the sensors, and 5V for the BT module). Then the BT module was added (Figure
11) and a test message was successfully received from the board. Finally the sensors were
connected, and the values were also correctly received.
To protect the board, a small incasing was made using a Honey-Comb Polyethylene
sheet and adhesive tape. The design used for the box is shown in Figure 12, where cuts
were made afterwards to allow the connection of the sensor cables and the power source.
Figure 12 - Schematic of the protective Box made for the board. The base (left) and the cover (right).

23
The board was now protected against impacts (Figure 13), thus meaning that it was
ready for its first real field test.
Figure 13 - The board inside the protective Box. Closed Box (large picture) and opened Box (small picture).
After this, the box still needed to be attached to the dog, and the sensors needed to be
held on the correct position. For that, a simple Reflective Coat was used as support. The
box and the sensors were attached to it using Velcro strips, as is shown in Figure 14.
Figure 14 - Box, sensors and battery pack attached to the reflective coat using Velcro Strips.

24
However the software on the computer still needed to be improved before having the full
system completely ready.
4.3.2. Software
In the previous version of the program some lack of responsiveness, freezes and
disconnections were sometimes experienced. To solve this problems most of the program
was completely rewritten in an effort to optimize a lot of the functions previously written,
and also to take advantage of multicore processors found in most of today’s computers
by using paralleling techniques to speed up some commonly used functions. The user
interface (UI) was mostly kept the same, but nonetheless some changes were
implemented. The Analysis window that was previously detached from the rest was now
integrated in the main window UI (feature 5, in Figure 15), and also includes information
about the temperature read by the sensors. Still in the same window, some information
that was shown previously in real time was now omitted (such as the signal Energy and
Power), since it was considered secondary for this stage of the project, and because it
could also help speeding up the program. Another change was the inclusion of more
options in the axis selection field (feature 2, in Figure 15), and the addition of a filtering
option, as well as some visual information about the status of the connection, recording
and filtering (feature 1, in Figure 15).
Figure 15 – Second application developed to assist during the sensors testing, with main features identified: 1 –
connection options, 2 – Channel selection, 3 – Signal window, 4 – FFT window, 5 – Data Analysis window.
1
2
3
4
5

25
Having at this point improved both the hardware and the software, a new round of tests
could now be performed.
4.3.3. Tests & Results
The system was tested on two
dogs. Shiva, a female Pit-bull, and
Shrek, a male Boxer. One
accelerometer was placed on each
side of a dog’s coat, while the
board and batteries were placed in
the center, as show in Figure 16.
The placement and orientation
of the sensors were chosen so that
it would be possible to use a
common-mode rejection method
to clean the signal of undesired
movements, and to be able to amplify the respiratory movement (since the chest will
expand in opposite direction on each side).The sensors on the dog were placed in such a
manner that the accelerometers +X axis pointed to the front of the dog, the +Y axis
pointed towards the floor, and the +Z axis pointed to the outside of the dog (in opposite
directions), as depicted below in Figure 17.
Figure 17 - Accelerometer axis orientation, as they were placed on the dogs.
Front (Head) Back (Tail)
Left
Right
+X2
+Z2
+Y2
+X1
+Z1
+Y1
Figure 16 - Shiva with the device installed on her back.

26
The raw data from the sensors was recorded while one of the dogs performed some simple
tasks: walk, run, seat and laydown. At the same time a video recording was made to
correlate some of the data with real actions performed by the dog. The procedure was
then repeated with the other dog.
Knowing the placement and orientation of the sensors, and in order to clean the signal,
a Common-Mode Rejection method was used. In Matlab, the value of X1 and X2 were
summed, as well as the values of Y1 and Y2, obtaining by that manner cleaner X and Y
axis results. Similarly for the Z axis, Z1 was subtracted from Z2 (since they point in
opposite directions on the same axis), obtaining also a cleaner Z axis measurement.
Observing the Y axis data, it was easily recognizable whether the dog was walking,
running, or stationary. While stationary, it was also possible to determine if the dog was
standing/laying or seating. The activity can easily be read through the signal amplitude
(Figure 18), while the position can be read by Y+ vector amplitude value. If the dog is
standing the vertical component (Y+) will be high because it is aligned with the gravity
force vector, while in the seating position the Y component will make an angle with the
same gravity vector, reducing the value that is read by the accelerometer (Figure 19).
Figure 18 - Y Axis read by the accelerometers. Blue: Walking, Red: Running. [Signal length: 14s @25Hz].
(Vertical Axis: Amplitude; Horizontal Axis: Samples)

27
Figure 19 - Y Axis read by the accelerometer (Median). A: Standing, A-B: Seating, B-C: Seating more
vertically, C-D: Standing. [Signal length: 1m 20s @25Hz]. (Vertical Axis: Amplitude; Horizontal Axis:
Samples)
On the other hand, the Z axis is better to provide the dog’s respiratory rate, since
the thorax of the dog moves outward and inward, simultaneously on the same Z axis but
in opposite direction of each sensors, see Figure 20.
Figure 20 - Respiratory Rate. Blue: Z2-Z1 axis. Red: Median of the signal. [Signal length: 20s @25Hz].
(Vertical Axis: Amplitude; Horizontal Axis: Samples)
Analyzing the X axis data, a signal that could possibly correspond to a heartbeat
was detected. Unfortunately both, respiratory and heart rate, signals are very low energy
signals, and for that reason they are easily obscured by the movements of the dog, coat,
or sensors. In order to confirm these results the experiment will be repeated, with some
modifications.

28
4.4. Third Version (Final)
Since some robustness problems were encountered with the previous version of the
hardware, different connectors and different cables ought to be used. It was equally
desired to consolidate the microcontroller and the connectors on one board to minimize
the components that can unplug them self, such as the shield. That hardware change led,
further away, to a software change. A more fitted coat was also selected in order to
minimize undesirable movements.
4.4.1. Hardware
Main Components:
(1) ATMega328P (microcontroller);
(1) JY-MCU Bluetooth Module;
(2) MPU6050;
(1) 6xAA Battery holder.
To solve the problems identified in the previous version, such as the shield
unplugging momentarily if the dog made very abrupt movements, or the cables breaking
after some time due to the stress induced by the constant movements of the dog, it was
decided to use a CNC Router (a Technodrill C11000 with GALAAD software from C.I.F.)
to mill a PCB on a copper sheet to integrate all the components possible in one board.
The only component that was not integrated was the Bluetooth module since it would
have unreasonably augmented the complexity of the project, and was for that reason
deemed unnecessary for this stage of the project. Additionally, it was decided to use RJ-
45 connectors and cables to connect the sensors to the board. This decision was made on
the basis that RJ-45 cable are robust, easily repairable and easily replaceable if necessary
since they are widely available everywhere.

29
Following that decision, schematics were created in Eagle from Cadsoft. The main
board has as main component the microcontroller, and everything gravitates around it, as
can be seen on Figure 21. On the top of the same figure, from right to left, we find the
LED power indicator light, the 5V voltage regulator that powers the microcontroller and
the Bluetooth module, and the 3,3V voltage regulator that powers the sensors. On the left
of the microcontroller we find the reset button, and the external crystal oscillator that
determines the operating frequency. On the right side we find the connectors for both
sensors, as well as the connector for the Bluetooth module.
Figure 21 - Schematic of the developed board.
After the schematic is created, the board is generated by the Eagle software. The auto-
router tools rarely produce adequate results, and for that reason the routes were manually
designed, resulting in the board in Figure 22.

30
Figure 22 - Final board.
Having completed the design for the main board it was still necessary to create an
adaptor between the sensors 8 pins and the RJ-45 plug. For that reason, another very small
board was designed (one for each sensor), resulting in the schematic and board observable
in Figure 23 (right and left side of the figure, respectively).
Figure 23 - Sensor/RJ45 adaptor schematic (left) and board (right).
The boards were then milled in the CNC router, and the components placed and
soldered. Every connection was then checked one-by-one using a Multimeter to simplify
any future debugging needs, resulting then in Boards show in Figure 24.

31
Figure 24 - Finished boards. Main board with Bluetooth module on the left, and adaptor with sensor on the
right.
Finally a new box had to be made to fit, support and accommodate the main board. It was
fabricated in Foamcore following the design on Figure 25.
Figure 25 - Schematic of the protective Box made for the last version of the board. Base (left) and cover (right).
The box containing the main board, the battery pack and a small power on/off switch
were placed on a Julius K9 IDC dog harness with Velcro strips (Figure 26).

32
Figure 26 - Final system placed on the dog harness.
4.4.2. Software
During some initial tests the device did not seem to be responding as it should.
There was a huge delay between readings and the device disconnected very frequently.
Having already previously verified all connection on the board and sensor adapters, the
problem could only be originated by the software. However since it was the same as
previously used and no problems of this magnitude were encountered the problem had to
come from somewhere else. Excluding the boards and the software, the only components
left were the cables. Using a Multimeter the impedance of the cables was measured to
about 100 Ω, which is much more than the impedance of the cables used previously, that
was measured to 2,5 Ω. It was then conjectured that the difference in impedance had to
be slowing down the request (by the microcontroller) and the response (by the sensors)
so much that it created conflicts. One of the solutions that came up was to accelerate the
process between requests so that the probability of conflicts was reduced. With that in
mind, it was decided to remove the implementation of the interrupts that was previously
done and to replace it by a free and open source library for Arduino called timer.h. After
some additional tests this seemed to have solved completely the problems that were
initially encountered and it was now possible to carry on with the software improvements
on the computers side.

33
Despite all the improvements done in the second version of the program,
sometimes it still displayed some slowness and would sometimes lose the connection with
the device. Having already optimized a good portion of the code the decision was made
to abandon entirely the C# programming language and to start over from scratch in
another programming language. After some research the decision was made to use Python
since it is a light and efficient language, with plenty of free and open-source libraries. The
main library that was used was PyQTGraph which is a Graphics and GUI library
optimized for speed.
After some preliminary tests the results were very encouraging, and for that reason
it was quickly adopted and the rest of the program converted to Python language. The
GUI developed allows to observe the 3 acceleration axis from both sensors in real time,
with an option from the context menu to observe the FFT of one or more axis at the same
time, as it can be seen in Figure 27.
Figure 27 - GUI showing the data captured by the accelerometers in real time. In the top left signal, the option
to display the FFT was activated.
Having solved all the slowness and instability from the earlier versions, the next
step was to implement the detection rules based on the data resulting from the previous
experience.

34
4.4.2.1. Activity Detection
Initially the mean value of the signals, and the amplitude (maximum value – minimum
value) are calculated, and after that the following rules are applied:
If the Amplitude is < 10.000 then:
a. If the mean is > 10.000, the dog is standing still.
b. Else the dog is seating.
Else, if the amplitude is <50.000, the dog is walking.
Else, the dog is running.
We can interpret the rules above as the following: If the dog is not moving very much, it
is standing or seated, but if he is close to perpendicular to the gravity vector (the gravity
is read by the sensor as 19.600), then it is standing and not seated, and vice-versa. If the
dog is moving but not too much as to saturate the sensors, then it is walking, otherwise it
is running. Visually this can be interpreted as show in Figure 28.
Figure 28 - Representation of the Activity identification rules.
y y
t t
10
5
Standing Seated
y y
t
10 10
Walking Running
t

35
4.4.2.2. Breathing Rate Detection
To detect the Breathing Rate the common-mode rejection property is used to
amplify the respiratory movement and to attenuate any other unwanted movement (Figure
29)
Figure 29 – Visualization of CMR.
This is done by subtracting the value read on the axis that point outwards (Z axis
on Figure 17) by each one of the accelerometers on each side of the dog. That way the
respiratory movement will show up as a small force exerted in opposite direction (chess
expansion and contraction), while almost all forces that are exerted on the sensors due to
movement show up in the same direction, and by subtracting these values it is then
possible to retrieve the desired signal, without the interference from the other. Aside from
that, a band-pass filter is also applied between 0,25Hz and 6Hz. Then, to detect the
respiratory rate an FFT of the signal is performed over a 5 seconds window, and the
frequency with the most energy is identified. That frequency corresponds to the
respiratory rate.
4.4.2.3. GUI
Simultaneously, another GUI was developed, since the graphics displayed in real
time are not very informative to the untrained eye and the data that we can extract has to
be made available in an environment that is friendly to everyone, with any age.
(Right)
Zright – Zleft
t
+Z
+Z
t
-Z
Z1
Z2
t
(Left)

36
For that reason, a virtual dog representation was modeled (Figure 30), rigged, and
animated (Figure 31), using the software Cinema4D. The avatar shows what activity (in
a caricatured way) is being performed by the dog in a very friendly and easy to understand
manner, in real time. This aims to reinforce the owner’s consideration for the information
that is being displayed, especially for younger owners or family members.
Figure 30 – Virtual dog representation. From drawing to 3D model.
Figure 31 – Rigged model ready for animation.
To display the dogs activity a virtual environment was created in Unity3D, and
exported to a web player so that in can be integrated in a standard webpage, the designated
UI interface. This decision was made so that nothing had to be installed by the user
(except the Unity3D plugin), and so that it can be kept always up to date without any user
effort. The web interface also allows remote monitoring capabilities by the owner, a
family member, a caretaker or by a veterinary professional.

37
The PHP webpage, besides displaying the avatar, also indicates in real time the
dog’s respiratory rate, as well as the environment temperature, as shown in Figure 32.
The live information is auto updated using JavaScript.
Figure 32 - Live information Window.
In addition to that live information, the user can also access three other tabs
containing statistical information about the last 24 hours, the last 7 days, or the last 30
days, in the daily, weekly and monthly tabs respectively. On each of this tabs a pie chart
showing the distribution of the dog’s activities (as a percentage) along the chosen
timeframe is displayed. Bellow that chart, another chart shows the evolution of the
respiratory rate and of the temperature along the same timeframe previously chosen
(Figure 33). This statistical information is automatically generated using the data that is
periodically uploaded to the server’s (MySQL) database by the Python script. The
graphics are then created using JavaScript through Google Charts application
programming interface (API).

38
Figure 33 - Example of the statistics made available to the user.
Having finished all this hardware and software changes in this third – and final –
version of the prototype, all was ready to another field test on dogs.

39
5. EXPERIMENTAL RESULTS
To test everything that was implemented in this final version, the system was installed
again on the dogs (Figure 34) who were asked to perform a number of tasks, such as
seating, running, walking and standing still.
Figure 34 - System placed on Shiva, a female Pit-bull.
5.1. Activity Detection
The activity detection algorithm, while the dog’s transits from an activity to
another, may in some situations detect the change accurately instantaneously, but in other
situations it may need some more time to correctly identify the event, as summarized in
Table 3. Nonetheless the algorithm gets a 100% accurate response after a maximum time
equivalent to the rolling window time (defined to be 5 seconds in this experiment) on
which the analysis is performed.
Table 3 - Activity transition Detection time.
From [ ↓ ] to [] Steady Sitting Walking Running
Steady Within 5s Instantaneous Instantaneous
Sitting Within 5s Instantaneous Instantaneous
Walking Within 5s Within 5s Instantaneous
Running Within 5s Within 5s Within 5s

40
5.2. Respiratory Rate and Heart Rate
Analyzing the logged data in Matlab and applying the algorithm explained in
4.4.2.2 but using a Wavelet analysis instead of the FFT, allowing to do a time-frequency
analysis, it is possible to easily identify (by visual observation) the breathing rate, as can
be seen in Figure 35.
Figure 35 – Wavelet analysis of a portion of the signal logged during an experiment with the dogs.
Unfortunately this only works when the dog is not moving too much, meaning
that the auto-detection algorithm should only try to identify the breathing rate when the
dog is almost completely motionless. Also, albeit being able to do it visually at moments,
the heart rate was not easily isolated from the noise, foiling the implementation of any
automatic heart rate detection algorithm in this device. One way of overcoming this would
be to augment the resolution of the data that is read by increasing the sample rate, but this
leads directly to a waste of bandwidth and also to a misuse of processing power that is an
important factor, especially for mobile and embedded applications such as this one.

41
5.3. Other Results
Alongside the results previously discussed, it is also important to note that the final
version of the prototype was very robust and physically stable even in rough conditions
such as the dogs rubbing against people, wet-dog shaking, or jumping, running and
frolicking around.
Equally important, the device did not seem to bother or distract the animals in any
way, despite the (unnecessary) long cables and the sensors not being in the most
ergonomic shape or smallest form factor possible. Also worth mentioning, the GUI kept
responsive throughout the experiment and provided accurate data both in real-time and
for further analysis.
Price wise, the final board has a cost distribution as shown below in Table 4, with a
final cost inferior to 30€.
Table 4 - Component cost distribution.
Component Price 1
MPU6050 accel/gyro 2*7,50 €
Microcontroller ATMega328P 1,50 €
JY-MCU BT module 5,50 €
PCB Copper board 0,75 €
RJ-45 8-Pin Connector 4*0,55 €
Other electronic components 2 < 5€ 3
TOTAL < 30€
Similarly to the former development stages, this version could also be improved in
many ways, as it will be discussed in the next chapter.
1 Online prices with shipping included, as available in July 2014. 2 Resistances, capacitors, oscillator, power regulators, led, and push button 3 These components were free for this project as they were donated by the University.

42

43
6. CONCLUSIONS & FUTURE WORK
The main purpose of this thesis was to develop a device that would be able to monitor
the dog’s health and activity continuously. While not all final applications of the project
were accomplished in time, the results that were obtained allow us to understand that the
correct approach was applied and that with more developing time, much more can be
achieved from the device and techniques developed. Nonetheless, a fully autonomous
wireless device that uses a totally non-invasive system was developed with the ability to
provide real-time information in a very friendly interface, continuously, 24/7. To stress
the fact that the whole system preserves the dog’s comfort and natural behavior. Also
very important, the low cost aspect of the device was successfully conserved, with a final
cost of about 30€. The only main unachieved goal was the heart rate readings, which
could be possible to achieve increasing the sample rate of the device but with the trade-
offs that this implies.
This device may not only provide interesting information to the owner about the dog’s
well-being, but also provide essential information about the behavior and health of the
dog in a long-term perspective, allowing the owner to observe small changes in behavioral
patterns that would otherwise be invisible. This can also be very useful for ethologists
that ambition to better understand all kind of animal’s behaviors.
Despite all this project successes a lot more can still be improved, such as
miniaturization of the boards using SMD components that would allow us to reduce the
weight and size to at least a third of the current one. This step would also improve greatly
the robustness of the device and its battery consumption.
Software wise, instead of using the unity3D plugin for the 3D avatar, a webGL
solution could be implemented. This would allow the interface to fully work in any PC
or smart phone with a modern browser installed without the need to install additional
plugins.

44

45
7. PUBLICATIONS & PRESENTATIONS
During this thesis, an article (in Appendix) was published with the following
reference: Seabra, J., Rybarczyk, Y., Batista, A., Rybarczyk, P., Lebret, M.C., and
Vernay, D. (2014) "Development of a wearable monitoring system for service dogs."
IEEE Roman’14, Workshop on Wearable Technology and Human-Wearable Robot
Interaction. Edinburgh, UK, 25th of August.
This article was presented in IEEE Roman’14, Workshop on Wearable Technology
and Human-Wearable Robot Interaction in Edinburgh, UK, on the 25th of August.

46

47
8. REFERENCES
[1] P. B. Eurostat Press Office, “One in six of the EU working-age population report
disability,” Closing Ceremony of the European Year of People with Disabilities,
2003. [Online]. Available:
http://epp.eurostat.ec.europa.eu/cache/ITY_PUBLIC/3-05122003-AP/EN/3-
05122003-AP-EN.HTML. [Accessed: 22-Oct-2013].
[2] “Cães de Assistência - Decreto-Lei no 74, 27 de Fevereiro.” Diário da Répública,
Portugal, 2007.
[3] IFAH-Europe, “Facts and figures about the European animal health industry,”
2008.
[4] Y. Rybarczy, D. Vernay, P. Rybarczy, M.-C. Lebret, D. Duhaut, G. Lemasson, S.
Pesty, and P. Lucidarme, “COCHISE Project : An Augmented Service Dog for
Disabled People,” AAATE 2013, pp. 109–114, 2013.
[5] B. Beerda, M. B. H. Schilder, J. A. R. A. M. Van Hooff, and H. W. De Vries,
“Manifestations of chronic and acute stress in dogs,” vol. 1591, no. 31, 1997.
[6] C. Diederich and J.-M. Giffroy, “Behavioural testing in dogs: A review of
methodology in search for standardisation,” Appl. Anim. Behav. Sci., vol. 97, no.
1, pp. 51–72, Mar. 2006.
[7] B. Beerdal, M. B. H. Schildert, J. van Hooff, and J. A. Moll, “Behavioural and
Hormonal Indicators of Enduring Environmental Stress in Dogs,” no. Animal
Welfare, pp. 49–62, 2000.
[8] N. Ogata, T. Kikusui, Y. Takeuchi, and Y. Mori, “Objective measurement of
fear-associated learning in dogs,” J. Vet. Behav. Clin. Appl. Res., vol. 1, no. 2, pp.
55–61, Sep. 2006.
[9] K. Maros, A. Dóka, and Á. Miklósi, “Behavioural correlation of heart rate
changes in family dogs,” Appl. Anim. Behav. Sci., vol. 109, no. 2–4, pp. 329–341,
Feb. 2008.
[10] N. J. Rooney, S. a Gaines, and J. W. S. Bradshaw, “Behavioural and
glucocorticoid responses of dogs (Canis familiaris) to kennelling: Investigating
mitigation of stress by prior habituation.,” Physiol. Behav., vol. 92, no. 5, pp.
847–854, Dec. 2007.
[11] “Invasive procedure, Non-invasive procedure,” Mosby’s Medical Dictionary.
Elsevier, 2009.
[12] “Invasive procedure, Non-invasive procedure,” Medical Dictionary for the
Health Professions and Nursing. Farlex, 2012.

48
[13] D. Custance and J. Mayer, “Empathic-like responding by domestic dogs (Canis
familiaris) to distress in humans: an exploratory study.,” Anim. Cogn., vol. 15,
no. 5, pp. 851–9, Sep. 2012.
[14] T. Rehn and L. J. Keeling, “The effect of time left alone at home on dog
welfare,” Appl. Anim. Behav. Sci., vol. 129, no. 2–4, pp. 129–135, Jan. 2011.
[15] T. Bloom and H. Friedman, “Classifying dogs’ (Canis familiaris) facial
expressions from photographs.,” Behav. Processes, vol. 96, pp. 1–10, Jun. 2013.
[16] N. Reefmann, F. Bütikofer Kaszàs, B. Wechsler, and L. Gygax, “Ear and tail
postures as indicators of emotional valence in sheep,” Appl. Anim. Behav. Sci.,
vol. 118, no. 3–4, pp. 199–207, May 2009.
[17] K. J. Kerswell, P. Bennett, K. L. Butler, and P. H. Hemsworth, “The relationship
of adult morphology and early social signalling of the domestic dog (Canis
familiaris).,” Behav. Processes, vol. 81, no. 3, pp. 376–82, Jul. 2009.
[18] L. Marinelli, S. Adamelli, S. Normando, and G. Bono, “Quality of life of the pet
dog: Influence of owner and dog’s characteristics,” Appl. Anim. Behav. Sci., vol.
108, no. 1–2, pp. 143–156, Dec. 2007.
[19] D. M. Ainsworth, C. a Smith, S. W. Eicker, N. G. Ducharme, K. S. Henderson,
K. Snedden, and J. a Dempsey, “Pulmonary-locomotory interactions in
exercising dogs and horses.,” Respir. Physiol., vol. 110, no. 2–3, pp. 287–294,
1997.
[20] Texas Instruments, “What Is a DAQ Device?” [Online]. Available:
http://www.ni.com/data-acquisition/what-is/#device. [Accessed: 08-Jan-2014].
[21] S. Heath, Embedded Systems Design, 2nd Ed. Newnes, 2003.
[22] M. Barr and A. Massa, Programming Embedded Systems: With C and GNU
Development Tools, 2nd Ed. O’Reilly Media, Inc., 2006.
[23] A. H. G. Al-Dhaher, “Integrating hardware and software for the development of
microcontroller-based systems,” vol. 25, no. Microprocessors and Microsystems,
pp. 317–328, 2001.
[24] A. Pantelopoulos and N. G. Bourbakis, “A Survey on Wearable Sensor-Based
Systems for Health Monitoring and Prognosis,” IEEE Trans. Syst. MAN, Cybern.
C Appl. Rev., vol. 40, no. 1, pp. 1–12, 2010.
[25] S. D. Bhagwat and V. Jain, “EEG Data Sets Signal Processing Using Wavelet
Transforms,” no. 6, pp. 108–111, 2013.
[26] M. Akay, Time Frequency and Wavelets in Biomedical Signal Processing, 1st ed.
Wiley-IEEE Press, 1997, p. 353.

49
[27] C. Kitchin and L. Counts, A Designer’s Guide to Instrumentation Amplifiers, 3rd
Ed. Analog Devices, Inc, 2006, pp. 1–5.
[28] D. M. Eldredge, L. D. Carlson, D. G. Carlson, and J. M. Giffin, Dog Owner’s
Home Veterinary Handbook. Hoboken, NJ, USA: Wiley Publishing, Inc., 2007,
p. 574.