weather and climate...
TRANSCRIPT

Dust storm frequency and impact over Eastern Australia determinedby state of Pacific climate system$
Milton S. Speer n
Climate Change Research Centre, Faculty of Science, The University of New South Wales, Sydney, NSW 2052, Australia
a r t i c l e i n f o
Article history:Received 18 March 2013Received in revised form30 September 2013Accepted 3 October 2013
Keywords:DustEastern AustraliaENSOSAMTropospheric circulation
a b s t r a c t
Dust storms resulting from synoptic-scale mid-latitude frontal systems affect inland, eastern Australia,predominantly through spring and summer but extend to the east coast only rarely when strong, frontalwesterly winds crossing the continent are sustained over the coast. Here it is shown that extremewesterly wind dust events are anomalous to the more pervasive southerly winds that have shaped thesand dunes over inland eastern Australia. It is also shown that while antecedent dry conditions are veryimportant, higher SON and DJF dust storm frequencies from 1957 to the mid-1970s occurred due to bothanomalously strong, southerly winds existing on the western side of a cyclonic anomaly adjacent to theeast Australian coast, which resulted from the state of the Pacific climate system, and an anticyclonicanomaly at the top of the Great Australian Bight. A change in BoM observing practice, after 1973, isunlikely to be the major cause of changes in total dust frequency from the mid-1970s. Rather, extremerainfall years are more likely to have been a major contributing factor to the large decreases in dustoccurrence from 1973 to 1976, in addition to the other La Niña periods of 2000/01 to 2010/11. Synoptic-scale frontal systems in the westerlies that result in the transport of dust remained low in frequencythroughout the whole period from 1957 to 2011. However, those dust storms in the westerlies that doreach the east coast, although infrequent, tend to occur during El Niño-dominated years. On the otherhand, they occur during both negative and positive phases of the southern annular mode (SAM). Thisambiguity with the SAM phase is consistent with the fact that the mid-latitude westerlies and associatedfrontal systems are usually at their most equatorward position in Australian longitudes in late winter/spring regardless of the SAM phase. This suggests little change is likely in the frequency of westerlyinduced dust storms in late winter/spring over central/eastern Australia even though the seasonalwesterly winds are expected to contract further poleward under increased global warming. However,a complicating factor is that the increasing likelihood of longer dry spells under climate change wouldimply reduced vegetation for longer periods over the dust-prone source region of Lake Eyre basin, whichcould worsen the impact of dust storm events. Furthermore, longer dry spells throughout the year wouldincrease the risk of more frequent westerly dust storm events in other seasons when strong, westerlyfrontal systems can also occur.
& 2013 The Author. Published by Elsevier B.V. All rights reserved.
Introduction
Dust storms are an important part of the global dust cycle. Forexample, atmospheric dust potentially affects the radiative balanceand chemical composition of the atmosphere and may providenutrients to terrestrial and marine ecosystems (Kohfeld andHarrison, 2001). Dust can also contribute to land degradation,resulting in economic loss, reduced biological diversity and socialhardship while immediate effects include adverse impacts on
human health and local disruption of transport through reducedvisibility. The first spatial study of dust storm occurrence overAustralia was by Middleton (1984), who found the highest fre-quency of dust storms occur in the centre of Australia, where therewas an average of 10.8 at Alice Springs and a maximum of 65events per year. Previous studies have investigated wind regimesassociated with Australian dust storms. For example, Ekström et al.(2004) identified September to February dust storms over inlandAustralia as being most likely controlled by the timing of non-precipitating cold fronts over southern and central Australia. Theyconcluded that the dust storm occurrence is related to the extentto which ridging from the subtropical Indian Ocean high dom-inates the Great Australian Bight (GAB). A more westward dis-placement of high pressure in the GAB allows cold fronts to enterthe continent and increase the potential for dust storm activity.
Contents lists available at ScienceDirect
journal homepage: www.elsevier.com/locate/wace
Weather and Climate Extremes
2212-0947/$ - see front matter & 2013 The Author. Published by Elsevier B.V. All rights reserved.http://dx.doi.org/10.1016/j.wace.2013.10.004
☆This is an open-access article distributed under the terms of the CreativeCommons Attribution License, which permits unrestricted use, distribution, andreproduction in any medium, provided the original author and source are credited.
n Tel.: þ61 293616883.E-mail addresses: [email protected], [email protected]
Please cite this article as: Speer, M.S., Dust storm frequency and impact over Eastern Australia determined by state of Pacificclimate system. Weather and Climate Extremes (2013), http://dx.doi.org/10.1016/j.wace.2013.10.004i
Weather and Climate Extremes ∎ (∎∎∎∎) ∎∎∎–∎∎∎
Lamb et al. (2009) noted a decrease in September–February duststorm frequency over central eastern Australia from the mid-1970sin the context of the Pacific-wide climate system. They showedthat the dust oscillation was associated locally with a strengthen-ing and then weakening of the southerly component of the low-level tropospheric wind over the dust-prone region. Leslie andSpeer (2006) found that from a total of 55 dust storm occurrencesover central eastern Australia between January 1995 and February2005, there were 43 associated with cold fronts. Of those 43, 24fronts were embedded in the zonal westerlies and the remaining19 resulted from cold fronts over eastern Australia where high-pressure systems over the GAB generated strong post-frontalsouth to southeast winds. This questions the larger proportion ofwesterly wind-induced dust occurrences than southerly wind dustoccurrences from 1995 to 2005, given that prior to the mid-1970ssoutherly wind occurrences dominate. The main aim of this studyis to highlight the strong influence that tropospheric circulationchanges of the Pacific climate system and resulting synopticcharacteristics had on dust storm frequency and impact overcentral eastern Australia prior to the mid-1970s compared to thepost mid-1970s.
Data and methodology
Dust observations
The inclusion of dust observations from the Australian Bureau ofMeteorology (BoM) in this study covers the September–Februaryperiod from 1957/58 to 2010/11. There were some important changesin BoM dust observing practice over the period. Centred on 1957, theInternational Geophysical Year, there was a gradual increase in thenumber of BoM stations Australia-wide. The 12 BoM stations in thisstudy have complete records for the whole study period, except forDubbo after 1999 and after 2001 for Boulia. There was a Pacific-wideclimate shift in the mid-1970s, which has been reported by severalauthors (Lamb et al., 2009; Trenberth and Hurrell, 1994; Meehl et al.,2009). In order to address a hypothesised decrease in dust daysbetween the two periods 1957/58 to 1975/76 and 1976/77 to 2010/11(hereafter referred to as P1 and P2, respectively), the change in theway dust was reported from 1973 is described in the followingsection. Also presented in the following section is an analysis of thedust frequency differences between P1 and P2 in terms of the mean3 pm daily wind speed, wind direction and mean daily wind speed atfour of the 12 synoptic stations.
Methodology
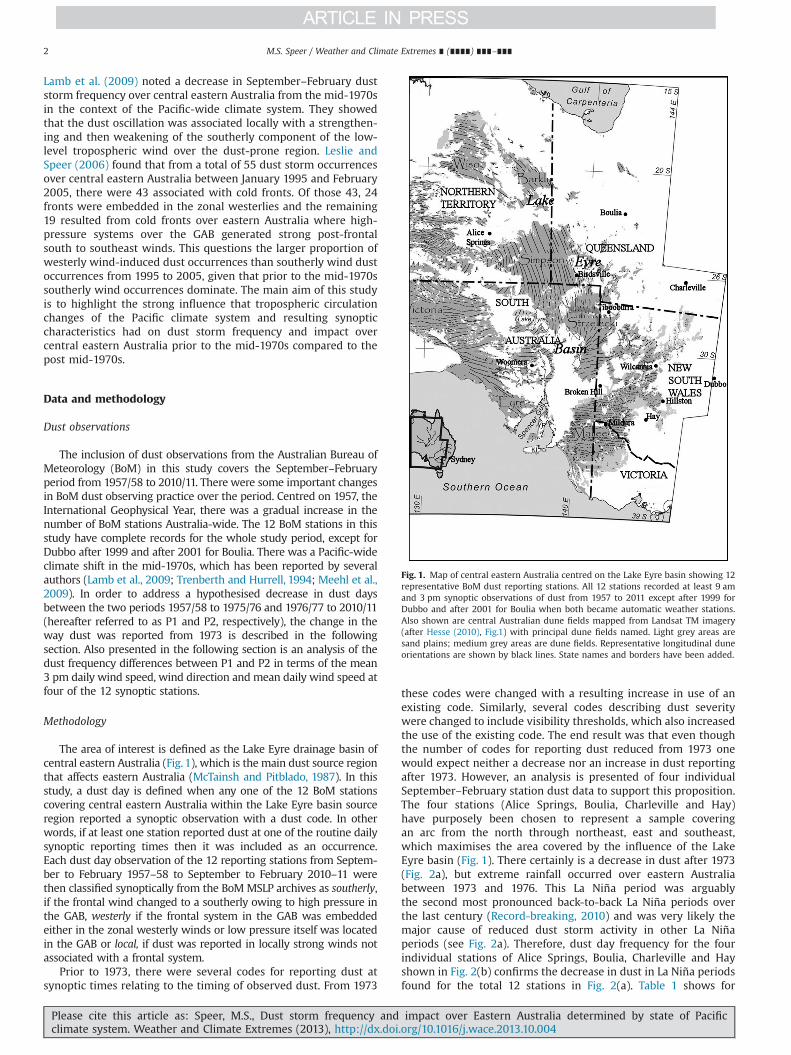
The area of interest is defined as the Lake Eyre drainage basin ofcentral eastern Australia (Fig. 1), which is the main dust source regionthat affects eastern Australia (McTainsh and Pitblado, 1987). In thisstudy, a dust day is defined when any one of the 12 BoM stationscovering central eastern Australia within the Lake Eyre basin sourceregion reported a synoptic observation with a dust code. In otherwords, if at least one station reported dust at one of the routine dailysynoptic reporting times then it was included as an occurrence.Each dust day observation of the 12 reporting stations from Septem-ber to February 1957–58 to September to February 2010–11 werethen classified synoptically from the BoMMSLP archives as southerly,if the frontal wind changed to a southerly owing to high pressure inthe GAB, westerly if the frontal system in the GAB was embeddedeither in the zonal westerly winds or low pressure itself was locatedin the GAB or local, if dust was reported in locally strong winds notassociated with a frontal system.
Prior to 1973, there were several codes for reporting dust atsynoptic times relating to the timing of observed dust. From 1973
these codes were changed with a resulting increase in use of anexisting code. Similarly, several codes describing dust severitywere changed to include visibility thresholds, which also increasedthe use of the existing code. The end result was that even thoughthe number of codes for reporting dust reduced from 1973 onewould expect neither a decrease nor an increase in dust reportingafter 1973. However, an analysis is presented of four individualSeptember–February station dust data to support this proposition.The four stations (Alice Springs, Boulia, Charleville and Hay)have purposely been chosen to represent a sample coveringan arc from the north through northeast, east and southeast,which maximises the area covered by the influence of the LakeEyre basin (Fig. 1). There certainly is a decrease in dust after 1973(Fig. 2a), but extreme rainfall occurred over eastern Australiabetween 1973 and 1976. This La Niña period was arguablythe second most pronounced back-to-back La Niña periods overthe last century (Record-breaking, 2010) and was very likely themajor cause of reduced dust storm activity in other La Niñaperiods (see Fig. 2a). Therefore, dust day frequency for the fourindividual stations of Alice Springs, Boulia, Charleville and Hayshown in Fig. 2(b) confirms the decrease in dust in La Niña periodsfound for the total 12 stations in Fig. 2(a). Table 1 shows for
Fig. 1. Map of central eastern Australia centred on the Lake Eyre basin showing 12representative BoM dust reporting stations. All 12 stations recorded at least 9 amand 3 pm synoptic observations of dust from 1957 to 2011 except after 1999 forDubbo and after 2001 for Boulia when both became automatic weather stations.Also shown are central Australian dune fields mapped from Landsat TM imagery(after Hesse (2010), Fig.1) with principal dune fields named. Light grey areas aresand plains; medium grey areas are dune fields. Representative longitudinal duneorientations are shown by black lines. State names and borders have been added.
M.S. Speer / Weather and Climate Extremes ∎ (∎∎∎∎) ∎∎∎–∎∎∎2
Please cite this article as: Speer, M.S., Dust storm frequency and impact over Eastern Australia determined by state of Pacificclimate system. Weather and Climate Extremes (2013), http://dx.doi.org/10.1016/j.wace.2013.10.004i
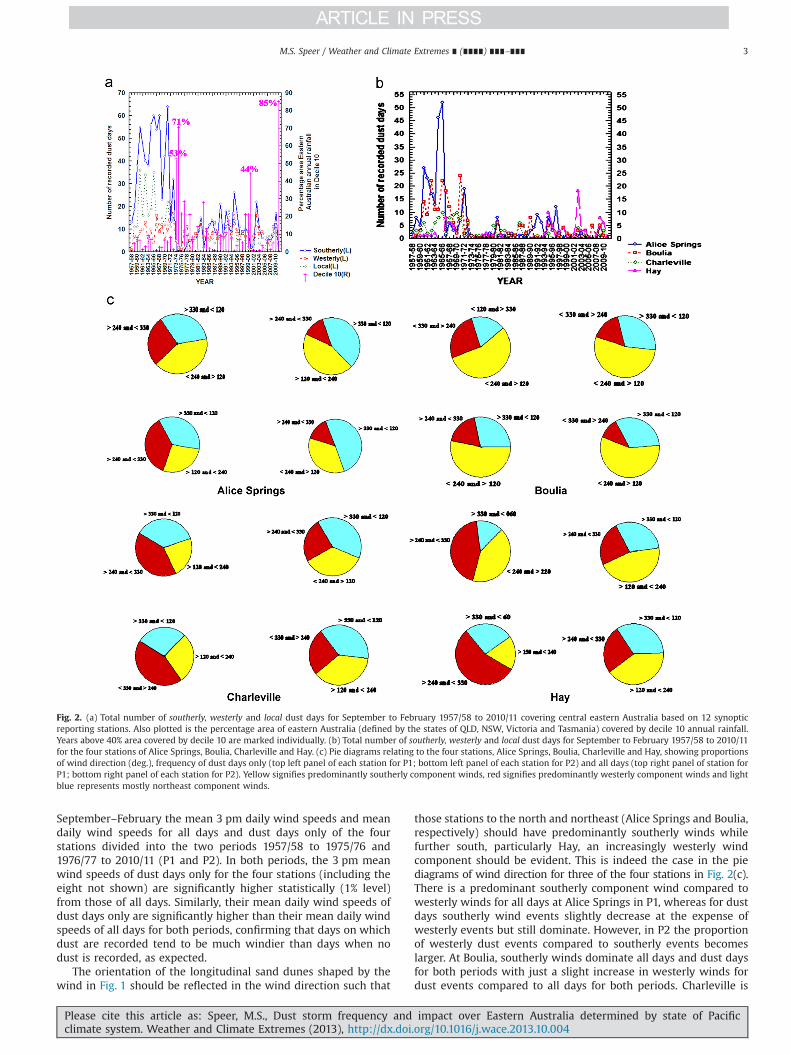
September–February the mean 3 pm daily wind speeds and meandaily wind speeds for all days and dust days only of the fourstations divided into the two periods 1957/58 to 1975/76 and1976/77 to 2010/11 (P1 and P2). In both periods, the 3 pm meanwind speeds of dust days only for the four stations (including theeight not shown) are significantly higher statistically (1% level)from those of all days. Similarly, their mean daily wind speeds ofdust days only are significantly higher than their mean daily windspeeds of all days for both periods, confirming that days on whichdust are recorded tend to be much windier than days when nodust is recorded, as expected.
The orientation of the longitudinal sand dunes shaped by thewind in Fig. 1 should be reflected in the wind direction such that
those stations to the north and northeast (Alice Springs and Boulia,respectively) should have predominantly southerly winds whilefurther south, particularly Hay, an increasingly westerly windcomponent should be evident. This is indeed the case in the piediagrams of wind direction for three of the four stations in Fig. 2(c).There is a predominant southerly component wind compared towesterly winds for all days at Alice Springs in P1, whereas for dustdays southerly wind events slightly decrease at the expense ofwesterly events but still dominate. However, in P2 the proportionof westerly dust events compared to southerly events becomeslarger. At Boulia, southerly winds dominate all days and dust daysfor both periods with just a slight increase in westerly winds fordust events compared to all days for both periods. Charleville is
Fig. 2. (a) Total number of southerly, westerly and local dust days for September to February 1957/58 to 2010/11 covering central eastern Australia based on 12 synopticreporting stations. Also plotted is the percentage area of eastern Australia (defined by the states of QLD, NSW, Victoria and Tasmania) covered by decile 10 annual rainfall.Years above 40% area covered by decile 10 are marked individually. (b) Total number of southerly, westerly and local dust days for September to February 1957/58 to 2010/11for the four stations of Alice Springs, Boulia, Charleville and Hay. (c) Pie diagrams relating to the four stations, Alice Springs, Boulia, Charleville and Hay, showing proportionsof wind direction (deg.), frequency of dust days only (top left panel of each station for P1; bottom left panel of each station for P2) and all days (top right panel of station forP1; bottom right panel of each station for P2). Yellow signifies predominantly southerly component winds, red signifies predominantly westerly component winds and lightblue represents mostly northeast component winds.
M.S. Speer / Weather and Climate Extremes ∎ (∎∎∎∎) ∎∎∎–∎∎∎ 3
Please cite this article as: Speer, M.S., Dust storm frequency and impact over Eastern Australia determined by state of Pacificclimate system. Weather and Climate Extremes (2013), http://dx.doi.org/10.1016/j.wace.2013.10.004i
interesting because while southerly winds dominate all days forboth periods compared to westerly winds, dust events occur morefrequently as westerly events than southerly events for both periods.A possible explanation is that the Charleville area in central southernQueensland, in addition to being influenced by anticyclonic windsfrom high-pressure in the GAB, is also influenced by the oscillatorynature of the well-known quasi-permanent northeast Australiansurface heat trough in the warmer spring/summer months withwesterly winds converging into the trough on its western side(Skinner and Leslie, 1999). Southerly component winds dominatefor all days at Hay in both periods. Southerly dust events occur inabout the same proportion as westerly events in P1 (note, however,that they are all southwesterly with no southeasterly events in thetop left panel for Hay). However, southerly dust events decreasedmarkedly in P2, reflecting the rise in westerly dust events generallyduring P2 for the 12 stations shown in Fig. 2(a).
The September–February dust data for P1 and P2, including theseasonal break-up (SON and DJF), were then related to surface(MSLP) vector wind anomalies in order to assess changes in themain synoptic characteristics of weather systems responsible. Theresulting images were provided by the NOAA/ESRL PhysicalSciences Division, Boulder Colorado (http://www.esrl.noaa.gov/psd/), which were originally developed from the NCEP/NCARreanalysis project by Kalnay et al. (1996). The southern annularmode (SAM), alternatively referred to as the Antarctic oscillation(AAO), is the leading mode of variability in the extra-tropicalsouthern hemispheric circulation and is characterised by deep,
zonally symmetric or “annular” structures with geopotentialheight perturbations of opposing signs in the polar cap regionand in the surrounding zonal ring centred near 451S (Thompsonand Wallace,2000). The AAO (SAM) index originally developed byGong and Wang (1999) is slightly different from the modified Nanand Li index (Nan and Li, 2003) that is used here and is defined asthe difference in the normalised monthly zonal MSLP between401S and 701S. The seasonal SAM data values were sourced from:http://web.lasg.ac.cn/staff/ljp/data-NAM-SAM-NAO/SAM-AAO.htm.
Results and discussion
Analysis of dust day occurrence in terms of extreme rainfall
As shown in Fig. 2(a), a noticeable feature is the large numberof dust occurrences prior to the mid-1970s' climate shift (see Lambet al., 2009). Also plotted on Fig. 2(a) are the years showing thepercentage area of eastern Australia covered by decile 10 rainfall.For rainfall purposes, the BoM defines eastern Australia by the areathat includes Queensland, NSW, Victoria and Tasmania at: http://www.bom.gov.au/climate/change/about/temp_timeseries.shtml.
In such high-rainfall years, vegetation is likely to be a promi-nent feature over the normally sparsely vegetated Lake Eyredrainage basin and hence hinder dust storm generation. Clearly,there is a drop in dust day occurrence in each of the decile 10rainfall years marked. Particularly noticeable are the very few dustday observations from September to February during the La Niña
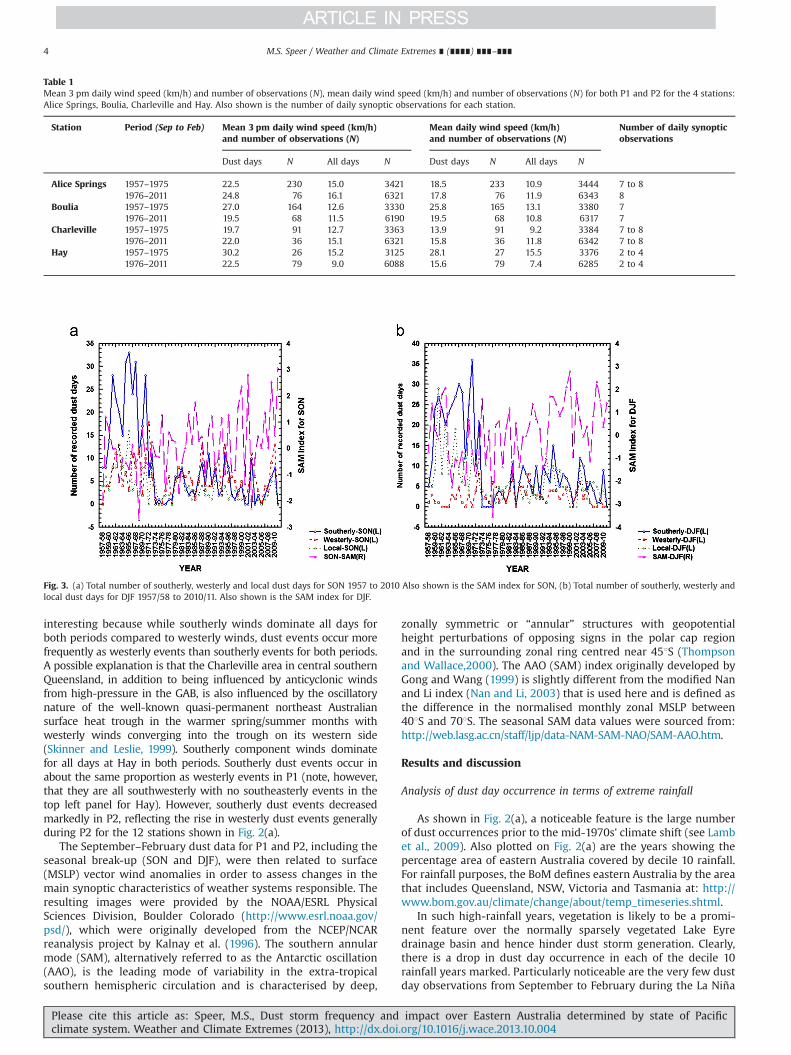
Table 1Mean 3 pm daily wind speed (km/h) and number of observations (N), mean daily wind speed (km/h) and number of observations (N) for both P1 and P2 for the 4 stations:Alice Springs, Boulia, Charleville and Hay. Also shown is the number of daily synoptic observations for each station.
Station Period (Sep to Feb) Mean 3 pm daily wind speed (km/h)and number of observations (N)
Mean daily wind speed (km/h)and number of observations (N)
Number of daily synopticobservations
Dust days N All days N Dust days N All days N
Alice Springs 1957–1975 22.5 230 15.0 3421 18.5 233 10.9 3444 7 to 81976–2011 24.8 76 16.1 6321 17.8 76 11.9 6343 8
Boulia 1957–1975 27.0 164 12.6 3330 25.8 165 13.1 3380 71976–2011 19.5 68 11.5 6190 19.5 68 10.8 6317 7
Charleville 1957–1975 19.7 91 12.7 3363 13.9 91 9.2 3384 7 to 81976–2011 22.0 36 15.1 6321 15.8 36 11.8 6342 7 to 8
Hay 1957–1975 30.2 26 15.2 3125 28.1 27 15.5 3376 2 to 41976–2011 22.5 79 9.0 6088 15.6 79 7.4 6285 2 to 4
Fig. 3. (a) Total number of southerly, westerly and local dust days for SON 1957 to 2010 Also shown is the SAM index for SON, (b) Total number of southerly, westerly andlocal dust days for DJF 1957/58 to 2010/11. Also shown is the SAM index for DJF.
M.S. Speer / Weather and Climate Extremes ∎ (∎∎∎∎) ∎∎∎–∎∎∎4
Please cite this article as: Speer, M.S., Dust storm frequency and impact over Eastern Australia determined by state of Pacificclimate system. Weather and Climate Extremes (2013), http://dx.doi.org/10.1016/j.wace.2013.10.004i
periods of 1973–76, 2000–01 and 2011. La Niña periods are definedby the BoM at: http://www.bom.gov.au/climate/enso/lnlist/.
Dust frequency related to tropospheric circulation changes
In both SON (Fig. 3a) and DJF (Fig. 3b) prior to the mid-1970s, duststorms associated with southerly wind anomalies dominate. In SON,dust storms with westerly frontal systems are more frequent than inDJF. This is not surprising since by summer the seasonal polewardmovement of the mid-latitude westerlies starts occurring. Thenumber of dust days classified as local increased in DJF comparedto SON. This is because thunderstorm-scale downdrafts and gusts arelikely to contribute more to local dust occurrences in DJF than in SON.
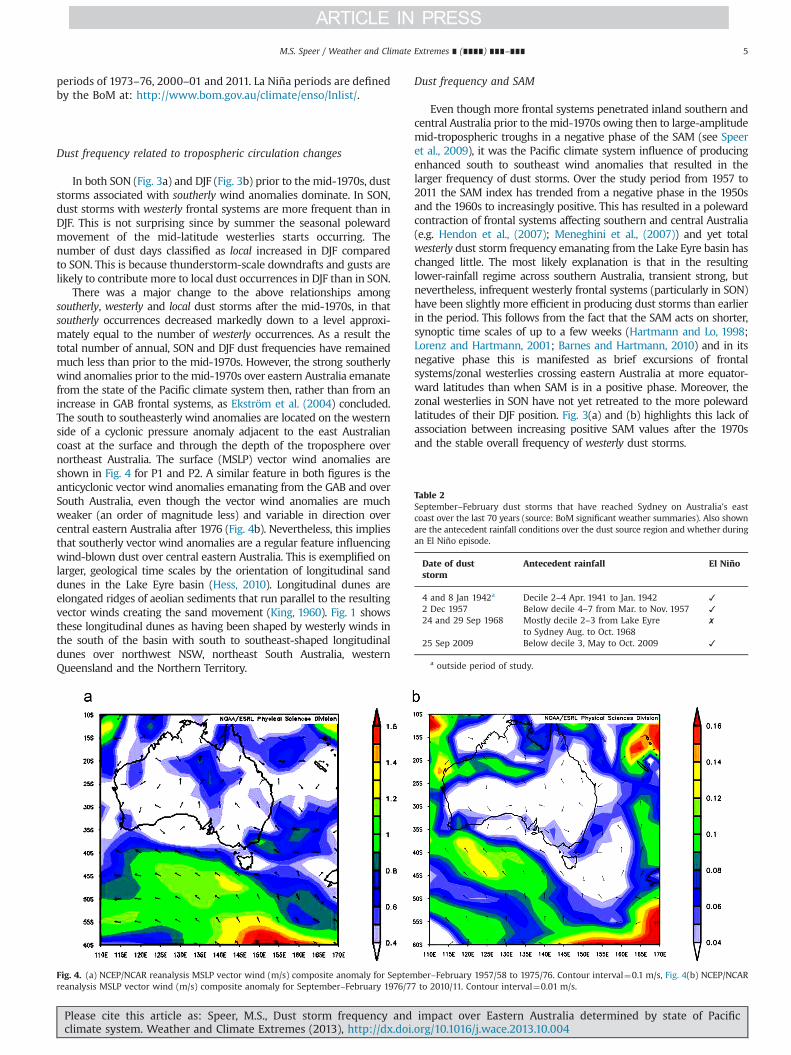
There was a major change to the above relationships amongsoutherly, westerly and local dust storms after the mid-1970s, in thatsoutherly occurrences decreased markedly down to a level approxi-mately equal to the number of westerly occurrences. As a result thetotal number of annual, SON and DJF dust frequencies have remainedmuch less than prior to the mid-1970s. However, the strong southerlywind anomalies prior to the mid-1970s over eastern Australia emanatefrom the state of the Pacific climate system then, rather than from anincrease in GAB frontal systems, as Ekström et al. (2004) concluded.The south to southeasterly wind anomalies are located on the westernside of a cyclonic pressure anomaly adjacent to the east Australiancoast at the surface and through the depth of the troposphere overnortheast Australia. The surface (MSLP) vector wind anomalies areshown in Fig. 4 for P1 and P2. A similar feature in both figures is theanticyclonic vector wind anomalies emanating from the GAB and overSouth Australia, even though the vector wind anomalies are muchweaker (an order of magnitude less) and variable in direction overcentral eastern Australia after 1976 (Fig. 4b). Nevertheless, this impliesthat southerly vector wind anomalies are a regular feature influencingwind-blown dust over central eastern Australia. This is exemplified onlarger, geological time scales by the orientation of longitudinal sanddunes in the Lake Eyre basin (Hess, 2010). Longitudinal dunes areelongated ridges of aeolian sediments that run parallel to the resultingvector winds creating the sand movement (King, 1960). Fig. 1 showsthese longitudinal dunes as having been shaped by westerly winds inthe south of the basin with south to southeast-shaped longitudinaldunes over northwest NSW, northeast South Australia, westernQueensland and the Northern Territory.
Dust frequency and SAM
Even though more frontal systems penetrated inland southern andcentral Australia prior to themid-1970s owing then to large-amplitudemid-tropospheric troughs in a negative phase of the SAM (see Speeret al., 2009), it was the Pacific climate system influence of producingenhanced south to southeast wind anomalies that resulted in thelarger frequency of dust storms. Over the study period from 1957 to2011 the SAM index has trended from a negative phase in the 1950sand the 1960s to increasingly positive. This has resulted in a polewardcontraction of frontal systems affecting southern and central Australia(e.g. Hendon et al., (2007); Meneghini et al., (2007)) and yet totalwesterly dust storm frequency emanating from the Lake Eyre basin haschanged little. The most likely explanation is that in the resultinglower-rainfall regime across southern Australia, transient strong, butnevertheless, infrequent westerly frontal systems (particularly in SON)have been slightly more efficient in producing dust storms than earlierin the period. This follows from the fact that the SAM acts on shorter,synoptic time scales of up to a few weeks (Hartmann and Lo, 1998;Lorenz and Hartmann, 2001; Barnes and Hartmann, 2010) and in itsnegative phase this is manifested as brief excursions of frontalsystems/zonal westerlies crossing eastern Australia at more equator-ward latitudes than when SAM is in a positive phase. Moreover, thezonal westerlies in SON have not yet retreated to the more polewardlatitudes of their DJF position. Fig. 3(a) and (b) highlights this lack ofassociation between increasing positive SAM values after the 1970sand the stable overall frequency of westerly dust storms.
Fig. 4. (a) NCEP/NCAR reanalysis MSLP vector wind (m/s) composite anomaly for September–February 1957/58 to 1975/76. Contour interval¼0.1 m/s, Fig. 4(b) NCEP/NCARreanalysis MSLP vector wind (m/s) composite anomaly for September–February 1976/77 to 2010/11. Contour interval¼0.01 m/s.
Table 2September–February dust storms that have reached Sydney on Australia's eastcoast over the last 70 years (source: BoM significant weather summaries). Also shownare the antecedent rainfall conditions over the dust source region and whether duringan El Niño episode.
Date of duststorm
Antecedent rainfall El Niño
4 and 8 Jan 1942a Decile 2–4 Apr. 1941 to Jan. 1942 ✓
2 Dec 1957 Below decile 4–7 from Mar. to Nov. 1957 ✓
24 and 29 Sep 1968 Mostly decile 2–3 from Lake Eyreto Sydney Aug. to Oct. 1968
✗
25 Sep 2009 Below decile 3, May to Oct. 2009 ✓
a outside period of study.
M.S. Speer / Weather and Climate Extremes ∎ (∎∎∎∎) ∎∎∎–∎∎∎ 5
Please cite this article as: Speer, M.S., Dust storm frequency and impact over Eastern Australia determined by state of Pacificclimate system. Weather and Climate Extremes (2013), http://dx.doi.org/10.1016/j.wace.2013.10.004i
Dust storms reaching Australia's east coast
Whenwesterly winds result in dust storms reaching the Australianeast coast they affect a much more densely populated area than overinland eastern Australia. However, these events are very rare within arelatively small total number of westerly dust occurrences. Forexample, Table 2 shows that there were 6 days in the last 70 yearsfrom September to February when dust storms were reported inSydney on Australia’s east coast. Furthermore, all these occurred afterprolonged dry periods over the dust source region of the Lake Eyrebasin, including 5 of the 6 days when dust was observed during ortowards the end of El Niño episodes. The main point here is that evenin westerly dust occurrences, the extent to which dust will affect alarger area extending to the east coast is determined by the state ofthe Pacific climate system.
Summary and conclusions
The pie diagrams of wind direction from the four stations showthat southerly dust events over eastern Australia (September toFebruary) have decreased after the mid-1970s’ climate shift andthat the corresponding frequencies of dust for the four individualstations do reflect those frequencies for the 12 stations shown.Changes in dust storm observing codes from 1973 are unlikely tohave been a major factor in the decrease after the mid-1970s.Rather, extreme rainfall years are more likely to have been a majorcontributing factor to the large decreases in dust occurrence from1973 to 1976, in addition to the other La Niña periods of 2000–01and 2010/2011.
Dust storms resulting from synoptic-scale mid-latitude frontalsystems affect inland, eastern Australia predominantly throughspring/early summer but extend to the east coast only rarely whenstrong, westerly winds crossing the continent are sustained overthe coast. These extreme westerly wind dust events are anomalousto the more pervasive southerly wind dust events that shape thesand dunes over central inland eastern Australia. Therefore,a change in dust storm frequency affecting the densely populatedeast coast is subject to changes in a small number of extremeevents. With typically low annual rainfall totals over the dustsource region of the Lake Eyre basin, the main climate driversaffecting widespread eastern Australian dust storms are antece-dent dry conditions, predominantly associated with El Niñoepisodes, as already noted in previous studies. It was shown,however, that although antecedent dry conditions are very impor-tant, the synoptic-scale frontal systems that result in the transportof dust over the east coast occur during both negative and positivephases of the southern annular mode. This finding is consistentwith the fact that the mid-latitude westerlies are usually strongestat their most equatorward position in Australian longitudes in latewinter/spring, regardless of the SAM phase. It was also shown thatthe state of the Pacific climate system is important in determiningthe larger frequency of dust storms in the La Niña-dominatedperiod prior to the mid-1970s as a result of the stronger southerlywind vector anomalies then present.
The stable total frequency of westerly wind-induced duststorms during spring/summer over central eastern Australia
during the two periods suggests little change would be expectedregarding their frequency over time even though the seasonalwesterly winds are expected to contract further poleward underincreased global warming. However, a complicating factor is thatthe increasing likelihood of longer dry spells under climate changewould imply reduced vegetation for longer periods over the dust-prone source region of Lake Eyre basin, which could worsen theimpact of dust storm events. Furthermore, longer dry spellsthroughout the year would increase the risk of more frequentwesterly dust storm events in the other seasons (autumn/winter)when strong, westerly frontal systems may also occur.
References
Barnes, E.A., Hartmann, D.L., 2010. Dynamical feedbacks of the Southern AnnularMode in winter and summer. J. Atmos. Sci. 67, 2320–2330.
Ekström, M., McTainsh, G.H., Chappell, A., 2004. Australian dust storms: temporaltrends and relationships with synoptic pressure distributions (1960–99). Int. J.Climatol. 24, 1581–1599.
Gong, D., Wang, S., 1999. Definition of Antarctic oscillation index. Geophys. Res.Lett. 26 (1999), 459–462.
Hartmann, D.L., Lo, F., 1998. Wave-driven zonal flow vacillation in the SouthernHemisphere. J. Atmos. Sci. 55 (1998), 1303–1315.
Hendon, H.H., Thompson, D.W.J., Wheeler, M.C., 2007. Australian rainfall andsurface temperature variations associated with the Southern Hemisphereannular mode. J. Clim. 20, 2452–2467.
Hess, P.P., 2010. The Australian desert dune fields: formation and evolution in anold, flat, dry continent. In: Bishop, P., Pillans, B. (Eds.), Australian Landscapes,346. Geological Society, London, pp. 141–163. (Special Publications).
Kalnay, E., et al., 1996. The NCEP/NCAR reanalysis 40-year project. Bull. Am.Meteorol. Soc. 77, 437–471.
King, D., 1960. The sand ridge deserts of South Australia and related aeolianlandforms of the quaternary arid cycles,. T. Roy. Soc. South Aust. 83, 99–108.
Kohfeld, K.E., Harrison, S.P., 2001. DIRTMAP: the geological record of dust. Earth-Sci.Rev. 54 (1–3), 81–114.
Lamb, P.J., Leslie, L.M., Timmer, R.P., Speer, M.S., 2009. Multidecadal variability ofeastern Australian dust and Northern New Zealand sunshine: associations withPacific climate system. J. Geophys. Res. 114, http://dx.doi.org/10.1029/2008JDO11184.
Leslie, L.M., Speer, M.S., 2006. Modelling dust transport over central easternAustralia. Meteorol. Appl. 13, 1–27.
Lorenz, D.J., Hartmann, D.L., 2001. Eddy-zonal flow feedback in the SouthernHemisphere. J. Atmos. Sci. 58, 3312–3327.
McTainsh, G.H., Pitblado, J.R., 1987. Dust storms and related phenomena measuredfrom meteorological records in Australia. Earth Surf. Processes Landforms 12,415–424.
Meehl, G.A., Hu, A., Santer, B.D., 2009. The mid-1970s climate shift in the Pacific andthe relative roles of forced versus inherent decadal variability. J. Clim. 22(D09106), 780–792.
Meneghini, B., Simmonds, I., Smith, N., 2007. Association between Australianrainfall and the Southern annular mode. Int. J. Climatol. 27, 109–121.
Middleton, N.J., 1984. Dust storms in Australia: frequency, distribution andseasonality. Search 15, 46–47.
Nan, S., Li, J., 2003. The relationship between summer precipitation in the YangtzeRiver valley and the previous Southern Hemisphere annular mode. Geophys.Res. Lett. 30 (24), 2266, http://dx.doi.org/10.1029/2003GL018381.
Record-breaking La Nina events – Analysis of the La Nina life-cycle and the impactsand significance of the 2010–11 and 2011–12 La Nina events in Australia.Published by the Bureau of Meteorology, GPO Box 1299, Melbourne, VIC. 3001.www.bom.gov.au.
Skinner, T.C.L., Leslie, L.M., 1999. Numerical prediction of the summertime ridge-trough system over northeastern Australia. Weather Forecast. 14, 306–325.
Speer, M.S., Leslie, L.M., Fierro, A.O., 2009. Australian east coast rainfall declinerelated to large scale climate drivers. Clim. Dyn. 36, 1419–1429, http://dx.doi.org/10.1007/s00382-009-0726-1.
Thompson, D.W.J., Wallace, J.M., 2000. Annular modes in the extratropical circula-tion. Part I: Month-to-month variability. J. Clim. 13, 1000–1016.
Trenberth, K.E., Hurrell, J.W., 1994. Decadal atmosphere-ocean variations in thePacific. Clim. Dyn. 9, 303–319.
M.S. Speer / Weather and Climate Extremes ∎ (∎∎∎∎) ∎∎∎–∎∎∎6
Please cite this article as: Speer, M.S., Dust storm frequency and impact over Eastern Australia determined by state of Pacificclimate system. Weather and Climate Extremes (2013), http://dx.doi.org/10.1016/j.wace.2013.10.004i