web application vulnerability statistics 2012 · malicious users to penetrate corporate information...
TRANSCRIPT
Page 1
WEB APPLICATION VULNERABILITY STATISTICS 2012
WEB APPLICATION

2
CONTENTS
Contents.............................................................................................................................................................................................2
Introduction.....................................................................................................................................................................................3
1. Research Methodology...........................................................................................................................................................4
2. Executive Summary..................................................................................................................................................................5
3. Participant Portrait...................................................................................................................................................................7
4. Vulnerability Statistics..........................................................................................................................................................10
4.1. Most Widespread Vulnerabilities..........................................................................................................................10
4.2. Quarterly Dynamics.................................................................................................................................................12
4.3. Typical Vulnerabilities for Various Programming Languages.....................................................................18
4.4. Typical vulnerabilities for various web servers.................................................................................................22
4.5. Statistics by Various Industries............................................................................................................................25
Conclusions.................................................................................................................................................................................. ..31
References ............................................................................................................................................................................. .........31
Application А. Risk Level Assessment Technique................................................................................................... ....32

3
As information technologies, and particularly the Internet, continue to expand, web applications have become an integral part of any modern corporate information system, regardless of the organization’s line of business or industry. And it’s not just commercial organizations that create and develop their own web resources. Government agencies are also actively involved in the development of web-based services, aimed at both the national and local levels.
Web applications have many advantages including the ability to update and maintain them centrally, their cross-platform nature and the fact that they are available to anyone on the web, 24/7. But, of course, it’s not just genuine users who have access to these applications. That’s why vulnerabilities in web applications such as poor code, weak password policies or configuration flaws now represent one of the most common ways for malicious users to penetrate corporate information systems. Obviously, in the process of developing a web application, developers are focused on form and functionality. And because of this, all too often security isn’t as much as an afterthought – resulting in web applications that contain vulnerabilities of various risk levels.
A company’s corporate website is not only the focal point for their public face; it has also become the preferred attack vector for a malicious person to penetrate an organization’s corporate network. This fact is borne out by the latest statistical analysis carried out by Positive Research — highlighting web application vulnerabilities which were prevalent over the past 12 months.
This report evaluates the data obtained in the course of our web application security analysis and presents a set of statistics on the most widespread vulnerabilities found in various different types of web applications.
INTROdUCTION
4
In total, the experts at Positive Research examined approximately 400 unique web applications during the study period; using various techniques from instrumental scanning to source-code analysis. Of these 400, we performed the most comprehensive analysis on 67 separate web applications and it is the results of these tests that are included in this report. Results obtained in the course of instrumental scanning and penetration testing alone have not been included in our results.
In the applications analyzed, 576 vulnerabilities of different risk levels were found. The security level of each application was estimated by hand using a combination of black-, grey-, and white-box vulnerability detection methods, as well as tests conducted by automated tools. The black-box method consists of estimating the security level of an application from the point of view of an external attacker - without having any “inside” knowledge of the application and any other associated applications and users. Grey-box testing is similar to black-box, except the attacker is considered to be a user who has some privileges in the system. White box scanning requires the tester to have all relevant information about the application, including the source code, in order to estimate its security level. The statistics in this report only include data about external web applications which are available over the Internet.
The vulnerabilities revealed in our tests were classified according to the corresponding threats in the Web Application Security Consortium Threat Classification (WASC TC v. 2 [1]), with the exception of “Improper Input Handling” and “Improper Output Handling”, since these threats are implemented by exploiting a number of other vulnerabilities.
The statistics included in this report represent only web application vulnerabilities. Other widespread information security weaknesses such as improper processes for software updates are not considered.
The severity level of vulnerabilities was calculated according to the Common Vulnerability Scoring System (CVSS v. 2 [2]). Based on the CVSS score obtained, our researchers assigned a qualitative evaluation of risk level (high, medium, or low) to each vulnerability.
RESEARCH METHOdOLOGY1

5
This section summarizes the most important conclusions that can be drawn from our statistical analysis.
Ninety percent of the web applications examined contained medium-risk vulnerabilities. These results are very similar to the levels we reported in each of the previous two years.
All the web applications we examined were found to had some vulnerabilities; with 45% of them exhibiting vulnerabilities classified in the high-risk category. This represents a considerable improvement over the previous two years’ results from 2010 (76%) and 2011 (61%); however, the percentage of applications with high-risk vulnerabilities is still extremely high.
The most widespread weakness discovered in 2012 was Fingerprinting; which showed up in 72% of the applications we tested. In second place was Cross Site Scripting, affecting 63% of the applications we analyzed. Also in our top ten, SQL Injection and Path Traversal critical vulnerabilities were found in 33% and 18%respectively.
36% of analyzed applications were developed using PHP, making it the most popular programming language for web applications. Unfortunately, we found that 83% of web resources developed in PHP have critical vulnerabilities. This percentage is almost three times higher than the corresponding percentage for Perl (29%).
The sector most threatened by high risk vulnerabilities is Telecommunications. We found critical weaknesses in 78% of telco applications. This year’s results are consistent with those of the previous two years, in which Telecom ranked the most threatened by this class of threats.
ExECUTIVE SUMMARY2
1
2
3
4
5
6
7
8
Web applications developed in ASP.NET contain the least amount of high-risk vulnerabilities (only 10% of applications were found to be critically weak). However, 80% of applications developed in ASP.NET were found to have medium-risk vulnerabilities. Therefore, any determination that ASP.NET is a safe choice for security would be premature.
In 2012, the most popular web server was Nginx, while the most vulnerable one we found to be Apache: 88% of web applications using Apache were revealed to have critical weaknesses.
Only 30% of the web resources analyzed used Web Application Firewalls (WAFs). Given that all the applications under consideration contained some level of vulnerabilities, it is clear that they could all benefit from applying this additional preventive security tool.

• 2012ANALYTICS STATISTICS OF WEB APPLICATION VULNERABILITIES
MOST COMMON VULNERABILITIES(site percentage, %)
WEB APPLICATIONS WITH CRITICAL VULNERABILITIES(by a web server type)
PERCENT OF SITES EXPOSED TO DIFFERENT SEVERITY VULNERABILITIES
WEB APPLICATIONS WITH VULNERABILITIESOF MAXIMUM SEVERITY
(for each of the considered economic spheres)
iiInformation technologies
79%
86%
45%
Stateorganizations
59%
91%
27%
Telecoms
100%
100%
78%
Industry
75%
75%
50% High severity
Medium severity
Low severity
20% 40% 60% 80% 100%
1783
5329 18
8515
1080ASP.NET
Java
Perl
PHP
10
Cross-Site Scripting
Brute Force
Fingerprinting
SQL Injection
Cross-Site Request Forgery
Credential/Session Prediction
Server Miscon�guration
Path Traversal
Information Leakage
URL Redirector Abuse
73%
63%
33%
30%
31%
30%
18%
24%
18%
46%
0
20
40
60
80
100
%
High Medium Low
2010
2011
2012
2010
2011
2012
2010
2011
2012
PERCENT OF VULNERABLE SITES WITHDIFFERENT SEVERITY VULNERABILITIES
88% 75% 43% 14%Tomcat Nginx IISApache
Web server

PARTICIPANT PORTRAIT3The web applications considered in this report were selected from various commercial sectors. Application owners were classified into several sector profiles: • Informationtechnologiesandinformationsecurity(IT/InfoSec)• StateGovernment• FinancialServices• Telecommunications• Manufacturing
Vulnerabilities found in e-banking systems (the financial sector) are not considered in this report. The weaknesses uncovered in those systems have been analyzed separately and the results are published in the Positive Research report “Vulnerability Statistics in Remote Banking Systems, 2011 — 2012.” Because of this, systems belonging to financial sector organizations constitute only 5% of the web applications considered in this study. Typically, these were more information-based web sites rather than transactional ones. Given the small number of financial sector applications analyzed in this study, we have not provided individual results for this sector in this report.
dISTRIBUTION OF ALL WEB APPLICATIONS ANALYZEd IN 2012 BY INdUSTRY
ii
39%30%
14%12% 5%
10% Remote banking systems (analyzed individually)
Information technologies and information security
Government Agencies
Telecommunications ManufacturingFinancial sector
7

8
We can also classify the applications we assessed according to the programming language used to develop them: ASP.NET, Java, Perl, and PHP. The most popular languages were PHP (36%) and Perl (25%). Considerable portions of the applications analyzed were developed in Java (20%) and ASP.NET (15%). Other programming languages were far rarer.
The most widely represented sectors were IT/InfoSec (43%) and government agencies (33%). Other sectors represented only a small part of the sampling
ii
43%33%
13%6% 5%
Information technologies and information security
Government Agencies
Telecommunications Manufacturing Financial sector
dISTRIBUTION OF PARTICIPANTS BY INdUSTRY
dISTRIBUTION OF PARTICIPATING APPLICATIONS BY INdUSTRY
i 43
33
13
6
5
Information technologies and information security
INDUSTRY PERCENTAGE
Government Agencies
Telecommunications
Manufacturing
Financial sector

9
The most popular front-end web servers used were Nginx web servers which accounted for 43% of the sites we analyzed. Almost a quarter of the applications we considered were controlled by Apache web servers, which were the most popular web servers in 2010 and2011. The least widespread servers were Jboss, Microsoft Internet Information Services (IIS), and Apache Tomcat.
Only two of the web applications analyzed in this study used commercial Content Management Systems (CMSs). Other applications did not use a CMS, since they had been developed specifically for a particular client. For this reason, we did not analyze statistical data on how site security levels are affected by the CMS used.
dISTRIBUTION OF WEB APPLICATIONS BY WEB SERVERS USEd
dISTRIBUTION OF WEB APPLICATIONS BY WEB SERVERS USEd
43
24
15
12
6
NGINX
APACHE
JBOSS WEB
APACHE TOMCAT
IIS
WEB SERVER PERCENTAGE
43% 24% 15% 12%Jboss Web Apache TomcatNginx IISApache
6%
dISTRIBUTION OF APPLICATIONS BY dEVELOPMENT PROGRAMMING LANGUAGES
36% 25% 19% 15% 5%
PHP Perl Java OthersASP.NET

10
This section examines the frequency of occurrence of various vulnerabilities classified according to the threats represented in WASC TC v. 2. It also considers the risk levels for each vulnerability.
In the course of this study, vulnerabilities were revealed in all of the web applications we examined. Of these, 45% of the applications contained high-risk vulnerabilities and almost all of them (90%) featured medium-risk vulnerabilities
Figure 4 above compares the results from 2012 to those of 2010 and 2011. We can see that the percentage of applications with critical vulnerabilities decreased from 76% in 2010 to 45% in 2012. The percentage of applications containing medium-risk vulnerabilities remained stayed relatively flat and remained extremely high (over 90%). While the percentage of applications containing low-risk vulnerabilities rose sharply in 2012 — more than doubling to 73% compared with 30% in the previous year.
PERCENTAGE OF VULNERABLE APPLICATIONS BY VULNERABILITY RISk LEVELS COMPAREd TO 2011 ANd 2012
VULNERABILITY STATISTICS4
MOST WIdESPREAd VULNERABILITIES 4.1.
0
20
40
60
80
100
%
High Medium Low
2010
2011
2012
2010
2011
2012
2010
2011
2012

11
In 2012, low-risk Fingerprinting vulnerabilities became numerous with almost three quarters (73%) of the websites examined showing evidence of this kind of weakness. Cross-Site Scripting held onto second place, in the top ten, having been found in 63% of the web applications analyzed. Almost half (46%) of the applications had weak mechanisms to prevent Brute Force attacks. Although SQL Injection, which has a high-risk level, was not among the three most widespread vulnerabilities, it was found in a third of the applications we analyzed.
In 2010 and 2011, Cross-Site Request Forgery (CSRF) was the most widespread vulnerability type — found in
the resources examined (61%). Also SQL Injection (47%), OS Commanding (28%), and Path Traversal (28%) were
some of the top vulnerabilities found in the previous two years.
Comparably, in 2012, the percentages of web applications with each of these high- risk vulnerabilities were
reduce: SQL Injection affected 33% of applications, Path Traversal was possible on 18% and OS Commanding
threatened 16% of the applications examined.
Cross-Site Scripting
Brute Force
Fingerprinting
SQL Injection
Cross-Site Request Forgery
Credential/Session Prediction
Server Miscon�guration
Path Traversal
Information Leakage
URL Redirector Abuse
73%
63%
33%
30%
31%
30%
18%
24%
18%
46%
THE MOST WIdESPREAd VULNERABILITIES (PERCENTAGE OF APPLICATIONS VULNERABLE)
12
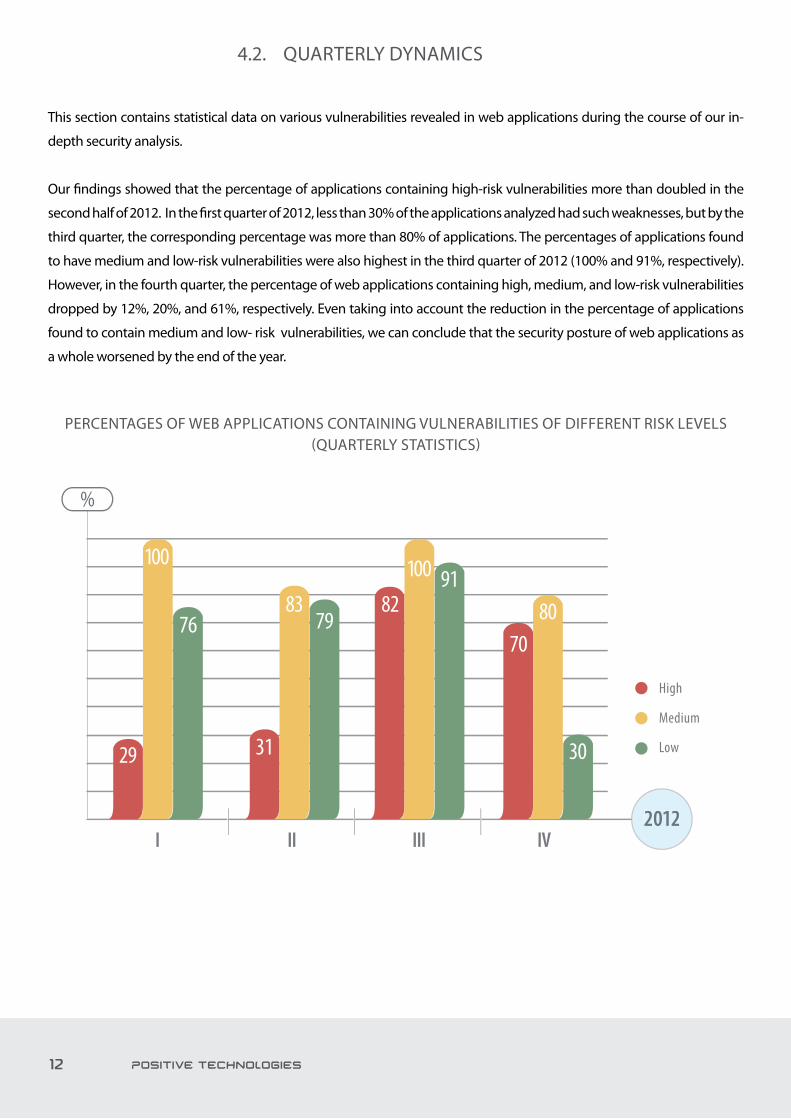
This section contains statistical data on various vulnerabilities revealed in web applications during the course of our in-
depth security analysis.
Our findings showed that the percentage of applications containing high-risk vulnerabilities more than doubled in the
second half of 2012. In the first quarter of 2012, less than 30% of the applications analyzed had such weaknesses, but by the
third quarter, the corresponding percentage was more than 80% of applications. The percentages of applications found
to have medium and low-risk vulnerabilities were also highest in the third quarter of 2012 (100% and 91%, respectively).
However, in the fourth quarter, the percentage of web applications containing high, medium, and low-risk vulnerabilities
dropped by 12%, 20%, and 61%, respectively. Even taking into account the reduction in the percentage of applications
found to contain medium and low- risk vulnerabilities, we can conclude that the security posture of web applications as
a whole worsened by the end of the year.
PERCENTAGES OF WEB APPLICATIONS CONTAINING VULNERABILITIES OF dIFFERENT RISk LEVELS (QUARTERLY STATISTICS)
QUARTERLY dYNAMICS4.2.
%
I II III IV20122012
29
76
31
8379
8291
7080
30
100 100
High
Medium
Low

13
I
II
III
IV
20122012
7129
5531
20% 40% 60% 80% 100%
14
1282
3070
High
Medium
Low
This vfigure shows the vulnerabilities found in each risk level as a percentage of all vulnerabilities found in each of quarter in 2012. A considerable reduction in the percentage of medium-risk vulnerabilities was traced throughout the year. The percentage of low-risk vulnerabilities remained almost the same throughout the year (about 13%). The percentage of high-risk vulnerabilities declined to only 8% by the second quarter of 2012. However, the situation had changed for worse by the end of the year, when almost one third of the vulnerabilities revealed were classified as posing a high level of risk.
Further, Figure 8 below illustrates how the situation worsened towards the end of the year. The diagram represents the proportions of applications analyzed each quarter according to the maximum level of vulnerability risk found within them.
%
I II III IV20122012
13 139 8
77
1626
10
31
57
78
63High
Medium
Low
VULNERABILITY RISk LEVELS AS A PERCENTAGE OF ALL VULNERABILITIES FOUNd(QUARTERLY STATISTICS)
PROPORTIONS OF WEB APPLICATIONS BY THE MAxIMAL RISk LEVEL OF REVEALEd VULNERABILITIES

14
According to the data collected, in the first half of 2012 the percentage of web applications containing high-
risk vulnerabilities declined considerably, while the percentage of those containing low-risk vulnerabilities
significantly increased. The percentage of critical vulnerabilities was lowest in the first quarter of 2012. In the
second half the year, the percentage of critical vulnerabilities returned to levels seen in the beginning of 2011
(70—80%). Vulnerabilities of medium-risk proved to be most widespread in 2012, as they were in the two previous
years. About 90% of the applications analyzed in 2012 had such weaknesses, staying rather consistent with the
levels reported in each of the two previous years.
At the beginning of the year, one third of applications under consideration contained high-risk vulnerabilities. Other applications had both low and medium-risk l weaknesses. In the second quarter, the percentage of web applications with critical vulnerabilities remained mostly constant; as for the rest, the situation improved: 14% of the web applications analyzed had only low-risk weaknesses. In the third quarter however, the figures were much worse: over 80% of the applications analyzed were found to have critical vulnerabilities, with this situation improving slightly by the end of 2012.
To get a better picture of the overall trends, we compared our results for the past three years. Figure 9 shows the percentage of applications containing vulnerabilities of different risk levels over this time.
TIME HISTORY OF PERCENTAGE OF APPLICATIONS CONTAINING VULNERABILITIESOF dIFFERENT RISk LEVELS
%
0
20
40
60
80
I II III IV I II III IV I II III IV
100
2010 2011 2012
High
Medium
Low

15
Table shows the percentage of the web applications analyzed in 2010—2012 that contained the most
widespread critical vulnerabilities such as SQL Injection, Path Traversal, OS Commanding, and Remote Inclusion.
Figure down represents the corresponding graphs for each of the above-mentioned vulnerability types.
VULNERABILITY
SQL Injection
Path Traversal
OS Commanding
Remote File Inclusion
33 77 55 55 29 33 4 39 29 21 45 60
67 8 18 36 21 50 44 11 18 — 55 30
67 15 36 36 57 33 15 18 18 3 36 30
— — 9 — — — — 4 — — — —
33 77 55 55
67 8 18 36
67 15 36 36
— — 9 —
29 33 4 39
21 50 44 11
57 33 15 18
— — — 4
29 21 45 60
18 — 55 30
18 3 36 30
— — — —
I II III IV I II III IV I II III IV
201220112010
TIME HISTORY OF PERCENTAGE OF APPLICATIONS CONTAINING CRITICAL VULNERABILITIES
TIME HISTORY OF PERCENTAGE OF APPLICATIONS CONTAINING CRITICAL VULNERABILITIES
Path Traversal
SQL Injection
OS Commanding
Remote File Inclusion
%
0
20
40
60
80
I II III IV I II III IV I II III IV
100
2010 2011 2012
16
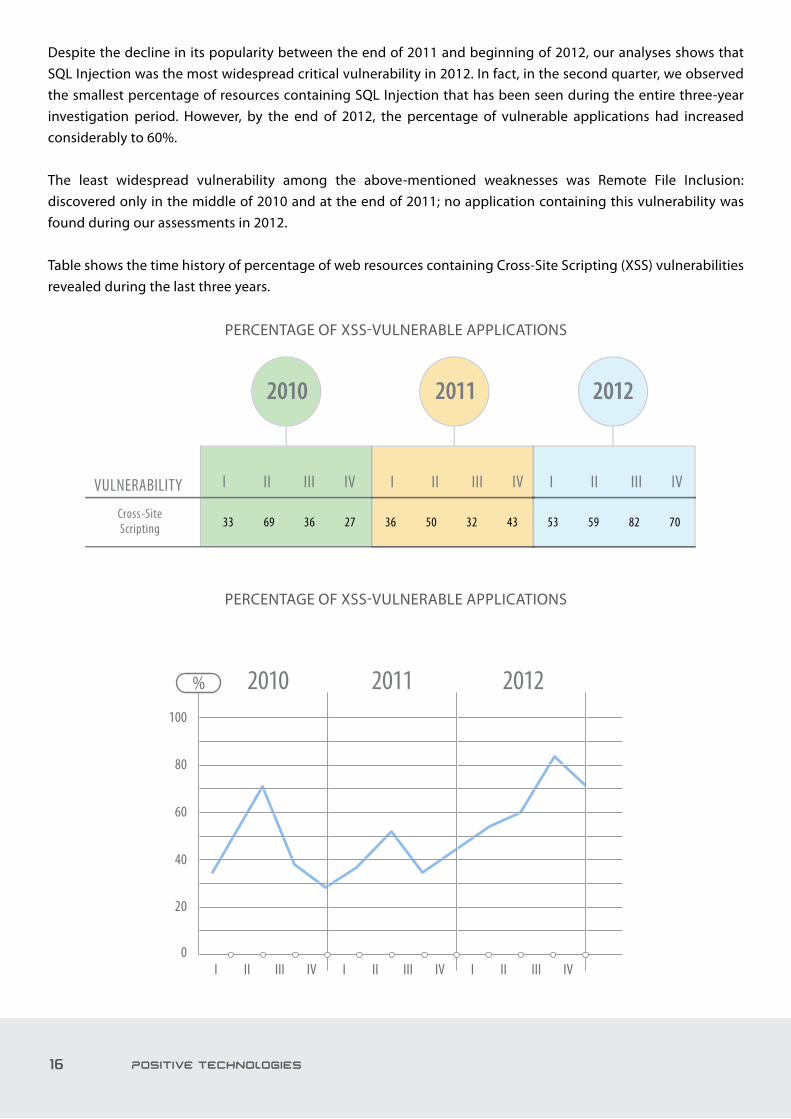
despite the decline in its popularity between the end of 2011 and beginning of 2012, our analyses shows that SQL Injection was the most widespread critical vulnerability in 2012. In fact, in the second quarter, we observed the smallest percentage of resources containing SQL Injection that has been seen during the entire three-year investigation period. However, by the end of 2012, the percentage of vulnerable applications had increased considerably to 60%.
The least widespread vulnerability among the above-mentioned weaknesses was Remote File Inclusion: discovered only in the middle of 2010 and at the end of 2011; no application containing this vulnerability was found during our assessments in 2012.
Table shows the time history of percentage of web resources containing Cross-Site Scripting (xSS) vulnerabilities revealed during the last three years.
PERCENTAGE OF xSS-VULNERABLE APPLICATIONS
PERCENTAGE OF xSS-VULNERABLE APPLICATIONS
I II III IV I II III IV I II III IV
201220112010
Cross-Site Scripting 33 69 36 27 36 50 32 43 53 59 82 70
VULNERABILITY
%
0
20
40
60
80
I II III IV I II III IV I II III IV
100
2010 2011 2012

17
In 2012, a steady increase in the percentage of web applications containing xSS vulnerabilities was observed. In the fourth quarter, this rate dipped a little to 70%. The highest percentage of applications containing xxS, revealed during the three-year investigation period, was found in the third quarter of 2012 when it was 80%.
Table shows percentages of web resources containing Cross-Site Request Forgery (CSRF) vulnerabilities over time. The corresponding diagram is given in Figure.
In 2012, our experts found less than half as many web applications containing CSRF vulnerabilities (33%) as they found in 2011 (68%). However, the rate from 2012 was just slightly lower than the one recorded in 2010 (39%).
As a whole, we can mark the beginning of 2012 as having the lowest number of critical vulnerabilities during our multi-year study period. However, by the end of 2012 the situation appeared to have reverted back to levels seen three years before.
PERCENTAGE OF CSRF-VULNERABLE APPLICATIONS
201220112010Cross-Site
Request Forgery 39 68 33
VULNERABILITY
2010
2011
2012
39% 33%
Percentageof CSRF-vulnerable
applications
68%

18
Our analysis allowed us to determine the proportions of vulnerabilities with different risk levels that appear in applications developed using different programming languages. The results are shown in Figure 13.
The highest percentage (83%) of resources containing critical vulnerabilities was revealed in applications developed in PHP. Applications developed in Perl had the least medium-risk l vulnerabilities, while we found medium risk vulnerabilities in all of the applications developed in Java. The smallest percentage (10%) of resources containing critical vulnerabilities was found among those applications developed in ASP.NET.
Figure 14 shows statistical data on the risk levels of all vulnerabilities revealed in applications of each type. Only 1% of the vulnerabilities revealed in web applications developed in ASP.NET had high-risk levels, while one out of every three vulnerabilities in PHP applications were critical. Medium-risk vulnerabilities were reported being most widespread in all types of systems (60—80%).
PERCENTAGE OF APPLICATIONS CONTAINING VULNERABILITIES OF dIFFERENT RISk LEVELS (BY PROGRAMMING LANGUAGE)
PROPORTIONS OF VULNERABILITIES WITH dIFFERENT RISk LEVELS dEPENdINGON WEB APPLICATION dEVELOPMENT LANGUAGE
TYPICAL VULNERABILITIES FOR VARIOUS PROGRAMMING LANGUAGES
4.3.
%
10
63
80
15
100
62
29
88 839290
76
ASP.NET Java Perl PHP
High
Medium
Low
%
63
219 9 9
82
720
28
75 73
ASP.NET Java Perl PHP
High
Medium
Low

19
Our investigations found that 83% of web applications developed in PHP contained critical vulnerabilities; the remaining 17% of applications contained both medium and low-risk vulnerabilities. Perl took second place with almost one third of applications developed in this language containing high-risk vulnerabilities.
Figure shows the proportion of web applications by the highest risk level of vulnerabilities found in each, categorized by programming language.
For Java, the Positive Research experts revealed critical vulnerabilities in 15% of applications. The remaining
applications all contained at least medium-risk vulnerabilities. It should be noted that the majority of the Java-
based applications analyzed belonged to one large project whose developers constantly control application
security levels and eliminate vulnerabilities. The data for Java applications can, in many respects, be used to
illustrate the benefits of prioritizing security within the bounds of a concrete development project. The situation
with Java applications as a whole may in fact be much worse when the effect of this single project is discounted.
The percentage of critical vulnerabilities revealed in Java applications not belonging to the above-mentioned
project was 66%.
Only one tenth of web applications developed in ASP.NET contained both high-and low-risk vulnerabilities. It
might be tempting, therefore to assume web applications developed in ASP.NET to be the most secure among
those analyzed in 2012. However, when we take into account the some 90% of ASP.NET applications that contained
at least medium-risk vulnerabilities, you realize that the overall security level of these applications is far from
acceptable.
20% 40% 60% 80% 100%
1783
5329 18
8515
1080ASP.NET
Java
Perl
PHP
10
High
Medium
Low
PROPORTIONS OF WEB APPLICATIONS BY THE MAxIMUM RISk LEVELOF REVEALEd VULNERABILITIES

20
Table shows the proportion of applications found to contain the most widespread vulnerabilities broken
down by the programming language. Only two critical vulnerabilities (SQL Injection and OS Commanding)
appear in the top-five for each language; they were seen only in PHP web applications. One of the lower risk
level vulnerabilities, Fingerprinting, proved to be the most widespread. This vulnerability was common in
applications developed in Java, ASP.NET, and Perl.
ASP.NET
Java
Perl
PHP
Credential/Session Prediction
InformationLeakage
URL RedirectorAbuse
Brute Force
Fingerprinting
OS Commanding
SQL Injection
63%42%
42%
Cross-Site Scripting 63%
63%
54%
15%
50%
Brute Force
Fingerprinting 62%
46%
Cross-Site Scripting 54%
Credential/Session Prediction
InformationLeakage
24%Credential/
Session Prediction 24%
50%
Brute Force
Fingerprinting 90%
Fingerprinting 88%
70%
Brute Force 35%
Cross-Site Scripting 60%
Cross-Site Scripting 71%
High
Medium
Low
THE MOST WIdESPREAd VULNERABILITIES (BY PROGRAMMING LANGUAGES)

21
PERCENTAGE OF APPLICATIONS dEVELOPEd IN VARIOUS PROGRAMMING LANGUAGES ANd CONTAINING MOST WIdESPREAd VULNERABILITIES (PART 2)
%
17
54
40
24
Credential/Session Prediction
63 62
90 88
Fingerprinting
13
50
2415
InformationLeakage
25
50
URL RedirectorAbuse
Java
ASP.NET
Perl
PHP
%
63
42
8 81018
SQL Injection OSCommanding
6354
60
71
Cross-Site Scripting
4235
70
46
Brute Force
Java
ASP.NET
Perl
PHP
PERCENTAGE OF APPLICATIONS dEVELOPEd IN VARIOUS PROGRAMMING LANGUAGES ANd CONTAINING MOST WIdESPREAd VULNERABILITIES (PART 1)

22
A critical vulnerability of SQL Injection was also revealed in other applications developed in Java, ASP.NET, and Perl, but the percentage of vulnerable applications remained below 20% — making them a less common occurrence than other vulnerabilities. OS Commanding vulnerabilities were also revealed in Java web applications; however, the percentage of vulnerable applications was only 8% in 2012.
A considerable part of web resources contained Fingerprinting, Brute Force, and Cross-Site Scripting vulnerabilities irrespective of the programming language type. URL Redirector Abuse vulnerability was revealed only in applications developed in PHP and ASP.NET.
Brute-Force vulnerability is most widespread in web applications developed in ASP.NET. This can be explained by the fact that this technology is typically used in commercial applications, implying the presence of a centralized user credentials repository (Active directory). When deploying such products, the application owner often relies on the developer when it comes to security, but forgets about applying protection mechanisms such as multi-factor authentication or CAPTCHA or blocking brute-force attempts. At the same time, integration with Active directory turns such applications into the most interesting targets for attackers trying to obtain user identifiers and passwords.
PERCENTAGE OF APPLICATIONS CONTAINING CRITICAL VULNERABILITIES
88
75
43
14
-
WEB SERVER
Apache
Apache Tomcat
Nginx
IIS
Jboss Web
PERCENTAGE
The results of our investigations reveal that 88% of applications hosted by Apache web servers contained critical vulnerabilities. Second place was taken by web applications under Apache Tomcat control.
TYPICAL VULNERABILITIES FOR VARIOUS WEB SERVERS4.4.
23
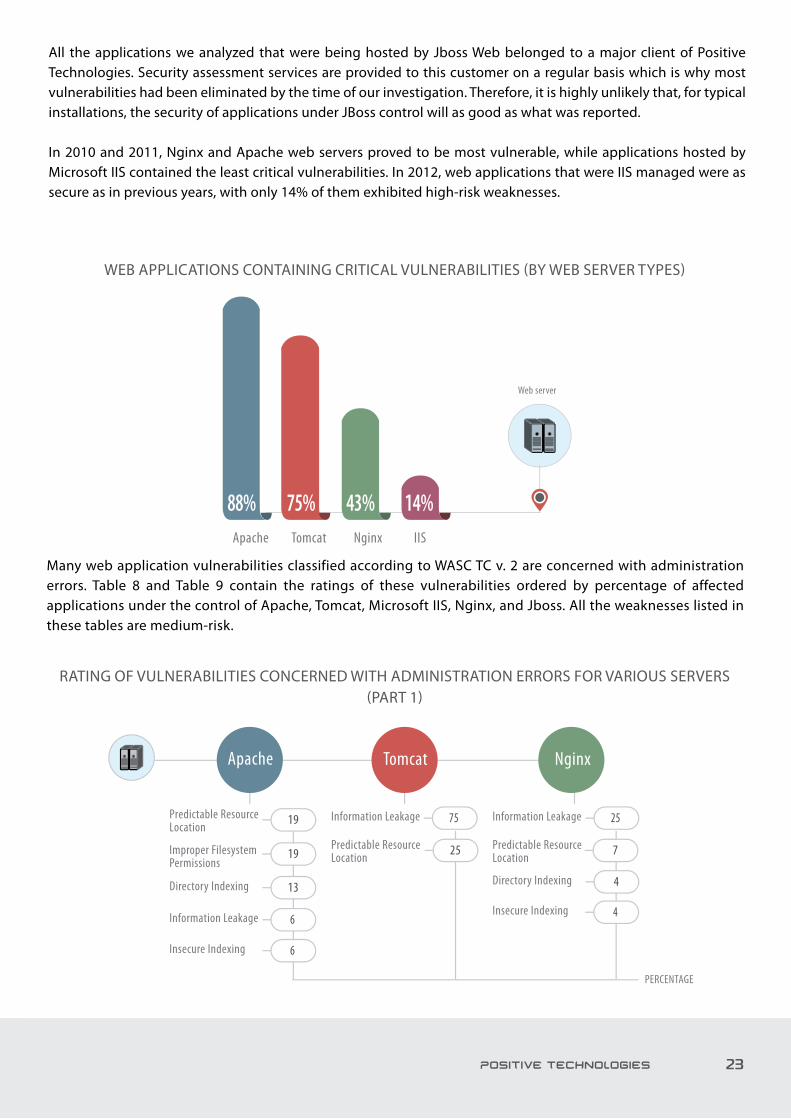
WEB APPLICATIONS CONTAINING CRITICAL VULNERABILITIES (BY WEB SERVER TYPES)
RATING OF VULNERABILITIES CONCERNEd WITH AdMINISTRATION ERRORS FOR VARIOUS SERVERS (PART 1)
88% 75% 43% 14%Tomcat Nginx IISApache
Web server
All the applications we analyzed that were being hosted by Jboss Web belonged to a major client of Positive Technologies. Security assessment services are provided to this customer on a regular basis which is why most vulnerabilities had been eliminated by the time of our investigation. Therefore, it is highly unlikely that, for typical installations, the security of applications under JBoss control will as good as what was reported.
In 2010 and 2011, Nginx and Apache web servers proved to be most vulnerable, while applications hosted by Microsoft IIS contained the least critical vulnerabilities. In 2012, web applications that were IIS managed were as secure as in previous years, with only 14% of them exhibited high-risk weaknesses.
Many web application vulnerabilities classified according to WASC TC v. 2 are concerned with administration errors. Table 8 and Table 9 contain the ratings of these vulnerabilities ordered by percentage of affected applications under the control of Apache, Tomcat, Microsoft IIS, Nginx, and Jboss. All the weaknesses listed in these tables are medium-risk.
PERCENTAGE
Predictable ResourceLocation
Improper FilesystemPermissions
Directory Indexing
Apache Tomcat Nginx
19
13 Directory Indexing 4
Information Leakage 6
Information Leakage 75 Information Leakage 25
Insecure Indexing 6
Insecure Indexing 4
19
Predictable ResourceLocation 25 Predictable Resource
Location 7
24
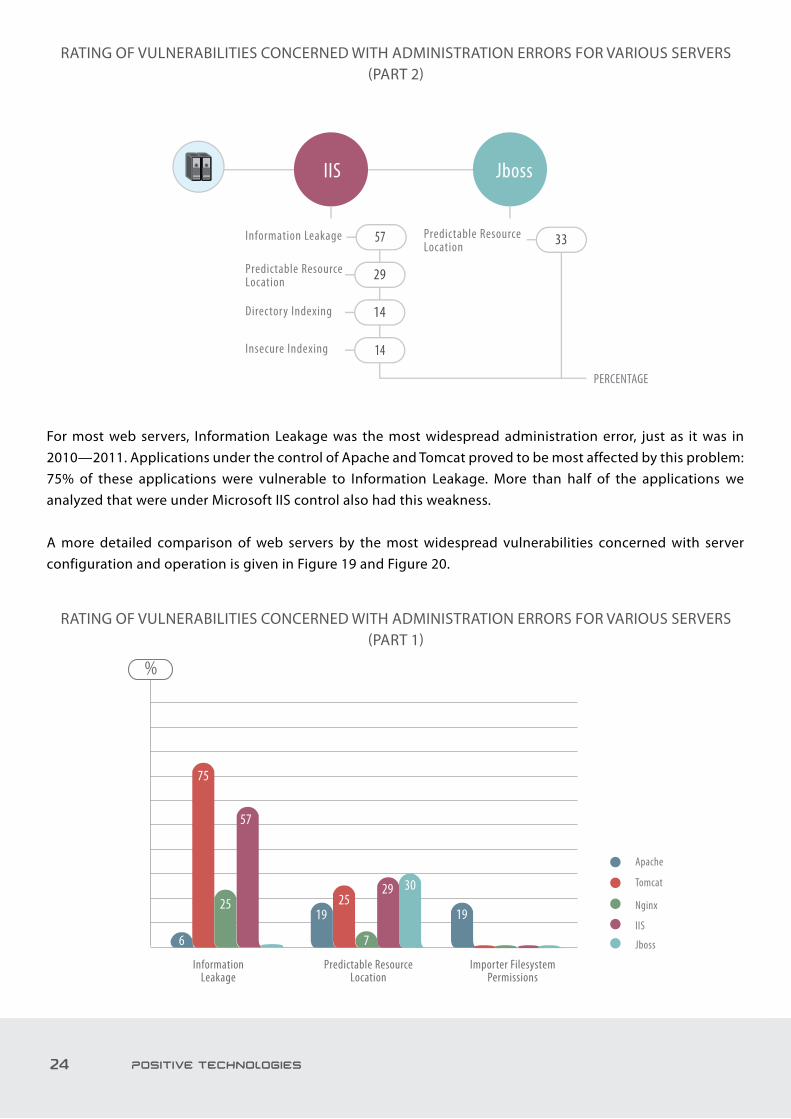
RATING OF VULNERABILITIES CONCERNEd WITH AdMINISTRATION ERRORS FOR VARIOUS SERVERS (PART 2)
RATING OF VULNERABILITIES CONCERNEd WITH AdMINISTRATION ERRORS FOR VARIOUS SERVERS (PART 1)
For most web servers, Information Leakage was the most widespread administration error, just as it was in 2010—2011. Applications under the control of Apache and Tomcat proved to be most affected by this problem: 75% of these applications were vulnerable to Information Leakage. More than half of the applications we analyzed that were under Microsoft IIS control also had this weakness.
A more detailed comparison of web servers by the most widespread vulnerabilities concerned with server configuration and operation is given in Figure 19 and Figure 20.
Directory Indexing 14
Information Leakage 57
Insecure Indexing 14
Predictable ResourceLocation 29
Predictable ResourceLocation 33
PERCENTAGE
JbossIIS
%
Jboss
Tomcat
Nginx
IIS
Apache
7
19
29 3025
Predictable ResourceLocation
6
57
75
25
InformationLeakage
19
Importer FilesystemPermissions

25
PERCENTAGE OF VULNERABLE APPLICATIONS UNdER VARIOUS WEB SERVERS (PART 2)
5% 5%7%14% 16% 16%Directory Indexing Insecure Indexing
Tomcat
Nginx
IIS
Apache
Only 6% of applications under the control of Apache web servers were vulnerable to Information Leakage. The vulnerability Improper Filesystem Permissions was found only on applications under Apache control, where it turned out to be one of the most widespread issues, along with Predictable Resource Location. The percentage of IIS web server applications vulnerable to directory Indexing and Secure Indexing was below 14%. Web applications hosted by Jboss contained only one administration error — Predictable Resource Location: one third of the applications we analyzed were affected by this issue. However, as stated previously, this data relates to a single client installation and may not be representative of the industry average for JBoss security.
According to our findings, applications using Nginx web servers proved to have the least administration errors. It is worth noting that Nginx also had the best results among all web servers when it came to administration error-based vulnerabilities in 2010 and 2011.
Within the limits of this investigation, we analyzed web applications from five industry sectors: manufacturing, information technologies and information security (IT and InfoSec), government agencies, financial and telecommunications sectors. In each sector, vulnerabilities of various risk levels were revealed. The percentages of vulnerabilities are shown in Figure. As previously stated, since there were only a few applications from the financial sector to analyze, the results for this industry are not considered in this section.
The greatest number of applications containing high-risk vulnerabilities were found in the telecommunications sector (78% of all vulnerabilities in this sector were critical). Among manufacturing companies, only half the applications were found to have critical weaknesses. The applications of IT and InfoSec companies had the third most (45%), while State-run organizations; one in three web applications contained a high-risk vulnerability.
STATISTICS BY VARIOUS INdUSTRIES 4.5.

26
PERCENTAGES OF APPLICATIONS CONTAINING HIGH-RISk VULNERABILITIES
PERCENTAGES OF APPLICATIONS WITH VULNERABILITIES OF dIFFERENT RISk LEVELS FOR EACH OF THE INdUSTRIES UNdER CONSIdERATION
In 2012, statistical data on IT organizations was supplemented with data on companies specializing in InfoSec. Perhaps it is this fact that resulted in a significant improvement of the security posture of this segment. In 2010 and 2011, 75% of applications contained high-risk vulnerabilities versus 45% in 2012. A unique feature of this sector was the presence of xPath Injection vulnerabilities which were not found in the applications offered by other types of organizations. As for the rest of the vulnerabilities detected, the situation was similar to the general statistics: there were many critical vulnerabilities such as OS Commanding, Path Traversal, and SQL Injection in web applications. The Positive Research experts also uncovered some denial of Service vulnerabilities. Furthermore, we detected about fifteen SQL Injection weaknesses in a web application belonging to a reputable IT company based-on a leading commercial CMS.
78
50
45
27
i Information technologies and information security
Government Agencies
Telecommunications
INDUSTRY PERCENTAGE
Manufacturing
ii
75%
75%
50%
79%
86%
45%
59%
91%
27%
100%
100%
78%
Information technologies and information security
Government Agencies
Telecommunications
Manufacturing
High
Medium
Low

27
Half of the web applications analyzed which belong to manufacturing companies were found to contain critical vulnerabilities. This represents a similar picture from that seen in 2010 and 2011. We recommend that information security specialists working in such companies pay more attention to OS Commanding and SQL Injection vulnerabilities, as well as to Cross-Site Scripting vulnerabilities, which are numerous, though less attractive to attackers. The applications from this sector contained less medium-risk vulnerabilities than other sectors; but 75% of manufacturing companies’ web applications still suffered from some vulnerabilities.
Our investigation found that one third of all web applications belonging to government agencies had high-risk weaknesses. In the previous year that percentage had reached 65%. In 2012, there was a large state project which successfully eliminated previously-revealed vulnerabilities – the results of which are evident in this year’s results. If we exclude this project from the sampling, the percentage of web applications containing critical vulnerabilities rises to 50%, which is similar to the percentage found in applications operated by manufacturing companies. On the one hand, the dip in the number of applications with critical weaknesses indicates a positive step towards improved security. On the other hand, the percentage of vulnerable applications is still too large, especially if we take into account that many public services requiring confidential information to be transferred and processed are now available via the Internet. The following attack vectors are most dangerous for state web applications: SQL Injection, Path Traversal, OS Commanding, and denial of Service. Moreover, the only application found to be infected with a virus during our 2012 investigations was in this sector.
PERCENTAGE OF APPLICATIONS CONTAINING HIGH-RISk VULNERABILITIES BY INdUSTRY
78
50
50
45i
ОТРАСЛЬ ЭКОНОМИКИ ДОЛЯ, %
Information technologiesand information security
Government Agencies
Telecommunications
Manufacturing

28
Web applications in the telecommunications sector proved to be most vulnerable in 2012. All the applications tested contained medium and low-risk vulnerabilities and almost 80% of applications contained high-risk vulnerabilities. This was only marginally better than the figures for 2010 and 2011 (88%). As before, profile web applications were subjected to client-side attacks and had many Cross-Site Scripting vulnerabilities. The most dangerous and widespread vulnerabilities were Path Traversal and SQL Injection; OS Commanding and xML Injection were far more rare.
Figure shows the percentage of applications vulnerable to SQL Injection, Path Traversal, and OS Commanding. The percentage of applications containing these three vulnerabilities was highest in the telecoms sector. Amongst manufacturing companies and the public sector, the results were less than 27%. The tendency towards improvements in security levels was also observed in the field of information technologies and information security: the percentage of vulnerable applications found here decreased by between two and four times for various weaknesses. However, the number of vulnerable applications that were found means there is much more work to do to achieve an acceptable level protection.
PERCENTAGE OF VULNERABLE APPLICATIONS FROM VARIOUS INdUSTRIES
SQL Injеction OS Commanding Path Traversal
%
44
25
25
2731
44
14 10 9 14
25
67
Information technologiesand information security
Government Agencies
Telecommunications
Manufacturing
Figure represents the proportions of vulnerabilities with different risk levels revealed in various industries. We found medium-risk vulnerabilities were most widespread (65 — 75% in every industry).
The statistical data looks rather balanced. Only the IT and InfoSec sector stands out with 21% of web applications containing high--risk vulnerabilities. The corresponding percentage for telecommunications companies was 19%. Low-risk vulnerabilities were rather rare (10 — 20% in all industries). As a whole, the figures were almost the same in all industries.

29
%
10 15 1521
64
13 1119
72
9
75 77
i
Information technologiesand information security
GovernmentAgencies
Telecommunications Manufacturing
High
Medium
Low
PROPORTIONS OF VULNERABILITIES WITH dIFFERENT RISk LEVELSREVEALEd IN VARIOUS INdUSTRIES
When considering the greatest risk level of vulnerabilities revealed in web applications, we should mention the
telecommunications sector, which had the most critical vulnerabilities. In manufacturing and IT/InfoSec companies,
there were web applications containing only low-risk vulnerabilities (in manufacturing, the percentage was as much
as 25%). However, the percentage of applications containing critical vulnerabilities in the manufacturing sector is
also large at50%.
PROPORTIONS OF VULNERABILITIES WITH dIFFERENT RISk LEVELSREVEALEd IN VARIOUS INdUSTRIES
2278
7327
4545
252550i
10
20% 40% 60% 80% 100%
Information technologiesand information security
GovernmentAgencies
Telecommunications
Manufacturing
High
Medium
Low

30
PERCENTAGE OF WEB APPLICATIONS ACCORdING TO THE GREATEST RISk LEVELOF VULNERABILITIES REVEALEd IN THEM
The investigation conducted in 2012 showed that the best overall posture was in the public sector, where the percentage of applications with critical vulnerabilities was lowest (see Figure 26). However, this result can be explained by the fact that the sampling contained the applications operated by a single, large organization where they find and eliminate vulnerabilities regularly. After excluding this organization’s applications from the sampling, the statistics of applications containing vulnerabilities of different risk levels will look as shown in Figur.
2278
5050
4545
252550i
10
20% 40% 60% 80% 100%
Information technologiesand information security
GovernmentAgencies
Telecommunications
Manufacturing
High
Medium
Low

31
CONCLUSIONS
REFERENCES
In the course of this investigation, we have shown how vulnerable modern web applications are.
The average security level of web applications slightly improved in 2012 compared to 2011. The percentage
of applications containing critical vulnerabilities declined during this period by about 15% to around
45%. Only one infected web application was discovered, as compared to previous years where 10% of the
applications contained malicious code. On the other hand, there are signs of stagnation: the percentage
of web applications with critical weaknesses remained the same in the manufacturing sector, with
telecommunications applications appearing to be improving their security l very slowly.
The general quarterly dynamics showed that in the first half of 2012, the percentage of web applications
containing critical weaknesses dropped, but in the third quarter, it rose back to the level of previous years.
1. WASC Threat Classification v. 2.0: http://projects.webappsec.org/Threat-Classification.
2. Common Vulnerability Scoring System: http://www.first.org/cvss.
3. OWASP Top Ten Project: https://www.owasp.org/index.php/OWASP_Top_Ten_Project.

32
APPLICATION А
Threat Type Basic CVSS Score
Abuse of Functionality 4 (AV:N/AC:H/Au:N/C:P/I:P/A:N)
Brute Force Attack 6.8 (AV:N/AC:M/Au:N/C:P/I:P/A:P)
Buffer Overflow 10 (AV:N/AC:L/Au:N/C:C/I:C/A:C)
Content Spoofing 5 (AV:N/AC:L/Au:N/C:N/I:P/A:N)
Credential/Session Prediction 6.8 (AV:N/AC:M/Au:N/C:P/I:P/A:P)
Cross-Site Scripting 6.4 (AV:N/AC:L/Au:N/C:P/I:P/A:N)
Cross-Site Request Forgery 5 (AV:N/AC:L/Au:N/C:N/I:P/A:N)
denial of Service 7.8 (AV:N/AC:L/Au:N/C:N/I:N/A:C)
Format String Attack 10 (AV:N/AC:L/Au:N/C:C/I:C/A:C)
HTTP Request Splitting 6.4 (AV:N/AC:L/Au:N/C:P/I:P/A:N)
HTTP Response Splitting 6.4 (AV:N/AC:L/Au:N/C:P/I:P/A:N)
HTTP Request Smuggling 6.4 (AV:N/AC:L/Au:N/C:P/I:P/A:N)
HTTP Response Smuggling 6.4 (AV:N/AC:L/Au:N/C:P/I:P/A:N)
Integer Overflow 10 (AV:N/AC:L/Au:N/C:C/I:C/A:C)
LdAP Injection 10 (AV:N/AC:L/Au:N/C:C/I:C/A:C)
Mail Command Injection 5 (AV:N/AC:L/Au:N/C:N/I:P/A:N)
Null Byte Injection 5 (AV:N/AC:L/Au:N/C:N/I:P/A:N)
OS Commanding 10 (AV:N/AC:L/Au:N/C:C/I:C/A:C)
Path Traversal 7.8 (AV:N/AC:L/Au:N/C:C/I:N/A:N)
Predictable Resource Location 5 (AV:N/AC:L/Au:N/C:P/I:N/A:N)
Remote File Inclusion 10 (AV:N/AC:L/Au:N/C:C/I:C/A:C)
Routing detour 5 (AV:N/AC:L/Au:N/C:P/I:N/A:N)
SOAP Array Abuse 7.8 (AV:N/AC:L/Au:N/C:N/I:N/A:C)
SSI Injection 10 (AV:N/AC:L/Au:N/C:C/I:C/A:C)
Session Fixation 6.8 (AV:N/AC:M/Au:N/C:P/I:P/A:P)
SQL Injection 10 (AV:N/AC:L/Au:N/C:C/I:C/A:C)
URL Redirectors 2.6 (AV:N/AC:H/Au:N/C:N/I:P/A:N)
RISk LEVEL ASSESSMENT TECHNIQUE

33
Threat Type Basic CVSS Score
xPath Injection 10 (AV:N/AC:L/Au:N/C:C/I:C/A:C)
xML Attribute Blowup 5 (AV:N/AC:L/Au:N/C:P/I:N/A:N)
xML External Entity 5 (AV:N/AC:L/Au:N/C:P/I:N/A:N)
xML Entity Expansion 5 (AV:N/AC:L/Au:N/C:P/I:N/A:N)
xML Injection 7.5 (AV:N/AC:L/Au:N/C:P/I:P/A:P)
xQuery Injection 10 (AV:N/AC:L/Au:N/C:C/I:C/A:C)
Application Misconfiguration 5.1 (AV:N/AC:H/Au:N/C:P/I:P/A:P)
directory Indexing 5 (AV:N/AC:L/Au:N/C:P/I:N/A:N)
Fingerprinting 0 (AV:N/AC:L/Au:N/C:N/I:N/A:N)
Improper Parsing 10 (AV:N/AC:L/Au:N/C:C/I:C/A:C)
Improper Permissions 10 (AV:N/AC:L/Au:N/C:C/I:C/A:C)
Information leakage 5 (AV:N/AC:L/Au:N/C:P/I:N/A:N)
Insecure Indexing 5 (AV:N/AC:L/Au:N/C:P/I:N/A:N)
Insufficient Anti-automation 4 (AV:N/AC:H/Au:N/C:P/I:P/A:N)
Insufficient Authentication 6.8 (AV:N/AC:M/Au:N/C:P/I:P/A:P)
Insufficient Authorization 6.8 (AV:N/AC:M/Au:N/C:P/I:P/A:P)
Insufficient data Protection 5 (AV:N/AC:L/Au:N/C:P/I:N/A:N)
Insufficient Password Recovery 5.1 (AV:N/AC:H/Au:N/C:P/I:P/A:P)
Insufficient Process Validation 4 (AV:N/AC:H/Au:N/C:P/I:P/A:N)
Insufficient Session Expiration 6.8 (AV:N/AC:M/Au:N/C:P/I:P/A:P)
Insufficient Transport Layer Protection 4 (AV:N/AC:H/Au:N/C:P/I:P/A:N)
Server Misconfiguration 5.1 (AV:N/AC:H/Au:N/C:P/I:P/A:P)
Improper File System Permissions 4.4 (AV:L/AC:M/Au:N/C:P/I:P/A:P)

Page 2
About Positive TechnologiesPositive Technologies is a leading provider of vulnerability assessment, compliance management and threat analysis solutions to more than 1,000 global enterprise clients. Our solutions work seamlessly across your entire business: securing applications in development; assessing your network and application vulnerabilities; assuring compliance with regulatory requirements; and blocking real-time attacks. Our commitment to clients and research has earned Positive Technologies a reputation as one of the foremost authorities on SCADA, Banking, Telecom, Web Application and ERP security, and distinction as the #1 fastest growing Security and Vulnerability Management firm in 2012, as shown in an IDC report*. To learn more about Positive Technologies please visit www.ptsecurity.com.
*Source: IDC Worldwide Security and Vulnerability Management 2013-2017 Forecast and 2012 Vendor Shares, doc #242465, August 2013. Based on year-over-year revenue growth in 2012 for vendors with revenues of $20M+.
© 2014 Positive Technologies. Positive Technologies and the Positive Technologies logo are trademarks or registered trademarks of Positive Technologies. All other trademarks mentioned herein are the property of their respective owners.
WEBAPP_WP_A4.ENG.0019.01.DEC.29.2014
WHITE PAPER - WEB APPLICATION