· web viewattachment 3 scientific assessment of the public health and safety of poultry meat in...
TRANSCRIPT

Attachment 3
SCIENTIFIC ASSESSMENT OF THE PUBLIC HEALTH AND SAFETY OF
POULTRY MEAT IN AUSTRALIA
Food Standards Australia New Zealand
November 2005

TABLE OF CONTENTS
EXECUTIVE SUMMARY......................................................................................................................1
ACKNOWLEDGEMENTS...................................................................................................................8
ABBREVIATIONS.................................................................................................................................9
1 SCOPE AND PURPOSE..............................................................................................................11
2 INTRODUCTION........................................................................................................................11
2.1 Poultry Species..........................................................................................................................122.1.1 Risk assessment approach in relation to poultry species....................................................12
2.2 Sources of hazards associated with poultry meat in Australia.............................................13
2.3 Foodborne illness associated with poultry meat....................................................................13
2.4 Industry Description.................................................................................................................14
2.5 Poultry meat sectors other than chicken................................................................................15
2.6 Import and export of poultry meat products.........................................................................15
2.7 Consumption of poultry meat..................................................................................................15
2.8 Primary production of poultry meat......................................................................................162.8.1 Feed....................................................................................................................................182.8.2 Alternative poultry production systems..............................................................................19
2.9 Poultry processing....................................................................................................................19
2.10 Retail, food service and consumer-end section of the poultry meat supply chain..............20
3 RISK ASSESSMENT - SALMONELLA SPP.............................................................................21
3.1 Hazard Identification...............................................................................................................213.1.1 Growth and survival...........................................................................................................213.1.2 Salmonellosis incidence and outbreak data........................................................................223.1.3 Occurrence of Salmonella in food......................................................................................263.1.4 Salmonella Sofia.................................................................................................................27
3.2 Hazard Characterisation.........................................................................................................273.2.1 Pathogenicity......................................................................................................................273.2.2 Public health outcomes.......................................................................................................273.2.3 Host susceptibility..............................................................................................................283.2.4 Dose-response.....................................................................................................................28
3.3 Exposure Assessment...............................................................................................................293.3.1 On Farm..............................................................................................................................34
ii

3.3.2 Processing...........................................................................................................................393.3.3 Processing to consumption – a quantitative risk assessment..............................................42
3.4 Risk Characterisation...............................................................................................................463.4.1 Uncertainty and Variability................................................................................................50
4 RISK ASSESSMENT – CAMPYLOBACTER SPP....................................................................55
4.1 Hazard Identification...............................................................................................................554.1.1 Growth and Survival...........................................................................................................564.1.2 Reservoirs of Campylobacters............................................................................................574.1.3 Competitiveness in invasion...............................................................................................584.1.4 Viable but non-culturable cells of campylobacters............................................................584.1.5 Symptoms caused by pathogenic campylobacters..............................................................594.1.6 Incidence and outbreaks of campylobacteriosis.................................................................604.1.7 Seasonal variation...............................................................................................................614.1.8 Transmission vehicles of Campylobacter infection...........................................................634.1.9 Cross contamination as a major route transmitting campylobacters..................................644.1.10 Risk factors.........................................................................................................................64
4.2 Hazard Characterisation.........................................................................................................654.2.1 Pathogenesis.......................................................................................................................654.2.2 Susceptibility......................................................................................................................654.2.3 Antimicrobial resistance.....................................................................................................674.2.4 Dose-response relationship.................................................................................................68
4.3 Exposure Assessment...............................................................................................................704.3.1 Campylobacter contamination in poultry meat..................................................................704.3.2 Approach to Campylobacter exposure assessment............................................................724.3.3 On-farm..............................................................................................................................724.3.4 Risk factors associated with partial depopulation..............................................................754.3.5 Processing...........................................................................................................................764.3.6 From the end of processing to consumption – a quantitative assessment..........................80
4.4 Risk Characterisation...............................................................................................................82
5 QUALITATIVE RISK ASSESSMENT - OTHER MICROBIAL PATHOGENS.................94
5.1 Pathogenic Escherichia coli.....................................................................................................945.1.1 Hazard Identification..........................................................................................................945.1.2 Hazard Characterisation.....................................................................................................995.1.3 Exposure Assessment.......................................................................................................1025.1.4 Risk Characterisation........................................................................................................103
5.2 Staphylococcus aureus...........................................................................................................1135.2.1 Hazard Identification........................................................................................................1135.2.2 Hazard Characterisation...................................................................................................1165.2.3 Exposure Assessment.......................................................................................................1175.2.4 Risk Characterisation........................................................................................................119
5.3 Clostridium perfringens.........................................................................................................1225.3.1 Hazard Identification........................................................................................................1225.3.2 Hazard Characterisation...................................................................................................1255.3.3 Exposure Assessment.......................................................................................................126
iii

5.3.4 Risk Characterisation........................................................................................................129
5.4 Listeria monocytogenes..........................................................................................................1325.4.1 Hazard Identification........................................................................................................1325.4.2 Hazard Characterisation...................................................................................................1365.4.3 Exposure Assessment.......................................................................................................1375.4.4 Risk Characterisation........................................................................................................141
6 REVIEW OF CHEMICAL HAZARDS IN POULTRY MEAT............................................146
6.1 A paddock-to-plate approach to chemical risks..................................................................146
6.2 Agricultural and veterinary chemicals.................................................................................1486.2.1 Hazard Assessment...........................................................................................................1486.2.2 Exposure assessment........................................................................................................1496.2.3 Risk characterisation.........................................................................................................151
6.3 Contaminants..........................................................................................................................1516.3.1 Arsenic..............................................................................................................................1536.3.2 Cadmium..........................................................................................................................1546.3.3 Fluoride.............................................................................................................................1556.3.4 Lead..................................................................................................................................1586.3.5 Mercury............................................................................................................................1596.3.6 Selenium...........................................................................................................................1606.3.7 Dioxins..............................................................................................................................1626.3.8 Polychlorinated Biphenyls................................................................................................1666.3.9 Polycyclic Aromatic Hydrocarbons..................................................................................1686.3.10 Heterocyclic Amines........................................................................................................1696.3.11 Aflatoxin...........................................................................................................................1726.3.12 Ochratoxin A....................................................................................................................1746.3.13 Trichothecene toxins.........................................................................................................1766.3.14 Zearalenone......................................................................................................................1786.3.15 Fumonisin.........................................................................................................................181
6.4 Chemicals used in further processing of poultry meat.......................................................1826.4.1 Food Additives.................................................................................................................1826.4.2 Processing aids.................................................................................................................1866.4.3 Chemicals derived from Packaging..................................................................................187
6.5 Overall conclusions.................................................................................................................188
7 CONCLUSIONS.........................................................................................................................196
8 Glossary........................................................................................................................................198
Appendix 1. Chicken products implicated in foodborne outbreaks in Australia (1993-2001)....................199
Appendix 2. Australian Poultry Industry Association data for Salmonella isolates from chicken carcasses (1994 – 2003)*.........................................................................................................................201
Appendix 3. Model parameters used for modelling salmonellosis from the consumption of chicken meat in Australia..................................................................................................................................203
iv

Appendix 4. Model parameters used for modelling campylobacteriosis from the consumption of chicken meat in Australia......................................................................................................208
Appendix 5. Chemical Risk Assessment Framework...............................................................................211
Appendix 6. Assessing agricultural and veterinary chemicals................................................................213
Appendix 7. Current use of antimicrobial agents in poultry meat products.........................................215
Appendix 8. Maximum Residue Limits.....................................................................................................218
v

EXECUTIVE SUMMARY
Introduction
This report provides a scientific assessment of the public health and safety risks posed by consumption of poultry meat in Australia. The risk assessment was undertaken following discussions with risk managers who sought the following information:
What is the extent of food safety risk associated with the consumption of poultry meat and poultry meat products in Australia?
What are the factors along the poultry meat supply chain that have the greatest impact on public health and safety?
The report brings together available scientific and technical information on microbiological and chemical food safety hazards associated with poultry meat and poultry meat products and identifies specific stages along the primary production, processing and retail chain where levels or prevalence of hazards may be altered. Given the broad range of potential hazards associated with poultry meat and the limited availability of analytical data, the assessment on specific poultry meat food safety hazards ranged from qualitative to semi-quantitative.
This report provides a scientific basis for the development of a Primary Production and Processing Standard for Poultry Meat in Australia and informs risk management approaches designed to protect consumers from food-borne illnesses associated with the consumption of poultry meat and poultry meat products.
Scope
The scope of the assessment was to examine food safety hazards across the whole poultry meat supply chain, from the importation of fertilised eggs through to consumption. The principal microbiological and chemical hazards associated with poultry meat were considered. Microbiological hazards included Campylobacter and Salmonella species, along with pathogenic Escherichia coli, Staphylococcus aureus, Clostridium perfringens and Listeria monocytogenes.
Chemical hazards included those substances introduced into poultry and poultry meat through the use of agricultural chemicals (veterinary drugs and pesticides), exposure to environmental contaminants (heavy metals, mycotoxins, etc) and the use of food additives and processing aids.
The absence of data precluded a detailed analysis of value-added and further processed poultry meat products. A vast array of such products are in the marketplace, including poultry meat smallgoods, chicken kebabs, pre-prepared chicken dishes (e.g. chicken Kiev, chicken Maryland), marinated products, chicken nuggets etc. In addition, the Australian Standard for Construction of Premises and Hygienic Production of Poultry Meat for Human Consumption and the Food Standards Code currently regulates the manufacture of these products.
The organisms that have generated the most interest in relation to the public health and safety of poultry meat, both domestically and internationally are Salmonella spp. and Campylobacter spp. The focus of this assessment is on chicken meat products, as very little information is available on the nature and extent of hazards associated with non-chicken poultry species. It is assumed in this report that the hazards of concern to poultry species other than chicken are largely the same as those for chicken1. However, where appropriate data were available, risk factors specific for non-chicken poultry species are reported and discussed.
1 This assumption is based on discussion with industry representatives and government officials.
1

Chicken meat represents the great majority of poultry eaten in Australia, with 428 million chickens slaughtered annually for meat production, compared with the total annual production of non-chicken poultry of approximately 17 million birds.
Due to a lack of quantitative data available for on-farm practices and primary processing of poultry meat, these stages of production were assessed qualitatively. A quantitative assessment was carried out for Salmonella and Campylobacter in chicken meat from the end of chicken meat processing to consumption. Existing FAO/WHO2 quantitative models were modified to account, where possible, for Australian chicken processing practices and data.
Qualitative assessments were undertaken for pathogenic E. coli, S. aureus, C. perfringens and L. monocytogenes. Only very limited data were available on the prevalence and levels of these hazards through the production and processing supply chain, and few studies have examined the sources of contamination and effects of processing.
Conclusions - Salmonella and Campylobacter
Salmonella and Campylobacter are two of the most commonly reported causes of food-borne illness in Australia. Symptoms generally consist of self-limiting gastroenteritis, sometimes requiring hospitalisation. In a small proportion of cases, infection can lead to more severe, long-term illness such as septicaemia, reactive arthritis or Guillan-Barré syndrome.
Based on epidemiological data, results from raw poultry carcase microbiological surveys and outputs from the probabilistic model, there is reasonable evidence to indicate poultry carcasses and poultry meat are the vehicle for a proportion of salmonellosis and campylobacteriosis cases in Australia, however, due to a lack of quantitative data it is not possible to estimate the extent to which this is the case.
The following is a description of factors during primary production, primary processing and food service/consumer handling and preparation stages that impact on the likelihood of contamination.
On-farm (from nucleus breeding stock to processing)
Contamination of poultry by Salmonella and Campylobacter on-farm is multifactorial and there are no data on the relative importance of one factor compared with another. Because of this, it was not possible to estimate the risk associated with various on-farm practices quantitatively. The report summarises current knowledge on practices that impact on contamination on-farm and highlights the differences between Salmonella and Campylobacter transmission at the primary production level.
There are a number of pathways by which poultry can become contaminated with Salmonella or Campylobacter. Some are more likely for one organism than for the other. Contamination of birds by Salmonella on-farm can usually be traced to one or more of three factors: contaminated feed; environmental sources; and/or vertical transmission from contaminated eggs. For Campylobacter, age of the birds and environmental contamination are the most important risk factors on-farm.
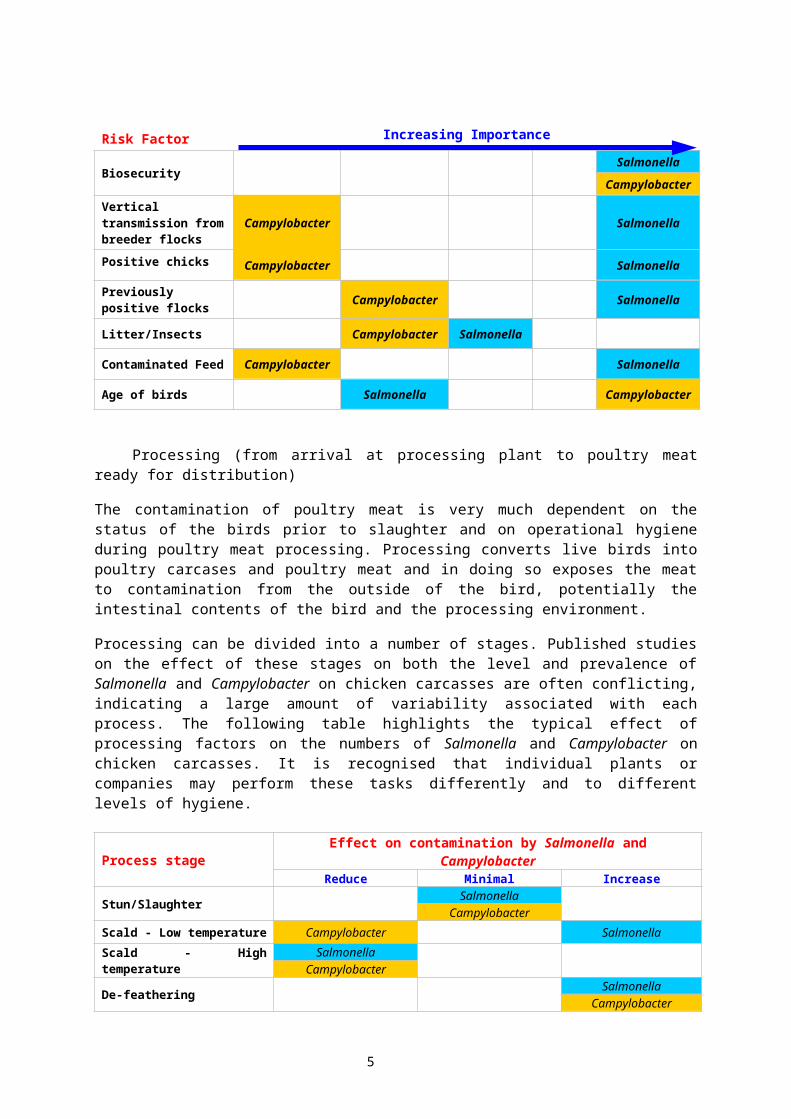
Based on domestic and international data, the major risk factors and their relative importance for Salmonella and Campylobacter contamination on-farm are shown in the following table. Significant variability and uncertainty is associated with the transmission of Salmonella and Campylobacter on-farm and the list should not be considered exhaustive nor the importance of each factor absolute.
2 FAO/WHO have been developing risk assessment frameworks for Campylobacter spp. and Salmonella spp. in broiler chickens. This has included a throrough examination of current scientific and technical information to identify and characterise risks posed by Campylobacter and Salmonella across the broiler production and processing chain.
2

Processing (from arrival at processing plant to poultry meat ready for distribution)
The contamination of poultry meat is very much dependent on the status of the birds prior to slaughter and on operational hygiene during poultry meat processing. Processing converts live birds into poultry carcases and poultry meat and in doing so exposes the meat to contamination from the outside of the bird, potentially the intestinal contents of the bird and the processing environment.
Processing can be divided into a number of stages. Published studies on the effect of these stages on both the level and prevalence of Salmonella and Campylobacter on chicken carcasses are often conflicting, indicating a large amount of variability associated with each process. The following table highlights the typical effect of processing factors on the numbers of Salmonella and Campylobacter on chicken carcasses. It is recognised that individual plants or companies may perform these tasks differently and to different levels of hygiene.
Process stage Effect on contamination by Salmonella and CampylobacterReduce Minimal Increase
Stun/Slaughter SalmonellaCampylobacter
Scald - Low temperature Campylobacter Salmonella
Scald - High temperature SalmonellaCampylobacter
De-feathering SalmonellaCampylobacter
Washing SalmonellaCampylobacter
Evisceration SalmonellaCampylobacter
Washing SalmonellaCampylobacter
Chilling – immersion Campylobacter Salmonella
Chilling – air3 SalmonellaCampylobacter
Portioning Campylobacter Salmonella
3 There is evidence to suggest that the prevalence of Salmonella and Campylobacter on poultry carcases post air-chill is significantly lower than that post immersion-chilling (Sánchez et al., 2002).
3
Risk Factor Increasing Importance
BiosecuritySalmonella
Campylobacter
Vertical transmission from breeder flocks Campylobacter Salmonella
Positive chicks Campylobacter Salmonella
Previously positive flocks Campylobacter Salmonella
Litter/Insects Campylobacter Salmonella
Contaminated Feed Campylobacter Salmonella
Age of birds Salmonella Campylobacter

Generally, there is a tendency for the numbers of contaminated birds to increase during transport from farm to processing plants. The levels of Salmonella and Campylobacter on poultry carcasses fall during processing, although prevalence (i.e. proportion of contaminated birds) tends to increase, especially after evisceration. Chilling, under effective operation, usually results in a decrease in both numbers and prevalence. Although air chilling has been reported to reduce levels of Campylobacter contamination on carcasses, the extent of this is considered low.
Handling, preparation and consumption of poultry meat – a quantitative assessment
Available evidence indicates hygienic handling and proper preparation of poultry meat (either at home or food service) play a significant role in reducing the risk of food-borne illness associated with Salmonella and Campylobacter spp. This part of the risk assessment incorporates a quantitative model and was largely based on work undertaken by the FAO/WHO. Each module in the model deals with one or a set of specific factors that affect the levels and prevalence of Salmonella and Campylobacter. Parameters used in the model were based on published literature and/or data from government and industry surveys. An ExcelTM based program (@Risk, Palisade Corporation) was used to model the handling and preparation of poultry meat as well as the uncertainty and variability associated with the various model inputs. Uncertainty and variability were modelled using probability distributions.
The model considered factors such as: the prevalence and levels of contamination at the end of processing;
the effect of freezing on the levels of Salmonella and Campylobacter; growth of Salmonella during transport and storage (retail as well as home storage) of fresh
chicken meat (no growth was assumed for Campylobacter); possible cross contamination during preparation of foods;
reduction due to cooking; and the probability of illness from the consumption of contaminated poultry meat.
The output of the mathematical model simulating poultry meat transportation, storage and handling, is an estimate for the likely number of salmonellosis and campylobacteriosis cases resulting from consumption of poultry meat in Australia. The relevance of the risk estimate depends on (1) the extent to which the model represents precisely the practices in the various stages of poultry meat processing, handling and preparation, and (2) the availability of suitable and accurate data.
Due to a lack of both suitable and accurate Australian data across the entire model pathway, it is of little value in scientific terms to present final risk estimates in this document. More relevant to this risk assessment, however, is the impact on the estimated number of salmonellosis and campylobacteriosis cases by changing various model inputs.
A sensitivity analysis of the model inputs indicates that the probability of illness due to Salmonella contamination of poultry meat was most sensitive to the level and prevalence of the organism on the carcass at the end of processing, and its growth during distribution and storage. Improper thawing was also a significant factor. Cross-contamination and inadequate cooking were positively correlated with increased likelihood of illness.
For Campylobacter, the probability of illness was influenced by its level and prevalence at the end of processing and cross-contamination during preparation, e.g. not washing hands after handling raw poultry or using contaminated cutting boards to prepare other foods. Cooking adequacy was also influential on the final probability of illness.
4

The level and prevalence of both Salmonella and Campylobacter on carcasses at the end of processing had a large influence on the estimated number of illness. Based on the model, a ten-fold reduction in the level of contamination of Salmonella and Campylobacter at the end of processing resulted in a 74% and 93% reduction in the number of predicted cases of illness respectively. For both organisms there was a linear relationship between the prevalence at the end of processing and the final number of illness. In other words, halving the prevalence could halve the estimated number of illnesses. Halving the level of cross-contamination during preparation resulted in an 18% and 27% reduction in the estimated number of illnesses, respectively. Other scenarios were modelled, and the results are given in the body of the assessment.
Uncertainty and variability in the quantitative risk assessment model
Uncertainty and variability affect the outcome of risk assessment. Uncertainty reflects what isn’t known about a system or process, while variability is a measure of the natural variability inherent in all natural systems. Uncertainty and variability were accounted for in the quantitative risk assessment through the use of probability distributions. However, some of the factors may have been considered minor, and as such, their associated uncertainty and variability may have not been captured by the models. For model parameters where no adequate data was available, assumptions were made until further data becomes available.
Conclusions - Other microbial pathogens
According to available data, there are no significant public health and safety risks resulting from pathogenic E. coli in poultry or poultry meat products in Australia. Although human pathogenic strains such as enterohaemorrhagic E. coli (EHEC) have infrequently been isolated from poultry internationally, there has been no documented case of food-borne illness due to E. coli associated with consumption of poultry meat in Australia.
The public health and safety risk due to S. aureus in poultry or poultry meat products is of minor significance. Although food-borne illness from ingestion of staphylococcal enterotoxin associated with the consumption of poultry meat has been documented, it is almost always due to contamination through post-processing handling. Illness resulting from consumption of cooked poultry meat contaminated by S. aureus presents a risk due to the inactivation of competing microorganisms during cooking. Time and temperature abuse could allow growth of S. aureus that subsequently produce enterotoxin.
Although food-borne illness from consumption of C. perfringens contaminated poultry dishes has been documented, the public health and safety risk due to C. perfringens in poultry is of minor significance. Poultry meat can be contaminated with C. perfringens at the end of processing, however the levels are typically low, and significant temperature abuse and mishandling are required to allow growth of the pathogen to levels sufficient to cause illness. These risk factors occur primarily in the retail, foodservice/catering and home sectors, rather than the production and processing environments.
L. monocytogenes is often present on raw poultry meat but is rarely cited as cause of food-borne illness following poultry meat consumption. There is little evidence that multiplication of L. monocytogenes on raw poultry meat during storage is a major risk factor in human Listeriosis. L. monocytogenes is primarily a concern for ready-to-eat poultry meat products, particularly for susceptible populations. Contamination of ready-to-eat poultry meat may be as a result of inadequate heat treatment (i.e. cooking) or occur post processing, either directly from the processing environment or via cross-contamination at retail (e.g. sliced ready-to-eat meats). In the absence of competition with normal flora usually associated with raw poultry, the organism can multiply, even when stored at <4C.
5
Conclusions – Chemical hazards
Regulations that control the use of chemicals in poultry meat and protect public health and safety are outlined in the general standards applicable to all food in Chapter 1 of the Australia New Zealand Food Standards Code (the Code). There are six Standards in Chapter 1 of the Code that regulate chemical inputs that are relevant to poultry meat products (Standard 1.3.1 – Food Additives; Standard 1.3.3 – Processing Aids; Standard 1.3.4 – Identity and Purity; Standard 1.4.1 – Contaminants and Natural Toxicants; Standard 1.4.2 – Maximum Residue Limits; and Standard 1.4.3 – Articles and Materials in Contact with Food).
Given the data available for this review of chemical hazards in poultry and poultry meat products, the current regulatory measures outlined in the Code adequately protect public health and safety with respect to chemical hazards in poultry meat products in Australia. Data gaps relevant to the review of chemical hazards in poultry and poultry meat products have been identified.
Agricultural and veterinary chemicals
Standard 1.4.2 – Maximum Residue Limits of the Code lists the maximum permissible limits for agricultural and veterinary chemical residues present in food. Contemporary survey results from the National Residue Survey (NRS) and Australian Total Diet Survey (ATDS) indicate that there is a high level of industry compliance with agricultural and veterinary chemical maximum residue limits (MRLs) in poultry meat products. These results indicate that dietary exposure to agricultural and veterinary chemicals through poultry meat products presents a negligible risk to the consumer.
Notwithstanding the results, there are concerns surrounding the adequacy of the agricultural and veterinary chemical testing regime particularly relating to the NRS. In 2002-2003 the NRS tested liver samples from 165 chickens out of a yearly total slaughter in excess of 400 million chickens. Non-chicken poultry species were not tested. Only five chicken carcases were tested for anticoccidials. Of specific concern was the breach of the MRL associated with the anticoccidial lasalocid. This data indicates either there was a sporadic breach associated with the use of the anticoccidial lasalocid or alternatively high-level breaches of MRLs associated with anticoccidials.
Contaminants
As part of the review of chemical hazards in poultry meat products, eleven contaminants with the potential to contaminate poultry meat were reviewed. FSANZ regulates the presence of contaminants in food through Standard 1.4.1 – Contaminants and Natural Toxicants. Two of the eleven contaminants reviewed (lead and polychlorinated biphenyls) have maximum limits (MLs) included in the Standard. Overall, none of the contaminants investigated demonstrated an immediate public health and safety concern in relation to poultry meat products, however further investigation may be needed on the following contaminants;
Arsenic – consistent presence of arsenic residues in poultry tissue and the absence of a permission for the anticoccidial roxarsone (4-hydroxy-3-nitrophenyl arsonic acid) in the Code;
Fluoride – reported high levels of fluoride in mechanically separated poultry at levels sufficient to contribute to an increased risk of dental fluorosis when combined with other sources of fluoride;
Lead – reported high levels of lead in wild-caught birds, specifically the Magpie Goose (Anseranas semipalmata) harvested in the Northern Territory by local Aboriginal peoples. The use of lead shot will be phased out by 2005 in Northern Territory wetlands.
Mercury – reported high levels of mercury in piscivorous waterfowl. There is currently an absence of data on mercury levels in mutton birds (Puffinus tenuriostris) to characterise the risk associated with consumption of this species.
6

The presence of dioxins and dioxin-like polychlorinated biphenyls were reviewed as part of the review of chemical hazards in poultry due to data made available through the National Dioxins Program. The NRS provided data on 15 poultry meat samples and FSANZ on 11 poultry breasts. Though the data showed the dioxin dietary contribution from poultry meat to be low, the degree of testing is not sufficient to detect incidents of sporadic dioxin contamination in poultry in Australia.
Mycotoxins (aflatoxins, trichothecene toxins, zearalenone, ochratoxin A and fumonisin B1) were reviewed for their potential to contaminate poultry meat products via contaminated feeds. Though data on the carry-over of mycotoxins into poultry tissue is relatively scarce, the data consistently demonstrated low-levels of mycotoxin carry-over, insufficient to contribute substantially to total human dietary intake of these constituents.
Food Additives
FSANZ regulates food additives through Standard 1.3.1 – Food Additives. The Standard, through Schedule 1, specifies permitted uses of food additives by food type for meat and meat type products (including poultry). The permissions for meat and meat type products relate mainly to preservative and colouring functions. There is a lack of data pertaining to the monitoring of food additives in poultry meat products.
Processing Aids
FSANZ regulates processing aids through Standard 1.3.3 – Processing Aids. The Standard is currently under review (Proposal P276 Review of Enzyme Processing Aids and Proposal P277 – Review of Processing Aids (other than enzymes)). The review will address the safety of currently permitted processing aids; remove any obsolete processing aids; and correct errors, remove anomalies and improve consistencies within the Code. It is not anticipated that the structure of Standard 1.3.3 – Processing Aids - will be changed.
The review of Standard 1.3.3 might result in changes which could be relevant for the proposed Poultry Meat Primary Production Standard, and this needs to be taken into consideration when the review has been finalised.
Packaging
FSANZ regulates food contact uses of primary packaging materials through Standard 1.4.3 – Articles and Materials in Contact with Food. The Standard regulates food contact materials in general terms. The Standard does not specify individual packaging materials for food contact or how they are produced or used. FSANZ does not directly monitor for the migration of chemicals from packaging materials into food and as such the review is unable to characterise the risk associated with packaging materials in poultry meat products.
Data Gaps and Research Needs
This scientific assessment has brought together a wealth of information on microbiological and chemical hazards associated with consumption of poultry meat in Australia. An important outcome of this process has been the identification of key data gaps, which may provide guidance for future research. There was a general lack of microbiological and chemical data for stages prior to the end of primary processing, which restricted the scope of the assessment. Although data on the prevalence of Salmonella and Campylobacter on poultry meat at the end of processing and/or at retail were available, very few surveys have been undertaken whereby the number of organisms has been quantified.
The following areas are those in which further research and data collection would assist in reducing uncertainty associated with the assessment:
7

Data on the impact of on-farm factors on the prevalence of contaminated flocks and/or birds.
Data on the prevalence and, in particular, levels of Salmonella and Campylobacter on birds/carcasses at all stages of the exposure pathway.
Identification of contamination sources for Salmonella and Campylobacter during primary production.
Data on cross-contamination between birds pre-harvest, and during transport and processing.
Thermal profile of poultry carcasses during thawing to provide a better estimate of potential Salmonella growth under Australian conditions.
Data on the magnitude of cross-contamination and improper cooking of poultry meat in Australia.
ACKNOWLEDGEMENTS
Food Standards Australia New Zealand gratefully acknowledges the support and assistance provided by many organisations and individuals in the preparation of this report.
Special thanks are extended to OzFoodNet for the provision of epidemiological data, to Australian poultry industry personnel who graciously provided technical advice and authorized access to premises, industry information and data, and to State and Territory Health and Primary Industry departments for the provision of poultry meat survey data.
FSANZ is grateful for the work undertaken by Paul Vanderlinde, Food Science Australia in developing the quantitative risk model used in this assessment.
8

ABBREVIATIONSACMSF Advisory Committee on the Microbiological Safety of Food
ADI Acceptable Daily Intake
ANZFA Australia New Zealand Food Authority
APVMA Australian Pesticides and Veterinary Medicines Authority
AQIS Australian Quarantine and Inspection Service
ATDS Australian Total Diet Survey
aw Water activity
bw Body weight
CAC Codex Alimentarius Commission
CFIA Canadian Food Inspection Agency
cfu Colony forming units
Codex Codex Alimentarius Commission
DAFF Department of Agriculture, Fisheries and Forestry
EAEC Enteroaggregative Escherichia coli
EHEC Enterohaemorrhagic Escherichia coli
EIEC Enteroinvasive Escherichia coli
EPEC Enteropathogenic Escherichia coli
ETEC Enterotoxigenic Escherichia coli
FAO Food and Agriculture Organization of the United Nations
FDA Food and Drug Administration
FSANZ Food Standards Australia New Zealand
FSIS Food Safety and Inspection Service
g, ng, g, mg, kg Gram, nanogram, microgram, milligram, kilogram
GAP Good Agricultural Practice
GBS Guillan-Barré Syndrome
GMOs Genetically modified organisms
GMP Good Manufacturing Practice
HACCP Hazard Analysis Critical Control Point
HUS Haemolytic Uraemic Syndrome
ICMSF International Commission on Microbiological Specifications for Foods
9

JECFA Joint FAO/WHO Expert Committee on Food Additives
10

l, ml Litres, millilitres
MPN Most probable number
MRL Maximum residue limit
nm Nanometre
NRS National Residue Survey
ppt, ppm, ppb Parts per thousand, parts per million, parts per billion
PTDI Provisional tolerable daily intake
PTWI Provisional tolerable weekly intake
RNA Ribonucleic acid
STEC Shiga toxin-producing Escherichia coli
VTEC Verocytotoxin-producing Escherichia coli
WHO World Health Organization
11

1 Scope and Purpose
Food Standards Australia New Zealand (FSANZ) has undertaken an assessment of public health and safety risks posed by microbiological and chemical hazards in poultry meat consumed in Australia.
The risk assessment was undertaken following discussions with risk managers who sought the following information:
What is the extent of food safety risk associated with the consumption of poultry meat and poultry meat products in Australia?
What are the factors along the poultry meat supply chain that have the greatest impact on public health and safety?
The approach adopted by the risk assessment team was based on the elements of risk assessment defined by the Codex Alimentarius Commission: hazard identification; hazard characterisation; exposure assessment; and risk characterisation4.
The assessment was, to a large extent, constrained by the limited epidemiological data on food-borne illness attributed to poultry meat and poultry meat products and the scarcity of information on the prevalence and levels of hazards in poultry and poultry meat at specific stages along the supply chain.
Consistent with the needs of the risk managers, the output of this exercise is the identification of risk factors that may impact on the likelihood of poultry and poultry meat becoming contaminated with microbiological and chemical hazards during primary production and primary processing, and where possible, the relative importance of these factors.
The information presented in this report will be used by FSANZ risk managers for the development of appropriate management approaches for the primary production and processing of poultry meat in Australia.
The manufacture of further processed, ready-to-eat, poultry meat products is regulated by Standard 4.2.2 (manufactured meats) and was therefore only briefly covered by this assessment.
2 Introduction
The goal of this risk assessment was to provide a broad overview of risks associated with consumption of poultry meat in Australia. The assessment identified key hazards and assessed where in the primary production and processing supply chain food safety hazards might be introduced, increased, reduced or eliminated. The risk assessment was undertaken within the framework of existing regulations in Australia5.
To the extent possible within the scope and purpose, the principles for the conduct of risk assessments outlined in the “Working Principles for Risk Analysis for Application in the Framework of the Codex Alimentarius” as adopted at the 26th Session of the Codex Alimentarius Commission (2003), were followed in this risk assessment.
4 Codex (2001). Principles and Guidelines for the Conduct of Microbiological Risk Assessment. Food Hygiene Basic Texts, 2nd Edition. Codex Alimentarius.
5 Existing regulations include the Australian Standard for the Hygienic Production and Transportation of Meat and Meat Products for Human Consumption (AS 4694-2002), and requirements of the Australian New Zealand Food Standards Code.
12

Risk assessment is a scientific process undertaken to identify, characterise and quantify the risk to public health and safety posed by a food-borne hazard associated with a food commodity.
Tools that can be used in this process include risk profiling, quantitative and qualitative risk assessment and scientific evaluations. The application of these tools to assess the risk to public health resulting from the consumption of poultry meat is dependent on the purpose of the assessment and on the quality, quantity and availability of relevant data.
At the centre of the risk assessment is an evaluation of available scientific data concerning the safety of the commodity under consideration and the properties of the hazard. This requires utilisation of relevant scientific data and includes procedures to address uncertainty in the conclusions drawn from the data i.e. consideration of the relevance and quality of data and the veracity of its source.
The outcome of the risk assessment process is a statement of the probability and severity of an adverse health effect due to the consumption of a food containing a particular biological, chemical or physical hazard. The risk assessment process may identify where in the food chain, from primary production to consumption, controls over the particular hazard will have the greatest impact in minimising risk, i.e. where risk management intervention will be most effective. Outcomes from the risk assessment will be used by FSANZ to develop risk management strategies in the context of the Primary Production and Processing Standard for poultry meat.
This report contains separate sections, which either quantitatively or qualitatively assess risks associated with Campylobacter and Salmonella, while other microbiological pathogens and chemical hazards are assessed qualitatively.2.1 Poultry Species
The poultry species examined in this assessment includes chicken, duck, turkey, geese and other farmed avian species used for the production of human foods, including quail, squab (pigeons), pheasants, guinea fowls, etc. Ratites such as emu and ostrich are not included, while wild-caught species such as mutton-birds, and magpie geese, are considered in situations where the carcass is dressed and processed in registered processing facilities6.
Poultry meat includes all muscular tissues, including adhering fat and skin, from poultry carcasses, as defined by clause 1 of Standard 2.2.1 of the Australia New Zealand Food Standards Code (the Code). Poultry meat products include edible offal and fats as well as processed and ready-to-eat poultry meat.
2.1.1 Risk assessment approach in relation to poultry species
The extent to which a food safety hazard is likely to be present in poultry meat and give rise to a public health and safety risk depends on a number of factors. These factors are associated with the biology of the particular poultry species, the primary production environment, and the specific activities along the supply chain. To simplify consideration of these factors, and restricted by the availability of data, this report considers microbiological and chemical food safety risks associated with primarily production and processing of chicken meat. Where appropriate data are available, microbiological and chemical risk factors specific for other non-chicken poultry species are addressed.
6 Poultry species and poultry meat products to be examined in this assessment were identified in consultation with the Standard Development Committee (SDC) which assists FSANZ in the development of a national Primary Production and Processing Standard for poultry meat.
13

2.2 Sources of hazards associated with poultry meat in Australia
A range of chemical and microbiological hazards may be introduced into poultry during the primary production phase. These include bacterial pathogens introduced through contaminated feed, water and the environment. Chemical hazards may likewise be introduced through feed and water (either intentionally added during production or adventitiously contaminating the feed), or through environmental exposure of poultry species to hazards such as heavy metals.
In this report chemical hazards, including agricultural and veterinary chemicals, contaminants and food additives have been evaluated along the poultry meat production and processing supply chain. Agricultural chemicals, pesticides and veterinary drugs and food additives are subject to comprehensive pre-market safety assessment and their presence in poultry meat is regulated by relevant standards under Chapter 1 of the Food Standards Code.
In the processing phase, microbiological hazards can be introduced into poultry meat or grow to potentially hazardous levels, through: direct contamination by food handlers and contaminated utensils and equipment; inadequate handling (e.g. temperature abuse, cross-contamination, inadequate processing); and
processing operations and the processing environment.
Physical hazards include intrinsic hazards (e.g. bones) and extrinsic hazards (e.g. grit, metal and glass inclusions). Extrinsic physical hazards may be introduced at any stage of the processing chain through raw materials, badly maintained facilities and equipment, improper production procedures, packaging materials and poor food safety practices. Physical hazards would normally be addressed by adherence to Good Manufacturing Practices (GMP), a hazard analysis critical control point (HACCP) system and requirements relating to safe and suitable food in Chapter 3 of the Australia New Zealand Food Standards Code (the Code). Physical hazards associated with poultry meat are not covered by this report.
2.3 Foodborne illness associated with poultry meat
There have been a number of documented outbreaks of poultry meat-related food-borne illness in Australia in recent years (Table 2.1; with further details in Appendix 1). Salmonella was the most commonly reported aetiological agent for outbreaks in which poultry meat was the suspected food vehicle. Despite the high frequency of reported cases of campylobacteriosis, outbreaks of food-borne illness due to Campylobacter are less frequently identified, due largely to the self-limiting nature of campylobacteriosis and a lack of a robust typing scheme. However, as with all reported cases of food-borne illness, these outbreak data represent only a small component of the total morbidity in Australia. While physicians are required to report some specific illnesses of food-borne aetiology, many food-borne illnesses are not notifiable and therefore not reported in food-borne illness statistics. Moreover, sporadic cases of food-borne illness are not included in the outbreak data sets (unless a death results), hence a low level of reporting of food-borne illness is generally understood to be a major problem. Furthermore, most people do not seek medical attention for various mild forms of gastroenteritis, and even quite severe illnesses are typically significantly under-reported.
In 2003, the OzFoodNet estimated that the number of cases of food-borne illness in Australia in a typical year from all food sources was in the range 4 - 6.9 million cases7 (Hall et al., 2005).
7 Hall, G., Kirk, M.D., Becker, N., Gregory, J.E., Unicomb, L., Millard, G., Stafford, R., Lalor, K and the OzFoodNet Working Group (2005) Estimating foodborne gastroenteritis, Australia. Emerging Infectious Diseases. 11(8): 1257-1264.
14

Table 2.1 Foodborne illness associated with poultry meat consumption in Australia (1995-2002). (Personal communication, OzFoodNet, 2004)
Pathogen Outbreaks CasesSalmonella 18 498
Clostridium perfringens 6 312Norovirus 2 152
Campylobacter 3 27Listeria 2 9
Unknown 15 172Total 44 1170
2.4 Industry Description
The poultry meat industry accounts for approximately 10% of the gross value of Australia’s total livestock production8 and encompasses a variety of species, such as chickens, turkeys, ducks, quail, squab (pigeons), geese, pheasants, guinea fowl.
The chicken meat sector is the largest sector of the poultry meat industry. In 2002-2003, this sector processed approximately 416 million birds9, while the remainder of the poultry industry processed 17 million birds. The annual consumption rate of chicken meat is currently 36 kg per person 10. The total production of chicken meat (by volume) is estimated at 735,800 tonnes per annum.
Approximately 70% by weight of a live meat chicken (broiler) can be recovered as poultry products for human consumption. Of these products, 80% are sold raw (as fresh or frozen whole bird and chicken pieces), with the remainder as ready-to-cook or fully cooked value-added products. One modern processing plant identifies 140 distinct chicken meat products available on the current market. The fastest growth in demand is for ‘raw value added ‘and’ cooked further processed products, such as fillet, breast and drumstick portions, marylands, pate, patties, nuggets, schnitzels, Kiev, etc.
The structure and activities of the poultry meat supply chain may be divided into four main stages: primary production, processing, retail and consumer (Table 2.2).
Table 2.2 Main stages of the poultry meat supply chain.Supply Chain Stage Activity
Primary Production On-farm production of birds and transport to the slaughter facility
Processing Slaughtering, processing and value adding
Retail Wholesale activities, restaurants, supermarkets, take-away food outlets, butcher shops, etc
Consumer Handling practices at use in the consumer’s home environment
8 Australian Bureau of Statistics (ABS). 7503.0 Value of Agricultural Commodities Produced, Australia 2001-2002. (Livestock includes cattle, calves, sheep, lambs, pigs and poultry).
9 This figure has risen to 435 million birds in 2003-2004.10 Australian Bureau of Agricultural and Resource Economics, Australian Commodity Statistics 2003.
15

2.5 Poultry meat sectors other than chicken
The poultry meat industry also comprises other bird species, including turkeys, ducks, quails, squab (pigeons), geese, pheasants and guinea fowl. The turkey and duck sectors are the largest by value and volume (weight). By value, the turkey and duck sectors contribute 70% and 21% respectively of the non-chicken poultry industry11. Per capita consumption of turkey and duck in Australia is estimated at 1.6 kg and 0.5 kg per annum, respectively12.
For many non-chicken poultry the market often demands whole birds, sometimes with the head and feet attached or with the digestive tract intact. These species of birds are consequently more expensive to produce than chicken, hence the non-chicken poultry retail sector is often limited to gourmet restaurants and gourmet butcher shops. Table 2.3 lists approximate numbers of non-chicken poultry produced per year.
Table 2.3 Non-chicken poultry produced per year13
Species Production (Number of birds slaughtered)
Species Production (Number of birds slaughtered)
Quail 6,500,000 Guinea fowl 40,000
Duck 5,720,000 Partridge 18,000Turkey 4,700,000 Silky 52,000
Squab 936,000 Geese 5,000Pheasant 60,000
2.6 Import and export of poultry meat products
Poultry meat consumed in Australia is primary derived from domestic production. During 2001-02, less than 1% of total production was exported e.g. 737 tonnes14. Uncooked poultry meat is not permitted to be imported to Australia.
2.7 Consumption of poultry meat
Production in the chicken meat sector has grown rapidly over the past thirty years, around 5% per annum,15 and is expected to continue to grow at this pace.16 This growth can be attributed to increased consumer demand, which has been facilitated by increased production efficiency due to genetic improvements in breeding stock, improved nutrition and bird/flock health, improved animal husbandry practices and flock management, and improved automation in processing.
11 Leech, A., Shannon, P., Kent, P., Runge, G., Warfield, B. (2003) Opportunities for Exporting Game Birds. Rural Industries Research and Development Corporation (RIDRC). Report Number 03/106.
12 QDPI National Capability Survey 2002, Industry committee, RIRDC Game Bird Project.13 Bodger, J. and Goulding, B. (2003) Distribution of meat products from prospective Australian animal industries:
crocodiles, emus, game girds, rabbits, hares and snails. Rural Industries Research and Development Corporation (RIDRC). Report Number 03/023.
14 ABS Import Data 2001-200215 ABS. 8301.0 Manufacturing Production, Australia 2003.16 McDonald, D., Ashton, D., Gleeson, T., Shaw, I. and Davidson, A. (2003) Meat outlook to 2007-08. Australian
Commodities 10(1);59-67
16
These advances have also enabled the price of chicken meat to remain relatively low compared to red meats, which has contributed to chicken being one of the most commonly consumed meats in Australia. The annual consumption rate of chicken meat is estimated to be 36 kg per person (Figure 2.1)17.
Figure 2.1 Annual per capita consumption of poultry meat in Australia.
Source: ABARE (2003) Australian Commodity Statistics 2003. Australian Bureau of Agricultural and Resource Economics, Barton ACT.
Demand for fresh whole birds continues to be relatively static18. Most of the residual material not recovered for human food products is further processed for use in the livestock and pet food industries.
2.8 Primary production of poultry meat
The production of poultry meat species is shown diagrammatically as follows:
17 ABARE (2003) Australian Commodity Statistics 2003. Australian Bureau of Agricultural and Resource Economics, Barton ACT.
18 Information supplied by the Australian Chicken Meat Federation.
17
10
15
20
25
30
35
40
1994 1995 1996 1997 1998 1999 2000 2001 2002
Year
Cons
umpt
ion
per
pers
on (k
g)

Figure 2.2 Primary production of poultry meat
For large poultry producers in Australia, primary production is a vertically integrated process.
This generic flow chart may not represent normal practice for all species of poultry. Many non-chicken poultry production systems do not import fertile eggs, although there is provision for the importation of fertile turkey and duck eggs into Australia.
For chickens, the nucleus breeding stock in Australia is derived from fertile eggs imported from the United Kingdom and/or the United States of America. These eggs are held at Australian Quarantine and Inspection Service (AQIS) approved quarantine stations under strict biosecurity control, where they are hatched and remain for at least 9 weeks. Testing for Salmonella is currently conducted in the first 10 days post-hatch19. Samples are collected from shell fragments, litter, unhatched eggs and dead and cull birds. All samples are analysed for the presence of Salmonella and all isolates are serotyped.
Following release from AQIS quarantine, birds are placed on breeder farms, which are generally company-controlled facilities, and become the great grandparent breeder flock. Eggs are collected from these great grandparent birds, hatched, and supplied to breeder farms, either to become breeder stock or grandparent birds. Eggs collected from the breeder farms are sanitised before transporting to a hatchery. Chicks are then screened for visible signs of disease before being supplied to growing farms at approximately 1-day of age. Transportation of chicks can result in contamination by Salmonella from crates and the environment.
Breeder flocks are held under strict bio-security control but can still become infected with pathogenic microorganisms through horizontal contamination from the environment. As there is generally less movement of birds and personnel in breeder farms, the likelihood of contamination from the environment is less than for growing farms. Vertical transmission of Salmonella from eggs may occur (either via trans-ovarian contamination, or migration of Salmonella cells from the egg surface to the internal contents).
Chickens are placed on broiler (or grow-out) farms where they remain until harvest, which varies depending on the market. Young birds are primarily used as spatchcocks, whereas large birds are more suited to filleting and further processing as described in Table 2.4. Birds are transported to the processing plant in plastic crates, which are often difficult to clean and may be a source of microbiological contamination.
19 AQIS conditions for importation of fertile hen eggs into Australia (2005). http://www.aqis.gov.au/icon32/asp/ex_querycontent.asp
18

Table 2.4 Status of chickens at various ages.Age of chicken (days) Description
Hatching – 18 Brooding - placed in sheds on the farm with heating
18-22 Spatchcocks can be taken for processing
32-42 Smaller birds taken for processing
42-49 Average 'supermarket' whole bird taken for processing
49-60 Large birds for filleting and further processing
The primary production of non-chicken poultry species varies somewhat between species. The industry is generally less vertically integrated than the chicken industry, with most of the process, including breeding, hatching and growing occurring at one location. Differences include the type of housing/husbandry, composition of feed and age at which birds are slaughtered20.
2.8.1 Feed
Poultry are primarily fed a mixture of cereal grain (e.g. wheat, oats, barley and sorghum), protein meal (e.g. soybean meal or meat meal), vitamins and minerals.
Where animal products are used in feed they must be subjected to heat treatment as described in the Australian Standard for Hygienic Rendering of Animal Products (AS 5008:2001)21. This is to ensure consistent application of heat treatments in the rendering process to minimise the risk of survival of microorganisms hazardous to animal health.
Bacterial contamination of feed ingredients, in particular Salmonella spp. may result in the finished feed being contaminated even when heat-treated during the pelleting process, due to either insufficient heat treatment or post-processing contamination.
For those poultry species that are fed mainly on a diet of whole grains (e.g. squab) exposure to pesticide residues and mycotoxins may be higher, however data on this is very limited.
Hormones have been banned from poultry feed in Australia for over 35 years. Results from the National Residue Survey demonstrate the continual absence of hormone residues in Australian poultry meat products.
Concerns regarding the use of antimicrobial agents in the poultry meat industry revolve around the emergence of antimicrobial resistant bacteria and the potential for residues of the antimicrobial agent(s) to be present in food products. Various government health and agricultural agencies, expert advisory groups, industry guidelines and codes of practice and veterinary codes of practice address public health issues around the use of antimicrobial agents.
Some raw materials that are incorporated into livestock feed may have been derived from genetic modified organisms (GMOs). Currently the regulatory arrangements in Australia that apply to genetically modified organisms do not extend to the feed of food-producing animals. The regulation of GMO feed use involves a variety of government agencies and industry guidelines and will not be considered in the development of the PPP Standard for Poultry Meat. Further information on the management of GMO feed in Australia can be obtained from the Office of the Gene Technology Regulator22.
20 Summary of production processes for non-chicken poultry species is included in RIRDC Report No. 03/023.21 Standards Australian website http://www.standards.com.au/catalogue/script/search.asp22 Information on the Office of the Gene Technology Regulator can be obtained from http://www.ogtr.gov.au
19

2.8.2 Alternative poultry production systems
While the vast majority of Australian chicken meat production involves intensive production, free-range and organic poultry production systems are in place and represent 1-2% of the poultry meat market.
Free-range animals are known to be subject to higher risk of disease, such as coccidiosis 23. Other hazards specific to the production of free-range poultry include, exposure to wild birds and other animals, access to unchlorinated water and miscellaneous environmental contaminants.
2.9 Poultry processing
Poultry meat processing facilities vary depending on the type of poultry species being processed, and the scale of operation. Large modern chicken processing facilities are highly automated and can process 4000-9000 birds per hour. In comparison, processing of poultry in small-scale facilities may be largely manual or semi-automated, with less than 1000 birds processed per day.
Slaughtering and processing operations have the potential to contaminate the poultry carcass with faecal material and to facilitate cross-contamination between pathogen-positive birds and pathogen-negative birds. This may occur at various stages of processing including unloading of birds, scalding, plucking, evisceration, washing and chilling.
Although differences exist in the slaughtering and processing of various poultry species, the major processing steps are very similar. These steps are shown diagrammatically in Figure 2.3 and further described in Table 2.5.
Figure 2.3 Main primary processing stages.
23 Dawson, R.C., Cox, J.M., Almond, A. and Moses, A. (2001) Food Safety Risk Management in Different Egg Systems. RIRDC Report No. 01/111.
20
Receival of live birds at slaughter facility
Prim
ary
proc
essi
ng
Whole bird:Storage and distribution of fresh/frozen poultry
Stunning
Slaughtering
Scalding
De-feathering
Evisceration
Chilling
Wash
Wash
Portioning:Boning facility
Value adding:Further processing
Receival of live birds at slaughter facility
Prim
ary
proc
essi
ng
Whole bird:Storage and distribution of fresh/frozen poultry
Stunning
Slaughtering
Scalding
De-feathering
Evisceration
Chilling
Wash
Wash
Portioning:Boning facility
Value adding:Further processing

Table 2.5: Summary of the main steps in primary processing of chickens.Step DESCRIPTION1. Stunning Chickens removed from crates/cages and placed in shackles. Birds are electrically stunned in a
water bath, although other methods are available such as gassing or probe stunned.
2. Slaughtering Birds are slaughtered by cutting the neck and bleeding out (typically two minutes).
3. Scalding Carcasses are immersed in a scald tank (Range: 50C - 65C) to loosen the feathers to facilitate plucking. Temperature of the scald tank is critical and varies depending on poultry species and production methods (i.e. needs to be high enough to loosen feathers but not too high as to damage the carcass).
4. De-feathering Feathers are removed from the carcass – using equipment comprising a bank of counter rotating steel discs (automated production line) or rotating steel drums (manual production) with mounted rubber fingers. Water is constantly sprayed to flush away removed feathers. Remaining feathers are removed by hand.
5. Evisceration Evisceration involves cutting around the vent and insertion of a spoon-shaped device to remove the viscera. Can be done either mechanically or by hand, but care must be taken to ensure the viscera is not damaged or ruptured as this can lead to significant contamination of the carcass.
6. Washing step Eviscerated carcass is washed internally and externally.
7. Chill Removal of carcass heat using air-chilling, water immersion or spray chilling. Water immersion chilling is the most common method, with the carcass placed in counter-current flow of chlorinated (50-70 ppm total available chlorine, 0.4–4.0 ppm free available chlorine) cold water (~0C).
Variations of primary processing exist depending upon the poultry species and the scale of operation. For example, wax is employed to remove pinfeathers from ducks after initial defeathering. Some poultry species are sold whole with head and feet attached e.g. squab, or with the digestive tract intact e.g. pheasant. Although differences exist in the processing of specific poultry species, the food safety management strategies utilised by processors are similar.
Increasingly, carcasses after primary processing undergo further processing, which includes portioning, de-boning and value-adding. This may occur on-site at the primary processing facility (especially in larger operations), or be sent to separate privately owned boning facilities . The boning facility portions, debones and strips meat off poultry carcasses and sells the meat to other processors (e.g. butchers, smallgoods producers, catering services etc) or may carry out further value adding.
2.10 Retail, food service and consumer-end section of the poultry meat supply chain
Hazards such as Salmonella, Campylobacter, Clostridium perfringens and Listeria may also be introduced at the retail, food service and consumer-end, either through cross-contamination of cooked meat (or other ready to eat foods) with raw meat (FAO/WHO, 2002). Contamination of poultry meat and poultry meat products with other bacterial pathogens, such as Staphylococcus aureus, could be a result of improper handling of poultry meat at the retail and/or consumer level.
Storage time and temperature at retail, food service and/or consumer household, including transportation, will impact on the numbers of pathogenic microorganisms present on poultry meat. This may include potential growth (at temperatures >7C) or inactivation (during freezing) of microorganisms. Ultimately, inadequate cooking at the retail outlet or consumer household will permit survival of these microbiological hazards.
21

3 Risk Assessment - Salmonella spp.
3.1 Hazard Identification
Salmonellosis is a leading cause of enteric illness, with symptoms ranging from mild gastroenteritis to systemic illness such as septicaemia and other longer-term conditions. A wide range of foods has been implicated in food-borne salmonellosis. However, as the disease is primarily zoonotic, foods of animal origin have been consistently implicated as the main sources of human salmonellosis (FAO/WHO, 2002).
The genus Salmonella is currently divided into two species: S. enterica (comprising six subspecies) and S. bongori (Brenner et al., 2000; Table 3.1). The subspecies of most concern in relation to food safety is S. enterica subsp. enterica, as over 99% of human pathogens belong to this subspecies (Bell and Kyriakides, 2002).
Over 1,400 Salmonella enterica subsp. enterica serotypes are currently recognised, and all are regarded as capable of causing illness in humans (Brenner et al., 2000). The formal names to describe Salmonella serotypes are rather cumbersome, for example S. enterica subsp. enterica serotype Typhimurium (formerly Salmonella typhimurium). For practical reasons, the shortened versions of these names are commonly used, such as Salmonella Typhimurium.
Table 3.1: Species of the genus Salmonella (Brenner et al., 2000).Salmonella species/subspecies No. of serotypes Usual habitat
S. enterica subsp. enterica 1,454 Warm-blooded animals
S. enterica subsp. salamae 489 Cold-blooded animals and environment a
S. enterica subsp. arizonae 94 Cold-blooded animals and environment
S. enterica subsp. diarizonae 324 Cold-blooded animals and environment
S. enterica subsp. houtenae 70 Cold-blooded animals and environment
S. enterica subsp. indica 12 Cold-blooded animals and environment
S. bongori 20 Cold-blooded animals and environment
Total 2,463a Isolates of all species and subspecies have occurred in humans.
Some Salmonella serotypes are host-adapted to individual animal species. For example S. Typhi and S. Paratyphi are specifically associated with infections leading to severe illness in humans (Bell and Kyriakides, 2002). Conversely, S. Gallinarum and S. Pullorum are host-adapted to poultry and associated with acute gastroenteritis and high mortality of birds but rarely associated with human illness (Lake et al., 2002).
3.1.1 Growth and survival
Salmonellae have relatively simple nutritional requirements and can survive for long periods of time in foods and other substrates (Jay et al., 2003). The rate of growth and extent of survival of the organism in a particular environment is influenced by the simultaneous effect of a number of factors such as temperature, pH, and water activity (aw). Being facultative anaerobic, salmonellae also have the ability to grow in the absence of oxygen. Growth and survival is also influenced by the presence of inhibitors such as nitrite and short-chain fatty acids (Jay et al., 2003).
22

Temperature
The growth of most salmonellae is substantially reduced at <15C and prevented at <7C (ICMSF, 1996). Growth generally does not occur at >46.2C. The optimum temperature for growth is 35 – 43C. Heat resistance of Salmonella in foods is dependant on the composition, nature of solutes and pH, and water activity of the food (Jay et al., 2003). In general, heat resistance increases as the water activity of the food, decreases. A reduction in pH results a reduction of heat resistance (ICMSF, 1996).
Freezing can be detrimental to Salmonella survival, although it does not guarantee destruction of the organism (ICMSF, 1996). There is an initial rapid decrease in the number of viable organisms at temperatures close to the freezing point as a result of the freezing damage. However, at lower temperatures (-17 to -20C) there is a significantly less rapid decline in the number of viable organisms. Salmonella have the ability to survive long periods of time at storage temperatures of < -20C (Jay et al., 2003).
pH
The minimum pH at which Salmonella can grow is dependent on the temperature of incubation, the presence of salt and nitrite and the type of acid present. However, growth can usually occur between pH 3.8 – 9.5 (Jay et al., 2003). The optimum pH range for growth is 7.0 – 7.5 (Table 2.2). Volatile fatty acids are more bactericidal than acids such as lactic and citric acid.
Water activity (aw)
Water activity has a significant effect on the growth of Salmonella, with the lower limit for growth being 0.94 (ICMSF, 1996). Salmonella can survive for long periods of time in foods having a low aw
(such as black pepper, chocolate, gelatine). Exposure to low aw environments can greatly increase the heat resistance of Salmonella.
Table 3.2: Limits for growth of Salmonella when other conditions (e.g. temperature, pH, aw) are near optimum (ICMSF, 1996).
Condition Minimum Optimum Maximum
Temperature (C) 5.2* 35-43 46.2
pH 3.8 7.0-7.5 9.5
aw 0.94 0.99 >0.99* Most serotypes fail to grow at <7C
3.1.2 Salmonellosis incidence and outbreak data
Salmonellosis is one of the most commonly reported enteric illnesses worldwide (FAO/WHO, 2002). Approximately 7,000-8,000 cases of salmonellosis per annum are formally notified to health authorities in Australia (Hall, 2003). Taking into account under-reporting it has been estimated (based on published rates of under-reporting) that 80,000 cases of food-borne salmonellosis occur annually (Hall, 2003).
The salmonellosis notification rate in Australia for 2002 was 40.3 cases per 100,000 population (Figure 3.1). This varies from 24.8 cases per 100,000 population in Victoria to 166.7 cases per 100,000 population in the Northern Territory (Anon, 2003). Children less than five years of age have by far the highest notification rate, with a rate of 210.6 cases per 100,000 population reported for 2002 (Yohannes et al., 2004). The higher rate of notified salmonellosis cases in this age group may reflect an increased susceptibility upon first exposure, but may also be a result of other factors such as an increased likelihood of exposure and increased likelihood to seek medical care and be tested.
23

Figure 3.1 Salmonellosis notification rates in Australia by year (1991-2003; National Notifiable
Diseases Surveillance System).
Of the total number of Salmonella serovars reported to Australian health authorities during 2002, S. Typhimurium 135 was the most commonly reported (Table 3.3). Distribution of Salmonella serovars varies geographically, with the most commonly reported serovars in Queensland, Tasmania and the Northern Territory being S. Virchow (10%), S. Mississippi (48%) and S. Ball (15%) respectively. Of the other States and Territories, S. Typhimurium was the most commonly reported serovar, representing 34% of cases in the Australian Capital Territory, 28% in New South Wales, 60% in South Australia, 66% in Victoria and 15% in Western Australia. Salmonellosis notifications in Australia fluctuate seasonally, from a low in August-September to a peak in January-March, with 36% of salmonellosis cases notified during this period (Yohannes et al., 2004).
Table 3.3 Principal isolates in Australia, 2002 (Yohannes et al., 2004)State or Territory
ACT NSW NT Qld SA Tas Vic WA Aust Total
Organism %
S. Typhimurium 135 11 238 8 117 14 18 178 91 675 8.8
S. Typhimurium 9 16 268 0 77 24 12 151 44 592 7.7
S. Typhimurium 170 5 161 0 135 1 1 152 3 458 5.9
S. Saintpaul 0 37 20 225 11 2 44 44 383 5
S. Virchow 8 0 21 0 268 0 0 11 2 302 3.9
S. Birkenhead 0 95 3 134 4 0 8 1 245 3.2
S. Typhimurium 126 1 62 2 28 39 4 61 8 205 2.7
S. Chester 1 29 16 82 11 2 5 32 178 2.3
S. Hvittingfoss 1 17 6 110 3 1 13 2 153 2
S. Muenchen 0 20 12 55 9 3 9 24 132 1.7
Other 60 1136 248 1354 405 117 588 470 4378 56.8Total 95 2084 315 2585 521 160 1220 721 7701 100
It has been estimated that in the United States (Mead et al., 1999) and England and Wales (Adak et al., 2002), 95% and 91.6% respectively of salmonellosis cases are food-borne. Other sources of infection may be via contaminated water, person-to-person transmission and direct contact with infected animals.
24
0
5
10
15
20
25
30
35
40
45
1991 1992 1993 1994 1995 1996 1997 1998 1999 2000 2001 2002 2003
Year
Notif
icat
ion
Rat
e pe
r 10
0,00
0 Po
pula
tion

Based on results from national and international epidemiological data (primarily outbreak investigations) a wide range of foods have been implicated in human salmonellosis (Table 3.4). It is clear from Tables 3.4 and 3.5 that foods of animal origin (e.g. meat, eggs, dairy) are important sources of human salmonellosis.
Table 3.4 Major food-borne outbreaks of human salmonellosis (from D'Aoust, 1994)
Year Country(ies) Vehicle SerovarNumber
Casesa Deaths
1973 Canada, US Chocolate S. Eastbourne 217 0
1973 Trinidad Milk powder S. Derby 3,000b NS
1974 United States Potato salad S. Newport 3,400 b 0
1976 Spain Egg salad S. Typhimurium 702 6
1976 Australia Raw milk S. Typhimurium PT9 >500 NS
1977 Sweden Mustard dressing S. Enteritidis PT4 2,865 0
1981 Netherlands Salad base S. Indiana 600 b 0
1981 Scotland Raw milk S. Typhimurium PT204 654 2
1984 Canada Cheddar cheese S. Typhimurium PT10 2,700 0
1984 France, England Liver pâté S. Goldcoast 756 0
1984 International Aspic glaze S. Enteritidis PT4 766 2
1985 United States Pasteurised milk S. Typhimurium 16,284 7
1987 China Egg drink S. Typhimurium 1,113 NS
1987 Norway Chocolate S. Typhimurium 361 0
1988 Japan Cuttlefish S. Champaign 330 0
1988 Japan Cooked eggs Salmonella spp. 10,476 NS
1991 US, Canada Cantaloupe S. Poona >400 NS
1991 Germany Fruit soup S. Enteritidis 600 NS
1993 France Mayonnaise S. Enteritidis 751 0
1993 Germany Paprika chips S. Saintpaul, S. Javiana, S. Rubislaw
>670 0
1994 United States Ice cream S. Enteritidis >645 0
1994 Finland, Sweden Alfalfa sprouts S. Bovismorbificans 492 0a Confirmed cases unless stated otherwise.b Estimated number of cases.c Jay et al., 2003.NS = not specified.
Following notifications of salmonellosis to Australian health authorities, over 50 epidemiological investigations are initiated each year in an attempt to identify a common source of infection (Anon, 2003). It is often difficult, however, to confirm a single food commodity as a source due to the difficulty of investigating commonly consumed foods, conducting traceback, and lack of systematically collected microbiological data from foods.
In a review of reported food-borne disease outbreaks in Australia during 1995 – 2000, meats, in particular poultry meat, were associated with 33% of identified salmonellosis outbreaks (Dalton et al., 2004; Table 3.5). A large outbreak (consisting of 502 cases) of S. Typhimurium 135a occurred in 1999 and was associated with consumption of unpasteurised commercial orange juice (Roche et al., 2001).
25

In 2001 a community-wide outbreak of S. Typhimurium 126 occurred in South Australia (Ashbolt et al., 2002). A subsequent case-control study associated illness with the consumption of chicken meat. This link was corroborated with microbiological testing of raw poultry, and the likely source of contaminated products was traced to a single poultry processing facility.
Table 3.5 Salmonellosis outbreaks in Australia, 1995-2000 (from Dalton et al., 2004).
VehicleOutbreaks Cases
n % n %
Meats 25 33 658 17Chicken 10 335Beef 4 67Pork 2 37Processed meats – consumed cold 4 61Other meats* 5 158
Eggs 8 11 701 17Sandwiches 7 9 1,205 29Desserts 6 8 254 6Fruit 2 3 60 1Seafood 2 3 14 <1Dairy 1 1 26 <1Fish 1 1 26 <1Fruit juice 1 1 502 12Salads 1 1 21 <1Vegetables 1 1 54 1Miscellaneous 18 24 573 14Unknown 2 3 43 1Total 75 100 4,123 100
* Includes meats in above categories that may be mixed together and meats not in above categories, or where type of meat was not known.
Up to 1998, Europe and the US saw a dramatic increase in the number of human S. Enteritidis infections, in particular those of phage type 4. By 1998, S. Enteritidis accounted for 84% of reported cases of human salmonellosis in Europe and was the most commonly isolated Salmonella serovar in the US (FAO/WHO, 2002; Olsen et al., 2001). As a result of interventions to control S. Enteritidis in laying hens and in chicken meat production, the UK has recorded a 50% reduction in cases (Cogan and Humphrey, 2003). Data from the Danish national gastroenteritis monitor indicates that the number of S. Enteritidis cases has reduced from approximately 3700 at the peak of 1997-98 to approximately 600 in 2004 (Gastro Enteritis Monitor, Denmark, 2005).
S. Enteritidis has been found to be closely related to the poultry-adapted serovar S. Gallinarum and may therefore possess some of the factors that made the latter a successful poultry pathogen (Cogan and Humphrey, 2003; Olsen et al., 2001). Of significant food safety concern is the ability of both organisms to colonise the reproductive tissue of infected birds. This factor enables the direct internal contamination of eggs with Salmonella. Epidemiological investigations identified that raw or undercooked egg and egg products were the foods most commonly associated with increased illness in humans due to S. Enteritidis (Guard-Petter, 2001). Consumption of chicken meat has recently been implicated as a source of sporadic S. Enteritidis infection in the US (Kimura et al., 2004). Fortunately S. Enteritidis (in particular phage type 4; PT 4) is not endemic in Australia, with most human cases reported from travellers returning from overseas (Anon, 2003). Overall, in 2003, 23% (52/227) of patients with S. Enteritidis infection acquired their infection in Australia (OzFoodNet, 2004). Queensland had the greatest number of locally acquired infections, with phage type 26 being the most common.
26

3.1.3 Occurrence of Salmonella in food
The primary reservoir of Salmonella is the intestinal tract of warm and cold-blooded vertebrates. Infected animals shed large numbers in their faeces, and this leads to contamination of the surrounding environment including soil, pasture, streams and lakes. Salmonella has been isolated from a wide range of foods, particularly those of animal origin and those foods that have been subject to faecal contamination (ICMSF, 1996).
Raw meat products (in particular poultry) have frequently been associated with the presence of Salmonella (Bryan and Doyle, 1995). Salmonella positive animals at the time of slaughter have high numbers of organisms in their intestines as well as on external surfaces (faecal contamination of hides, fleece, skin or feathers). Cross contamination during processing may also lead to increased prevalence of Salmonella in finished products (Bryan and Doyle, 1995). Further information on the presence of Salmonella in poultry and poultry meat products is provided in the exposure assessment (Section 2.3).
Table 3.6 provides a sample of reported isolation rates of Salmonella from animal and plant derived foods. It is difficult to directly compare results between different commodities due to variations in sample size, stage of production sampled and methodology used. In addition to raw meat, salmonellae have often been isolated from unpasteurised milk and eggs (and their products). Farmed seafood, or seafood caught from in-shore waters may be contaminated with Salmonella from polluted water.
Table 3.6 Examples of reported Salmonella prevalence in animal and plant derived foods.Food Country Samples % positive Reference
Beef carcass Australia 1,275 0.5 Phillips et al., 2001aBeef Canada 666 1.7 Lammerding et al., 1988Boneless beef (frozen) Australia 990 0.1 Phillips et al., 2001aSheep carcass Australia 917 0.1 Phillips et al., 2001bBoneless sheep meat (frozen) Australia 467 1.3 Phillips et al., 2001bPork (cuts) Denmark 16,399 1.9 Hald et al., 2004Beef (cuts) Denmark 1,971 1.0 Hald et al., 2004Veal carcass Canada 267 4.4 Lammerding et al., 1988Pig carcass Canada 596 11.2 Lammerding et al., 1988Catfish USA 464 5.2 D'Aoust, 1994Raw milk (bulk tanks) England, Wales 1673 0.36 O'Donnell, 1995Broiler carcass USA 1297 20.0 FSIS, 1996Broiler carcass Canada 774 20.1 CFIA, 2000Turkey carcass USA 1221 18.6 FSIS, 1998Turkey carcass Canada 506 19.6 CFIA, 2000RTE salad vegetables UK 3,852 0.1 Sagoo et al., 2003Shell eggs UK 4753 0.3 FSA, 2004RTE foods containing sesame seed
US 117 9.4 Brockmann et al., 2004
RTE = ready to eat
In recent years, plant derived foods have been increasingly implicated as sources of Salmonella (Bell and Kyriakides, 2002). In a survey of imported fresh produce undertaken by the US Food and Drug Administration during 1999, Salmonella was isolated from 3.5% (35/1003) of all samples tested (FDA, 2001). It was suggested that the incidence of Salmonella on produce may have been associated with contamination from human contact (unhygienic food handling) or from environmental sources such as contaminated irrigation water or soil.
27

3.1.4 Salmonella Sofia
Based on industry data and retail survey studies, S. Sofia is the most commonly isolated Salmonella serovar from chickens in Australia (Table 3.8 and Appendix 2). In common with other Salmonella enterica subsp. salamae serovars (previously described as subspecies II), S. Sofia may be regarded as having relatively low virulence to humans (Harrington et al., 1991; Ross et al., 2003). This is confirmed by epidemiological data, where S. Sofia is infrequently isolated from humans (National Enteric Pathogens Surveillance Scheme, 2002).
Heuzenroeder et al. (2002) undertook a series of challenge studies to determine if S. Sofia could act to competitively exclude more pathogenic Salmonella serovars. The results of the research concluded that S. Sofia does not exclude the virulent serovar S. Typhimurium as both serovars could co-colonise regardless of initial colonisation status.
3.2 Hazard Characterisation
3.2.1 Pathogenicity
Once ingested, Salmonella must be able to overcome the low pH of the stomach, adhere to the small intestine epithelial cells and overcome host defence mechanisms to enable infection (Jay et al., 2003). Salmonella possesses a number of structural and physiological virulence factors enabling it to cause acute and chronic disease in humans.
Virulence of Salmonella varies with the length and structure of the O side chains of lipopolysaccharide (LPS) molecules at the surface of the cell. Resistance of Salmonella to the lytic action of complement is directly related to the length of the O side chain (Jay et al., 2003). The presence of virulence plasmids has been associated with the ability to spread rapidly after colonisation and overwhelm the host immune response (D'Aoust, 1997). These virulence plasmids are large cytoplasmic DNA structures that replicate independently of the chromosomal DNA. Virulence plasmids are present in a limited number of Salmonella serovars and have been confirmed in S. Typhimurium, S. Dublin, S. Gallinarum, S. Pullorum, S. Enteritidis, S. Choleraesuis and S. Abortusovis. It is notable, however, that virulence plasmids are absent from S. Typhi, which is host-adapted and highly infectious.
Once attached to small intestine epithelial cells, the organism is drawn into the host cell in a vesicle (endosome) where it can multiply in the mildly acidic environment. Heat labile enterotoxin may be released during Salmonella growth, resulting in the loss of intestinal fluids. This enterotoxin is closely related functionally, immunologically and genetically to cholera toxin and the heat labile toxin (LT) of pathogenic E. coli (Jay et al., 2003). Most Salmonella strains also produce heat labile cytotoxin which may cause damage of the intestinal mucosal surface and general enteric symptoms and inflammation. For non-typhoidal Salmonella, infection is generally limited to a localised intestinal event.
3.2.2 Public health outcomes
Outcomes of exposure to Salmonella can range from having no effect, to colonisation of the gastrointestinal tract without symptoms of illness (asymptomatic), or colonisation with the typical symptoms of acute gastroenteritis (FAO/WHO, 2002). Gastroenteritis symptoms may include abdominal pain, nausea, diarrhoea, mild fever, vomiting, headache and/or prostration, with clinical symptoms lasting 2–5 days. Most symptoms of salmonellosis are mild, and only a low proportion of cases within the community are reported to public health agencies (Mead et al., 1999). In a small number of cases, Salmonella infection can lead to more severe invasive diseases characterised by septicaemia and, sometimes, death. In a study of 48,857 patients with gastroenteritis (of which 26,974 were salmonellosis), Helms et al., (2003) found an association of salmonellosis with increased short-term (mortality within 30 days of infection) and long-term risk of death (mortality within a year of infection) compared with controls.
28

Symptoms of enteric infection with non-typhoidal Salmonella cannot be reliably distinguished from those caused by other enteric pathogens. In cases of acute gastroenteritis, the incubation period is usually 12-72 hours (commonly 12-36 hours) and is largely dependant on the sensitivity of the host and size of the dose ingested (FAO/WHO, 2002; Hohmann, 2001). Illness is usually self-limiting, with patients fully recovering within a week, although in some severe cases of diarrhoea, significant dehydration can ensue which may require medical intervention such as intravenous fluid replacement. Septicaemia is caused when Salmonella enters the bloodstream, with symptoms including high fever, pain in the thorax, chills, malaise and anorexia (FAO/WHO, 2002). Although uncommon, long-term effects or sequelae may occur including arthritis, appendicitis, cholecystitis, endocarditis, local abscesses, meningitis, osteomyelitis, osteoarthritis, pericarditis, peritonitis, pleurisy, pneumonia and urinary tract infection (ICMSF, 1996).
At the onset of illness large numbers of Salmonella are excreted in the faeces. Numbers decrease with time, but the median duration of excretion after acute non-typhoid salmonellosis has been estimated at five weeks, and approximately 1% of patients become chronic carriers (Jay et al., 2003).
Due to the general self-limiting nature of the disease, antibiotics are not usually recommended for healthy individuals suffering from mild to moderate Salmonella gastroenteritis (Hohmann, 2001). Antibiotics should be used, however, for those who are severely ill and for patients with risk factors for extraintestinal spread of infection, after appropriate blood and faecal cultures are obtained.
Of recent concern worldwide is the emergence of multiple antibiotic resistant strains of Salmonella, an example being S. Typhimurium definitive phage type 104 (DT104). Multi-resistant S. Typhimurium DT104 is a significant human and animal pathogen, with high morbidity observed in cattle and poultry (Crerar et al., 1999). To date, this organism is not endemic in Australia, although it is a significant health problem in European countries, North America, the Middle East, South Africa and South-East Asia (Jay et al., 2003). S. Typhimurium DT104 constitutes 8–9% of human Salmonella isolates in the USA. Sporadic human cases are reported in Australia, although these are commonly acquired overseas (Blumer et al., 2003). During 2001 an outbreak of S. Typhimurium DT104 occurred in Victoria and was linked to consumption of contaminated imported halva (a sesame seed product).
3.2.3 Host susceptibility
Individual susceptibility to Salmonella infection and/or disease can vary significantly, depending on host factors such as pre-existing immunity, nutrition, age, ability to elicit an immune response, structural and functional anomalies of the intestinal tract, or pre-existing disease (Gerba et al., 1996; Jay et al., 2003). Individuals who are generally at greater risk of infection and/or risk of developing more severe outcomes from exposure to Salmonella include the very young, the elderly, pregnant women and the immunucompromised (organ transplant patients, cancer patients, AIDS patients) (Gerba et al., 1996).
3.2.4 Dose-response
Human feeding trials for a range of Salmonella serovars were undertaken during the 1950’s to determine the relationship between the dose of pathogen ingested and the response of the individual (McCullough and Eisele.C.W, 1951d; McCullough and Eisele.C.W, 1951c; McCullough and Eisele.C.W, 1951a; McCullough and Eisele.C.W, 1951b). The study population consisted of healthy males confined in an institutional setting who were fed known doses of an individual Salmonella serovar. Infection was confirmed by recovering the administered Salmonella serovar from faecal samples.
Fazil (1996) combined all the data from the feeding trials and found that a single beta-Poisson relationship could adequately describe the dose-response for all serovars. However, a number of limitations exist on the use of such feeding trial data. Firstly the use of healthy adult male volunteers could underestimate the pathogenicity to the overall population. In addition, volunteers were exposed to high doses of Salmonella, with the minimum dose being 104 cells.
29

In dose-response analysis, the critical region is the lower-dose region, as these are the doses that are most likely to exist in real food contamination events. This requires extrapolation of the model to doses much lower than those used in the human feeding trials. It must also be noted that the dose-response models are based on the risk of infection as an endpoint rather than illness, and therefore may introduce a level of conservatism into the dose-response relationship.
It has been shown, through salmonellosis outbreak investigations, that doses resulting in illnesses (gastroenteritis) were often several orders of magnitude lower than the doses reported in the feeding trials (D'Aoust, 1994). Using a reasonably large data set, the FAO/WHO in 2002 developed a dose-response model based on actual outbreak data. Again, a beta-Poisson model was used to describe the dose-response relationship (Figure 3.2).
Figure 3.2 Uncertainty bounds for dose-response curves compared with expected value for the outbreak data (FAO/WHO, 2002). Fitted curves are the upper bound, lower bound, expected value, 97.5th percentile and 2.5th percentile.
Although not subject to some of the inherent flaws associated with using purely experimental data, data used in this model have a certain degree of uncertainty, which required assumptions to be made. This uncertainty is primarily due to the uncontrolled settings under which the information and data were collected. It is often difficult to determine the actual dose ingested (based on the level of the organism in the food at the time of consumption and the amount of food consumed), as well as determining the actual number of people exposed or ill during the outbreak.
3.3 Exposure Assessment
Poultry are exposed to Salmonella via sources such as feed or through environmental contamination. Once infected, the bird will excrete large numbers of organisms in its faeces. Direct contact with the faeces is one mechanism by which the pathogens spread throughout a flock, but spread may also be facilitated by contamination of the water and feed supplies. When introduced, Salmonella may spread rapidly throughout the flock.
A large number of studies have been undertaken, both in Australia and internationally, to determine the prevalence of Salmonella in raw poultry and poultry meat products, with reported prevalences ranging from 0 – 100% (Tables 3.7 and 3.8) (Lake et al., 2002). As discussed earlier, it is difficult to directly compare results between individual studies due to differences in the number and type of samples analysed, the stage of production that samples were taken, and the methodology used to isolate and/or enumerate the organisms.
30

A retail survey undertaken in South Australia (2002) on the microbiological quality of chicken fillet, mince and liver isolated Salmonella spp. from 30%, 20% and 59% of samples respectively. When S. Sofia was excluded, however, the isolation rate of Salmonella spp. from chicken fillet, mince and liver was 8%, 10% and 9% respectively.
31

Table 3.7 Summary of Australian surveys on Salmonella prevalence in raw poultry.
State/ Territor
y
Year Samples tested No. samples
No. positive
(%)
Serotype information(% of total Salmonella isolates)
Reference
ACT 1999-2000 Chicken (retail) 266 109 (41.0) S. Sofia 58.1%; S. Kiambu 19.4%; S. Subsp. II rough 2.2%; S. Typhimuruim untypable 2.2%; S. Typhimurium RDNC 1.1%; S. Typhimurium 9 2.2%; S. Typhimurium 64 5.4%; S. Typhimurium 135a 1.1%; S. Typhimurium 193 1.1%; S. Zanzibar 1.1%
Millard and Rockliff, 2000
ACT 1995-1996 Chicken (retail) 112 51 (40.2) S. Sofia 60.4%, S. Typhimurium 9 11.3%, S. Typhimurium 5.7%, S. Singapore 5.7%, S. Agona 5.7%, S. Typhimurium 179 3.8%, S. Ohio 3.8%, S. Typhimurium 64 1.9%, S. Anatum 1.9%
Millard and Rockliff, 2000
SA 2002 Chicken fillet, mince and livers (retail)
112 39 (34.8) S. Sofia 74%, Typhimurium 15.4%, S. Infantis 7.7%, S. Zanzibar 2.6%
Pers. Com - SA Dept. of Human Services
SA 2000-2001 Chicken carcasses, breast fillets, livers (end of processing).
260 140 (50.4) S. Sofia 93.6%, S. Infantis 5.7%, S. Zanzibar 1.4%, S. Mbandaka 0.7%, S. Anatum 0.7%, S. Chester 0.7%, S. Typhimurium 0.7%%
Sumner et al, 2004
WA 1996-2003 Chicken carcass 369 47 (12.7) S. Typhimurium 55.0%, S. Singapore 13.7%, S. Kiambu 7.8%, S. Bovismorbificans 3.9%, S. Bredeney 3.9%, S. Derby 3.9%, S. Infantis 2.0%, S. Adelaide 2.0%, S. Tennessee 2.0%, S. Livingston 2.0%
Pers. Com - WA Health Dept
NSW 2001 Chicken, duck, quail carcass 432 151 (35.0) S. Sofia 68.9%, S. Typhimurium 18.5%, S. Singapore 4.6%, S. Kiambu 3.8%, S. Agona 1.3%, S. Bovismorbificans 0.7%, S. Paratyphi B 0.7%, S. Schwarzengrund 0.7%, S. Zanzibar 0.7%
King and Hornitzky, 2001
NSW 1999 Chicken, duck, quail carcass 430 212 (49.3) S. Sofia 70.5%, S. Typhimurium 21.4%, S. Schwarzengrund 3.3%, S. Kiambu 1.4%, S. Mbandaka 1.0%, S. Ohio 1.0%, S. Heidelberg 0.5%, S. Hessarek 0.5%
King et al., 1999
32

Table 3.8 Prevalence of Salmonella in raw poultry and poultry products reported internationally. Adapted from (Lake et al., 2002).
Country Samples tested No. samples
No. positive(%)
Serotype information(% of total Salmonella isolates)
Reference
Albania Chicken 461 30 (6.5) S. Enteritidis 51.6%; S. Senftenberg 9.7%; S. Serogroup C 9.7%; S. Newport 6.5%; S. Abony 3.2%; S. Agona 3.2%; S. Banana 3.2%; S. Infantis 3.2%; S. Oslo 3.2%; S. Serogroup B 3.2%
Beli et al., 2001
Belgium Chicken carcasses 133 45 (33.8) S. Enteritidis 13.3%; Other serotypes 86.7% Uyttendaele et al., 1999Belgium Boiling hen carcasses 32 18 (56.3) S. Enteritidis 27.8%; Other serotypes 72.2% Uyttendaele et al., 1999Belgium Spring chicken carcasses 48 15 (31.3) S. Enteritidis 13.3%; Other serotypes 86.7% Uyttendaele et al., 1999Belgium Guinea fowl carcasses 32 8 (25.0) S. Enteritidis 25.0%; Other serotypes 75.0% Uyttendaele et al., 1999Belgium Chicken cuts 225 115 (51.1) S. Enteritidis 13.9%; Other serotypes 86.1% Uyttendaele et al., 1999Belgium Turkey cuts 164 60 (36.6) S. Enteritidis 0%; Other serotypes 100% Uyttendaele et al., 1999Belgium Spring chicken cuts 29 11 (37.9) S. Enteritidis 27.3%; Other serotypes 72.7% Uyttendaele et al., 1999Belgium Processed chicken 41 34 (82.9) S. Enteritidis 17.6%; Other serotypes 82.4% Uyttendaele et al., 1999Belgium Process turkey 66 18 (27.3) S. Enteritidis 11.1%; Other serotypes 88.9%Canada Goose carcass washes 130 78 (60.0) S. St. Paul 4.3%; S. Albany 4.3%; S. Agona 4.3% S. Infantis 4.3%; S. Tennessee
13.0%; S. Typhimurium 34.8%; S. Worthington 8.7%; S. Schwarzengrund 26.1%(Mann and McNabb, 1984)
Canada Goose cloacal swabs 315 58 (18.4) S. St. Paul 14.3%; S. Agona 7.1%; S. Typhimurium 57.1%; S. Schwarzengrund 21.4%
Mann and McNabb, 1984
Canada Chicken broiler carcass rinse 774 163 (21.1) NS CFIA, 2000Canada Young turkey carcass rinse 506 99 (19.6) NS CFIA, 2000Denmark Broiler cloacal swabs 8911 490 (5.5) S. Enteritidis 19.8%; S. Typhimurium 17.9%; S. Infantits 17.5%; S. 4.12:b- 14.4%;
S. Indiana 13.2%; S. Manhattan 3.3%; S. Hadar 2.9%; S. Anatum 2.5%; S. Agona 1.2%; S. Kentucky 1.2%; 13 other serotypes 1%
Wedderkopp et al., 2001
Ireland Poultry 106 28 (26.4) S. Bredeney 46.4%; S. Kentucky 39.3%; S. Enteritidis 7.1%; S. London 3.6%; S. Schwartzangram 3.6%
Duffy et al., 1999
Kuwait Chicken 30 24 (80) Abu Ruwaida et al., 1996Malaysia Chicken portions 33 13 (39.4) S. Blockley 33.0%; S. Enteritidis 26.7%; S. Chincol 13.3% S. Paratyphi B var
Odense 6.7%; S. Kentucky 6.7%; S. Welteverden 6.7%; S. Virchow 6.7%Arumugaswamy et al., 1995
Malaysia Chicken gizzard 18 8 (44.4) S. Blockely 50.0%; S. Enteritidis 25.0%; S. Chincol 12.5%; S. Paratyphi B var Odense 12.5%
Arumugaswamy et al., 1995
Malaysia Chicken liver 17 6 (35.3) S. Blockley 42.9%; S. Enteritidis 28.6%; S. Newport 14.3%; S. Kentucky 14.3% Arumugaswamy et al., 1995Spain Chicken 40 0 Soriano et al., 2001Spain Chicken 198 71 (35.8) S. Enteritidis 47.9%; S. Hadar 25.4%; S. Serotype 4,12:b-(II) 19.7%; S. Mbandaka Dominguez et al., 2002
33

Country Samples tested No. samples
No. positive(%)
Serotype information(% of total Salmonella isolates)
Reference
2.8%; S. Virchow 1.4%; S. Derby 1.4%; S. Paratyphi B 1.4%
Turkey Chicken faecal samples 814 151 (18.6) S. Enteritidis 81.5%; S. Agona 7.6%; S. Thompson 10.5%; S. Sarajane 0.8% from broilers. Only S. Enteritidis from layers
Carli et al., 2001
UK Frozen retail chicken 146 79 (54.1) S. Enteritidis PT4 41.8%; other serotypes 58.2% Roberts, 1991UK Chilled retail chicken 146 62 (42.5) S. Enteritidis PT4 45.2%; other serotypes 54.8% Roberts, 1991UK Chicken 325 75 (22.8) S. Enteritidis 42.6% S. Typhimurium 6.5%; other serotypes 50.9% Plummer et al., 1995UK Giblets 35 13 (37.1) S. Enteritidis 17.2%; S. Typhimurium 0%; other serotypes 82.8% Plummer et al., 1995UK Carcass rinse, breast pieces 300 87 (29) NS Harrison et al., 2001UK Raw chicken
- Fresh- FrozenLocal and imported product
4866 (total)36141252
276 (5.7)133 (4.0)143 (10.4)*
S. Typhimurium 13.6%, S. Heidelberg 12.1%, S. Infantis 7.5%, S. Enteritidis 7.1%, S. Ohio 7.1%, S. Thompson 6.4%, S. Bovis-morbificans 5.7%, S. Java 3.9%, S. Agona 3.5%, S. Indiana 2.8%, S. Kentucky 2.8%, S. Montevideo 2.8%, S. Virchow 2.8%, S. Livingstone 2.5%, S. Mbandaka 2.5 %, S. Brandenburg 2.1%, S. Bredeney 2.1%, S. Hadar 1.7%, S. Derby 1.4%, S. Senftenberg 1.0% S. Tennessee 1.0%, other serotypes 6.1%
FSA, 2001
USA Carcass rinse 798 49 (6.1) S. Thompson 59.2%; S. Molade 8.2%; S. Infantis 8.2%; S. Senftenberg 4.1%; S. Oukam 4.1%; S. Montevideo 4.1%; S. Mbandaka 2.0%; S. Kentucky 2.0%; S. 4,5,12:I-monophasic 2.0%
Bailey et al., 2001
USA Retail chicken 212 9 (4.2) NS Zhao et al., 2001USA Retail turkey 212 5 (2.6) NS Zhao et al., 2001USA Retail chicken 201 70 (35) S. Agona 100.0% White et al., 2001USA Retail turkey 201 48 (24) S. Agona 100.0% White et al., 2001USA Poultry products 2-100%,
Median 30%NS Bryan and Doyle, 1995
USA Broiler carcass rinse fluids 1297 260 (20) NS FSIS, 1996USA Turkey carcass rinse fluids 1221 227 (18.6) NS FSIS, 1998NS = Not specified.
34

Few studies have investigated the actual concentration of Salmonella on chicken carcasses. National surveys have been conducted in the United States (1995-1996) and in Canada (1997-1998) where large numbers of poultry carcasses were sampled and results presented as most probable number (MPN) distributions (CFIA, 2000; FSIS, 1996). Both studies are of similar design and sampled carcasses immediately following the chill tank (prior to any further handling/processing).
The reported prevalence of Salmonella from the US and Canadian baseline studies were 20% and 20.1% respectively. Of the broiler carcass rinse samples that tested positive, the geometric mean Salmonella concentration was 64 MPN/carcass (range <12 – 1.1 105) and 32 MPN/carcass (range <12 – >4.4 104) for the US and Canada respectively (Table 3.9).
Table 3.9 Distribution of Salmonella on finished carcassesCountry Number of
samples% MPN per carcass# Reference
109 41.9 < 12*
FSIS, 1996118 45.4 12 – 120
USA 24 9.2 121 – 1200(n = 260) 6 2.3 1201 – 12000
3 1.2 > 1200099 60.7 < 12*
CFIA, 200060 36.8 12 – 120
Canada 2 1.3 121 – 1200
(n = 163) 1 0.6 1201 – 120001 0.6 > 12000
# MPN per carcass calculated from reported values (MPN/mL rinse fluid) 400 mL total rinse fluid used for USFDA-FSIS and CFIA results.
* Limit of detection for quantitative MPN method.
3.3.1 On Farm
Contamination of poultry by Salmonella during primary production is multifactorial and there are no data on the relative importance of one factor over another. Because of this it is not possible to estimate the risk associated with various practices. The following section highlights current knowledge on practices that impact on hazards during primary production.
Good hygienic practices and good agricultural practices are necessary prerequisites for the management of Salmonella on-farm. Several studies have been undertaken both in Australia and overseas looking at factors associated with increased risk of Salmonella carriage in chickens. Most, if not all, of these studies have considered factors individually. It is likely that numerous factors result in Salmonella infection in broilers prior to slaughter. It is not feasible, given the large number of factors, to consider them in combination.
Contamination of birds by Salmonella can usually be traced to one of three production factors: (1) contaminated feed, (2) environmental sources, and/or (3) vertical transmission from contaminated eggs.
The impact of Salmonella contamination of birds/flocks on the subsequent prevalence of Salmonella positive carcasses at the end of processing is dependent on the stage of production that the contamination occurs. For example, if contamination is limited to a particular growing farm then it is likely that just that farm will be affected (assuming adequate biosecurity controls) and that the problem may be eliminated via thorough cleaning and sanitising after depopulation and harvest. If the contamination is at the hatchery stage, then a much larger number of farms could be affected due possibility of mixing of eggs from different farms and the movement of contaminated chicks from the hatchery to multiple growing farms.
35

Apart from servovars such as S. Enteritidis PT4, which have the ability to be vertically transmitted to eggs via the reproductive tissue of infected hens, eggs may become contaminated by Salmonella via faeces, litter, nest boxes and equipment (Chen et al., 2002). For example Bailey et al. (2002) found there was no correlation between the Salmonella serovars isolated on breeder farms with those isolated from the hatchery.
A number of studies have highlighted the importance of hatchery sanitation in minimising the transmission of Salmonella to growing flocks (Bailey et al., 2001; Bailey et al., 2002; Hendrickx et al., 2002; Chen et al., 2002). Baily et al. (2002) found an association between Salmonella serotypes isolated in the hatchery and those found on the final processed carcass.
Contaminated poultry feed is considered the major avenue by which Salmonella is introduced into poultry flocks. Poultry are primarily fed a mixture of cereal grain (e.g. wheat, oats, barley and sorghum), protein meal (e.g. meat meal or soybean meal) vitamins and minerals. Meat meal is generated from rendering plants, which process animals, meat trimmings and other animal by-products. Feed mills combine the plant and animal (protein) ingredients to produce a feed mix (mash), which may be heat-treated and compressed into formed pellets due. Bacterial contamination of some feed ingredients may result in the finished feed being contaminated, even if the feed is heat-treated for reasons such as insufficient heat treatment or cross contamination of raw ingredients with heat-treated feed. This in turn can result in live birds being infected, pathogens becoming endemic in the bird flock and the potential for the pathogen to be transmitted through the food chain to humans. This has been previously demonstrated in the United States where poultry feed contaminated with Salmonella was the source of infection for live birds (Crump et al., 2002).
In the UK, Salmonella were isolated from feed mills at rates ranging from 1.1 to 41.7% (Davis and Way, 1997). Equipment in feed mills can become contaminated leading to a high prevalence in final product. Contamination by rodents and birds is thought to be the main source of Salmonella in feed (Davies and Wray, 1997). Contaminated feed was identified as the major source of contaminated flocks in a UK study of Salmonella carriage in chicken flocks presented for slaughter at two abattoirs (Corry et al, 2002). Australian data shows that feed can be contaminated with Salmonella at a rate of between 3.5 - 25.6% (personal communication, WA Department of Health). In-vitro studies have shown acidification of feed to be a possible intervention for control of Salmonella, although in-vivo studies showed limited effect (Heres et al, 2004).
The Australian Standard for Hygienic Rendering of Animal Products (AS 5008:2001) requires all rendering plants sample meat meal daily and test a weekly composite for Salmonella. A tolerance of three positive samples in a window of ten is allowed. The standard also requires that heat treatments used in rendering be validated once a year by testing cooked product for Clostridium perfringens for ten consecutive days.
The Stockfeed Manufacturers Association of Australia operates under a Code of Practice and accreditation system for the production of stock feeds. The guideline does not specify any microbiological testing for feeds. In practice feed mills carry out a reasonable amount of sampling and testing of broiler feeds and layer feeds for Salmonella (FeedSafe: www.sfmca.com.au/feedsafe).
Pelleted poultry feed is considered to be of lower risk of Salmonella contamination compared to non-pelleted feed as it has undergone heat treatment during processing. However, contamination may occur post-processing, potentially resulting in high prevalence of Salmonella contaminated feed.
Some poultry species are fed primarily whole-grains (i.e. no meat meal component), which may impact on the likelihood of feed contamination. Depending on storage conditions, however, contamination of grains may occur via exposure to pests such as wild birds and rodents.
Due to the complexity of the industry and the variability between farms, it is not possible to identify specific practices that might play an important role in Salmonella contamination of growing flocks. The results of several studies undertaken to identify specific practices have been derived from statistical analysis of the data.
36

They do not account for likely interactions between factors identified in the study or for possible factors not identified in the study. Where possible, the type of transmission i.e. vertical or horizontal has been identified. Data for the effect of these factors are lacking. It is likely that while some of these factors will be important in all poultry production systems others will not.
Rose et al (1999) reviewed some of the risk factors reported in the literature to be associated with Salmonella contamination in broiler-chickens. They included:
Poor hygiene and Salmonella contamination in the previous flock (vertical)
Contaminated chicks (vertical)
Contaminated feed (horizontal)
Size of the farm (>3 houses) (horizontal-presumably related to increased human traffic between multiple sheds)
Summer (as well as wet conditions) (horizontal-greater environmental contamination in summer due to growth and survival of Salmonella)
Litter beetle infestation
It is not clear how these factors relate to Australian farming practices. Presumably some factors will apply equally to both systems i.e. poor hygiene and contamination of previous flocks, while others, such as summer, may have little effect in Australia.
Factors identified by Rose et al (1999) have been found to be important in other studies. In a French study of 86 broiler farms six factors were statistically important determinants for Salmonella detection in growing house environments prior to depopulation (Rose et al, 2000). The factors were:
Salmonella contamination inside the growing shed on day zero (vertical)
Salmonella infection in day-old chicks (vertical-positive from hatchery/transport)
Salmonella control programs for chicks (farms with control programs had significantly lower salmonella flock prevalence)
Feed trucks parking near change room entrance (horizontal – contaminated feed transferred to shed environment or Salmonella positive sheds contaminating feed)
Use of meal rather than pellets (pelletised feeds generally lower risk of being contaminated with Salmonella because of heat treatment during manufacture).
Other studies have highlighted persistence of Salmonella in sheds between flocks as an important source of contamination of subsequent flocks housed in that shed (Codex, 2002). No data are available on the efficacy of cleaning programs in Australia for ensuring that the shed environment is free of Salmonella after depopulation of a positive flock. A summary of the possible risk factors in Australian production are given below:
37

Table 3.10 Risk factors associated with on-farm transmission of Salmonella
Risk Factors Current Control Measures24Importance
Low Medium HighVertical transmission:
Great grandparent birds Eggs quarantined Breeder farms Eggs sanitised Contaminated chicks Screening of breeder flocks
Horizontal: Previously contaminated flocks/sheds
Hygiene and effective cleaning
Bio-security (see below) Foot baths, limiting traffic Litter/Darkling beetles Cleaning litter, resting sheds
between flocks
Contaminated feed Testing, pelletised
The term biosecurity is used to describe a set of management practices which, when followed collectively, reduce the potential for the introduction or spread of disease-causing organism onto and between poultry production sites. Disease causing organisms can be introduced into poultry farms from numerous sources including the birds themselves, people, vehicles and equipment use between farms and by clothing, footwear, aerosols, water, feed, litter, wild birds, insects and vermin. In general, biosecurity programs consists of the following control measures in accordance with the National Biosecurity Manual – Contract Meat Chicken Farming, Australian Chicken Meat Federation.
Controlled introduction of stock, litter and feed: New stock should be sourced from reputable suppliers which have approved quality
assurance and vaccination programs in place. Incoming stock should be inspected on arrival and placed in sheds that have been cleaned and disinfected before use.
Litter and feed should also be purchased from approved sources.
Controlled access: Access to farms/sheds should be limited. Areas should be clearly identified as “clean” or
“dirty” areas to ensure people are aware of when to remove their “dirty” off-farm clothes and footwear and put on “clean” farm boots and clothing, wash their hands etc.
If moving between farms/sheds, visits should be carefully planed to move from sites of lower biosecurity risk (i.e. from their home, younger birds or a health farm/shed) to sites of higher risk.
Water supply: If treated mains supply water is not available, source water should be chlorinated or
treated by some other appropriate method.
Wild birds and other animals: Poultry housing should be designed and maintained so as to exclude wild birds and
rodents. This should include the implementation of a rodent and pest control program.
General hygiene: All equipment including transport crates, containers and shed equipment such as feeders,
and drinkers should be cleaned and disinfected before use. At batch depletion, the internal surfaces of vacated building and all equipment should be cleaned thoroughly. Damaged eggs, dead and cull birds, litter and manure should be disposed of promptly by approved methods.
Aerosol spread and buffer distances:
24 Examples of measures currently in place that controls these risks.
38

Provision of adequate buffer zones to prevent airborne transmission of disease causing microorganisms.
Staff training: Staff should be adequately trained in biosecurity procedures.
Feed withdrawal has been highlighted as important for ensuring that faecal contamination during slaughter is minimised (ACMSF, 1996). Lower gut volumes in birds at the time of slaughter ensure that spillage and resulting contamination are minimised. If the gut is full the chances of rupturing the stomach during evisceration is increased. The length of feed withdrawal is critical, too short (<6-8h) and the intestines will be full of ingesta, too long and the wall of the intestine may be weakened, increasing the chance of contamination during processing (Russell, 2002). In Australia feed withdrawal is generally for 8-hours prior to slaughter. While feed withdrawal is beneficial as a processing aid it may have a negative impact on faecal carriage of Salmonella. Feed withdrawal prior to partial depopulation can stress birds remaining in the shed, increasing their susceptibility to infection. It is not clear if feed withdrawal is undertaken prior to partial depopulation in Australia. There is also the possibility that Salmonella may colonise the gut after long periods off feed; in other animals feed withdrawal results in increased number of Salmonella in the gut.
Acidification of water available to birds during feed withdrawal has been shown to be effective in reducing the prevalence of Salmonella in the crop of birds at slaughter (Russel, 2002). Lactic acid (0.44%) reduced Salmonella prevalence in crops at slaughter by 80%.
Based on domestic and international literature, the following table (Table 3.11) highlights the major risk factors associated with the introduction and spread of Salmonella within chicken flocks . Because the ecology of this organism on-farm is poorly understood, the list should not be considered exhaustive nor the importance of each factor absolute.
Table 3.11 Relative importance of on-farm risk factors in the transmission of Salmonella
1 Tom Humphrey - University of Bristol, England (personal communication2 Threats to bio-security includes factors such as partial depopulation, other animals/birds, personnel,
proximity to other poultry sheds etc
39
Risk Factor 1
Increasing Importance
Biosecurity factors 2 Salmonella
Vertical transmission from breeder flocks Salmonella
Positive chicks Salmonella
Previously positive flocks Salmonella
Litter/Insects Salmonella
Contaminated Feed Salmonella
Age of birds at slaughter Salmonella

At the end of rearing, flocks are collected on farm, placed into crates and transported to the processing plant and processed on the same day. The collection and transport process may increase the extent of Salmonella contamination of birds due to cross contamination from contaminated crates, faecal contamination and contact with contaminated birds (Keener et al., 2004, Slader et al., 2002).
3.3.2 Processing
The contamination of poultry meat is very much dependent on the status of the birds prior to processing and hygienic operations during processing. If the birds are contaminated prior to slaughter, it is currently not possible to process poultry in the volumes required without some level of faecal contamination.
Processing can be divided roughly into stages that are common to a number of poultry processing lines. The schematic in Figure 1.2 highlights stages in processing that have been considered in published studies for their effect on bacterial contamination during processing.
The effect of processing on Salmonella contamination on chicken carcasses was reviewed as part of the FAO/WHO (2002) quantitative risk assessment of Salmonella in broiler chickens, much of the information described below is a reflection of that work.
There are two main sources of Salmonella contamination in the processing plant (1) the birds themselves and (2) cross-contamination from other birds or the environment. Each of the processing stages affects carcass contamination via one of the two sources stated above.
Stun and slaughter
Prior to stunning, birds can be contaminated with large numbers of Salmonella through cross-contamination during collection and transport. Studies have shown levels of about 10 6 CFU/g on the outside of birds immediately after stunning (FAO/WHO, 2002). Birds can be stunned by either electrical shock or asphyxiation followed by exsanguination. Both of these techniques are unlikely to cause significant carcass contamination or cross-contamination and these practices have not been identified as major sources of Salmonella on poultry carcasses.
Scalding
Scalding temperatures differ for different poultry species depending on the difficulty in removing feathers. High temperature scalding processes will have a beneficial effect in reducing bacterial numbers, however at high temperature there is a reduction in meat quality due to discolouration of the outside surface (skin) of the carcass.
The primary purpose of scalding is to facilitate the removal of the feathers. In order to do this effectively the temperature of the scald water must be carefully controlled. In Australia the temperature of scald water is generally in the range of 50 to 58C, with the temperature adjusted depending on the final product, for example 50-52C for the fresh poultry meat market and 58C for birds for the frozen poultry meat market (ACMSF, 1996). Three temperature profiles are used in Australia; low 50-52C, medium 53-56C and high temperature 58C (unpublished data, Australian Chicken Meat Federation).
There are implications in using low temperature scald protocols. Salmonella are washed from the external surfaces of the birds during scalding and they have been shown to survive in scald water at low temperature. Birds processed at low temperatures can therefore become contaminated. Most studies (summarised in FAO/WHO, 2002) show little reduction in Salmonella after scalding and based on these studies it is assumed that scalding has little effect on Salmonella. Acidic conditions that can prevail in scald water may act to increase the heat resistance of Salmonella (Humphrey and Lanning, 1987).
40

There are a number of interventions that can be applied to decrease the likelihood of contamination during scalding such as the use of counter-current flow, addition of as much fresh water as possible and having the scald temperature as high as possible (Russell, 2002). While no quantitative data were provided, Russell (2002) indicated companies observed a reduction in Salmonella prevalence as a result of implementing these management strategies.
Defeathering
In larger processing facilities defeathering is carried out by machines that remove the loosened feathers from the carcass. Hand defeathering is rarely, if ever practiced in chicken processing, however it is not clear if it is common in other poultry species. Defeathering is considered to be a major source of cross-contamination. With mechanical defeathering it is important that the rubber fingers kept cleaned, and worn fingers replaced regularly. Microorganisms such as Salmonella spp. can become trapped in cracks and/or joins of the fingers, which requires the machinery to be dismantled for full cleaning and disinfection. Because of the nature of the operation, contamination can also occur via aerosols.
Washing
Carcasses are washed after defeathering to help remove loose feathers and contamination, and after evisceration to remove visible signs of contamination. In general, removal of bacteria from carcasses will be difficult because bacteria may be trapped within the skin and feather follicles. Washing will remove some Salmonella for the carcass as demonstrated by the detection of Salmonella in wash water. The Australia Standard for Construction of Premises and Hygienic Production of Poultry Meat for Human Consumption (the Australian Standard) specifies a wash water temperature of 18C or less. For immersion washing, carcasses cannot remain in the tank for more than 15 minutes, unless the temperature of the wash water is <4C.
In general terms washing after evisceration will have a greater impact on carcass contamination, so the effects of washing post-evisceration are only considered in this report.
Buhr et al (2002) demonstrated reductions from washing of 1.2-logs and 0.35-logs for carcasses where crops were removed intact and after rupturing, respectively. A halving of the prevalence was observed in both cases following washing. Smith et al (2004), however, found little effect of washing on numbers of E. coli (~0.2-log10 reduction) and noted an increase in the prevalence of Salmonella after washing.
Clearly the efficacy of washing is dependent on other factors besides simply applying water to a carcass. Attachment of Salmonella to the skin during processing may occur very rapidly, within 15 sec, and can reduce the efficacy of washing (Lillard, 1985). Bacteria may also be protected via entrapment in feather follicles.
Inclusion of sanitisers such as chlorine and tri-sodium phosphate (TSP) may increase any reduction achieved by washing. Generally washing should be controlled to ensure; (1) proper pressure, (2) proper pH, (3) adequate level of free chlorine and (4) good coverage (Russell, 2002).
Evisceration
Evisceration is a process for removing the crop, gut and other internal organs. Some of these organs can be highly contaminated with Salmonella.
As previously discussed, feed withdrawal is critical in controlling the amount of intestinal spillage that occurs during evisceration. In Australia the average time off feed is about 8 hours. The level of contamination is likely to reflect the sophistication of the process and the line speed of processing. Poorly controlled processes will result in considerable contamination of the carcass via rupture of the intestines.
41

Similarly, as the processing speed increases there is a greater likelihood of faecal contamination during evisceration, particularly if equipment is not correctly maintained and calibrated. Equipment should be thoroughly cleaned and sanitised between shifts to minimise the build up of contamination. Most studies of the evisceration process show an increase in prevalence of Salmonella after evisceration of between 2 to 5-fold, although one study in the US showed little effect of evisceration on the prevalence of Salmonella (FAO/WHO, 2002). No quantitative data are available for Salmonella pre and post evisceration.
Chilling
To limit the growth of microorganisms on the carcass it is important to chill the meat to <4 C as quickly as possible. Methods for carcass chilling include air-chilling, water immersion and spray chilling. Due to the risk of cross contamination in immersion chilling, European countries have generally moved to air chilling of carcasses, whereas in Australia and the US immersion chilling is common.
The Australian Standard requires chilling water to be maintained at 4ºC or less. The presence of free chlorine has been shown to be beneficial in lowering contamination on immersion chilled carcass, with levels of 3 ppm or more reducing the prevalence of Salmonella considerably. The only requirement in the Australian standards for chlorine is that there must be available chlorine remaining in the water exiting the chiller. The Australian Chicken Meat Federation (ACMF) recommends 50-70 ppm total chlorine and 0.4-4.0 ppm free available chlorine in spin chiller water.
Effective chilling can result in a reduction in bacterial numbers. Russell (2002) recommended the following parameter settings for the control of Salmonella contamination during chilling; water pH (6.5-7.5), temperature (<5ºC), flow rate (approximately 5 litres per bird). Flow direction (counter current) and chlorine concentration can all impact on chiller performance. If conditions of the spin chiller are not correctly maintained, it can be a major source of cross-contamination between carcasses. Data are lacking on the effect of immersion chilling in Australia.
Portioning and packaging
There is the possibility of cross contamination during portioning of carcasses. There is also the possibility of growth of Salmonella if the temperature of the carcass has not been reduced to <7C during chilling. It is important to maintain an air temperature of 10 C or less during portioning. Lower temperature are preferred, however there are occupational health and safety issues at temperatures less than 10C. If air temperatures are greater than 10C growth of Salmonella may occur during a typical 8-hour shift. Under normal operating conditions i.e. 10C, cleaning and sanitising of contact surfaces should be carried out every 8h to ensure that build up of Salmonella on contact surfaces does not occur.
Prevalence data for Salmonella on final carcasses or portions has been reported (FAO/WHO, 2002). In general prevalence ranges between 2 and 62.5%. The overall prevalence in 10 countries was approximately 18%. This compares closely to the prevalence of 23.7% found on Australian whole chicken carcasses (data supplied by the Australian Poultry Industry Association). In Australia, S. Sofia is the dominant serotype isolated from chickens and chicken meat. Australian industry data collected for whole carcasses (1994 – 2003; with a total number of 64,414 samples), indicates a prevalence for S. Sofia of 18.4%, compared to 5.4% for other Salmonella serotypes (See Appendix 2 for summary of Australian Poultry Industry Association data). S. Sofia is an extremely rare human pathogen and only a few cases are reported in Australia annually. It is hypothesised that S. Sofia has low pathogenicity to humans and therefore presents a low risk. In the current assessment only non S. Sofia serotypes are considered.
42

In general, most studies show the prevalence of Salmonella to be higher at the end of processing than at the start. The impact of each of the processing stages on the prevalence/population of Salmonella is summarised in the following table (Table 3.12). Addition of sanitisers (such as sodium hypochlorite) to wash water at various stages can have a beneficial effect on reducing the prevalence of Salmonella.
Processing aids
A number of processing aids have been put forward for the reduction of Campylobacter and Salmonella on poultry carcasses. These have been reviewed by Keener et al (2004) and include chlorine, organic acids, chlorine dioxide, trisodium phosphate and acidified sodium chlorite. Most of these aids will achieve a reduction of between 1 and 2-logs under commercial conditions. If the application of these additives is not carefully controlled then reductions are likely to be minimal.
Table 3.12. Effect of processing stage on Salmonella contaminationProcess stage Comments Effect on Salmonella contamination
Reduce Minimal Increase
Stun/Kill
Scald – Low temperature Survival of Salmonella in scald water – cross contamination
Scald – High temperature Kill step
De-feathering Cross-contamination
Effective washing Physical removal of bacteria
Evisceration Contamination with faeces, main source of carcass contamination
Effective washing Physical removal of bacteria
Chilling – immersion (sub-optimal operation)
Cross-contamination
Chilling – immersion (effective operation
Requires constant monitoring of water temp., flow rates and chlorine levels.
Chilling – air Slight reduction due to desiccation of the carcass surface
Portioning Possible growth/cross contamination
3.3.3 Processing to consumption – a quantitative risk assessment
The risk of food-borne illness from the consumption of contaminated chicken was quantified through stochastic modelling that took into consideration of the complex food chain from the end of processing to the time of consumption (Figure 3.3). The model framework consisted of several modules. For each module, the concentration of Salmonella was calculated based on literature observations as to the effect of the various stages on the numbers of these bacteria. A summary of the model is given in Appendix 3.
Figure 3.3 Modules modelled to determine the risk of salmonellosis from the consumption of poultry - end of processing to the time of consumption.
43
End of processing Transport:Processing to retail
Retail storage Transport:Retail to food service/home
Consumption Cooking Cross-contamination Storage

End of processing
Prevalence data for Salmonella (5.3%25) was obtained from Australian industry, while the count on carcasses at the end of processing (approximately 10 MPN/carcass) was modelled using a cumulative distribution based on Canadian baseline data (FAO/WHO, 2002).
The effect of freezing poultry meat at the processing plant was also modelled. Freezing will reduce the populations of Salmonella. There is usually a rapid reduction in bacterial numbers on poultry when frozen, followed by a gradual reduction over time. This effect was modelled for Salmonella using data in ICMSF (1996) (Figure 3.4).
0
0.5
1
1.5
2
2.5
3
3.5
0 50 100 150 200
Time (days)
Log
Red
uctio
n
Figure 3.4 Modelled reduction and uncertainty over time for Salmonella stored at -18 C.
Uncertainty in the prevalence and concentration was modelled using beta and cumulative distributions, respectively. The prevalence was used to determine if a randomly chosen bird exiting processing was positive (using the binomial distribution). The output of the processing module was the count (MPN) per g and the number of cells on a whole carcass. Carcass weight was assumed to be distributed with a minimum value of 1,100g, most likely 1,500g and maximum 2,500g (using a Pert distribution).
Transport to retail
Salmonella numbers will increase when storage conditions favour growth i.e. at temperatures greater than 7C. In the model it is assumed that transport from the processing plant to retail is well controlled and the temperature of the product remains below the minimum growth temperature. The growth of Salmonella was modelled (Figure 3.5) based on generation times calculated in the FAO/WHO (2002) risk assessment.
25 All values given in the text represent the most likely value for the input. In the model uncertainty around these most likely values was modelled using probability distributions in @Risk.
44

02468
1012141618
6 10 14 18 22 26 30 34 38 42
Temperature
Hour
s pe
r gen
erat
ion
Figure 3.5 Estimated generation times (h/gen) of Salmonella at storage temperatures from 7 - 37C (FAO/WHO, 2002).
Retail storage
Retail storage temperatures were modelled from data collected during a Meat and Livestock Australia (MLA) study (unpublished data, Figure 3.6).
-10 -5 0 5 10 15 20
Temperature
Freq
uenc
y
Figure 3.6 Frequency distribution for retail temperatures in Australia (MLA, unpublished data).
Growth during retail storage is a function of both the temperature and the time of storage. Storage time was modelled to be somewhere between 2 - 7 days. In order to avoid unlikely time and temperature combinations these two variables were correlated i.e. as the temperature increased the time of storage decreased.
While correlating storage time and temperature removed some unlikely combinations, there were still instances where the predicted growth of Salmonella during storage was >8-logs. Obviously under these storage conditions the product would spoil. In order to avoid these unlikely scenarios, growth of the main poultry meat spoilage organism, Pseudomonas, was modelled at the selected storage temperature and the time of storage truncated at a value that would allow only a 2-log increase in Pseudomonas. The growth rate of Pseudomonas was predicted using the model parameters derived by Neumeyer et al (1997).
Transportation from retail to food service/home
Growth during transportation was modelled as described for the previous transportation step. The temperature during transportation was modelled based on the FAO/WHO (2002) risk assessment. The most likely temperature during transport was estimated to be 20 C (range 7 - 30C), with an average transport time of 60 minutes (range 5 - 240 minutes). The change in meat temperature (for non-frozen products) was estimated and possible growth in Salmonella determined.
45

The average growth of Salmonella on chicken carcases during transport from retail to the home was estimated to be about 0.01-logs, with a maximum increase of about 0.5-logs.
Storage
Due largely to the lack of available data for storage conditions and practices used by the food service sector, this model is primarily based on consumer data (i.e. home use). The factors in the home effecting Salmonella numbers on poultry meat are, however, considered the same as in the food service sector. The model includes both refrigerated and frozen storage. Consumers often freeze fresh meat prior to use if the poultry meat is not going to be cooked immediately. In order to model this practice a survey of 141 Food Science Australia staff (Brisbane) was undertaken. The results of this survey show that on average 70% of consumers freeze fresh meat after purchase. It is unlikely that Food Science Australia staff are representative of the Australian population; however in the absence of published data, these data were used as indicative of general consumer practice.
The effect of freezing on Salmonella numbers was modelled as previously described. The storage time for frozen poultry was taken to be between one and 30-days. It was assumed that frozen poultry meat is thawed prior to preparation for cooking. If thawing is carried out in a refrigerator it is unlikely that there will be any growth of Salmonella. Jay et al (1999a) reported that about 40% of consumers thaw frozen meat by leaving it at room temperature. This practice will allow growth of Salmonella. Growth during thawing was modelled based on data in the FAO/WHO (2002) risk assessment and allowed for thawing at 20C (1.8 to 2.8-logs) or 27C (2.9 to 5.4-logs) to take into account for winter and summer conditions.
Growth of Salmonella on fresh poultry meat stored refrigerated was modelled as previously described, based on domestic refrigerator (Figure 3.7) temperatures in Australia (MLA, unpublished data).
0
0.2
0.4
0.6
0.8
1
-10 -5 0 5 10 15 20
Temperature
Cum
ulat
ive
Freq
uenc
y
Figure 3.7 Cumulative frequency distribution for domestic refrigerator temperatures in Australia (MLA, unpublished data).
To avoid unrealistic time/temperature combinations a similar procedure was used to that applied in the previous section, however, the storage time was truncated based on time for a 4-log increase in Pseudomonas. The maximum storage time was set at 5-days. The growth rate of Pseudomonas was predicted using the model parameters derived by Neumeyer et al (1997).
Cross-contamination
Cross-contamination is potentially a very important source of Salmonella on foods. If food prepared in the home is adequately cooked, cross-contamination will be the major source of food-borne disease in the home environment. If undercooking does occur it will also play an important role in food-borne disease and remains a common factor identified in outbreaks.
46

In order to model cross-contamination it is important to have quantitative data on the number of bacteria on the product and the rate and population transferred to other foods during preparation of fresh meat for cooking. These data are lacking. Although some laboratory-based studies are available, these may not reflect consumer practices. A number of consumer-based studies have been reported and these are used in the model to generate data about how bacteria move between fresh meat and other foods and kitchen surfaces. These data also have limitations, as video studies have shown that about 10 - 70% of survey respondents did not perform particular hygiene activities as stated (Jay et al, 1999b).
Cross-contamination from raw poultry to food handlers and to cutting boards was modelled. The models used were those proposed in the FAO/WHO (2002) risk assessment. Australian data for practices in the kitchen were used where available i.e. percentage of food handlers not washing hands (7%) and percentage of cutting boards not cleaned between raw and ready-to-eat food preparation (11%).
The outcome of the cross-contamination module is the number of Salmonella on other foods prepared in the kitchen and the number remaining on the poultry meat prior to cooking.
Cooking
Inactivation of Salmonella during cooking is modelled based on data from ICMSF (1996). The temperature of cooking is considered to be adequate to inactivate most of the cells on the chicken surface at the time of cooking. However, it is hypothesised that a percentage of bacteria (16%) present on a chicken are in areas that do not receive sufficient heating (FAO/WHO, 2002). The frequency with which this occurs is modelled as well as the time and temperature at these protected areas. From this information the number of surviving cells is estimated.
Consumption
The number of cells ingested was estimated by adding the number of cells transferred to other foods and the number of cells surviving cooking and then allowing for the serving size (Min 19g, average 250g, max 550g; FAO/WHO, 2002). The probability of illness was then determined using dose response models (FAO/WHO, 2002).
The total number of servings of poultry meat in Australia (2,880,000,000 per annum) was estimated from annual consumption data (36 kg per person per year, average serving size 250g) and the Australian population (20 million). A summary of the annual per capita consumption of poultry meat in Australia is provided in Appendix 3.
3.4 Risk Characterisation
Salmonellosis is one of the most frequently reported food-borne illnesses in Australia, leading to significant morbidity in the population. In a majority of cases, symptoms are limited to gastroenteritis, with a small proportion leading to more severe outcomes such as hospitalisation, long-term sequelae or death.
Based on results from national and international epidemiological investigations, the prevalence of Salmonella on raw poultry meat and outputs from the modelling undertaken in this assessment, there is reasonable evidence to suggest that poultry is the vehicle in a proportion of food-borne of salmonellosis in Australia.
The output of the mathematical model simulating poultry meat transportation, storage and handling, is an estimate for the likely number of salmonellosis cases resulting from consumption of poultry meat in Australia (with meaningful statistical distributions). The relevance of the risk estimate depends (1) if the model represents precisely the true practice in the various stages of poultry meat processing, handling and preparation, and (2) the availability of suitable and accurate data.
47

Due to the lack of both suitable and accurate Australian data across the entire model pathway, it is of little use in scientific terms to present the final risk estimate in this document.
More relevant to this risk assessment, however, is the output of a number of scenarios that can lead to a change in the number of predicted salmonellosis cases from consumption of poultry meat. Outputs of various scenarios are presented in the following section. Initial simulations were carried out to determine the stability of the model (i.e. the ability to produce similar results for multiple simulations). The Salmonella model required one million iterations for the output to stabilise, largely due to the complexity of the model. Running the models for these numbers of iterations resulted in an estimated mean probability of illness that varied by about ± 5%.
Sensitivity analysis
The relationship between input distributions and the probability of illness was determined to identify those input variables that had the greatest influence on the probability of illness. The output of sensitivity analyses is commonly presented as tornado graphs. Important variables identified are shown in Figure 3.8. The size of the bars shown in Figure 3.8 is representative of change in the probability of illness as a result of changes in the input variable. Bars to the right indicate that an increase in the variable results in an increased probability of illness, whilst bars to the left indicate that an increase in the input variable results in a decreased probability of illness.
Figure 3.8 Sensitivity analysis (regression) for input variables used to model the probability of salmonellosis from the consumption of chicken.
The probability of illness from consumption of poultry meat due to Salmonella contamination was most sensitive to the prevalence and level of Salmonella on carcasses at the end of processing. Growth of Salmonella during thawing and levels of adequate cooking (cooking that resulted in the complete inactivation of Salmonella cells) were also important factors. Factors that contribute to increased cross contamination i.e. not washing hands and using unwashed cutting boards for preparing other foods were positively correlated with the increased probability of disease. Some of the factors identified in Figure 3.8 have an unexpected relationship to the probability of illness, such as time frozen in the home, size of serving and summer thawing. This is likely the result of variability and uncertainty in the model. Given the low sensitivity (or regression coefficient) of these variables on the probability of illness, they can be considered to be not significant (based on the current model assumptions).
48
Decrease Increase
Prevalence
Concentration
Adequate cooking
Growth during thawing
Using boards for other foods
Not washing hands
Reduction due to freezing
Time frozen in home
Serving size
Summer thawing

Based on the outcome of the sensitivity analyses, input factors were selected to determine the magnitude of their impact on the number of predicted salmonellosis cases for an average year in Australia. The factors considered were prevalence and concentration (level) of Salmonella contamination at the end of processing, cross-contamination during preparation (not wash hands and using cutting boards for other foods) and thawing of frozen poultry (growth during thawing).
Multiple simulations were constructed with each scenario to evaluate the effect of changing a single factor. Scenarios considered were, (1) reducing the prevalence at the end of slaughter by 50 and 75%, (2) reducing the level of Salmonella on carcasses at the end of processing by 5 and 10-fold, (3) reducing the number of people not washing their hands after handling poultry and using cutting boards for other foods by 50 and 75% and (4) reducing the proportion of people incorrectly thawing frozen poultry by 50 and 75%. The impact of these scenarios on the possible number of salmonellosis cases is shown in Table 3.14.
49

Table 3.14 Effect of scenarios on the number of cases of salmonellosis predicted from consumption of chicken meat in Australia (Mean values for key factors are shown to highlight the changes made in each scenario).
Prevalence Level (log10) Hands not washed
Boards used for other foods Incorrect thawing Proportion
undercooked
Estimated reduction in cases of salmonellosis
(%)Baseline 5.3% 1.02 7% 11% 40% 10%
1 Lower prevalence (at end of processing)by 50% 2.7% 1.02 7% 11% 40% 10% 40%by 75% 1.3% 1.02 7% 11% 40% 10% 79%
2 Lower levels (at end of processing)by 5-fold 5.3% 0.19 7% 11% 40% 10% 68%by 10-fold 5.3% 0.10 7% 11% 40% 10% 74%
3 Reduced cross-contaminationby 50% 5.3% 1.02 4% 6% 40% 10% 16%by 75% 5.3% 1.02 2% 3% 40% 10% 24%
4 Better thawing practicesby 50% 5.3% 1.02 7% 11% 20% 10% 44%by 75% 5.3% 1.02 7% 11% 10% 10% 70%
5 Reduction in undercookingby 50% 5.3% 1.02 7% 11% 40% 5% 32%by 100% 5.3% 1.02 7% 11% 40% 0% 67%
50

As shown in Table 3.14, the outcome of the risk estimate is affected by factors within the model to different degrees. The risk from developing salmonellosis from consumption of poultry meat was shown to correlate closely to both the prevalence and level of Salmonella contamination at the end of poultry meat processing. The relationship between the prevalence at the end of processing and the final number of predicted cases of salmonellosis is almost linear, i.e. a 50% reduction of Salmonella prevalence in finished carcasses results in approximately 50% reduction in the estimated number of cases of salmonellosis per year.
The scenario analysis predicted that a 10-fold reduction in the level of Salmonella on poultry meat could lead to a 74% reduction in the number of salmonellosis resulting from consumption of poultry meat. Quantitative data of Australian poultry processing on the level of Salmonella on poultry meat, if available, will enable the above prediction to be validated. This highlights the importance of obtaining good quantitative data for these pathogens on Australian chickens after processing.
Wegener (2003) reported on results from a Danish program aimed at eradicating Salmonella from chicken flocks. Since 1988, positive chicken flocks have been slaughtered at the end of the day (logistic slaughtering). This coupled with programs rewarding farmers to produce Salmonella free chicken resulted in a reduction in Salmonella positive flocks from 65% in 1988-1989 to 5% in 2000. The incidence of human salmonellosis due to Salmonella Enteritidis in Denmark has reduced from approximately 2600 cases in 1998 to approximately 600 cases in 2004 according to Danish Gastroenteritis Monitor (http://www.ssi.dk/germ/sent.htm accessed 31/8/2005).
Thawing was an important risk factor of human salmonellosis from consumption of contaminated chicken meat as shown in Figure 3.8. The data used to calculate the likely growth during thawing was based on limited overseas data and may not reflect the actual conditions in Australia. It would be desirable to have data from Australian studies to determine the growth of Salmonella on chicken meat during thawing to determine the true effect of thawing on the final risk of salmonellosis.
While poor thawing is a risk factor for salmonellosis, freezing appears to be a control factor to reduce the extent of Salmonella contamination. To examine the effect of freezing more closely, a scenario was modelled in which all chicken meat (carcass and portions) leaving the processing facility is frozen. The model suggests that this could lead to an 83% reduction in the number of cases for Salmonella.
Undercooking was a greater risk factor for salmonellosis than for campylobacteriosis. This is probably due to the greater impact of cross-contamination on the likelihood of campylobacteriosis. Proper cooking did not eliminate the risk for salmonellosis, due to the effect of cross-contamination.
3.4.1 Uncertainty and Variability
The stochastic models describe the uncertainty and variability associated with input variables. Not all important factors may have been identified in this model, as such not all uncertainty and variability may have been captured. The effect of uncertainty and variability is to make the estimate of the number of salmonellosis cases less sure. Uncertainty reflects what we don’t know about a system or process, while variability is a measure of the natural variability inherent in all systems.
The level of Salmonella on poultry carcasses at the end of processing has a significant influence on the final probability of predicted number of salmonellosis cases. The level of Salmonella on poultry carcasses is highly variable, and is associated with a high level of uncertainty.
Uncertainty can be minimised by gathering more data while variability can only be changed by modifying the modelling system itself. From a modelling point of view, uncertainty in the level of Salmonella contamination can be reduced by gathering quantitative data at the end of poultry processing and at various stages throughout poultry processing.
51

The behaviour of consumers in domestic kitchen is an example of variability. While there is some uncertainty associated with the measurement of this consumer behaviour it is intrinsically variable. Gathering more information will not change this variability. The variability can only be affected by changing the process i.e. educating consumers about better practices that may result in fewer failures in the kitchen and therefore reduce the amount of variability.
Clearly in the current model there are a large number of input variables with different degrees of uncertainty and variability. The challenge is to target those variables that affect the final risk the most.
ReferencesACMF (1996) Report on poultry. Advisory Committee on the Microbiological Safety of Food; HMSO, London.
ACMF (2003) National biosecurity manual for meat chicken farming. Australian Chicken Meat Federation, Sydney, Australia.
Adak, G.K., Long, S.M. and O'Brien, S.J. (2002) Trends in indigenous food-borne disease and deaths, England and Wales: 1992 to 2000. Gut 51(6):832-841.
Anon. (2003) Foodborne disease in Australia: incidence, notifications and outbreaks. Annual report of the OzFoodNet network, 2002. Commun Dis Intell. 27(2):209-243.
Arumugaswamy, R.K., Rusul, G., Hamid, S.N.A. and Cheah, C.T. (1995) Prevalence of Salmonella in raw and cooked foods in Malaysia. Food Microbiology 12(1):3-8.
Ashbolt, R., Givney, R., Gregory, J.E., Hall, G., Hundy, R., Kirk, M., McKay, I., Meuleners, L., Millard, G., Raupach, J., Roche, P., Prasopa-Plaizier, N., Sama, M.K., Stafford, R., Tomaska, N., Unicomb, L. and Williams, C. (2002) Enhancing food-borne disease surveillance across Australia in 2001: the OzFoodNet Working Group. Commun Dis Intell. 26(3):375-406.
Bailey, J.S., Cox, N.A., Craven, S.E. and Cosby, D.E. (2002) Serotype tracking of Salmonella through integrated broiler chicken operations. J Food Prot 65(5):742-745.
Bailey, J.S., Stern, N.J., Fedorka-Cray, P., Craven, S.E., Cox, N.A., Cosby, D.E., Ladely, S. and Musgrove, M.T. (2001) Sources and movement of Salmonella through integrated poultry operations: a multistate epidemiological investigation. J Food Prot. 64(11):1690-1697.
Beli, E., Telo, A. and Duraku, E. (2001) Salmonella serotypes isolated from turkey meat in Albania. Int J Food Microbiol 63(1-2):165-167.
Bell, C. and Kyriakides, A. (2002) Salmonella: a practical approach to the organism and its control in foods. Blackwell Science, Oxford, UK,
Blumer, C., Roche, P., Spencer, J., Lin, M., Milton, A., Bunn, C., Gidding, H., Kaldor, J., Kirk, M., Hall, R., Della-Porta, T., Leader, R. and Wright, P. (2003) Australia's notifiable diseases status, 2001: annual report of the National Notifiable Diseases Surveillance System. Commun Dis Intell. 27(1):1-78.
Brenner, F.W., Villar, R.G., Angulo, F.J., Tauxe, R. and Swaminathan, B. (2000) Salmonella nomenclature. J Clin Microbiol 38(7):2465-2467.
Brockmann, S.O., Piechotowski, I. and Kimmig, P. (2004) Salmonella in sesame seed products. J Food Prot. 67(1):178-180.
Bryan, F.L. and Doyle, M.P. (1995) Health risks and consequences of Salmonella and Campylobacter jejuni in raw poultry. J Food Prot. 58(3):326-344.
Buhr, R., Hinton, A. and Ingram, K. (2002) Carcass Salmonella and Campylobacter contamination resulting from crop content: Spillage during evisceration can be removed by carcass washing. Southern Poultry Science Society Meeting. Accessed on 11 August 2002.
Carli, K.T., Eyigor, A. and Caner, V. (2001) Prevalence of Salmonella serovars in chickens in Turkey. J Food Prot. 64(11):1832-1835.
CFIA (2000) Canadian microbiological baseline survey of chicken broiler and young turkey carcasses, June 1997 - May 1998. Canadian Food Inspection Agency, Canada.
52

Chen, S.J., Lee, T.E., Wang, E.M., Cho, T.J. and Wang, C.H. (2002) Monitoring the hygiene of chicken hatcheries in Taiwan during 1999-2001. J Microbiol Immunol Infect 35(4):236-242.
Cogan, T.A. and Humphrey, T.J. (2003) The rise and fall of Salmonella Enteritidis in the UK. J Appl Microbiol 94 Suppl:114S-119S.
Cory, J.E.L., Allen, V.M., Hudson, W.R., Breslin, M.F. and Davies, R.H. (2002) Sources of Salmonella on broiler carcasses during transportation and processing: modes of contamination and methods for control. J Appl Microbiol 92:424-432.
Crerar, S.K., Nicholls, T.J. and Barton, M.D. (1999) Multi-resistant Salmonella Typhimurium DT104--implications for animal industries and the veterinary profession. Aust Vet J 77(3):170-171.
Crump, J.A., Griffin, P.M. and Angulo, F.J. (2002) Bacterial contamination of animal feed and its relationship to human food-borne illness. Clin Infect Dis 35(7):859-865.
D'Aoust, J.Y. (1997) Salmonella species. In: Doyle, M.P., Beuchat, L.R., and Montville, T.J. eds. Food Microbiology: fundamentals and frontiers. ASM Press, Washington DC, USA, pp129-158.
Davies, R.H. and Wray, C. (1997) Distribution of Salmonella contamination in ten animal feedmills. Vet Microbiol 57(2-3):159-169.
Dominguez, C., Gomez, I. and Zumalacarregui, J. (2002) Prevalence of Salmonella and Campylobacter in retail chicken meat in Spain. Int J Food Microbiol 72(1-2):165-168.
Duffy, G., Cloak, O.M., O'Sullivan, M.G., Guillet, A., Sheridan, J.J., Blair, I.S. and McDowell, D.A. (1999) The incidence and antibiotic resistance profiles of Salmonella spp. on Irish retail meat products. Food Microbiology 16(6):623-631.
FAO/WHO (2002) Risk Assessments of Salmonella in eggs and broiler chickens. Food and Agriculture Organization/World Health Organization, Geneva, Switzerland. ftp://ftp.fao.org/docrep/fao/005/y4392e/y4392e00.pdf.
FDA (2001) FDA survey of imported fresh produce. U.S. Food and Drug Administration, USA.
FSA (2001) UK-wide survey of Salmonella and Campylobacter contamination of fresh and frozen chicken on retail sale. Food Standards Agency, London, UK.
FSA (2004) Report on the survey of Salmonella contamination of UK produced shell eggs retail sale. Food Standards Agency, London, UK.
FSIS (1996) Nationwide broiler chicken microbiological bastline data collection program, July 1994 - June 1995. Food Safety Inspection Service, United States Department of Agriculture, USA.
FSIS (1998) Nationwide young turkey microbiological baseline data collection program, August 1996 - July 1997. Food Safety Inspection Service, United States Department of Agriculture, USA.
Gerba, C.P., Rose, J.B. and Haas, C.N. (1996) Sensitive populations: who is at the greatest risk? Int J Food Microbiol 30(1-2):113-123.
Guard-Petter, J. (2001) The chicken, the egg and Salmonella enteritidis. Environ.Microbiol 3(7):421-430.
Hald, T., Vose, D., Wegener, H.C. and Koupeev, T. (2004) A Bayesian approach to quantify the contribution of animal-food sources to human salmonellosis. Risk Anal. 24(1):255-269.
Harrington, C.S., Lanser, J.A., Manning, P.A. and Murray, C.J. (1991) Epidemiology of Salmonella sofia in Australia. Appl Environ.Microbiol 57(1):223-227.
Harrison, W.A., Griffith, C.J., Tennant, D. and Peters, A.C. (2001) Incidence of Campylobacter and Salmonella isolated from retail chicken and associated packaging in South Wales. Lett Appl Microbiol 33(6):450-454.
Helms, M., Vastrup, P., Gerner-Smidt, P. and Molbak, K. (2003) Short and long term mortality associated with foodborne bacterial gastrointestinal infections: registry based study. BMJ 326(7385):357.
Heres, L., Engel, B., Urlings, H.A., Wagenaar, J.A. and van Knapen, F. (2004) Effect of acidified feed on susceptibility of broiler chickens to intestinal infection by Campylobacter and Salmonella. Vet Microbiol 99(3-4):259-267.
Herman, L., Heyndrickx, M., Grijspeerdt, K., Vandekerchove, D., Rollier, I. and De Zutter, L. (2003) Routes for Campylobacter contamination of poultry meat: epidemiological study from hatchery to slaughterhouse. Epidemiol Infect 131(3):1169-1180.
53

Heuzenroeder, M.W., Murray, C.J., Dalcin, R.M. and Barton, M. (2001) Molecular basis of benign colonisation of Salmonella Sofia in Chickens. Rural Industries Research and Development Corporation, Barton, ACT.
Heyndrickx, M., Vandekerchove, D., Herman, L., Rollier, I., Grijspeerdt, K. and De Zutter, L. (2002) Routes for salmonella contamination of poultry meat: epidemiological study from hatchery to slaughterhouse. Epidemiol Infect 129(2):253-265.
Hohmann, E.L. (2001) Nontyphoidal salmonellosis. Clin Infect Dis 32(2):263-269.
Humphrey, T.J. and Lanning, D.G. (1987) Salmonella and Campylobacter contamination of broiler chicken carcasses and scald tank water: the influence of water pH. J Appl Bacteriol. 63(1):21-25.
ICMSF. (1996) Salmonellae. In: Roberts, T.A., Baird-Parker, A.C., and Tompkin, R.B. eds. Microorganisms in foods 5: Microbiological specifications of food pathogens. First ed, Blackie Academic & Professional, London, UK, pp217-264.
Jay, S., Davos, D., Dundas, M., Frankish, E. and Lightfoot, D. (2003) Salmonella. In: Hocking, A.D. eds. Foodborne microorganisms of public health significance. 6 ed, Australian Institute of Food Science and Technology, NSW Branch, Food Microbiology Group, Waterloo, NSW, pp207-266.
Jay, S.L., Comar, D. and Govenlock, L.D. (1999) A video study of Australian domestic food handling practices. J Food Prot. 62(11):1285-1296.
Kimura, A.C., Reddy, V., Marcus, R., Cieslak, P.R., Mohle-Boetani, J.C., Kassenborg, H.D., Segler, S.D., Hardnett, F.P., Barrett, T. and Swerdlow, D.L. (2004) Chicken consumption is a newly identified risk factor for sporadic Salmonella enterica serotype Enteritidis infections in the United States: a case-control study in FoodNet sites. Clin Infect Dis 38 Suppl 3:S244-S252.
King, S. and Hornitzky, M. (2001) Second microbiological survey of primary poultry processors in New South Wales 2001. NSW Poultry Processing Consultative Committee of Safefood Production NSW, Sydney.
King, S., Hornitzky, M. and Sergeant, E. (2001) Microbiological baseline survey of primary poultry processors in New South Wales 1999. NSW Poultry Processing Consultative Committee of Safefood Production NSW, Sydney.
Lake, R., Hudson, A. and Cressey, P. (2002) Risk profile: Salmonella (non-typhoid) in poultry (whole and pieces). New Zealand Food Safety Authority, Christchurch, New Zealand.
Lammerding, A.M., Garcia, M.M., Mann, E.D., Robinson, M.Y., Doward, W.J., Truscott, R.B. and Tittiger, F. (1988) Prevalence of Salmonella and thermophilic Campylobacter in fresh pork, beef, veal and poultry in Canada. J Food Prot. 51:47-52.
Lillard, H.S. 1985. Bacterial cell characteristics and conditions influencing their adhesion to poultry skin. J. Food Prot. 98:803-807.
Mann, E.D. and McNabb, G.D. (1984) Prevalence of Salmonella contamination in market-ready geese in Manitoba. Avian Dis 28(4):978-983.
McCullough, N. and Eisele.C.W. (1951) Experimental human salmonellosis. IV. Pathogenicity of strains of Salmonella pullorum obtained from spray-dried whole egg. J Infect Dis 89(3):259-265.
McCullough, N. and Eisele.C.W. (1951) Experimental human salmonellosis. III. Pathogenicity of strains of Salmonella newport, Salmonella derby, and Salmonella bareilly obtained from spray-dried whole egg. J Infect Dis 89(3):209-213.
McCullough, N. and Eisele.C.W. (1951) Experimental human salmonellosis. I. Pathogenicity of strains of Salmonella meleagridis and Salmonella anatum obtained from spray-dried whole egg. J Infect Dis 88(3):278-289.
McCullough, N. and Eisele.C.W. (1951) Experimental human salmonellosis. II. Immunity studies following experimental illness with Salmonella meleagridis and Salmonella anatum. J Immunol. 66(5):595-608.
Mead, P.S., Slutsker, L., Dietz, V., McCaig, L.F., Bresee, J.S., Shapiro, C., Griffin, P.M. and Tauxe, R.V. (1999) Food-related illness and death in the United States. Emerg.Infect Dis 5(5):607-625.
Millard, G. and Rockliff, S. (2000) Microbiological status of raw chilled chicken, July 1999 - August 2000. ACT Health Protection Service, Canberra, ACT.
National Enteric Pathogens Surviellance Scheme (2002) Human anual report 2001. University of Melbourne, Melbourne, Australia.
54

Neumeyer, K., Ross, T. and McMeekin, T.A. (1997) Development of a predictive model to describe the effects of temperature and water activity on the growth of spoilage pseudomonads. Int J Food Microbiol 38(1):45-54.
O'Donnell, E.T. (1995) The incidence of Salmonella and Listeria in raw milk from farm bulk tanks in England and Wales. Journal of the Society of Dairy Technology 18:25-29.
Olsen, S.J., Bishop, R., Brenner, F.W., Roels, T.H., Bean, N., Tauxe, R.V. and Slutsker, L. (2001) The changing epidemiology of salmonella: trends in serotypes isolated from humans in the United States, 1987-1997. J Infect Dis 183(5):753-761.
OzFoodNet. (2004) Foodborne disease investigations across Australia: Annual report of the OzFoodNet network, 2003. Commun Dis Intell. 28(3):359-389.
Phillips, D., Sumner, J., Alexander, J.F. and Dutton, K.M. (2001) Microbiological quality of Australian beef. J Food Prot. 64(5):692-696.
Phillips, D., Sumner, J., Alexander, J.F. and Dutton, K.M. (2001) Microbiological quality of Australian sheep meat. J Food Prot. 64(5):697-700.
Plummer, R.A.S., Blissett, S.J. and Dodd, C.E.R. (1995) Salmonella contamination of retail chicken products sold in the UK. Journal of Food Protection 58(8):-846.
Roberts, D. (1991) Salmonella in chilled and frozen chicken. Lancet 337(8747):984-985.
Roche, P., Spencer, J., Lin, M., Gidding, H., Kirk, M., Eyeson-Annan, M., Milton, A., Witteveen, D. and Merianos, A. (2001) Australia's notifiable diseases status, 1999: annual report of the National Notifiable Diseases Surveillance System. Commun Dis Intell. 25(4):190-245.
Rose, N., Beaudeau, F., Drouin, P., Toux, J.Y., Rose, V. and Colin, P. (1999) Risk factors for Salmonella enterica subsp. enterica contamination in French broiler-chicken flocks at the end of the rearing period. Prev Vet Med 39(4):265-277.
Ross, I.L., Willmore, R. and Heuzenroeder, M.W. (2003) A fluorescent amplified fragment length polymorphism study of Salmonella enterica serovar Sofia, the major Salmonella serovar isolated from chickens in Australia. Int J Med Microbiol 293(5):371-375.
Russell, S.M. (2005) Intervention strategies for reducing Salmonella prevalence of ready-to-cook chicken. University of Georgia College of Agricultural and Environmental Sciences.
Sagoo, S.K., Little, C.L., Ward, L., Gillespie, I.A. and Mitchell, R.T. (2003) Microbiological study of ready-to-eat salad vegetables from retail establishments uncovers a national outbreak of salmonellosis. J Food Prot. 66(3):403-409.
Slater, J., G. Domingue, F. Jorgensen, K. McAlpine, R.J. Owen, F.J. Bolton & T.J. Humphrey (2002) Impact of transport crate reuse and of catching and processing on Campylobacter and Salmonella contamination of broiler chickens. Applied and Environmental Microbiology, 68(2):713-719
Smith, D., Northcutt, J. and Musgrove, M. (2004) Effect of commercial inside-outside bird washer (IOBW) on Campylobacter, Salmonella, E. coli and aerobic plate counts (APC) of uncontaminated, contaminated and cross-contaminated broiler carcasses. Poultry Science 83(Suppl. 1):155.
Soriano, J.M., Rico, H., Molto, J.C. and Manes, J. (2001) Incidence of microbial flora in lettuce, meat and Spanish potato omelette from restaurants. Food Microbiology 18(2):159-163.
Sumner, J., Raven, G., Dean, P., Dowsett, P., Petrenas, E., Weiring, R., West, G., Lillie, M., Holds, G. and Pointon, A. (2004) A microbiolgoical profile of poultry processed in South Australia. Food Australia 56(7):335-340.
Uyttendaele, M., De Troy, P. and Debevere, J. (1999) Incidence of Salmonella, Campylobacter jejuni, Campylobacter coli, and Listeria monocytogenes in poultry carcasses and different types of poultry products for sale on the Belgian retail market. J Food Prot. 62(7):735-740.
Wedderkopp, A., Gradel, K.O., Jorgensen, J.C. and Madsen, M. (2001) Pre-harvest surveillance of Campylobacter and Salmonella in Danish broiler flocks: a 2-year study. Int J Food Microbiol 68(1-2):53-59.
Wegener, H.C., Hald, T., Lo Fo, W.D., Madsen, M., Korsgaard, H., Bager, F., Gerner-Smidt, P. and Molbak, K. (2003) Salmonella control programs in Denmark. Emerg Infect Dis 9(7):774-780.
55

White, D.G., Zhao, S., Sudler, R., Ayers, S., Friedman, S., Chen, S., McDermott, P.F., McDermott, S., Wagner, D.D. and Meng, J. (2001) The isolation of antibiotic-resistant salmonella from retail ground meats. N.Engl.J Med 345(16):1147-1154.
Yohannes, K., Roche, P., Blumer, C., Spencer, J., Milton, A., Bunn, C., Gidding, H., Kirk, M. and Della-Porta, T. (2004) Australia's notifiable diseases status, 2002: Annual report of the National Notifiable Diseases Surveillance System. Commun Dis Intell. 28(1):6-68.
Zhao, C., Ge, B., De Villena, J., Sudler, R., Yeh, E., Zhao, S., White, D.G., Wagner, D. and Meng, J. (2001) Prevalence of Campylobacter spp., Escherichia coli, and Salmonella serovars in retail chicken, turkey, pork, and beef from the Greater Washington, D.C., area. Appl Environ.Microbiol 67(12):5431-5436.
4 Risk Assessment – Campylobacter spp.
4.1 Hazard Identification
Campylobacters are classified under Campylobacteraceae, a bacterial family comprised of genera Campylobacter, Arcobacter and Sulfurospirillum (Vandamme, 2000). Campylobacters are Gram-negative, spiral or curved rod-shaped, non-spore forming bacteria. Most Campylobacter species are motile, and possess a single flagellum at one or both poles. A majority of Campylobacters are microaerophilic.
Campylobacter transmission to humans occurs primarily through food consumption. For example, consumption of unpasteurised milk, non-chlorinated water or undercooked poultry meat can lead to campylobacteriosis. Campylobacters may also be transmitted from animals to humans hence they are considered zoonoses.
Among the 16 species and six subspecies of Campylobacter, two are most commonly isolated from stool samples of human gastroenteritis (campynet26; Vandamme 2000). They are Campylobacter jejuni subspecies jejuni (C. jejuni) and Campylobacter coli (C. coli). C. jejuni accounts for approximately 95% of Campylobacter caused human gastroenteritis, and C. coli is responsible for approximately 3-4% of the human illness. Other species causing human gastroenteritis include C. lari, C. upsaliensis and others. All these species share a common feature, the ability to grow at 42 oC. As such, these pathogenic Campylobacter species are collectively referred as thermophilic Campylobacters.
Campylobacter jejuni is an emerging microbial pathogen, along with enterohaemorrhagic Escherichia coli, Listeria and Salmonella, causing food poisoning in developed countries27 (IFT, 2000; WHO, 2000). Epidemiological surveillance data indicate that Campylobacters are responsible for the majority of gastroenteritis cases in countries such as Australia (Blumer et al., 2003 and Figure 1), the United Kingdom28, the United States (Mead et al., 1999) and globally (WHO, 2000).
Microorganisms in the genus Arcobacter are closely related to those of Campylobacter, but are more aerotolerant29 and have a lower optimal temperature for growth than Campylobacter. Largely due to insufficient surveillance data on Arcobacter, risk assessment of arcobacters pathogenic to humans found in poultry meat is limited to hazard identification
Arcobacters were formerly known as ‘aerotolerant Campylobacters’ or campylobacter-like organisms. The Arcobacter genus is classified under the family of Campylobacteraceae. There are three recognised species that have been recovered from humans and animals: A. butzleri, A. cryaerophilus
26 http://campynet.vetinst.dk/ accessed 05 May 2004.27 In developing countries, the rate of Campylobacter infection for children is significantly higher than those found in
adults. It is considered that the high level of exposure and infection early in life in developing countries in turn induces high levels of immunity early in life. (Oberhelman & Taylor, 2000).
28 Food Standards Agency strategy for the control of Campylobacter in chicken. http://www.foodstandards.gov.uk/multimedia/pdfs/campyloconsult0603e.pdf accessed 02 July 2004
29 Not as sensitive to the presence of oxygen as Campylobacter
56

and A. skirrowii. The fourth species, A. nitrogigilis requires a high salt concentration for optimal growth, and has been isolated from roots and rhizosphere of salt march plants where they fix nitrogen.
57

Arcobacter cells are slender, spirally curved rods, 0.2-0.9 m wide and 0.5-3 m long. They are motile with a single flagellum attached to one or both end of the cell. Different from Campylobacters, arcobacters are able to grow under aerobic and anaerobic conditions and at 15°C (Vandamme, 2000, Lastovia and Skirrow, 2000).
A. butzleri is the most commonly reported Arcobacter pathogenic to humans, and is possibly transferred via contaminated water and food (Wesley 1996, Wesley and Baetz, 1999). The species is associated with enteritis, abdominal cramps, bacteraemia, and appendicitis in humans, and with enteritis and abortion in animals. A. butzleri had been isolated from human blood and diarrhoeic faeces, from faeces of animals and birds including pigs, horses, cattle, ostriches, tortoises; from various food products including ground pork, chicken and turkey samples; and from surface water and drinking-water reservoirs (Vandamme, 2000). The association of A. butzleri with enteritis in humans, and its recovery from chickens, turkeys, and ducks indicate a possible association of this species with poultry meat (Rivas et al., 2004; Wesley, 1996). The analysis of 1906 stool samples collected over a period of a period of 8 years in Belgium (Vandenberg et al., 2004) found A. butzleri was the fourth most common Campylobacter and Campylobacter-like organisms isolated from stool specimens. A. butzleri display similar microbiological and clinical features as C. jejuni and more frequently associated with persistent and watery diarrhoea but less associated with bloody diarrhoea.
A. skirrowii has been isolated from chicken carcasses and is more haemolytic than A. butzleri according to Atabay et al., (1998). In addition, A. skirrowii has also been isolated from bovine, ovine and porcine aborted foetuses, and from diarrhoeic faeces of various animals including sheep (Vandamme, 2000).
A. cryaerophilus has been isolated from cases of human bacteraemia and diarrhoea; from chicken carcasses; from bovine, ovine and porcine aborted foetuses; from porcine faeces; and from cattle with mastitis (Vandamme, 2000). Its pathogenicity to humans is not known.
4.1.1 Growth and Survival
Campylobacters require microaerophilic conditions for growth although different degrees of oxygen tolerance (3-5%) exist among different species (Forsythe, 2000). Most Campylobacter strains do not grow in the presence of air. For optimal growth, Campylobacters require microaerophilic condition with 5% oxygen and 2-10% carbon dioxide (Park, 2002; CFSAN30). Some species grow under anaerobic conditions with fumarate, formate and fumarate, or fumarate and hydrogen in the culture medium (Vandamme, 2000; Smibert, 1984).
Both C. jejuni and C. coli grow optimally at 42°C. C. jejuni can grow in the temperature range of 30-45°C, in the pH range of 4.9-9.5 and at a water activity above 0.990. At 32°C, C. jejuni may double its biomass in approximately 6 hours (Forsythe, 2000). Campylobacters generally do not multiply at temperatures below 30°C. According to Park (2002), the lack of growth of C. jejuni at temperatures below 30C is due to its inability to produce cold shock protein as suggested by the genomic sequence of C. jejuni (Parkhill et al., 2000). Cold shock proteins are characteristic of many bacteria that are able to replicate at temperatures well below the optimum growth temperature.
Although considered thermotolerant, Campylobacters are sensitive to temperatures above their optimal growth range and are readily inactivated by pasteurisation treatment and domestic cooking process. For example, cooking at 55-60°C for several minutes readily destroys Campylobacters. The D value for C. jejuni at 50°C is 0.88-1.63 minutes (Forsythe, 2000). While C. jejuni does not grow below 30°C, it remains metabolically active, is able to generate ATP, and is motile at temperatures as low as 4°C (Park, 2002).
30 Centre for Food Safety and Applied Nutrition, US Food & Drug Administration. http://www.cfsan.fda.gov/~mow/chap4.html Accessed 02 April 2004.
58

Freezing of poultry carcasses has been shown to inactivate Campylobacter spp. Zhao et al. (2003) reported that 72 hours exposure at -20°C and -30°C resulted in a 1.3 log10 and 1.8 log10 CFU/g reduction of Campylobacters on the surface of poultry meat, respectively, however, frozen storage at -86°C or refrigeration at (5°C) had a negligible effect. Bhaduri and Cottrell (2004) observed a 1.38-3.39 log10 CFU/g reduction of C. jejuni on chicken skin after a 2-week period of frozen storage. However, little reduction of Campylobacter numbers was observed during rapid chilling of poultry meat down to -3°C with cold air at –20 to – 40°C on fresh poultry products (Zhao et al., 2003). On the other hand, residual Campylobacter cells may remain viable even after extended period of storage at frozen state (Zhao et al., 2003).
Other than temperature, a range of other environmental factors including desiccation, oxidation, and osmotic stress influences the survival of Campylobacters.
Campylobacters are highly sensitive to desiccation and do not survive well on dry surfaces (Fernandez et al., 1985). The microaerophilic nature of these organisms means they are inherently sensitive to oxygen and its reduction substances. Presence of superoxidase dismutase in Campylobacters, however, provides a level of defence for the organism to survive under moderate oxidative stress (Park, 2002).
Campylobacters are much less tolerant to osmotic stress than a number of other food-borne pathogenic bacteria. For example, Campylobacters are not capable of multiplication in an environment where sodium chloride concentration is 2% or higher (Doyle and Roman, 1982a). In contrast, Salmonella Typhimurium and Listeria monocytogenes are capable of growth at 4.5% and 10% sodium chloride respectively (ICMSF, 1996). An analysis of the genome sequence indicates that C. jejuni does not possess known high affinity transporters for known compatible solutes, nor the capacity to synthesise compatible solutes such as trehalose and betaine under osmotic stress (Park, 2002).
Due to their sensitive nature to environmental conditions, and inability of growth under aerobic conditions or at temperatures below 30°C, the ability of Campylobacters to multiply outside of an animal host is severely limited. Unlike most other bacterial food-borne pathogens, Campylobacters are not normally capable of multiplication in food during either processing or storage (Park, 2002).
4.1.2 Reservoirs of Campylobacters
Campylobacters are widely distributed in food animals including poultry, pigs, cattle, sheep and shellfish, as well as in domestic dogs and cats. C. jejuni and C. coli are found in the intestinal tract of young cattle, sheep, goats, dogs, rabbits, monkeys, cats, chickens, turkeys, ducks, seagulls, pigeons, blackbirds, starlings and sparrows (Smibert, 1984), pigs (Nielsen et al., 1997), and in blood and faecal material of humans with enteritis.
Campylobacters can also be found in the reproductive organs and oral cavity of infected humans and animals31. Healthy puppies and kittens, rodents, beetles and houseflies may also carry Campylobacters (Hartnett, et al., 2002). C. jejuni is the predominant species associated with poultry, whereas C. coli is the predominant species found in pigs (Hartnett et al., 2002).
C. lari can cause human gastroenteritis and septicaemia, and has been found in chickens and seagulls, shellfish, fresh and sea water. C. upsaliensis has not yet been identified in food animals but is a common inhabitant of dogs and cats32.
Campylobacters are introduced into water by sewage and faeces from wild animals and birds. Bolton et al., (1987) and Baker et al., (2002) demonstrated that campylobacter prevalence in surface water; rivers and lakes could be up to 55%, and up to 45% in sand samples from bathing beaches.
31 http://campynet.vetinst.dk/ accessed 05 May 2004.32 http://campynet.vetinst.dk/ accessed 05 May 2004.
59

Frequency of isolation of Campylobacters from water is lower in warmer summer months (Carter et al., 1987, Baker et al., 2002), reflecting a lower survival rate at higher temperatures and under strong daylight. For example, C. jejuni survived only 4 days in water at 25°C, and more than 4 weeks at 4°C (Blaser et al., 1980), and Campylobacter has been found to survive for 24 hours in seawater in darkness and for only 30-60 min in daylight (Jones et al., 1990).
4.1.3 Competitiveness in invasion
Mobility and adhesion
Research observations suggest that the unique spiral cell shape together with the rapid darting corkscrew-like mobility of Campylobacters enable them to reach, penetrate and remain mobile in the highly viscous intestinal mucous layer of poultry species. In such an environment, other motile rod-shaped bacteria are quickly incapacitated. Invasion is assisted by chemotactic mechanisms, which attract Campylobacters to mucin and more specifically fucose - a constituent of mucin, present in the poultry intestinal mucus (Walker et al., 1986, Hugdahl et al., 1988 and Park, 2002). There is evidence to indicate that adhesion and colonisation of C. jejuni to poultry intestinal mucus are mediated by an outer membrane protein (CadF) of C. jejuni, which binds to fibronectin, a component of the surface cell of poultry intestinal mucous layer (Ziprin et al., 1999).
Adaptation to the host environment
The optimum growth temperature of 42°C and the requirement for a microaerophilic environment (3-5% oxygen) are considered evolved physiological features of Campylobacters, which assist in colonising the poultry intestinal mucous layer (a restricted ecological niche). While the temperature of many mammalian intestines is 37°C, the temperature of poultry intestines is 42°C. With the oxygen concentration in the highly viscous mucous layer of poultry intestine lower than that in the air (Park 2002), this environment favours the colonisation of Campylobacters.
Another mechanism considered important in the colonisation of poultry intestinal mucus, is the ability of Campylobacters to scavenge iron. Iron is an essential nutrient to Campylobacters (Pickett et al., 1992). There is evidence to suggest that the organisms are able to utilise the host-derived iron compounds haemin and haemoglobin, and possess transport systems to take up siderophores, such as enterochelin, synthesised by other gastrointestinal microorganisms (Baig et al., 1986, Richardson and Park, 1995).
4.1.4 Viable but non-culturable cells of Campylobacters
A debate among Campylobacter researchers is the validity of the presence of viable nonculturable cells (VNC, or viable but nonculturable cells, VBNC) of campylobacter. Those who support the concept consider that VNC are formed under unfavourable environmental conditions, where Campylobacters enter a nonculturable stage i.e. viable cells cannot be detected by a routine culture method. Because VNC are viable Campylobacter cells, they may play a role in human campylobacteriosis (Rollins and Colwell, 1986). Tholozan et al., (1999), however, suggests that not all Campylobacter strains have the ability to from VNC. Recently Chaveerach et al. (2003) demonstrated recovery of VNC of strains of C. jejuni and C. coli after exposure to acidic conditions (pH 4.0) in specific-pathogen-free (SPF) fertilised eggs but not in resuscitation medium. A similar observation was made by Cappelier et al. (1999) for the recovery of VNC C. jejuni cells induced on sterile surface water at pH 6.0.
If the VNC state is shown to exist, isolation rates from food may under-represent the actual prevalence and levels of Campylobacter.
60

4.1.5 Symptoms caused by pathogenic Campylobacters
Both C. jejuni and C. coli cause fever and enteritis in humans. Symptoms of Campylobacter enteritis include acute inflammatory diarrhoea with clinical signs similar to those of other acute bacterial infections of the intestinal tract, such as salmonellosis or shigellosis. Detecting Campylobacter organisms in the faeces is the only way to confirm the diagnosis.
Principal symptoms caused by Campylobacters are diarrhoea, abdominal pain, fever, myalgia, headache, vomiting and blood in faeces with approximate mean frequencies of 84%, 79%, 50%, 42%, 41%, 15% and 15% respectively (Lastovia and Skirrow, 2000). Nausea is also a common symptom. An Australian multi-centre case control study identified the following symptoms (Table 4.1).
Table 4.1: Clinical symptoms of Campylobacter infection33
Symptoms Percentage (Cases = 881)
Diarrhoea 100
Stomach cramps 88
Fever 72
Nausea 70
Muscle/body aches 66
Headache 63
Vomiting 35
Blood in stool 34
The mean incubation period of Campylobacter spp. is approximately 3.2 days with a range of 18 hours to 8 days. A particular feature of Campylobacter infection is abdominal pain, which may become continuous and sufficiently intense to mimic acute appendicitis. This is the most frequent reason for admission of Campylobacter enteritis patients to hospital (Skirrow and Blaser, 2000).
According to Skirrow and Blaser (2000), approximately 5-10% of people who develop Campylobacter enteritis are admitted to hospital. This figure is similar to the estimation of FoodNet (13.2%)34. An Australian study suggests that approximately 13.3% of Campylobacter enteritis patients are hospitalised, and remained in hospital for 3 nights per person (median). The study also indicates that 84% of people developing Campylobacter enteritis miss 5 days per person (median) from work/school/recreational/holiday activities (Hall, 2003; Stafford35).
Diarrhoea associated with Campylobacter infection usually lasts for several days. A survey of sporadic cases in Norway recorded a mean duration of 3.8 days absence from work and school and 14.6 days for the presence of symptoms (Kapperud et al., 1992). The abdominal pain may persist for several more days. Relapses are reported in 15-25% of patients presented to physicians. Excretion of Campylobacters in patients’ faeces may be observed for several weeks whereas long-term carriage of Campylobacters is found with patients with immune deficiencies, notably in patients with AIDS and hypogammaglobulinemia (Skirrow and Blaser, 2000).
Other than C. jejuni and C. coli, C. fetus subsp. fetus has been found in cases of human diarrhoea, septicaemia, abortion and meningitis. C. hyointestinalis subsp. hyointestinalis, C. lari, C. concisus, C. jejuni subsp. doylei have been found in association with human enteritis. C. fetus subsp. venerealis, C. hyointestinalis subsp. hyointestinalis, C. lari, C. consisus and C. jejuni subsp. doylei have been found in association with human septicaemia (Lastovica and Skirrow, 2000).
33 Personal communication (Russell Stafford, July 2004)34 http://www.cdc.gov/foodnet/annual/2002/2002executive_summary.pdf accessed 7 July 200435 Personal communication (Russell Stafford, July 2004)
61

C. upsalienesis has been isolated from cases of human diarrhoea, septicaemia, spontaneous abortion and haemolytic-uraemic syndrome. A number of Campylobacter species such as C. concisus, C. curvus, C. rectus, C. showae and C. sputorum occur in the human oral cavity, causing periodontal diseases36.
4.1.6 Incidence and outbreaks of campylobacteriosis
Although Campylobacters are the principal cause of food-borne illness in developed countries (Figures 4.1 and 4.2), they are low profile pathogens because most patients recover without treatment and large outbreaks of campylobacteriosis are rarely identified37.
Note: SLTEC = Shiga-like toxin-producing E. coli, and VTEC = verocytotoxin-producing E. coli.
Figure 4.1 Cases of selected notified infectious diseases (gastrointestinal) in Australia - 1999 (AIHW, 2002)38
Figure 4.2: Incidence of reported campylobacteriosis per 100,000 Australians39
36 http://campynet.vetinst.dk/ accessed 05 May 2004.37 http://www.fda.gov/fdac/features/1999/599_bug.html , accessed 07 July 200438 Australian Institute of Health and Welfare (2002). Australia’s Health 2002. Canberra: AIHW. ISBN 1740241916, ISSN
10326138. 39 National Notified Diseases Surveillance System http://www1.health.gov.au/cda/Source/CDA-index.cfm Accessed 05
July 2004. Data presented does not include the State of New South Wales where campylobacteriosis is not reported separately. Population for the year 2003 is based on the estimation of Australian Bureau of Statistics.
62
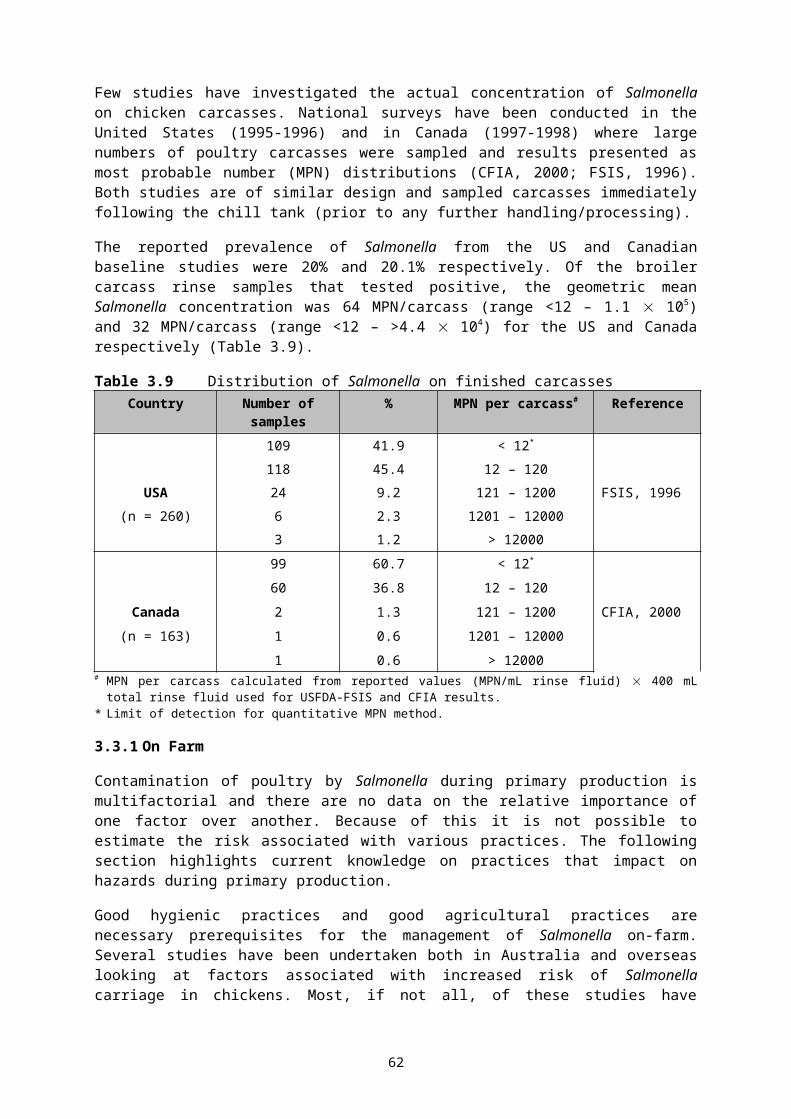
In the US, approximately 80% of all cases of campylobacteriosis are food-borne (Mead et al., 1999). Foodborne campylobacteriosis accounts for approximately 47% of all food-borne illnesses, some 29% of hospitalisations and about 8% of death resulting from food-borne illness caused by bacteria. Campylobacteriosis accounts for approximately 2-2.4 million cases of food-borne illness annually in the US (Mead et al., 1999, Friedman et al., 2000).
In Australia, the number of reported cases of campylobacteriosis in 2000, 2001 and 2002 was 107, 124 and 112 per 100,000 respectively (Figure 4.2). Applying these rates to the entire Australian population, the average number of passively reported campylobacteriosis cases over the three years would be 22,240 per year. This estimate represents campylobacteriosis resulting from all the possible transmission paths including food-borne, waterborne, contact with animals (including pets), visiting farms and others.
For the period 1991-2001, eleven food-borne outbreaks resulting from infection by Campylobacters were reported in Australia. Food vehicles and location of these reported outbreaks are listed in Table 4.2. A recent Australian investigation of an outbreak of campylobacteriosis during an international conference found chicken; spring rolls and fried rice were among the foods most highly linked to illness (Raupach and Hundy, 2003). Based on outbreak data the primary cause of food-borne campylobacteriosis in Australia is raw milk. Poultry (chicken) and salad consumption have also associated with Campylobacter outbreaks. Due to biases inherent with food-borne outbreak investigation and reporting, these data may not reflect the importance of specific food vehicles associated with sporadic campylobacteriosis cases.
Table 4.2: Reported outbreaks of Campylobacter enteritis in AustraliaYear Number ill Vehicle Location Reference
2001 10 Number of foods* Restaurant Raupach and Hundy, 2003
2001 3 Chicken kebabs Takeaway food premise NRVP
2000 Cluster Milk (raw) Farm – retail dairy Anonymous 2000a
2000 3 Chicken kebabs Takeaway food premise Anonymous 2000b^
2000 ~25 Milk (raw) Farm – school camp NRVP
1999 16 Unknown Caterer – function NRVP
1998 9 Milk or water Food caterer NRVP#
1997 171 Chicken, beef salad Food caterer – function NRVP
1996 40 Unknown Residential college Liddle, 1997
1995 78 Cucumber salad Catering facility – camp Kirk et al., 1997
1993 21 Milk (raw) Church caterer – camp Watson T. et al., 1993
1992 4 Milk (raw) Prison Bates et al., 1992Note: NRVP stands for Australian National Risk Validation Report, 2002* Most likely foods were a chicken dish, spring rolls and fried rice.# Clostridium perfringens was part of the cause of food-borne outbreak. ^ Campylobacter, Salmonella Virchow PT 34 and S. Typhimurium PT 64 were involved.
4.1.7 Seasonal variation
Incidence of campylobacteriosis in Australia is high in the warm months of the year. This pattern is similar in the US and Europe (Figure 4.3). As shown in Figure 4.4, high numbers of campylobacteriosis notifications are reported in the months of October, November and sometimes December. As Campylobacters are microaerophilic, growth outside of their animal hosts is unlikely even when the temperature is high in the summer period. Other factors associated with temperature change may contribute to the increased incidence of campylobacteriosis, such as increased use of barbecues and increased consumption of fresh salads when the day becomes warmer.
63

Hall et al. (2002) speculated that the seasonal peak of campylobacteriosis in the warm months leading to summer in Australia is likely a consequence of the behaviour of birds although it is not clear what exact behaviour the authors meant to say.
Unlike the peak notifications of campylobacteriosis observed in the US and Europe during the summer months of June, July and August, peak notifications in Australia are observed in late Spring to early Summer (October to December).
Figure 4.3 Cases of campylobacteriosis in selected areas in US (1998-2001) 40
Figure 4.4: Number of notifications of campylobacteriosis in Australia (1997-2003) 41
For the period of December to February, Australia registers its highest temperatures of the year, while the relative humidities are the lowest in many parts of Australia (other than Brisbane, Darwin and Sydney). In Victoria, the average relative humidity is 47-49% (Melbourne, 3 pm); in South Australia, the average relative humidity is 40-42% (Adelaide, 3 pm); in Western Australia, 42-46% (Perth, 3 pm), and in the ACT, 37% - 40% (3 pm), based on 30-year recordings (1961-1990) 42.
In recognising the fragile nature of C. jejuni to desiccation (Cox et al., 2001, Stanley et al., 1998, Doyle and Roman, 1982b), it is speculated that prevailing low humidity together with high temperatures lead to drying conditions that impact negatively on the survival of Campylobacters in the environment. This may partially explain a moderate decline of notified cases of campylobacteriosis in the summer months in Australia.
40 http://www.cdc.gov/foodnet/annuals.htm accessed 07 July 200441 January and February in 2002 and January, February and March in 2003 also recoded high numbers of
campylobacteriosis.42 Data obtained from Australian Bureau of Meteorology. http://www.bom.gov.au accessed 07 July 2004.
64

4.1.8 Transmission vehicles of Campylobacter infection
As indicated earlier, Campylobacter is found in a wide range of animals. In addition, Campylobacters can be transmitted via raw milk, unchlorinated water and through contact with farm animals and domestic pets (Brieseman, 1990, Centers for Disease Control and Prevention, 1991).
In ascertaining the vehicles transmitting Campylobacter, Friedmann et al., (2000) examined data from 111 outbreaks of Campylobacter enteritis that occurred in the period of 1978-1996. Other than unknown foods, milk and water were the main vehicles transmitting Campylobacters leading to food or waterborne campylobacteriosis (Table 4.3). Of four milk-borne outbreaks of campylobacteriosis in the period of 1990-1992, three were caused by raw milk and raw goat’s milk43. Meat on the other hand, accounts for approximately 6% of campylobacteriosis cases with poultry meat accounting for half of this figure i.e. 3% of the food vehicles.
Surveys in other developed countries, including the United Kingdom, Sweden, Germany, New Zealand, Denmark, the United States and Norway, indicate milk is the most frequent cause of food-borne Campylobacter infection. Although not the principal cause, undercooked poultry meat is identified as an important source of outbreaks. For example in Denmark, six of the seven outbreaks reported during 1993 and 1997 were associated with poultry meat (Friedmann et al., 2000).
Table 4.3: Vehicles for Campylobacter enteritis, United States, 1978-1996 (modified from Friedman et al., 2000).
Transmitting vehicles Proportion of 111 outbreaks of Campylobacter infection
Unknown food 38%
Milk 27%
Water (community and others) 11%
Multiple food 9%
Fruits 4%
Other foods 4%
Poultry meat (chicken and turkey) 3%
Other meat 2%
Beef 1%
Eggs 1%
Total 100%
Published information (WHO, 2000, Friedmann et al., 2000) suggests that major routes of Campylobacter transmission to humans are:
consumption of food contaminated by Campylobacters44;
consumption of water contaminated by Campylobacters;
bathing or swimming in a lake or pool that is contaminated by Campylobacters;
direct contact with farm animals, such as cattle, sheep, chicken, etc., and
contact with domestic animal, such as a pet dog, cattle, bird.
43 http://www2.cdc.gov/ncidod/foodborne/OutbreaksReport.asp accessed 9 July 2004.44 Including people to people cross contamination; such as food handlers contaminated by campylobacters could
contaminate the food prepared.
65

4.1.9 Cross contamination as a major route transmitting Campylobacters
There is strong epidemiological evidence confirming the transmission of Campylobacter from raw poultry meat or other raw meat to ready-to-eat food products such as salad or fruits via cross-contamination in retail and domestic food preparation. For example, an investigation of a prolonged outbreak of Campylobacteriosis at a training facility in South Australia suggested that salad (in particular, cucumber) was the carrier of Campylobacter, through cross-contamination with raw meat during preparation (Kirk et al., 1997).
Preparation of ready-to-eat foods, such as vegetables or fruit salads, using the same cutting board and/or knife that has been previously used to cut raw meat and not properly cleaned presents the highest chance of Campylobacter cross-contamination (Dawkins et al., 1984, Kirk et al., 1997, Gorman et al., 2002, Redmond and Griffith 2003). The food handler also represents a potential source of cross-contamination if their hands are not adequately washed between handling raw and cooked food. Dawkins et al. (1984) indicated cleaning surfaces or equipment with detergent and hot water and drying appears to be sufficient to remove and/or inactivate Campylobacter organisms.
The ACT Health conducted a cooked/raw handling survey of delicatessen products in 1997 45 where raw chicken and a range of cooked ready-to-eat meat were used in the survey. Although the survey did not test Campylobacter, it had standard plate count, E. coli, coagulase positive staphylococci, Salmonella and Listeria monocytogenes. The survey found 42% of the food premises visited had poor food handling practices, including:
use of bare fingers from raw to cooked food product,
use of same disposable gloves from raw to cooked food product, and
use of same tongs from raw to cooked food products (12%).
4.1.10 Risk factors
Campylobacter infection is a result of oral ingestion of Campylobacter through food or water or via direct contact with animals. Risk factors46 for Campylobacter infection include (Eberhart-Phillips et al., 1997, Vellinga and Loock, 2002):
eating undercooked meat especially poultry meat,
drinking raw or unpasteurised milk or water,
eating cooked food cross-contaminated with raw food
handling infected live animals and not washing hands afterwards, and
handling raw poultry and not washing hands afterwards.
Faecal contamination is the common source of C. jejuni contamination for each of the above risk factors. For example, poultry faeces frequently contain C. jejuni at levels of 105-107 CFU per gram (Stern and Robach, 2003, Wallace et al., 1998), resulting in levels of greater than 103 CFU C. jejuni per gram of carcass in 36-98% of retail poultry (Keener et al., 2004).
45 http://www.health.act.gov.au/c/health?a=da&did=10017576&pid=1053858896&sid= Accessed 12 July 200446 http://www.betterhealth.vic.gov.au/bhcv2/bhcarticles.nsf/pages/Gastroenteritis_Campylobacter Accessed 12 July 2003
66

4.2 Hazard Characterisation
4.2.1 Pathogenesis
The pathogenic mechanisms of Campylobacter have not been fully elucidated nor the ability to differentiate between pathogenic and non-pathogenic C. jejuni and C. coli strains. Published information indicates Campylobacter infection may involve production of microbial toxins. An enterotoxin47 (Wassenaar, 1997), abbreviated as CJT for C. jejuni toxin, is immunologically similar to the Vibrio cholerae toxin and the E. coli heat-labile toxin. At least six cytotoxins48 have been observed in Campylobacters. They are a 70-kDa cytotoxin, a Vero/HeLa49 cell cytotoxin, a cytolethal distending toxin (CDT), a shiga-like toxin, a haemolytic cytotoxin and a hepatotoxin. The CDT toxin has been shown to cause dramatic distension of human tumour epithelial cells, which leads to cell disintegration (Pickett, 2000). Active CDT toxin has been found in roughly 40% of the over 700 Campylobacter strains tested (Johnson and Lior, 1988). However, the role of enterotoxin and the cytotoxins in Campylobacter pathogenesis has not been fully identified.
4.2.2 Susceptibility
Susceptibility to campylobacteriosis is influenced by a range of factors, as discussed below.
Age
Campylobacters infect people of all ages, but campylobacteriosis is more frequently reported in children than in adults.
The incidence of campylobacteriosis by age group exhibits a bimodal distribution (Stafford et al., 1996 and Figure 4.5.). Young children under the age of 4 years are most susceptible to Campylobacter infection in Australia as indicated by the number of notified cases of campylobacteriosis in Australia (Figure 4.5). This high rate for young children (0 - 4 years) is also seen in other developed economies (Figure 4.6). It has been suggested that the high rate in young children (0-4 years) could be a higher susceptibility, or due to more frequent exposure to Campylobacter through activities such as patting pets (Hartnett et al., 2002). Another possible reason for the higher notification rate in this age group is the perceived higher willingness of the parents to seek medical care for their children (Hartnett et al., 2002).
Although not distinctively high compared with the age group of 0-4 years, young adults in the age range of 20-30 years also report a high rate of campylobacteriosis. Reasons for the high rate in this population group include a high tendency of travel and recreational activities, as well as a tendency to consume high-risk foods (Hartnett et al., 2002). For example, most people in this age segment tend to be in a transition period of living away from their parents and independently, where the likelihood of unsafe food handling would be high.
47 Enterotoxins are defined as secreted proteins with a capacity to bind to a cellular receptor, enter the cell and elevate intracellular cyclic AMP levels.
48 Cytotoxins are defined as proteins that kill target cells. Cytotoxinis can act intracellularly or form pores in the cells. 49 Vero cells refer to African green monkey kidney cells and HeLa cells are human tumour epithelial cells used in cell
toxicological studies.
67

Figure 4.5: Notified cases of campylobacteriosis in Australia in the year of 200350
Figure 4.6: Incidence of Campylobacter infection by age group in selected countries (adapted from Freedman et al., 2000)
Gender
Reported incidence of campylobacteriosis shows a higher rate in males than females (Figure 4.6). Results of an Australian study suggest that the ratio of campylobacteriosis between males and females is approximately 1.2:1.0 (Hall, 2003). Elsewhere, the ratio is estimated at 1.2-1.5:1.0, based on data from Norway, UK and the US (Friedman et al., 2000). There is no apparent reason explaining this difference.
Immune status
The average duration of illness depends on a number of factors, such as immune status of the host, virulence of the infecting strain, and criteria used to define illness (Skirrow and Blaser, 2000).
50 Notified cases of communicable diseases. http://www.health.gov.au/pubhlth/cdi/cdihtml.htm accessed 1 July 2004
68

For example, the incidence of Campylobacter infection in patients with AIDS has been estimated to be 40-fold higher than that in the general population (Sorvillo et al., 1991), and 16% of Campylobacter infections in these immunocompromised patients resulted in bacteraemia, a rate much higher than that of the general population.
Literature data suggest that people with existing diseases have a higher susceptibility to campylobacteriosis than the general population. Pigrau et al., (1997) demonstrated that of 58 patients with bacteraemia resulting from Campylobacter infections, 54 had existing diseases including human immunodeficiency virus infection, immunosuppressive therapy, liver cirrhosis and neoplasia.
Severity
Although rare, Campylobacter spp. have been implicated in causing a range of extra-intestinal infections including appendicitis, haemolytic uraemic syndrome, abortion, hepatitis, cholecystitis, pancreatitis, nephritis and others (Skirrow and Blaser, 2000). C. jejuni may cause septicaemia, meningitis and serious neurological disorders such as Guillain-Barré syndrome (GBS) and reactive arthritis such as Reiter syndrome (Nachamkin, et al., 2000).
Reactive arthritis following Campylobacter enteritis is similar to that associated with Salmonella and other intestinal bacterial infections. In a review of 29 patients suffering from reactive arthritis after Campylobacter enteritis, Peterson (1994) found that the appearance of pain from the onset of bowel symptom varied from 3 days to 6 weeks. The duration of the arthritis ranges from several weeks to several months.
GBS is an acute inflammatory disease affecting the peripheral nerves by removing the myelin sheath around the nerve cells. As the disease progresses, there is a loss of motor function (paralysis) and in many cases there is also a loss of sensation. Even with prompt treatment, up to 20% of patients require mechanical ventilation. Usually only a small percentage of GBS patients die and 80–85% of the survivors recover fully. The patients that do not recover may be left with severe neurological damage (Hugh and Rees, 1997). Research on GBS from several areas of the world indicates that 18-76% of GBS cases were exposed to C. jejuni in the 1–3 weeks prior to the onset of neurological symptoms (Rees et al., 1995; Nachamkin et al., 2000). C. jejuni associated GBS often has more severe consequences than GBS associated with other causes. Symptoms of GBS may be precipitated by numerous bacterial and viral infections but C. jejuni is recognized as the most common preceding infection. Since symptoms of GBS may not be obvious until 2–3 weeks after infection with C. jejuni, analyses of stool samples may not be productive. However, serological analyses often demonstrate a high prevalence of antibodies to C. jejuni in serum of GBS patients (Doyle, 1998).
While campylobacteriosis is common, the risk of developing GBS following the infection is low and only a small proportion of people infected with C. jejuni eventually develop GBS. Nachamkin et al. (2000) estimated that the rate is approximately 1 in 1,058 cases of Campylobacter infections.
It is suggested that some strains of C. jejuni are more likely to induce GBS and/or some people are more susceptible. C. jejuni strain, O19, was found to be associated with more Campylobacter-associated GBS in the USA and in Japan. In South Africa, strain O41 is associated with a high proportion of GBS cases (Doyle, 1998, Nachamakin et al., 2000). However, overall, these strains account for only 2–3% of Campylobacter infections in these countries.
Death as a result of Campylobacter infection is rare and is usually confined to infants and elderly or immunosuppressed patients who are already suffering from another serious disease (Skirrow and Blaser, 2000). Case-fatality rate ranges from 0.004% to 0.050% (Hartnett et al., 2002) in the developed economies. Australian data on fatality caused by Campylobacter infection is not available.
4.2.3 Antimicrobial resistance
The emergence of antimicrobial-resistant human pathogens like Salmonella and Campylobacter spp. limits therapeutic options available for treating invasive human infections.
69

It has been established that the use of antimicrobial chemicals for food animals such as poultry species, can add to the selection for resistance of human pathogens. With C. jejuni and C. coli, most of the scientific attention is focused on the resistance to fluoroquinolones (Smith et al, 2000). In Australia, fluoroquinolones have never been licensed for use in food production animals.
A case-control study for Campylobacter infection conducted in New South Wales from 1999 to 2001 (Unicomb et al., 2003), suggests fluoroquinolone resistant Campylobacter is absent from Australian isolates. Together with two laboratory-based surveys on antimicrobial resistance conducted in Western Australia (1999-2000) and the Australian Capital Territory (2001-2002), the case-control study found no resistance to fluoroquinolone in Campylobacter isolates known to be locally acquired from campylobacteriosis patients. Of the 370 Australian human Campylobacter isolates, 12 were resistant to fluoroquinolone, 10 of which were acquired from overseas travel.
Unpublished data of a study on antimicrobial resistance among Campylobacter isolates collected from infected Australians between September 2001 and August 2002 indicate significant high levels of resistance to sulphisoxazole, ampicillin and roxithromycin, but little resistance to kanamycine, gentamycin, ciprofloxacin, chloramphenicol and erythromycin (Unicomb and Kirk, personal communication).
An Australian study of 79 Campylobacter isolates from chicken, found widespread resistance to erythromycin and significant resistance to deoxycycline but no resistance to enrofloxacin – a fluoroquinolone antimicrobial chemical (Korolik et al., 1996). Another Australian study (Barton et al., 2001) of antimicrobial resistance of Campylobacter isolated from chickens reported significant resistance to ampicillin, ceftazidime and tetracycline in C. jejuni and C. coli isolates. No fluoroquinolone resistance was detected and there was relatively little resistance to erythromycin or tylosin.
4.2.4 Dose-response relationship
In many cases, discussion on dose-response relationship leads to an infectious dose at and above which the human host is infected and becomes ill. With C. jejuni, it is generally accepted that the infectious dose is low. In a number of published papers, an infectious dose of 500 cells is mentioned (Skirrow and Blaser, 2000).
Campylobacter infection has been induced with a minimum dose of 800 cells in an experimental human feeding trial (Black et al., 1988). Taking into consideration of the limited data in the human feeding trial and an infection rate of 50% resulted from the minimum dose, it has been proposed that the lowest infective dose would be somewhere close to 100 cells (Tribble51). This prediction is comparable with epidemiological data of campylobacteriosis where the number of milk-borne and waterborne outbreaks of Campylobacter enteritis is high. As indicated by Skirrow and Blaser (2000), concentration of Campylobacters in milk and water is often low despite the possible buffering and washing action of milk and water that enables a rapid pass of Campylobacter cells through the stomach, protecting Campylobacter cells from the damage exerted by low stomach pH environment.
Based on the human trial data (Black et al., 1988), dose-response relationships described or established in various risk assessments of Campylobacter in poultry meat (Teunis et al., 1996, Hartnett et al., 2002, Rosenquist et al., 2003) conclude that:
(1) a single pathogen cell has the ability to initiate an infection, and
(2) the probability of causing an infection increases as the level of the pathogen increases.
51 Tribble D (1998) Suitability of experimental infections in volunteers to measure pathogenesis of foodborne pathogens. http://www.foodriskclearinghouse.umd.edu/Aug1988/Talks/tribbletalk.htm Accessed 11 February 2004
70

These assumptions differ to some degree from the traditional dose-response relationships where an infection/illness is not established until a minimum dose is ingested.
Data from human trials (Black et al., 1988) indicate that Campylobacter infection correlates proportionally to the dose ingested and gradually reaches saturation (Figure 4.7), however the probability of illness is independent of the dose ingested. For example, when the dose ingested increased from 3.9 log to 5.9 log (a 100 fold increase in cell numbers), Campylobacter infection52
increased correspondingly by a rate of 13%, but rate of illness remained unchanged53. In other words, the development of illness does not show a direct correlation with the dose changes.
Figure 4.7 Correlation between probability of infection and ingested dose based on human feeding trial data (Black et al., 1988).
The risk assessment on Campylobacter spp. in broiler chickens conducted by the FAO/WHO (Hartnett et al., 2002) further explored the relationship of illness as a result of Campylobacter infection and dose of Campylobacters ingested, and proposed a conditional probability of illness based on the probability of infection. The dose-response (illness) relationship is reflected by this conditional probability. Beta distribution of this conditional probability suggests that the probability of illness is 20-50% after the establishment of an infection by Campylobacters (Hartnett et al., 2002).
The above dose-response relationships are based entirely on the experimental data of the human feeding trial. As such they are limited by the conditions and outcomes of the feeding study including:
possible lack of universal application as the trial was conducted with only two isolates of C. jejuni;
the relationship may deviate for some population subgroups as subjects of the human feeding trial were health adults; and
possible lack of sensitivity at the lower end of infectious doses because the lowest dose employed in the trails was 800 cells.
52 Infection is determined by positive detection of campylobacters in stool samples (Black et al., 1988).53 illness is determined by signs of diarrhea or fever (Black et al., 1988)
71

4.3 Exposure Assessment
In the past a few years, a number of jurisdictional surveys and investigations have been conducted to gather data on the prevalence of Campylobacter in poultry meat.
4.3.1 Campylobacter contamination in poultry meat
An investigation54 into an increase in cases of campylobacteriosis in Far North Queensland in 2002 found that among those cases that had eaten chicken in the 7 days before the onset of illness, 15 (63%) had purchased fresh chicken and cooked it at home. The investigation also found that of the raw chicken surveyed at retail, approximately 80% had Campylobacter detected. The investigation suggested that handling raw chicken, the associated cross-contamination from raw poultry meat, and undercooking poultry meat were the major causes of the increased campylobacteriosis.
A microbial survey on poultry products conducted in Western Australia for the period of August 2001 and June 200355 found 73% of the poultry products were contaminated by Campylobacters. 54% of the isolates were C. jejuni and the rest were C. coli.
Two surveys56 conducted by the Health Protection Service of the Australian Capital Territory on raw poultry products at retail revealed a 12.3% (1995-96 survey) and a 20.6% (1999-2000 survey) contamination by thermophilic Campylobacter.
Results of known surveys of Campylobacter contamination in poultry meat are listed in Table 4.4A and Table 4.4B.
Table 4.4A Campylobacter contamination of retail poultry products in AustraliaSurvey Year Poultry product Positive No. sample Reference
ACT
Health Services
1995–1996 Various raw poultry products at retail
13% 112 http://health.act.gov.au/c/health
ACT
Health services
July 1999 – Aug 2000
Various raw poultry products at retail
21% 266 http://health.act.gov.au/c/health
WA
Dept. Health
Aug 2001 – June 2003
Various raw poultry products at retail
73% 237 S. Goodchild (personal communication)
SA
Dept. Human Services
Apr – Sep 2002 Raw chicken fillet
Raw chicken mince
Raw chicken liver
48%
58%
34%
40
40
32
A. Benovic (personal communication)
Queensland
Dept. Health (Cairns)
May 2003 – Feb 2004
Various raw poultry products at retail
16% 170 T. Graham (personal communication)
Queensland
Dept. Health (Brisbane)
June 2003 – Nov 2003
Various raw poultry products at retail
78% 130 T. Graham (personal communication)
Note: None of the above surveys generated data on the levels of Campylobacters on poultry carcasses or poultry products
54 Communicable Diseases Surveillance – Highlights for 3rd quarter 2002. Communicable Diseases Intelligence 26 (4), p609
55 Department of Environmental Health, Western Australia, 200356 http://health.act.gov.au/c/health?a=da&did=10018938&pid=1053862281&sid = accessed 02 April 2004
72

Table 4.4B Campylobacter contamination of retail poultry products reported in some overseas surveys
Survey Year Poultry product Positive No. sample Reference
Ireland 2001-2002 Raw chicken, turkey and duck
49.9% 890 Whyte et al., 2004
UK
Northern Ireland
1995-2000 Raw chicken 57% 1127 Wilson IG 2002
Belgium 1999 Raw poultry products 28.5% 772 Uyttendaele M. et al., 1999
US Aug 1996 –Jul 1997
Raw turkey carcasses 90.3% 1221 USDA, Food Safety and Inspection Service, August 199857
US June 1994-June 1995
Raw broiler chicken carcasses
88.2% 1297 USDA, Food Safety and Inspection Service, April 199658
US Mar –May and Sep – Nov 1995
Raw ground chicken meat
59.8% 283 USDA, Food Safety and Inspection Service, May 199659
US Jan –May and Sep – Nov 1995
Raw ground turkey meat
25.4% 295 USDA, Food Safety and Inspection Service, May 199660
A case control study conducted in New Zealand concluded that consumption of raw and undercooked chicken was by far the most important determinant of human campylobacteriosis (Eberhart-Phillips et al., 1995). In addition, poultry meat as a significant cause of campylobacteriosis was demonstrated when consumption of poultry meat dropped during a dioxin crisis61 in Belgium. During June 1999, chicken and egg products were withdrawn from the Belguim market for a period of 4 weeks. Campylobacteriosis recorded by the nation’s sentinel surveillance system showed a 38.6% decline in the number of infections during that period. After the return of chicken and egg products to the market, the number of Campylobacter infections returned to the normal trend. An epidemiological model following the dioxin crisis in Belgium indicated that poultry contributed more than 40% of the Campylobacter infections in Belgium (Vellinga and Loock, 2002).
Prevalence of Campylobacter serotypes in Australia
More than 60 serotypes of C. jejuni have been defined by serotyping of heat stable O-polysaccharide antigens (Penner serotyping) and over 100 by serotyping of heat liable flagella and capsule antigens (Lior serotyping). The molecular bases, however for these typing systems have not been determined (Tam, 2001, Frost et al., 1998).
Queensland Department of Primary Industry identified 13 Penner serotypes and 17 Flagellum A types of Campylobacter isolates collected from chicken farms in Queensland (Miflin 2001). An Australian study of serotype distribution of C. jejuni and C. coli from patients admitted to Alice Spring Hospital for treatment of diarrhoea identified 46 Penner serotypes. The dominant serotypes identified were O8,17, O22, O1,14 and O19 (Albert et al., 1992).
57 http://www.fsis.usda.gov/Science/Baseline_Data/index.asp58 http://www.fsis.usda.gov/Science/Baseline_Data/index.asp59 http://www.fsis.usda.gov/Science/Baseline_Data/index.asp60 http://www.fsis.usda.gov/Science/Baseline_Data/index.asp61 In June 1999, Belgium poultry farmers were told to destroy chickens that were given animal feed believed to be
contaminated by dioxin, a serious carcinogen that came through the animal feed due to the use of storage tanks that were previously used to store mineral and industrial oil where dioxin is abundant.
73

In an investigation of the cause of a Campylobacter outbreak in Northern Queensland, it was revealed that Flagellum type 7 isolated from patients was indistinguishable from those isolated from a nearby poultry abattoir (The OzFoodnet Working Group, 2003).
A case control study of Campylobacter infection conducted in the Hunter region between January 1999 and August 2001 examined 180 human isolates of Campylobacters. The study found Penner serotype O18, O50 and O31, and sequence type62 48, 257, 528 were dominant serotypes/sequence types (Unicomb and Kirk, personal communication).
Data from international studies suggest predominant Campylobacter serotypes shared between human, poultry and cattle are O2, O1,44, O4-complex (Nielsen et al., 1997) and HS4 (Wareing et al., 1999).
4.3.2 Approach to Campylobacter exposure assessment
While there are several published studies that examine poultry processing factors, they are general and do not identify important variables and their effect on numbers of Campylobacter in poultry on-farm and during processing. This lack of data has been noted by others undertaking risk assessments of Campylobacter in broiler chickens (Hartnett et al., 2002; Rosenquist et al., 2003; Nauta and Havelaar, 2004). As a result, there has been limited progress with quantitative risk assessments that cover the whole poultry food supply chain.
This exposure assessment is based on those internationally published risk assessments on Campylobacter in poultry, taking into account, where possible, Australian practices and available relevant parameters.
The modelling approach is based on that developed in the FAO/WHO risk assessment for Salmonella in broilers (2002). On-farm practices and processing factors that impact on Campylobacter in poultry have been assessed qualitatively. The quantitative assessment describes factors influencing Campylobacter numbers and prevalence on poultry meat from the end of processing until consumption. Where possible, Australian industry and processing data were used to identify key factors affecting Campylobacter numbers on broiler chickens.
4.3.3 On-farm
Contamination of poultry by Campylobacter during primary production is multi-factorial and data on the likelihood or influence of one factor over another is either unclear or lacking. It is likely that numerous factors in combination result in the introduction and spread of Campylobacter in broiler chicken during the primary production stage. Because of this, it is not possible to quantitatively estimate the risk associated with various practices at the primary production.
Campylobacter is considered to be a commensal organism in poultry species. The organism can be found in infected chicken faeces at the time of slaughter in high numbers (mean 105 CFU/g; Stern and Robach, 2003). Campylobacter carriage rates in turkeys are generally similar to that found in chickens (Wallace et al., 1998); although Rosef et al., (1984) observed greater rates of carcass contamination for turkeys. The role of vertical transmission in colonisation of chickens with Campylobacter is a contentious issue. An Australian study (Miflin 2001) found no evidence of vertical transmission, based on their typing studies showing that Campylobacter types in parent flocks were not the same as types in positive breeder flocks. Although studies have shown possible vertical transmission (summarised by Keener et al., 2004), results have not been conclusive and it is likely that vertical transmission is only an occasional route of flock contamination (Anon, 2004).
International and local studies have been carried out in an effort to identify risk factors associated with Campylobacter carriage in broiler-chickens. These studies rely on observation of practices and attempt to correlate these observations with the observed flock prevalence using statistical tools.
62 Sequence type is based on a multilocus sequence typing system (Dingle et al., 2001)
74

It was identified that horizontal transmission of Campylobacter is mainly through contaminated water, litter, insects, rodents, and wild birds and by farm workers via their boots (Keener et al., 2004).
Factors associated with increased carriage of Campylobacter were considered in a French study of 75 broiler farms (Reférgier-Petton et al, 2001). Five factors were identified as significantly associated with Campylobacter carriage in chicken at the end of the rearing period:
Static rather then dynamic air movement in the shed (presumably related to aerosol formation and spread of Campylobacter throughout the shed)
Number of houses on the farm (the greater the number of houses the more worker movement between sheds, and the more feed, the greater the chance of cross-contamination)
Summer and autumn (greater survival of Campylobacter in the environment during summer)
Presence of litter beetles (potential transfer between flocks after depopulation)
Number of workers (related to greater movement between sheds)
A Swedish study found that Campylobacter contamination of flocks at slaughter is linearly related to the age of the birds (Berndtson et al, 1996a; Figure 4.8) where the birds were harvested and slaughtered between 28-61 days of age. The apparent inability of Campylobacter to colonise young birds was noted by the same authors in another study (Berndtson et al, 1996b) where colonisation of birds was not detected before 21 days but most flocks were contaminated after 48-days.
01020
3040
506070
80
28-32 33-35 36-38 39-41 42-44 45-47 48-61
Age (days)
Prev
alen
ce (%
)
Figure 4.8 Campylobacter prevalence at different slaughter ages (Berndtson et al, 1996a)
An Australian study (Miflin, 2001, Templeton, 2003) that surveyed 56 broiler farms in South-East Queensland reported that the earliest detection of Campylobacter colonisation of chicks was at 24-days of age. On most farms that became colonised prior to partial depopulation, the first positive samples were detected between 28-35 days after the placement of the hatched chicks. The study also reported that the spread of Campylobacter throughout of the whole flock was rapid once a single infection occurred. The majority of birds became contaminated within 3-days of the initial exposure Reasons for this age related infection include the presence of maternal antibodies in young birds that do not persist in older birds (Sahin et al., 2001); and/or inhibitory influences from other commensal microorganisms in the gut of young birds (Schoeni and Doyle, 1992; Newell and Fearnley, 2003).
Berndtson et al., (1996a) reported similar observations that once Campylobacter has colonised birds in a growing house all birds in the flock become contaminated within a few days and the spread of infection is likely to be via water, feed and insects.
75

The implication of this is that unless a flock is not contaminated at all, virtually all birds in a positive flock will be carrying Campylobacter in their intestinal tract. Because of the rapid spread of Campylobacter after an exposure incident, it is common to find single Campylobacter types in flocks. This implies that while there may be many possible sources of contamination only one is responsible for infection at any given time. This is evidenced by the fact that an exposure to Campylobacter after initial infection may not result in a change in Campylobacter type. Berndtson et al., (1996b) observed that only 4 of 77 flocks contaminated with Campylobacter had more than one type present in the birds at the time of slaughter.
Table 4.5 lists significant risk factors associated with Campylobacter contamination of broiler chickens prior to slaughter (Berndtson et al., 1996a). Larger farms with large flock sizes were more likely to be contaminated with Campylobacter. Also older birds, wet litter and the presence of rodents were associated with higher prevalence of Campylobacter. The age of the shed, the type of flooring, type of ventilation, type of litter and insects in the litter were not associated with increased likelihood of infection. Interestingly, the presence of horses, as opposed to other animals, near the farm was negatively correlated with Campylobacter infection in the flock.
Table 4.5 Factors associated with increased prevalence of Campylobacter in Swedish chicken flocks (Berndtson et al, 1996a).
Factor Probability Comment
Age of birds at slaughter <0.001 Older birds are more likely to be colonised, perhaps because they are more easily colonised but also because bio-security has to be maintained longer
Partial depopulation (remaining birds)
<0.001 Increases the likelihood of Campylobacter entering the shed and thereby contamination the remaining birds.
Number of sheds on farms 0.001 The greater the number of shed the more staff movement and more feed etc all impacting on ability to maintain bio-security.
Loading staff working at multiple farms
0.001 Horizontal contamination between sheds and impact on the environment of negative farms, but will not have a great effect on birds harvested for slaughter.
Large flocks 0.0013 Perhaps due to population stress leading to increase susceptibility of infection
Poor health of chicks 0.003 Young birds are unlikely to be colonised but if in poor health this may not be true
Poor hygienic barriers 0.004 More chance of contaminated material entering the shed and infecting the flock.
Wet litter 0.006 Greater ability of Campylobacter to survive between flocks.
Cleaning water cups 0.006 Helps reduce the spread of infection and therefore may control the number of contaminated birds. Unlikely to be a primary source of Campylobacter.
Presence of rodents 0.006 Carry Campylobacter into the shed.
Reférgier-Petton et al (2001) found a positive correlation between Campylobacter prevalence and the presence of litter beetles in staff change rooms. This may imply that the beetles play a role in transferring Campylobacter between sheds. Conversely, Miflin (2001) found no association between the presence of litter beetles and the Campylobacter status of Australian flocks, although it was hypothesised that they may have a role in the horizontal transmission of Campylobacter through a shed. Floor type (dirt or concrete) was not a significant factor in flock prevalence (Miflin, 2001).
Cleaning of drink outlets was negatively associated with Campylobacter colonisation (Table 4.5) and drinking water is not considered to be a risk factor for introducing Campylobacter, although it probably plays an important role in the rapid spread of Campylobacter through the flock. Flies have been identified as possible sources of Campylobacter, although they may only be transient carriers as flies in Campylobacter negative houses were not found to harbour Campylobacter (Berndtson et al., 1996a).
76

Normal cleaning practices between flocks (i.e. removal of litter, washing and drying, fogging with sanitiser etc) seem to be sufficient to ensure that flocks are not contaminated immediately on entering a growing shed (Reférgier-Petton et al, 2001). Litter reuse may be a risk factor for Campylobacter contamination of flocks, although the evidence is contradictory. Miflin (2001) showed that litter reuse was not associated with greater spread of Campylobacter. It was noted that the litter was dry throughout reuse in Miflin’s study. Wet litter has been shown to be an important risk factor for Campylobacter in broilers (Berndtson et al, 1996a).
It is recognised that Campylobacters are unlikely to be transmitted by contaminated feed as they do not survive in feed (Humphrey et al, 1993). However, non-pelletised feed has been shown to be a source of Salmonella, therefore only pelletised feed should be used (Reférgier-Petton et al, 2001).
A summary of risk factors for Campylobacter in Australian chicken production is shown in Table 4.6. These risk factors and their ranking are based largely on a comprehensive Australian study examining the infection and spread of Campylobacter spp. in broilers (Milfin, 2001). Some findings differ slightly from those reported by researchers in Europe and the USA. This is largely a result of differences in climate, housing, breed of bird and farming practices. For the latter, two practices are significantly different when compared with those observed by European and USA researchers. One is the practice of partial depopulation. In Australia, this is carried out almost for 100% of the flocks at around weeks five to six, whereas partial depopulation is practiced infrequently in the USA and other parts of the world (Newell et al, 2003). For example in Sweden, partial de-population occurs in approximately 13% of flocks (Berndtson et al., 1996). As described below, partial depopulation appears to play a significant role in horizontal transmission of Campylobacter. Another different practice is the replacement of litter. In Australia, litter is replaced with new or treated litter at the end of almost every batch of broilers (Miflin, 2001), whereas in the USA, litter is only replaced once a year (Genigeorgis et al., 1986).
Table 4.6 Risk factors associated with prevalence of Campylobacter in Australian broiler chicken production (Miflin, 2001).
ImportanceRisk Factor Current Control Measures Low Medium High
Vertical transmission:
Breeder farms
Contaminated chicks
Horizontal transmission:
Age of birds
Previously contaminated flocks
Effective cleaning and resting period between batches
Bio-security factors Biosecurity measures to prevent and/or inhibit the movement of pathogenic microorganisms
Litter/insects Litter reuse carefully controlled – no wet litter
Contaminated feed
4.3.4 Risk factors associated with partial depopulation
The effect of partial-depopulation on Campylobacter carriage in broiler flocks has received a lot of attention in Australian and overseas studies. Most agree that partial depopulation can be a serious breach of bio-security and that flocks that are negative before partial depopulation are more likely to become positive after partial depopulation. A recent study, however, questioned the role of partial depopulation as a significant risk factor (Russa et al., 2005).
In a Queensland Department of Primary Industry (DPI) study (Miflin, 2001, Templeton, 2003), most of the previously negative flocks were shown to become contaminated with Campylobacter after
77

partial depopulation. The crates used during partial depopulation were shown to be contaminated with Campylobacter of the same fla types as found in the chickens after partial depopulation.
78

Hald et al (2001) showed that seven flocks that were negative prior to partial depopulation were positive by the following week when the remaining birds were slaughtered. Boot washing/dipping is considered important in bio-security programs of broiler farms (Tom Humphrey, personal communication).
As previously discussed in section 2.3.1, feed withdrawal is important for ensuring that faecal contamination of Salmonella during slaughter is minimised (ACMSF, 1996). However, feed withdrawal may have a negative impact on faecal carriage of Campylobacter. Feed withdrawal prior to partial depopulation can stress birds remaining in the shed, increasing their susceptibility to infection. It is not clear if feed withdrawal in Australian is practiced prior to partial depopulation.
The following table (Table 4.7) highlights the risk factors associated with the introduction and spread of Campylobacter into broiler chicken flocks. Because the ecology of Campylobacter on-farm is poorly understood, the list may not be exhaustive nor the importance of each factor absolute.
Table 4.7 Ranking of the significance of risk factors impacting on the prevalence of Campylobacter in Australian broiler chicken production.
1 Based on a report on “Risk factors for Campylobacter spp. in broilers” (Miflin, J. 2001) of The Rural Industries Research and Development Corporation, Australia, and personal communication with Tom Humphrey (University of Bristol, England)
2 Bio-security factors includes partial depopulation, presence of other animals etc
Contamination of poultry with Campylobacter is largely due to horizontal transmission. Campylobacter colonisation of broiler chickens rarely occurs, or isn’t detected, before 24 days of age, implying either Campylobacter enters growing sheds after this time or that earlier introduction of the organism fails to infect birds.
4.3.5 Processing
Processing can be divided roughly into stages that are common to a number of poultry processing lines. Figure 1.2 identifies stages in processing that have been considered in published studies for their effect on bacterial contamination during processing.
79
Risk Factor 1
Increasing Importance
Biosecurity factors 2 Campylobacter
Vertical transmission from breeder flocks Campylobacter
Positive chicks Campylobacter
Previously positive flocks Campylobacter
Litter/Insects Campylobacter
Contaminated Feed Campylobacter
Age of birds at slaughter Campylobacter

In the following sections the effect of each processing stage is discussed in relation to their effect on both the prevalence and levels of Campylobacter on poultry carcasses. Much of the data reported in the following sections is based on the review of Keener et al (2004).
Transportation
Poultry can become contaminated by Campylobacter during transportation. Contamination can occur directly via faecal material from other birds in the flock or indirectly from transport crates contaminated with faecal material. In this way negative flocks can become externally contaminated during transport; but it is unlikely that these flocks will be colonised during transport, unless the transport time is lengthy. Numbers on contaminated live birds (feathers) can increase 10-fold during transport (Keener et al, 2004).
Stun and slaughter
As with Salmonella, stunning and slaughtering have little effect on the levels or prevalence of Campylobacter, as observed in the preliminary report of the FAO/WHO’s exposure assessment for Campylobacter spp. in broiler chickens (Hartnett, 2002).
Scalding
As previously described, scalding is primarily undertaken to aid in the removal of feathers from the carcass. There are conflicting reports on the effect of scalding on levels of Campylobacter. Some studies have shown significant reduction in levels of Campylobacter contamination (~3-logs) during scalding while others have shown little change (Keener et al, 2004).
Variables such as temperature and pH in the scald process are important determinants of the efficacy of scalding in reducing bacterial numbers. Oosterom et al (1983) observed on average a 2-log reduction in the level of Campylobacter contamination following high temperature scald (58ºC), compared with variable reductions following a low temperature scald (mean reduction 1.3-logs at 51.8ºC).
Scalding in general is likely to result in some reduction in Campylobacter numbers on carcasses.
Defeathering
Defeathering is a major step in poultry processing leading to Campylobacter contamination on carcasses, with most studies showing an increase in Campylobacter numbers (generally 0.5 - 1.5-logs, but as high as 3.7-logs) on carcasses after defeathering (Oosterom et al, 1983; Berrang et al, 2001; Keener et al, 2004). Contamination is generally thought to be due to cross-contamination from other birds.
Campylobacter will not grow on machinery under normal conditions and it is likely that the observed increase in numbers is the result of cross-contamination from the rubbers fingers used to remove the feathers from the carcass. Proper cleaning of these fingers during processing may reduce the level of cross-contamination, although these rubber fingers under the current design cannot be effectively cleaned during processing. Berrang et al (2001) demonstrated that contamination during defeathering was the result of escape of contaminated faeces from the cloaca during the mechanical action of defeathering. The use of recycled water may exacerbate the problem.
Washing
Washing is undertaken both before and after evisceration and has been shown to aid in the removal of Campylobacter from carcasses (Keener et al, 2004). The efficacy of washing is dependent on several factors such as water pressure, pH, use of sanitiser and coverage.
80

Most studies show only a small reduction in Campylobacter levels after washing, ranging from 0.5-logs (Keener et al, 2004) to 1-logs (Buhr et al, 2002). Smith et al (2004) showed a reduction in prevalence of Campylobacter after inside-outside washing from 14/36 birds (carcass) to 1/36 birds. Use of sanitisers such as acidified sodium chlorite was shown to significantly increase the reduction achieved after washing, from 0.5 to 1.5-logs (Bashor et al, 2004). The above suggests that while washing will not eliminate Campylobacter from carcasses, it can be used to effectively reduce the levels of Campylobacter on carcasses.
Evisceration
It is important to minimise rupture of the crop during evisceration and feed withdrawal prior to slaughter plays an important role in this regard. Observations suggest that the modern processing machine (cropper) frequently ruptures the crop (Hargis et al., 1995). Although Buhr et al (2002) showed little effect of ruptured crops on the prevalence or levels of Campylobacter on carcasses, others (Keener et al, 2004) highlighted increases in Campylobacter levels after evisceration between 2 and 3-logs at specific sites, implying the crop as a source of contamination.
Chilling
The majority of Australian processing plants use spin chillers (i.e. water immersion chillers) to ensure rapid cooling of poultry carcasses. Free chlorine is maintained in chilling water to prevent cross-contamination. Chlorine levels up to 50 mg/l at pH 6 may provide good control of cross-contamination during chilling (Keener et al, 2004). Studies in this area contradict each other, with some showing a decrease in Campylobacter, while in others the opposite is reported. Oosterom (1983) observed that large numbers (1-1.5-logs) of Campylobacter were apparently washed off the carcass during immersion chilling; although no measure of cross-contamination was made.
Immersion chilling is thought to contribute to cross-contamination of carcasses. Sánchez et al (2002) found that carcasses processed in plants using immersion chilling had a higher prevalence of Campylobacter than carcasses cooled using air chilling. However, data on the impact of air chilling on the level of Campylobacters on carcasses is lacking. It is suggested that death of Campylobacter cells during air chilling may be a result of desiccation of the carcass surface.
Portioning and packaging
Campylobacter is unable to grow on surfaces or poultry meat exposed to the air and will reduce in numbers at a rate inversely proportional to the storage temperature (Yoon et al, 2004). The overall reduction in Campylobacter during storage is likely to be in the order of 1.5-logs (Yoon et al, 2004). Portioning is likely to result in some cross-contamination but no increase in levels is expected.
A summary of the effect of primary processing on Campylobacter contamination of poultry meat is given in Table 4.8. It has been assumed that each process is operating to typical industry practices and that no special treatments have been applied. The ticks provide an indication of the potential for carcass contamination given that contaminated birds are processed. While these represent a general or average effect of each process, it is recognised that some plants may achieve better results through the application of sanitisers or through better controls.
81

Table 4.8 Effect of processing on prevalence and levels of Campylobacter on poultry meatProcess stage Comment Reduce Minimal IncreaseStun/Kill
Scald – Low temperature Some reduction due to removal of Campylobacter
Scald – High temperature Reduction due to death of Campylobacter and physical removal
De-feathering Cross-contamination
Wash Physical removal
Evisceration Contamination from intestinal contents
Wash Physical removal
Chilling – immersion (low organic build-up and up to 50 ppm free chlorine)
Some removal, cross-contamination
Chilling – immersion (insufficient free chlorine and excessive organic build-up)
Some removal, cross-contamination
Chilling – air Death from desiccation
Portioning No growth, some cross-contamination
A summary of published information on the prevalence and levels of Campylobacter of carcasses during primary processing is presented in Figure 4.9. In the figure ‘plant’ refers to samples collected prior to or immediately after slaughter at the processing site. Samples from farm were obtained from broiler faeces, and caecal and faecal samples during transport. During processing, samples were taken from breast skin at the evisceration stage, from skin during washing, and from carcasses during chilling.
Figure 4.9 Changes in prevalence and levels of Campylobacter (levels expressed as CFU/g) during poultry primary production and processing (adapted from FAO/WHO, 2002b).
The general trend is that prevalence and levels of Campylobacter contamination fall during poultry processing (Mead et al., 1995). Together with evisceration, transportation of birds from farm to slaughter site results in an increase in both the prevalence and levels of Campylobacter contamination on birds. Both immersion chilling and air chilling have been found to have a minimal effect in reducing the prevalence of Campylobacter on poultry carcasses. Immersion chilling may physically remove some Campylobacter by washing but is offset by cross contamination between carcasses.
82

Unlike immersion chilling, air chilling does not have a washing effect, but avoids cross contamination between carcasses. These results are consistent with those reported in the FAO/WHO risk assessment (2002b) for Campylobacter on broilers (Figure 4.10)
0
2
4
6
8
10
Positive flocks
Negative flocks
Figure 4.10 Changes in Campylobacter contamination (levels) modelled on poultry carcasses (Hartnett et al., 2002).
In the FAO/WHO risk assessment (FAO/WHO, 2002) negative as well as positive flocks were modelled. Interestingly, in that model, negative flocks became contaminated after transportation and remained contaminated throughout processing. Transport crates and equipment used during processing were largely responsible for the contamination.
Processing aids
A number of processing aids have been used to reduce Campylobacter contamination on poultry carcasses, including hot water, chlorine, organic acids (acetic acid, lactic acid, citric acid and succinic acid), chlorine dioxide, trisodium phosphate and acidified sodium chlorite (Keener et al, 2004). Spraying-washing carcases with water at 60ºC has been shown to reduce Campylobacter levels by 0.78 log10 CFU/carcass compared with 20oC water (Li et al., 2002). Washing at 70ºC, for 40-seconds reduced Campylobacter levels on poultry carcass contamination by 1.6 log10/ml (Purnell et al., 2004). However, prolonged exposure to hot water can lead to discolouration of poultry skin. In some studies, addition of 0.1% acetic acid to scald water, was found to reduce the level of C. jejuni by 1.5 log10
CFU/ml (Okrend et al., 1986).
Chlorine is used widely in poultry processing plants. At pH 6.0, 0.1 mg/L of free available chlorine in the chill tank with a contact time of 5 to 15 minutes at 25ºC may inactivate up to 99% of C. jejuni (Blaser et al., 1986). Chlorine dioxide is more active in reducing microbial contamination on carcasses than chlorine and can be used at lower concentration in chill water (Kener et al., 2004). Other than operating at a lower dose than chlorine, the function of chlorine dioxide is independent of water pH.
Trisodium phosphate at 10% and pH 11 sprayed pre-chill onto poultry carcasses has been shown to reduce Campylobacter levels by 1.2 to 1.5 log10 CFU/carcass (Federighi et al., 1995). Acidified sodium chlorite solution at 1000 mg/l and pH 2.3-3.2 can be used as either spray or immersion dip to reduce Campylobacter contamination on poultry carcasses (Keener et al., 2004).
4.3.6 From the end of processing to consumption – a quantitative assessment
Modelling was undertaken to quantify the risk of campylobacteriosis from consumption of contaminated poultry meat. The model framework consisted of a number of modules (Figure 4.11), with the levels of Campylobacter based on published literatures. A summary of the model is given in Appendix 5.
83
Cam
pylo
bact
er le
vel (
Log
10 c
fu/g
)

End of processing Transport:Processing to retail
Retail storage Transport:Retail to home/catering
Consumption Cooking Cross-contamination
Storage
Figure 4.11 Modules used to model the risk of campylobacteriosis from the consumption of contaminated poultry – end of processing to the time of consumption.
A stochastic model was developed based on the modules in Figure 4.11 to simulate the changes of prevalence and level of Campylobacter on poultry meat to derive a risk estimate, i.e. a probability of developing campylobacteriosis after consumption of poultry meat. The model was built on Microsoft ExcelTM with added functions (@Risk, Palisade Corporation).
End of processing
Because data for the prevalence and levels of Campylobacter on birds at the time of harvest is lacking, the modelling starts at the end of poultry processing.
A 73% prevalence of Campylobacter on raw chicken meat was used in the modelling from end of processing onwards, based on surveillance data of raw poultry meat collected during the period of August 2001 and June 2003 by the Department of Health (Western Australia). A level of Campylobacter on whole raw chicken carcass of 700 MPN/bird was estimated from limited industry data63. At the time of modelling, no other appropriate Australian data were available.
The effect of freezing at poultry processing plant was modelled. Freezing reduces the prevalence and level of Campylobacter on poultry meat. On freezing there is usually a rapid reduction in Campylobacter level (numbers) followed by a gradual reduction over time. Reduction in Campylobacter level during freezing was modelled using a uniform distribution between 0.5 and 2.5-logs.
Uncertainty in the prevalence and level of Campylobacter contamination was modelled using beta and cumulative distributions, respectively. The prevalence was used to determine if a randomly chosen bird exiting processing was positive (using the binomial distribution). The output of the processing module was the count (MPN) per g and the number of cells on a whole carcass. Carcass weight was assumed to be distributed with a minimum value of 1,100g, most likely 1,500g and maximum 2,500g.
Transport to retail, retail storage, transportation to food service/home and storage
Campylobacter does not grow in the presence of air, therefore temperature and time of transport and storage have negligible effect on the growth of Campylobacter. Frozen storage, however, leads to a reduction of Campylobacter levels, and was included in the model at both the plant and in the home/food service to estimate the level of reduction of Campylobacter on poultry meat and carcasses.
Factors affecting Campylobacter numbers on poultry meat at home or catering services were modelled by taking into consideration storage in the refrigerator and in the freezer. Consumers and food service operators often freeze fresh meat if the meat is not going to be cooked immediately.
63 Dr. M. McKenzie (Ingham’s Enterprises Ltd) - personal communication.
84

As described in the section for Salmonella, an average of 70% of consumers who freeze fresh meat after purchase was applied to the model. The effect of freezing on the level of Campylobacter on poultry meat was modelled as previously described. The storage time for frozen poultry was assumed to be between one and 30-days. It was assumed that frozen poultry meat is thawed prior to preparation for cooking.
Domestic refrigerator temperatures were modelled from data collected in a Meat and Livestock Australian study (unpublished data, Figure 4.7). To avoid unrealistic time/temperature combinations a similar procedure to that applied in section 2.3.3 was applied in the modelling, i.e. the storage time was truncated, based on time for a 4-log increase in Pseudomonas. The maximum storage time (refrigeration) was set at 5-days. The growth rate of Pseudomonas was predicted using the model parameters derived by Neumeyer et al (1997).
Cross-contamination
Cross-contamination is potentially a very important source of Campylobacter on foods and was modelled as previously described for Salmonella in Section 2.3.3.
The outcome of the cross-contamination module is the number of Campylobacter on other foods prepared in the kitchen and the number remaining on the poultry meat prior to cooking.
Cooking
Inactivation during cooking is modelled separately for Campylobacter based on data of ICMSF (1996). The temperature of cooking is considered adequate to inactivate most of the cells on the chicken surface at the time of cooking. However, it is hypothesised that a percentage of bacteria (16%) present on a chicken are in areas that do not receive sufficient heating (FAO/WHO, 2002). The frequency at which this occurs is modelled as well as the time and temperature of these protected areas. From this information the level of surviving Campylobacter cells is estimated.
Consumption
The number of cells ingested was estimated by adding the number of cells transferred to other foods and the number of cells surviving cooking and then allowing for the serving size (Min 19g, average 250g, max 550g; FAO/WHO, 2002). The probability of illness was then determined using dose response models (Rosenquist et al., 2003). Uncertainty was not included in the dose response model for Campylobacter due to the limited data available that generated the dose response models.
For Campylobacter, infection was modelled not the illness. The probability of illness resulting from infection was assumed to beta distributed (Hartnett et al., 2002) with a most likely value of 33%. The probability of becoming ill once infected was assumed to be independent of the number of cells consumed (based on the observations of Rosenquist et al., 2003).
The total number of servings of poultry meat meal in Australia (2,880,000,000 per annum) was estimated from annual consumption data (36 kg per person per year, average serving size 250g) and the Australian population (20 million).
4.4 Risk Characterisation
Campylobacter is a leading cause of sporadic food-borne illness in Australia. Symptoms of the disease generally consist of self-limiting gastroenteritis, with hospitalisation required in a number of cases. Although rare, Campylobacter spp. has also been implicated in a range of longer-term illnesses, such as reactive arthritis and Guillain-Barré syndrome.
85

Consistent with international research, results of this risk assessment (based on a review of epidemiological data, microbiological survey results and outputs from the risk modelling) implicate poultry meat being a vehicle in a proportion of food-borne campylobacteriosis in Australia.
The output of the mathematical model simulating poultry meat transportation, storage and handling, is an estimate for the likely number of campylobacteriosis cases resulting from consumption of poultry meat in Australia. As for Salmonella, a lack of both suitable and accurate Australian data means there is little value in scientific terms to present final risk estimates in this document. In other words, a meaningful risk estimate for campylobacteriosis associated with consumption of poultry meat in Australia cannot be generated. More relevant to the purpose of this assessment is the impact on the predicted number of campylobacteriosis cases through the change of food preparation practices, the prevalence and level of Campylobacter on poultry carcasses at slaughterhouse and various other inputs to the model.
Despite these limitations, the model is a valuable tool to estimate the change in the number of predicted cases of campylobacteriosis under different scenarios. Outputs of various scenarios are presented in the section of sensitivity analysis.
Due to the reduced complexity of the model for Campylobacter, 100,000 iterations were required for the output to stabilise.
Sensitivity analysis
The relationship between input and the probability of illness was determined to identify input variables that had the greatest influence on the magnitude of the probability of illness. The variables identified as important are shown in Figure 4.12. The size of the bars in Figure 4.12 represents the importance of the change (not according to the mathematical value of the bar) in the probability of illness in response to the changes of the input variables.
Figure 4.12 Sensitivity analysis (regression) for input variables used to model the probability of campylobacteriosis from the consumption of poultry meat.
86
The probability of illness from Campylobacter contaminated poultry meat was most sensitive to cross-contamination during preparation, as measured by not washing hands after handling raw poultry. Other cross-contamination factors i.e. using contaminated cutting boards to prepare other foods were also important. The quantitative effect of changing these factors on the probability of disease was evaluated by running a number of scenarios, as discussed below.
As shown in the outputs of sensitivity analysis (Figure 4.12), adequate cooking and the resultant level and prevalence of Campylobacter at the end of processing were also significant on the final probability of illness.
Based on the sensitivity analyses in Figure 4.12, factors influencing the probability of illness the most were selected to investigate the magnitude of their association with the number of illness predicted for an average year in Australia. The factors considered were, prevalence and level of Campylobacter contamination at the end of processing, cross-contamination in the home/catering services and adequate cooking.
Simulations were run on multiple scenarios, each examining the impact of changing a single factor. Scenarios considered were: (1) reducing the prevalence at the end of slaughter by 50 and 75%, (2) reducing the population on carcasses at the end of processing by 5 and 10-fold, (3) reducing the number of people not washing their hands after handling poultry and using cutting boards for other foods by 50 and 75% and (4) reducing the proportion of people inadequately cooking poultry meat by 50 and 75%. The effect of thawing was not considered for Campylobacter as no growth was assumed after the birds had been slaughtered. The impact of these scenarios on the predicted number of campylobacteriosis cases is shown in Table 4.10.
87
Decrease Increase
Not washing hands
Adequate cooking
ConcBird
Positive bird
Using cutting boards for other foods
Total reduction due to freezing
Serving size
Time in protected areas
% transferred from hands to food
Temperature in protected areas
Retail storage time
% transferred from board to food

Table 4.10 Effect of scenarios on the number of cases of campylobacteriosis predicted from consumption of chicken meat in Australia (Mean values for key factors are shown to highlight the changes made in each scenario).
Prevalence at the end of processing
Concentration at the end of processing
(CFU/carcass)
Hands not washed
Boards used for other foods Proportion undercooked
Estimated reduction in number of cases of illness
(%)
Baseline 74% 516 7% 11% 10%1 Lower prevalence (at end of processing)
by 50% 37% 516 7% 11% 10% 53%by 75% 19% 516 7% 11% 10% 78%
2 Lower level (at end of processing)by 5-fold 74% 103 7% 11% 10% 84%by 10-fold 74% 52 7% 11% 10% 93%
3 Reduced cross-contaminationby 50% 74% 516 4% 6% 10% 27%by 75% 74% 516 2% 3% 10% 35%
4 Reduction in undercookingby 50% 74% 516 7% 11% 5% 19%by 100% 74% 516 7% 11% 0% 43%
88

The outcome of the model is affected by factors within the model to different degrees, as shown above. The risk of becoming ill due to Campylobacter infection was influenced by both the prevalence and level of the organisms on poultry meat at the end of processing. The relationship between the prevalence at the end of processing and the final number of predicted cases of disease was linear. Validation of this outcome could not be performed because the lack of sufficient Australian data on the prevalence and levels of Campylobacter on poultry meat. More data needs to be obtained for the prevalence and levels of Campylobacter on chickens after processing.
The Campylobacter model was more sensitive to the level of Campylobacter on poultry meat at the end of processing than that of the Salmonella model. A 10-fold reduction in the level of Campylobacter at the end of processing resulted in a 93% reduction in the number of predicted campylobacteriosis cases. This reduction in the number of human campylobacteriosis due to reductions in the level of Campylobacter contamination on poultry meat at the end of processing is may be validated if/when relevant data become available
To examine the effect of freezing more closely a scenario was modelled in which all chicken meat (carcass and portions) leaving the processing facility is frozen. The outcome of this was a 95% reduction in the number of cases of campylobacteriosis. In other words, proper cooking alone will not eliminate the risk for campylobacteriosis from consumption of chicken meat if cross-contamination during preparation and handling occurs. Reducing cross contamination cannot be relied upon solely as the means to control campylobacteriosis if Campylobacter contamination of poultry carcass is not controlled. The most effective approach in reducing the number of cases of campylobacteriosis would be a combination of lowering the prevalence and levels of Campylobacter contamination on poultry meat, better consumer cooking and better handling practices for poultry meat (Kusumaningrum et al., 2004).
Uncertainty and Variability
Uncertainty and variability have been accounted for in this risk assessment through the use of stochastic models. However, not all important factors may have been identified and therefore not all uncertainty and variability may have been captured.
The level of Campylobacter on carcasses at the end of processing had a large influence on the final probability of illness, however, these variables also had a high level of uncertainty associated with them.
Uncertainty can be minimised by gathering more data, while variability can only be changed by changing the system itself. Uncertainty in the level of Campylobacter contamination can be reduced by gathering quantitative data at various stages throughout processing and the transport, retail and food preparation chain.
The behaviour of consumers/food preparers in the kitchen is an example of variability. While uncertainty is associated with the measurement of consumer behaviour, consumer/food preparer practice in domestic/commercial kitchen is highly variable. Gathering more information will not change the variability. The variability can only be reduced through the changes of the food storage and preparation practices i.e. educating consumers/food preparers about better practices may result in fewer failures in the kitchen and therefore reduce the amount of variability.
Clearly in the current model there are a large number of variables that have associated uncertainty and variability. The challenge is to target those variables that affect the final risk most.
89

References
ACMSF [Advisory Committee on the Microbiological Safety of Food] (1996). Report on Poultry
AIHW (2002) Australia’s Health 2002. Canberra: Australian Institute of Health and Welfare, ISBN 1740241916.
Albert, M.J., A. Leach, V. Asche, J. Hennessy and J.L. Penner (1992) Serotype distribution of Campylobacter jejuni and Campylobacter coli isolated from hospitalized patients with diarrhoea in central Australia. J. Clin. Microbiol. 30:207-210.
Anon (2004). Second Report on Campylobacter. Advisory Committee on the Microbiological Safety of Food.
Anon (2004). Second Report on Campylobacter. Advisory Committee on the Microbiological Safety of Food.
Anonymous (1999) Outbreaks of gastrointestinal illness. Victorian Infectious Diseases Bulletin 2(2): 41-42
Anonymous (2000a) Communicable Disease surveillance: highlights for November 2000. Comm. Dis. Intell. 24(12), p.391
Anonymous (2000b) Outbreaks of gastrointestinal illness. Victoria Infectious Diseases Bulletin. 2(4), p76
Anonymous (2001) Surface decontamination of melons. Food Safety and Hygiene, Food Science Australia, Sydney
Anonymous (2002) National risk validation report – Final report. Food Science Australia and Minter Ellison Consulting. http://www.health.gov.au/pubhlth/strateg/foodpolicy/pdf/validation.pdf Accessed 12 July 2004
Atabay, H.I., J.E.L. Corry and S.L.W. On (1998) Diversity and prevalence of Arcobacter spp. in broiler chickens. J. Appl. Microbiol 84:1007-1016
Baig, B.H., I.K. Wachsmuth and G.K. Morris (1986) Utilization of exogenous siderophores by Campylobacter species. J. Clin. Microbiol. 23: 431-433
Baker, M., A. Ball, M. Devane, N. Garrett, B. Gilpin, A. Hudson, J. Klena, C. Nicol, M. Savil, P. Scholes and D. Williams (2002) Potential transmission routes of Campylobacter from environment to humans. http://www.moh.govt.nz/moh.nsf/0/d9a729032610c1e6cc256ca5006cface?OpenDocument accessed 2 August 2004.
Barton MD, and J. Wilkons (2001) Antibiotic resistance in bacteria isolated from poultry. A report for the Rural Industries Research and Development Corporation. RIRDC Publication No 01/105, Canprint.
Bashor, M. P., Curtis, P. A., Keener, K. M., Sheldon, B. W. Kathariou, S. and Osborne, J. A. (2004). Effects of carcass washers on Campylobacter contamination in large broiler processing plants. Poultry Science 83, 1232-1239.
Bates, J., V. Kelk, P. Boland and A. Loan (1992) Campylobacteriosis and salmonellosis cases in a juvenile detention centre, Queensland. Comm. Dis. Intell. 16(18), pp. 381–382.
Berndtson, E., Danielsson-Tham, M.-L. and Engvall, A. (1996b). Campylobacter incidence on a chicken farm and the spread of Campylobacter during the slaughter process. International Journal of Food Microbiology 32, 35-47.
Berndtson, E., Emanuelson, U., Engvall, A. and Danielsson-Tham, M.-L. (1996a). A 1-year epidemiological study of Campylobacters in 18 Swedish chicken farms. Preventative Veterinary Medicine 26, 167-185.
Berndtson, E., U. Emanuelson, A., Engvall and M.-L. Danielsson-Than (1996) A 1-year epidemiological study of Campylobacters in 18 Swidish chicken farms. Preventative Veterinary Medicine 26:167-185
Berrang, M. E., Buhr, R. J. Cason, J. A. and Dickens, J. A. (2001). Broiler carcass contamination with Campylobacter from faeces during defeathering. Journal of Food Protection 64 (12), 2063-2066.
Berrang, M. E., Dichens, J. A. and Musgrove, M. T. (2000). Effects of hot water application after defeathering on the levels of Campylobacter, coliforms bacteria, and Escherichia coli on broiler carcasses. Poultry Science 79 (11), 1689-1693.
Bhaduri S. and B. Cottrell (2004) Survival of cold-stressed Campylobacter jejuni on ground chicken and chicken skin during frozen storage. Applied and Environmental Microbiology 70(12):7103-7109
90

Black, R.E. M.M. Levin, M.L. Clements, T.P. Hughes and M.J. Blaser (1988) Experimental Campylobacter jejuni infection in humans. J. Infect. Dis. 157: 472-479
Blaser, M.J., H.L. Hardesty, B. Power and W-L.L Wang (1980) Survival of Campylobacter fetus subsp. jejuni in biological milieus. J. Clin. Microbiol. 11:309-313
Blaser, M.J., P.F. Smith, W.L.L. Wang and J.C. Hoff (1986) Inactivation of Campylobacter jejuni by chlorine and monochloramine. Appl. Environ Microbiol 51:307-311
Blumer, C. et al., (2003) Australian’s notifiable diseases status, 2001 – Annual report of the national notifiable diseases surveillance system. Comm Dis Intell. 27:1-78
Bolton, F.J., D. Coates, D.N. Hutchinson and A.F. Godfree (1987) A study of thermophilic Campylobacters in a river system. J. Appl. Bacteriol. 62:167-176
Bolton, F.J., J.K. Williamson, F. Allen, D.R. Wareing and J.A. Frost (1999) Prevalence of C. jejuni and C. coli in meat products and packaging sold at retail: a potential public health problem. Proceedings from the 10 th
International Workshop on CHRO, p. 61, Baltimore, Maryland, September 12-16, 1999.
Brieseman, M.A. (1990) a further study of the epidemiology of Campylobacter jejuni infections. N. Z. Med. j. 103:207-209
Buhr, R., Hinton, A. and Ingram, K. (2002). Carcass Salmonella and Campylobacter contamination resulting from crop content. Spillage during evisceration can be removed by carcass washing. Southern Poultry Science Society Meeting, August 11, 2002.Carter, A.M., R.E. Pacha, G.W. Clark and E.A. Williams (1987) Seasonal occurrence of Campylobacter spp. in surface waters and their correlation with standard indicator bacteria. Appl. Environ. Microbiol. 53:523-526
Cappelier, J.M., J. Minet, C. Magras, R.R. Colwell and M. Federight (1999) Applied and Environmental Microbiology 65(1):5154-5157
Centers for Disease control and prevention (1991) Campylobacter enteritis – New Zealand, 1990. Morbid. Mortal. Weekly Rep. 40: 116-117, 123
Charlker R. and Blaser M. (1998) A review of human salmonellosis: III. Magnitude of Salmonella infection in the United Sate. Rev. Infect Dis 10:110-24
Chaveerach, P. A.A.H. ter Huurne, L.J.A. Lipman and F. van Knapen (2003) Survival and resuscitation of ten strains of Campylobacter jejuni and Campylobacter coli under acid conditions. Appl. Environ. Microbiol. 69: 711-714.
Cox N.A., M.E. Berrang, N.J. Stern and M.T. Musgrove (2001) Difficulty in recovering inoculated Campylobacter jejuni from dry poultry-associated samples. J. Food Prot. 64:252-254
Dawkins H.C., F.J. Bolton and D.N. Hutchinson (1984) A study of the spread of Campylobacter jejuni in four large kitchens. J Hyg (London) 92:357-364
Dingle K.E., F.M. Colles, D.R.A. Wareing, E.Ure, A.J. Fox, F.E. Bolton, H.J. Bootsma, R.J.L. Willems, R. Urwin and M.C.J. Maisen (2001) Multilocus sequence typing system for campylobacter jejuni. J Clin Microbiol 39:14-23
Doyle, M.P. and D.J. Roman (1982a) Response of Campylobacter jejuni to sodium chloride. Appl. Environ, Microbiol. 43: 561-565.
Doyle, M.P. and D.J. Roman (1982b) Sensitivity of Campylobacter jejuni to drying. J. Food Prot. 45:507-510
Eberhart-Phillips, J., N. Walker, N. Garrett, D. Bell, D. Sinclair, W. Rainger and M. Bates (1997) Campylobacteriosis in New Zealand: results of a case-control study. J Epidemiol Community Health 51(6):686-691
FAO/WHO (2002a). Risk assessment of Salmonella in eggs and broiler chickens. Microbiological Risk Assessment Series 2, United Nations, Geneva.
FAO/WHO (2002b). Ris assessment of Campylobacter spp. in broiler chickens and Vibrio spp. in seafood. Report of joint FAO/WHO Expet Consultation, Bangkok, Thailand, 5-9 August 2002
Fernandez, H. et al., (1985) Desiccation resistance in thermotolerant Campylobacter species. Infection 13: 197.
Forsythe, S.T. (2000) The microbiology of safe food, Blackwell Science, Oxford
91

Friedman,C.R., J. Neimann, H.C. Wegner and R.V. Tauxe (2000) Epidemiology of Campylobacter jejuni infections in the United States and other industrialized nations. In Campyloabcter, 2nd edition, Edited by Nachamkin I.and M.J.Blaster, pp 121-138
Frost, J.A., A.N. Oza, R.T. Thwaites and B. Rowe (1998) Serotyping scheme for Campylobacter jejuni and Campylobacter coli based on direct agglutination of heat-stable antigens. J Clin Microbiol 36(2) 335-339
Genigeorgis, C., M. Hassuneh and P. Collins (1986) Campylobacter jejuni infection on poultry farms and its effect on poultry eat contamination during slaughter. Journal of Food Protection 49:895-903
Gorman R., S. Bloomfield and S.C. Adley (2002) a study of cross-contamination of food-borne pathogens in the domestic kitchen in the republic of Ireland. Int. J. Food Microbiol. 76:143-150
Hald, B., Rattenborg, E. and Madsen, M. (2001). Role of batch depletion of broiler houses on the occurrence of Campylobacter spp. in chicken flocks. Letters in Applied Microbiology 32, 253-256.Hall R. D. Shaw, I. Lim, F. Murphy, D. Davos, I. Lanser, B. Delroy, I. Tribel, R. Holland and J. Carman (1996) Cluster of listeriosis cases in South Australia. Communicable Diseases Intelligence 20(21):465
Hall, G,V. R. M. D’Souza and M.D. Kirk (2002) Foodborne disease in the new millennium: out of the frying pan and into the fire? MJA 177: 614-618
Hall, R. (2003) Health implication of Campylobacter infection, Campylobacter Seminar, Victorian AIFST Food Microbiology Group, 14 October 2003.
Hargis, B.M., D.J. Caldwell, R.L. Brewer, D.E. Corrier and J.R. Deloach (1995) Evaluation of the chicken crop as a source for Salmonella contamination for broiler carcasses. Poultry Science 74:1548-1552
Hartnett E., G. Paoli, A. Fazil, A. Lammerding, S. Anderson, H. Rosenquist, B.B. Christensen and M. Nauta (2002) Hazard identification, hazard characterization and exposure assessment of Campylobacter spp. in broiler chickens – Preliminary Report. Joint FAO/WHO Activity on risk assessment of microbiological hazards in foods.
Hartnett, E., L. Kelly, D, Newell, M. Woodridge and G. Gettinby (2001) A quatitative risk assessment for the occurrence of Campylobacter in chickens at the point of slaughter. Epidemiol. Infect. 127:195-206
Hellard, M.E., M. Sinclair, A.H. Harris, M. Kirk and C.K. Fairley (2003) Community gastroenterology – cost of community gastroenteritis. Journal of Gastroenterology and Hepatology 18: 322-328
Hugdahl, M.B. J.T. Berry and M.P. Doyle (1988) Chemotactic behaviour of Campylobacter jejuni. Infect. Immun. 56:1560-1566
Hughes, R.A.C. and J.H. Rees. (1997) Clinical and epidemiological features of Guillain-Barré syndrome. J. Infect. Dis. 176:S92-S98.
Humphrey, T. J., Henley, A. and Lanning, D. G. (1993). The colonisation of broiler chickens with Campylobacter jejuni: some epidemiological investigations. Epidemiology and Infection 110, 601-607.
ICMSF (1996) Microorganisms in Foods, Volume 5 – Microbiological Specifications of Food Pathogens, Eds. Roberts, T.A., A.C. Baird-Parker and R.B. Tompkin, Blackie Academic and Professional, Melbourne
Institute of Food Technologists (2002) Expert report on emerging microbiological food safety issues: implications for control in the 21st century. Institute of Food Technologists.
Jay, S. L., Comar, D. and Govenlock, L. D. (1999). A video study of Australian domestic food-handling practices. Journal of Food Protection 62(11), 1285-1296.
Johnson, W.M. and H. Lior (1988) A new heat-labile cytolethal distending toxin (CDT) produced by Campylobacter spp. Microb Pathog 4:115-126
Kapperu, G., J. Lassen, S.M. Ostroff and s. Aasen (1992) Clinical features of sporadic campylobacter infections in Norway. Scan. J. Infect. Dis. 24:741-749.
Kapperud, G., G. Espeland, E. Wahl, A. Walde, H. Herikstad, S. Gustavsen, I. Tveit, O. Natas, L. Bevanger and A. Digranes (2003) Factors associated with increase and decrease risk of Campylobacter infection: a prospective case-control study in Norway. Am. J. Epidemiol. 158:234-242
Keener K.M., M.P. Bashor, P.A. Curtis, B.W. Sheldon and S. Kathariou (2004) Comprehensive review of Campylobacter and poultry processing. Comprehensive Reviews in Food Science and Food Safety (Institute of Food Technologists) Vol. 3:105-116
92

Kelk V., P. Boland, A. Loan and J. Bates (1994) Investigation of a food poisoning incident involving students at a university in Queensland. Comm. Dis. Intell. 18(11): 252-253
King S., M. Hornitzky and E. Sergreant (1999) Microbiological baseline survey of primary poultry processors in New South Wales 1999.
Kirk, M., G. Hall, K. Lalor, M. Sarna, R. Ashbolt and the OzFoodNet (2003) Foodborne disease in Australia – why good local investigation is important for national understanding. Abstract. Australian Institute of Environmental Health 2003. http://www.ozfoodnet.org.au/pubs/abstract_aieh2003.pdf accessed 2 August 2004
Kirk, M., J. Carnie and G. Tallis (1999) Surveillance of notifiable infectious diseases in Victoria 1998. Communicable Diseases Section, Public health Division, Victoria Department of Human Services.
Kirk, M., R. Andrews, J. Carne and G. Tallis (2000) Surveillance of notifiable infectious disease in Victoria 1999. Communicable Diseases Section, Public Health Division, Victoria Department of Human Services, December
Kirk, M., R. Waddell, C. Dalton, A. Creaser and N. Rose (1997) Prolonged outbreak of Campylobacter infection at a training facility. Comm. Dis. Intell. 21(5): 57-60
Kornacki, J.L. and J.L. Johnson (2001) Enterobacteriaceae, coliforms and Escherichia coli as quality and safety indicators. In: Compendium of Methods for the Microbiological Examination of Foods, 4th ed. (R.S. Flowers et al., eds), APHA, Washington, DC. Chapter 8.
Korolik V., J. Chang and P.J. Coloe (1996) Variation in antimicrobial resistance in Campylobacter spp. isolated from animals in the last 5 years. In: Campylobacters, Helicobacters and related organisms. Edited by Newell, DG, Ketley J, Feidman RA. New York, Plenum Publishing Corporation.
Kusumaningrum, H.D., E.D. van Asselt, R.R. Beumer and M.H. Swietering (2004) A quantitative analysis of cross-contamiantion of Salmonella and Campylobacter spp. via domestic kitchen surface. J Food Prot 67(9):1892-1903
Lastovica A.J. and M.B. Skirrow (2000) Clinical significance of Campylobacter and related species other than Campylobacter jejuni and C. coli. in: Campylobacter, 2nd , Edited by I. Nachamkin and M.J. Blaser, American Society of Microbiology, Washington, D.C., pp89-120.
Li Y.B., L.W. Kim, M.F. Slavik, C.L. Friffis, J.T. Walker and H. Wanf (1994) Salmonella typhimurium attached to chicken skil reduced using electrical simulation and inorganic salts. J. Food Prot. 61(12):23-5, 29
Liddle, J. (1997) Outbreak of gastroenteritis in a residential college, NSW Public Health Bulletin 8(5):36-37
Mead, G.C., W.R. Hudson and M.H. Hinton (1995) Effect of changes in processing to improve hygiene control on contamination of poultry carcases with campylobacter. Epidemiol. Infect. 115:495-500
Mead, P.S., L. Slutsker, V. Dietz, L.F. McCraig, J.S. Bresee, C, Shapiro, P.M. Griffin and R.V. Tauxe (1999) Food-related illness and death in the United States. Emerg. Infect. Dis. 5: 607-625.
Medema G.J., P.F.M. Teunis, A.H. Havelaar and C.N. Haas (1996) Assessment of the dose-response relationship of Campylobacter jejuni. Int. J. Food Microbiol. 30:101-111
Miflin J (2001) Risk factors for Campylobacter spp. in boilers. A report for the Rural Industry Research and Development Corporation. RIRDC Publication No 01/
Nachanmkin, I. B.M. Allos and T.W. Ho (2000) Campylobacter jejuni infection and the association with Guillain-Barré syndrome. In: Campylobacter, 2nd , Edited by I. Nachamkin and M.J. Blaser, American Society of Microbiology, Washington, D.C., pp153-175.
Neumeyer, K., Ross, T. and McMeekin, T. A. (1997). Development of a predictive model to describe the effects of temperature and water activity on the growth of spoilage pseudomonas. International Journal of Food Microbiology 38, 45-54.
Newell, D.G and C. Fearnley, C. (2003) Minireview – Source of Campylobacter colonization in broiler chickens. Applied and Environmental Microbiology 69(8):4343-4351
Newell, D.G. and C, Fearnley (2003) Minireview – sources of Campylobacter colonization in broiler chickens. Applied and Environmental Microbiology 69(8):4343-4351
93

Nielsen, E.M., J. Engberg and M. Madsen (1997) Distribution of serotypes of Campylobacter jejuni and C. coli from Danish patients, poultry, cattle and swine. FEMS Immunology and Medical Microbiology 19: 47-56.
Nuata and Havelaar 2004. A process risk model for Campylobacter in poultry. http://www.agr.kuleuven.ac.be/aee/vcbt/model-it/pdfs/36.pdf accessed 2 September 2005
Oberhelman, R.A. and D.N. Taylor (2000) Campylobacter infections in developing countries. In: Campylobacter, 2nd Ed., Edited by I. Nachamkin and M.J. Blaser, American Society of Microbiology, Washington, D.C., pp139-153.
Okrend, A.J., R.W. Johnston and A.B. Moran (1986) Effect of acid on the death rates at 52oC of Salmonella newport, Salmonella typhimurium and Campylobacter jejuni in poultry scald water. J. Food Prot. 49:500
Oosterom, J., Notermans, S., Karman, H. and Engels, G. B. (1983). Origin and prevalence of Campylobacter jejuni in poultry processing. Journal of Food Protection 46 (4), 339-344.
Park, S.F. (2002) The physiology of Campylobacter species and its relevance to their role as food-borne pathogens. Int. J. Food Microbiol. 74: 177-188.
Parkhill, J., B.W. Wren, K. Mungall, J.M. Ketley, C. Churcher, D. Basham, T. Chillingworth, and R.M. Davies (2000) The genome sequence of the food-borne pathogen Campylobacter jejuni reveals hypervariable sequences. Nature 403: 665-668
Peterson, M.C. (1994) Rheumatic manifestations of Campylobacter jejuni and C. fetus infections in adults. Scand. J. Rheumatol. 23:167-170.
Pickett, C. (2000) Campylobacter toxins and their role in pathogenesis. In: Campylobacter, 2nd , Edited by I. Nachamkin and M.J. Blaser, American Society of Microbiology, Washington, D.C., pp179-190.
Pickett, C.L., T. Auffenberg, E.C. Pesci, V.L. Sheen and S.S.D. Jusuf (1992) Iron acquisition and hemolysin production by Campylobacter jejuni. Infect. Immun. 60: 3872-3877
Pigrau, C., R. Bartolome, B. Almirante, A.M. Planes, J. Gavalda and A. Pahissa (1997) Bacteremia due to Campylobacter species: clinical findings and antimicrobial susceptibility patterns. Clin. Infect. Dis. 6:1414-20
Purnell, G., K. Mattick and T. Humphrey (2004) The use of ‘hot water’ treatments to reduce the number of pathonenic bacteria on raw reail poultry. J. Food Eng. 62(1):29-36
Raupach J. and R. Hundy (2003) An outbreak of Campylobacter jejuni infection among conference delegates. Comm Disease Intelligence 37:380-383
Redmond E.C. and C.J. Griffith (2003) Consumer food handling in the home: a review of food safety studies. J Food Prot 66:130-161
Rees, J.H., S.E. Soudain, N.A. Gregson and R,A.C. Hughes (1995) Campylobacter jejuni infection and Guillain-Barre syndrome. The New England journal of Medicine 333:1374-1379
Reférgier-Petton, J., Rose, N., Denis, M. and Salvat, G. (2001). Risk factors for Campylobacter spp. contamination in French broiler-chicken flocks at the end of the rearing period. Preventative Veterinary Medicine 50, 89-100.Richardson, P.T. and S.F. Park (1995) Enterochelin uptake in Campylobacter coli: characterisation of components of a binding protein-dependent transport system. Microbiology 141: 3181-3191
Rivas, L., Fegan, N. and Vanderlinde, P. (2004) Isolation and characterisation of Arcobacter butzleri from meat. Int J Food Microbiol 91(1):31-41.
Robinson, D.A. (1981) Infective dose of Campylobacter jejuni in milk. Br. Med. J. 282:1584
Rollins, D.M. and R.R. Colwell (1986) Viable but nonculturable stage of Campylobacter jejuni and its role in survival in the natural aquatic environment. Appl. Environ, Microbiol. 52: 531-538.
Rosef, O., Gondroson, B. and Kapperud, G. (1984). Campylobacter jejuni and Campylobacter coli as surface contaminants of fresh and frozen poultry carcasses. International Journal of Food Microbiology 1, 205-215.
Rosenquist, H, N.L. Nielsen, H.M, Sommer, B. Nørrung, and B.B. Christensen (2003). Quantitative risk assessment of human campylobacteriosis associated with thermophilic Campylobacter species in chickens. International Journal of Food Microbiology 83, 87-103.
94

Russa, A.D., A. Bouma, J.C.M. Vernooij, W. Jacobs-Reitsma and J.A. Stegman (2005) No association between partial depopulation and Campylobacter spp. colonisastion of Dutch broiler flocks. Letter in Applied Microbiology 41:280-285
Russell, S. M. (2002). Intervention strategies for reducing Salmonella prevalence on ready-to-cook chicken. University of Georgia College of Agricultural and Environmental Sciences, Bulletin 1222, December 2002.
Sahin, O., O. Zhang, J.C. Meitzler, B.S. Harr, T.Y. Morishita and R. Mohan (2001) Prevalence, antigenic specificity, and bactericidal activity of poultry anti-Campylobacter maternal antibodies. Applied and Environmental Microbiology. 67(9):3951-3957
Sánchez, M. X., Fluckey, W. M., Brashears, M. M. and McKee, S. R. (2002). Microbial profile and antibiotic susceptibility of Campylobacter spp. and Salmonella spp. in broilers processed in air-chilled and immersion-chilled environments. Journal of Food Protection 65(6), 948-956.Skirrow, M.B. and M.J. Blaser (2000) clinical aspects of Campylobacter infection. In: Campylobacter, 2nd , Edited by I. Nachamkin and M.J. Blaser, American Society of Microbiology, Washington, D.C., pp69-88.
Schoeni, J.L. and M.P. Doyle (1992) Reduction of Campylobacter jejuni colonization of chicks by cecum-colonizing bacteria producing anti-C. jejuni metabolites. Applied and Environmental Microbiology 58(2):664-670
Smibert, R.M. (1984) Genus Campylobacter, in: Bergey’s Manual of Systematic Bacteriology, Volume 1, Edited by Krieg, N.R., Williams and Wilkins, Baltimore, pp 111-117
Smith K.E., J.B. Brender and M.T. Osterholm (2000) Antimicrobial resistance in animals and relevance to human infections. In: Campylobacter, 2nd , Edited by I. Nachamkin and M.J. Blaser, American Society of Microbiology, Washington, D.C., pp483-495.
Smith, D., Northcutt, J. and Musgrove, M. (2004). Effect of commercial inside-outside bird washer (IOBW) on Campylobacter, Salmonella, E. coli and aerobic plate counts (APC) of uncontaminated, contaminated and cross-contaminated broiler carcasses. Poultry Science, submitted May 14, 2004.
Sorvillo, F.J., L.E. Lieb and S.H. Waterman (1991) Incidence of campylobacteriosis among patients with AIDS in Los Angeles county. J. Acquired Immun. Dific. Syndr. 4:598-602.
Stafford, R. et al., (1996) A five year review of Campylobacter infection in Queensland. Communicable Diseases Intelligence 20 (22): 478-482
Stanley K.N., J.S. Wallace and K. Jones (1998) Thermophilic Campylobacters in dairy slurries on Lancashire farms: seasonal effects of storage and land application. J. Appl. Microbiol 85:405-409
Stern N.J. and M.C. Robach (2003) Enumeration of Campylobacter spp. in broilers feces and in corresponding processes carcasses. J Food Prot 66(9):1557-1563
Stern N.J., K.L. Hiett, G.A. Alfredsson, K.G. Kristinsson, J. Reiersen, H. Hardardottir, H. Briem, E. Gunnarsson, F. Georgsson, R. Lowman, E. Berndtson, A.M. lammerding, G.M. Paoli and M.T. Musgrove (2003) Campylobacter spp. in Icelandic poultry operations and human cases. Epidemiol Infect 130:23-32
Stern N.J., P.J. Rothenberg and J.M. Stone (1985) Enumeration and reduction of Campylobacter jejuni in poultry and red meats. J Food Protect 48:606-610
Sumner, J., G. Ravan, P. Dean, P. Dowsett, E. Petrenas, R. Weiring, G. West, M. Lillie, G. Holds and A. Pointin (2004) A microbiological profile of poultry processed in South Australia. Food Australia 56(7):335-340
Tam C.C. (2001) Campylobacter reporting at its peak year of 1998: don’t count your chickens yet. Commun Dis and Pub Heal 4(3): 194-199
Templeton, J. (2003). “Campylobacter…and the poultry farm”. Presentation given to the Victorian Branch of AIFST.
Tenkaet T. and J. Bates (1994) Clostridium perfringens food poisoning from a wedding reception, Queensland. Communicable diseases Intelligence 18(9): 206-207
Teunis P.F.M., N.J.D. Nahelkerke and C.N. Haas (1999) Dose-response models for infectious gastroenteritis. Risk Analysis 19(6):1251-1260
Teunis P.F.M., O.G. van der Heijden, J.W.B. van der Giessen and A.H. Havelaar (1996) The dose-response relation in human volunteers for gastro-intestinal pathogens. RIVM report#284550002
95

The OzFood Net Working Group (2003) Foodborne disease in Australia: incidence, notifications and outbreaks. Annual report of the OzFoodNet network, 2002. Commun Dis Intell 27:209-243.
Tholozan, J.L., J.M. Cappelier, J.P. Tissier, G. Delattre and M. Federighi (1999) Physiological characterization of viable-but-nonculturable Campylobacter jejuni cells. Applied and Environmental Microbiology, 65(3):1110-1116
Unicomb, L. J. Ferguson, C. Dalton, T. Inglis, M. Kirk and the Austrlaian Campylobacter Subtyping Study Group (2002) A case-control study of Campylobacter infection: linking multiple molecular subtyping data with risk factors. The Australian Society for Microbiology Annual Scientific Meeting, Melbourne, Victoria
Uyttendaele M. et al., (1999) Incidence of Salmonella, Campylobacter jejuni, Campylobacter coli, and Listeria monocytogenes in poultry carcasses and different types of poultry products for sale on the Belgian retail market. J. Food Prot. 62: 735-740
Vandamme P. (2000) Taxonomy of the family Campylobacteraceae in Campylobacter, 2nd edition, edited by Nachamkin I. and M.J. Blaster, ASM Press, Washington, DC. p3-26
Vandenberg, O., A. Dediste, K. Houf, S. Ibekwem, H. Souayah, S. Cadranel, N. Douat, G. Zissis, J.-P. Butzler and P. Vandamme (2004) Arcobacter species in humans. Emerg Infec Diseas 10 (10):1863-1867
Vellinga A. and F.V. Loock (2002) The dioxin crisis as experiment to determine poultry-related Campylobacter enteritis. Emerging Infectious Diseases 8: 19-22
Walker R.I., M.B. Caldwell, E.C. Lee, P. Guerry, T.J. Trust and G.M. Ruiz-Palacios (1986) Pathophysiology of Campylobacter Enteritis. Microbiol. Rev. 50(1): 81-94
Wallace J.S., K.N. Stanley and K. Jones (1998) The colonization of turkeys by thermophillic Campylobacter. J. Appl Micro 85:224-230
Wareing D.R., F.J. Bolton, A.J. Fox and P.A. Wright (1999) The annual incidence and seasonal distribution of a Campylobacter jejuni strain associated with human infection. A proposal for a bovine reservoir and potential sources of transmission. Proceedings from the 10th International Workshop on CHRO, P. 33, Baltimore, Maryland, September 12-16, 1999.
Wassenaar T.M. (1997) Toxin production by Campylobacter spp. Clin. Microbiol. Rev. 10: 466-476.
Watson T., Coleman, D., and Jacobs, M. (1993) Campylobacteriosis outbreak at church camp Penguin, Tasmania, January, 1993. Communicable Diseases Intelligence, 17(8), pp. 159–161.
Wesley I.V. and A.L. Baetz (1999) Natural and experimental infections of Arcobacter in poultry. Poultry Science. 78:536-545
Wesley I.V. (1996) Helicobacter and Arcobacter species: risk for foods and beverages. J. Food Protection 59:1127-1132
Whyte, P., K. McGill, D. Cowley, R.H. Madden, L. Moran, P. Scates, C. Carroll, A. O’Leary, S. Fanning, J.D. Collins, E.McNamara, J.E. Morre and M. Cormican (2004) Occurrence of Campylobacter in retail foods in Ireland. Internatioanl Journal of Food Microbiology 95:111-118
Wilson I.G. (2002) Salmonella and campylobacter contamination of raw retail chickens from different producers: a six year survey. Epidemiol Infect. 129(3):635-45.
World Health Organization (2000) Campylobacter Fact Sheet No 255. http://www.who.int/mediacentre/factsheets/fs255/en/ accessed 8 July 2004
Yoon, K. S., Burnette, C. N. and Oscar, T. P. (2004). Development of predictive models for the survival of Campylobacter jejuni (ATCC 43051) on cooked chicken breast patties and in broth as a function of temperature. Journal of Food Protection 67(1), 64–70.
Zhao T., G.O. Ezeike, M.P. Doyle, Y.C. Hung and R.S. Howell (2003) Reduction of Campylobacter jejuni on poultry by low-temperature treatment. J. Food Prot. 66(4):652-655, 2003.
Ziprin R.L., C.R. Young, L.H. Stanker, M.E. Hume and M.E. Konkel (1999) The absence of cecal colonization of chicks by a mutant of Campylobacter jejuni not expressing bacterial fibronectin-binding protein. Avian Dis. 43(3):586-589
96

5 Qualitative Risk Assessment - Other Microbial PathogensAlthough most interest surrounding the public health and safety of poultry meat has been on the presence of Salmonella and Campylobacter, other microorganisms of public health significance may have the potential to contaminate raw poultry meat, including pathogenic Escherichia coli, Clostridium perfringens, Listeria monocytogenes and Staphylococcus aureus.
Due to a significant decline in the number of reported cases, illness caused by Yersinia enterocolitica has not been a notifiable disease in Australia since 2001. Although Y. enterocolitica has previously been isolated from poultry meat, yersiniosis linked to the consumption of poultry meat is rare and therefore the organism was not considered in this assessment. Viral agents such as Norovirus and hepatitis A were also excluded, as humans are the primary reservoir of these hazards and therefore outside the scope of this assessment.
Limited by the availability of data, the following section provides a qualitative assessment of the public health and safety risks posed by these organisms via consumption of poultry meat in Australia. While no attempt has been made to quantitatively or qualitatively rank individual microbiological pathogens based on public health and safety risk, the outcome of the risk assessment is a discussion on the likelihood of illness associated with the consumption of poultry meat and poultry meat products in Australia and the severity of illness for each organism considered.
5.1 Pathogenic Escherichia coli
5.1.1 Hazard Identification
Escherichia coli (E. coli) are members of the family Enterobacteriaceae and are a common part of the normal intestinal flora of humans and other warm-blooded animals. The organisms are described as gram-negative, facultatively anaerobic rod shaped bacteria (Desmarchelier and Fegan, 2003). Although most strains of E. coli are considered harmless, the species does contain certain strains that can cause severe illness in humans (Bell and Kyriakides, 1998). Strains of E. coli are differentiated serologically, based on O (somatic) and H (flagella) antigens (Lake et al., 2003).
This assessment is primarily concerned with human pathogenic E. coli. Pathogenic E. coli are characterised into specific groups based on virulence properties, mechanisms of pathogenicity and clinical syndromes (Doyle et al., 1997). These groups include enteropathogenic E. coli (EPEC), enterotoxigenic E. coli (ETEC), enteroinvasive E. coli (EIEC), enteroaggregative E. coli (EAEC) and enterohaemorrhagic E. coli (EHEC). Many synonyms are used to describe EHEC, including Shiga toxin-producing E. coli (STEC), Shiga-like toxin-producing E. coli (SLTEC), and verocytotoxin-producing E. coli (VTEC).
Growth and Survival
Growth and survival of pathogenic E. coli is dependent on the simultaneous effect of a number of environmental factors such as temperature, pH and water activity (aw). In general, pathogenic E. coli strains behave similarly to non-pathogenic strains, however certain EHEC strains have been found to have a higher tolerance to acidic conditions than other groups of E. coli (Desmarchelier and Fegan, 2003).
The optimum temperature for growth of E. coli is 37C, and it can grow within the range of 7-8C to 46C (ICMSF, 1996). Heat sensitivity of pathogenic E. coli is similar to that of other Gram-negative bacteria and is dependent on the pH, aw and composition of the food (Bell and Kyriakides, 1998). Due largely to its importance as a cause of food-borne illness in the United States, most studies on the growth and/or survival of pathogenic E. coli have been undertaken with E. coli O157:H7 (an EHEC organism).
97

Studies on the thermal sensitivity of E. coli O157:H7 have revealed that it is no more heat sensitive than Salmonella (Doyle and Schoeni, 1984). Therefore, heating a product to kill typical strains of Salmonella will also kill E. coli O157:H7.
Numbers of pathogenic E. coli O157:H7 have been shown to remain stable in ground beef stored at –20C for over 9 months (Doyle and Schoeni, 1984). In contrast, a 10-fold reduction of non-pathogenic E. coli has been observed in ground beef stored at –25.5C for 38 weeks (ICMSF, 1996).
Studies have demonstrated that many EHEC strains are acid-tolerant and can survive for at least five hours at pH 3.0 - 2.5 at 37C (Benjamin and Datta, 1995). Stationary phase and starved pathogenic E. coli have been found to have an increased acid tolerance compared with exponential growth phase organisms (Arnold and Kaspar, 1995). Pathogenic E. coli may therefore be able to survive and/or grow in food products previously considered too acidic to support the survival of other food-borne pathogens. The effect of pH on E. coli survival is, however, dependent on the type of acid present. For example, E. coli O157:H7 can survive in a medium adjusted to pH 4.5 with hydrochloric acid but not when adjusted to the same pH with lactic acid (ICMSF, 1996).
The minimum water activity (aw) required for growth of pathogenic E. coli is 0.95, or approximately 8% sodium chloride (ICMSF, 1996). In sub-optimal temperature or pH conditions, the aw required for growth increases (Desmarchelier and Fegan, 2003).
Mode of transmission
Pathogenic E. coli are transmitted by the faecal-oral route. Sources of transmission include person to person, food-borne, waterborne (drinking water and direct contact with faecally contaminated water) and direct contact with infected animals.
Occurrence in food
Humans appear to be the primary reservoir of EIEC, ETEC and EPEC organisms (Desmarchelier and Fegan, 2003). Therefore, contamination of food with these organisms often due to human faecal contamination, either directly from an infected food handler or indirectly via contaminated water. Very little information is available on the occurrence of these organisms in food. The detection of these organisms in food is difficult, requiring sophisticated methodology and therefore food is not routinely screened for these organisms.
In general, EPEC and ETEC organisms are more commonly isolated in foods from developing countries and their presence is associated with poor hygiene (Desmarchelier and Fegan, 2003). EPEC has been isolated from milk products in Iraq as well as from a variety of raw and cooked food in Malaysia (Abbar and Kaddar, 1991; Norazah et al., 1998). In Brazil, EPEC has been isolated from 21.1% of soft cheeses sampled (n=45) and has frequently been isolated from pasteurised milk (Araújo et al., 2002; da Silva et al., 2001).
EIEC have only sporadically been isolated from foods (Olsvik et al., 1991).
In addition to being a major cause of infantile diarrhoea in developing countries, ETEC organisms are a leading cause of traveller’s diarrhoea, which has been linked to the consumption of contaminated food and water (Nataro and Kaper, 1998). ETEC have been isolated from Brazilian fish and shrimp which were harvested from waters contaminated with raw sewage (Teophilo et al., 2002). ETEC have also been detected in sauces at Mexican-style restaurants, and chilli sauce sold by street vendors on Mexico (Adachi et al., 2002; Estrada-Garcia et al., 2002). In general, these sauces had been prepared and handled under poor hygienic conditions.
98

The major reservoir of EHEC organisms appears to be the intestinal tract of ruminants, in particular cattle and sheep (Desmarchelier and Fegan, 2003). E. coli O157:H7 and other EHEC species have been isolated from both healthy and diarrhoeic animals and an individual animal can carry more than one serotype (Anon, 1998).
Meats derived from these animals may therefore become contaminated via exposure to faecal material during processing. Table 5.1 provides a summary of reported EHEC isolation rates from foods in a number of countries. Caution must be exercised when comparing results between independent studies due to differences in sample size, stage of production where the samples were taken and different methodologies used to isolate the organisms. E. coli O157:H7 is the most widely studied EHEC serovar due to it being associated with a large number of outbreaks worldwide. Of the studies listed in Table 2, not all EHEC isolates were confirmed to possess the necessary toxigenic and/or virulence factors required to cause illness in humans.
Very little information is available of the prevalence of EHEC organisms in food in Australia. Of the limited studies undertaken, the prevalence of E. coli O157:H7 in beef and sheep meat appears to be low, however, the prevalence of non-O157:H7 EHEC serotypes is unknown (Phillips et al., 2001a; Phillips et al., 2001b; Vanderlinde et al., 1998; Vanderlinde et al., 1999).
99

Table 5.1 EHEC isolation rates from a variety of food commodities.
ND = Not Detected
Incidence and outbreak data
Infection with pathogenic E. coli is a cause of significant morbidity and mortality worldwide. Outbreaks caused by EPEC, ETEC and EIEC occur infrequently in developed countries (ICMSF, 1996). In contrast, outbreaks caused by EHEC are more common, with a number of large food-borne outbreaks being reported in many countries, including Australia (Goldwater and Bettelheim, 1998). In developing countries, the incidence of EHEC infection is reported to be much lower than that of ETEC and EPEC infection (Nataro and Kaper, 1998).
EIEC stains have been isolated with low frequency from diarrhoeal cases in both industrialised and less developed countries (Nataro and Levine, 1994). Outbreaks have occurred in hospitals, on a cruise ship, and from contaminated water (Desmarchelier and Fegan, 2003).
100
Sample Organisms Isolated
Country No. Sampled
% Positive
Reference
Beef STEC New Zealand 91 12.1 (Brooks et al., 2001)Mutton/lamb STEC New Zealand 37 17.1 (Brooks et al., 2001)Pork STEC New Zealand 35 4.0 (Brooks et al., 2001)Chicken STEC New Zealand 36 ND (Brooks et al., 2001)Pig carcass E. coli O157 Italy 150 0.7 (Bonardi et al., 2003)Ground beef STEC USA 296 16.8 (Samadpour et al., 2002)Minced beef STEC Switzerland 400 1.75 (Fantelli and Stephan,
2001)Fish STEC India 60 3.3 (Sanath Kumarma et al.,
2001)Clams STEC India 48 4.2 (Sanath Kumarma et al.,
2001)Beef E. coli O157:H7 China 40 5.0 (Zhou et al., 2002)Pork E. coli O157:H7 China 30 3.3 (Zhou et al., 2002)Beef STEC India 111 50.0 (Khan et al., 2002)Ground beef VTEC Argentina 25 32.0 (Parma et al., 2000)Hamburger meat VTEC Argentina 25 28.0 (Parma et al., 2000)Beef STEC France 411 3.9 (Pradel et al., 2000)Cheese STEC France 603 0.8 (Pradel et al., 2000)Beef VTEC Spain 455 13 (Blanco et al., 2003)Beef VTEC Canada 225 10.4 (Read et al., 1990)Pork VTEC Canada 235 3.8 (Read et al., 1990)Chicken VTEC Canada 200 ND (Read et al., 1990)Ground beef E. coli O157:H7 USA 164 3.7 (Doyle and Schoeni,
1987)Pork E. coli O157:H7 USA 264 1.5 (Doyle and Schoeni,
1987)Poultry E. coli O157:H7 USA 263 1.5 (Doyle and Schoeni,
1987)Lamb E. coli O157:H7 USA 205 2.0 (Doyle and Schoeni,
1987)Beef carcass E. coli O157:H7 Australia 1,275 0.1 (Phillips et al., 2001a)Frozen beef (boneless) E. coli O157:H7 Australia 990 ND (Phillips et al., 2001a)Sheep meat (carcass) E. coli O157:H7 Australia 917 0.7 (Phillips et al., 2001b)Frozen sheep meat (boneless)
E. coli O157:H7 Australia 467 1.3 (Phillips et al., 2001b)
Beef carcass E. coli O157:H7 Australia 893 0.5 (Vanderlinde et al., 1998)Frozen beef (boneless) E. coli O157:H7 Australia 685 0 (Vanderlinde et al., 1998)Sheep meat (carcass) E. coli O157:H7 Australia 465 0 (Vanderlinde et al., 1999)Frozen sheep meat (boneless)
E. coli O157:H7 Australia 343 0.3 (Vanderlinde et al., 1999)

ETEC stains are a major cause of diarrhoea in infants and young children in developing countries, particularly in the tropics, and are a leading cause of travellers’ diarrhoea (Doyle and Padhye, 1989; Gross and Rowe, 1985; Nataro and Levine, 1994). Although uncommon, a number of food-borne outbreaks due to ETEC have occurred internationally (Olsvik et al., 1991). Mead et al. (1999) estimated that ETEC infection is responsible for approximately 0.4% of food-borne illnesses in the US. In 1983 a multi-state ETEC outbreak occurred in the US that was associated with consumption of imported Brie and Camembert cheese (Anon, 1984; MacDonald et al., 1985). More recently, contaminated parsley was implicated in two ETEC outbreaks in Minnesota, USA during 1998 (Naimi et al., 2003). The source of the contamination was believed to be inadequately chlorinated wash water used on-farm.
A large ETEC outbreak, affecting over 800 people, occurred in Japan during 1996. The outbreak occurred at four elementary schools and was associated with consumption of tuna paste (Mitsuda et al., 1998). Analysis of patient stool samples and samples of the implicated tuna paste confirmed E. coli O25:NM as the cause of illness.
EPEC stains have caused infantile diarrhoea in hospitals and nurseries in the United Kingdom and the United States (Nataro and Levine, 1994; Robins-Brown, 1987). In developing countries, EPEC stains are still responsible for a high incidence of sporadic infant diarrhoea. Limited information is available on food-borne outbreaks associated with EPEC. An outbreak of EPEC (serotype O111) occurred amongst people on a coach trip to France, although no specific food was identified, the infection was believed to have been the result of consuming food at a restaurant in northern France (Wight et al., 1997). Outbreaks associated with consumption of contaminated cold pork and meat pies have been reported in Britain (Doyle and Padhye, 1989).
Since its identification as a human pathogen in 1982, and implication in a number of outbreaks in the United States, E. coli O157:H7 was thought to be the most predominant cause of EHEC related disease (FAO/WHO, 2002). It is estimated that 85% of EHEC infections in the United States are food-borne (Mead et al., 1999).
In the United States, consumption of undercooked hamburger meat has been an important cause of EHEC outbreaks (Nataro and Kaper, 1998). A large multi-state E. coli O157:H7 outbreak involving consumption of contaminated hamburgers occurred in December 1992 – January 1993 with 732 cases identified, of which 195 were hospitalised and 4 died (Nataro and Kaper, 1998).
Foodborne outbreaks of E. coli O157:H7 have also been associated with consumption of contaminated fresh produce. In the United States, outbreaks occurred in 1995 and 1996 (70 and 49 cases respectively), which were traced to consumption of lettuce (Tauxe, 1997). Studies have shown that E. coli O157:H7 can be transmitted to lettuce plant tissue from soil contaminated with manure and contaminated irrigation water (Solomon et al., 2002). Another large E. coli O157:H7 outbreak occurred in the US in 1996 which was linked to apple juice. Although the low pH of fruit juices will generally not allow the survival and growth of many Enterobacteriaceae, E. coli O157:H7 may survive due to its high acid-tolerance.
Over 200 non-O157 STEC serotypes have been isolated from humans, with the WHO identifying O26, O103, O111 and O145 as the most important non-O157 serogroups worldwide (WHO, 1998).
Until recently, isolation of non-O157 serotypes has been difficult due to the lack of a biochemical marker (Mead and Griffin, 1998). Faecal specimens were therefore rarely screened for non-O157 STEC serotypes. It was originally estimated that the incidence of non-O157 STEC infections were 20 – 30% that of E. coli O157:H7 in the US, however it is now estimated that this figure is approximately 50% (Mead et al., 1999).
STEC has been a notifiable disease in most Australia States and Territories since August 1998 (Roche et al., 2001). The notification rate for STEC in Australia has been 0.2 – 0.3 cases per 100,000 population.
101

Significant variations in notifications exists between states and territories, and part of this variation is likely to be a result of different practices employed by pathology laboratories when screening faecal samples for toxin producing E. coli (Figure 5.1) (Anon, 2003).
Figure 5.1 Notification rates of STEC in Australian States and Territories in the period 1999 – 2002.
A large EHEC outbreak occurred in South Australia during 1995, which resulted in approximately 200 cases of illness. Twenty-two people aged between 4 months and 12 years developed haemolytic uraemic syndrome (HUS) and were hospitalised and a 4-year-old child died. Investigations of the outbreak identified EHEC strain O111:NM (or strain O111:H-, NM for non-motile) as the principal cause of the outbreak. A locally produced uncooked, fermented mettwurst was identified as the vehicle for the pathogen. The product was found to contain a variety of EHEC strains in addition to O111 (Paton and Paton, 1998).
Although E. coli O157:H7 and O157:H- have been isolated from Australian cattle and sheep, very few human cases are observed due to these serotypes (Fegan and Desmarchelier, 2002; Yohannes et al., 2004). A nationwide study of HUS cases in Australia during 1994 – 1998 identified E. coli 111:H- as the most common etiologic agent for both sporadic and outbreak cases (Elliott et al., 2001). Other STEC isolates from sporadic HUS cases included O26:H-, O113:H21, O130:H11, OR:H9, O157:H-, ONT:H7 and ONT:H-. In a study of E. coli O157:H7 and O157:H- isolates from Australia, Fegan and Desmarchelier (2002) identified that regardless of source (animal or human), all isolates contained the virulence markers associated with human disease. The authors suggest the low number of human cases associated with E. coli O157 in Australia may be due to factors other than those relating to bacteria, or that Australian isolates lack some as yet undetermined virulence factor.
5.1.2 Hazard Characterisation
Pathology of illness
Clinical, pathological and epidemiological characteristics of disease caused by pathogenic E. coli vary between pathotypes and is discussed below and summarised in Table 5.2.
EPEC have technically been defined as “diarrhoeagenic E. coli belonging to serogroups epidemiologically incriminated as pathogens but whose pathogenic mechanisms have not been proven to be related either to heat-labile enterotoxins or heat-stable enterotoxins or to Shigella-like invasiveness” (Edelman and Levine 1983). EPEC cause characteristic attaching and effacing lesions in the intestine, similar to those produced by EHEC, but do not produce Shiga toxins.
102
0.0
0.5
1.0
1.5
2.0
2.5
3.0
ACT NSW NT Qld SA Tas Vic WAState/Territory
Rate
per
100
,000
pop
ulat
ion
1999200020012002

Attachment to the intestinal wall is mediated by a plasmid-encoded outer membrane protein called the EPEC Adherence Factor in type I EPEC. However, pathogenicity is not strictly correlated to the presence of the EPEC Adherence Factor, indicating that other virulence factors are involved (ICMSF, 1996).
EPEC causes illness primarily in infants and young children in developing countries. Symptoms include watery diarrhoea, with fever, vomiting and abdominal pain. The diarrhoea is usually self-limiting and of short duration, but can become chronic (more than 14 days). EPEC is also recognised as a food and water-borne pathogen of adults, where it causes severe watery diarrhoea (with mucus, but no blood) along with nausea, vomiting, abdominal cramps, fever, headache and chills. Duration of illness is typically less than three days (Dalton et al., 2004; Doyle and Padhye, 1989).
ETEC that survive passage through the stomach adhere to mucosal cells of the proximal small intestine and produce a heat-labile toxin (LT) and/or a heat-stable toxin (ST). The heat-labile toxins are similar in structure and mode of action to cholera toxin, interfering with water and electrolyte movement across the intestinal epithelium (Desmarchelier and Fegan, 2003). If the volume of accumulated fluid exceeds the normal absorptive capacity of the large intestine, the excess is evacuated as watery diarrhoea.
ETEC is another major cause of diarrhoea in infants and children in developing countries, as well as being recognised as the main cause of ‘travellers diarrhoea’ (Doyle and Padhye, 1989). Symptoms include watery diarrhoea, low-grade fever, abdominal cramps, malaise and nausea. In severe cases, the illness resembles cholera, with severe rice-water diarrhoea and associated dehydration. Duration of illness is from three to 21 days (Doyle and Padhye, 1989).
EAEC strains are defined as E. coli strains that to not secrete LT or ST. These strains adhere to cultured human epithelial cells in a characteristic aggregative or “stacked-brick” pattern (Yatsuyanagi et al., 2002). The mechanisms causing enteric disease are not fully understood, however EAEC have been associated with persistent diarrhoea, primarily in infants and children (Desmarchelier and Fegan, 2003).
Following ingestion, EIEC invade epithelial cells of the distal ileum and colon. The bacteria multiply within the cytoplasm of the cells, causing cell destruction and ulceration. Pathogenicity is associated with a plasmid-encoded type III secretory apparatus and other plasmid-encoded virulence factors (Desmarchelier and Fegan, 2003).
EIEC cause a dysenteric illness similar to shigellosis. Along with profuse diarrhoea, symptoms include chills, fever, headache, muscle pain and abdominal cramps. Onset of symptoms is usually rapid (<24 hours), and may last several weeks (Doyle and Padhye, 1989).
The EHEC group of E. coli comprises a subset of Shiga toxin-producing E. coli (STEC). The Shiga toxins (Stx1 and Stx2) are closely related, or identical, to the toxins produced by Shigella dysenteriae. Additional virulence factors allow the organism to attach tightly to intestinal epithelial cells, causing what is commonly referred to as attaching-and-effacing lesions. EHEC infection normally results in diarrhoea like symptoms. Haemorrhagic colitis, an acute illness caused by EHEC organisms, is characterised by severe abdominal pain and diarrhoea. This diarrhoea is initially watery but becomes grossly bloody. Symptoms such as vomiting and low-grade fever may be experienced. The illness is usually self-limiting and lasts for an average of 8 days. The duration of the excretion of EHEC is about one week or less in adults, but it can be longer in children (ICMSF, 1996).
Complications resulting from EHEC infections vary. About 5 per cent of haemorrhagic colitis victims may develop HUS (European Commission, 2000). This involves the rupture of red blood cells (haemolysis), subsequent anaemia, low platelet count and kidney failure. The case-fatality rate of HUS has been reported to be 3–7 per cent (Codex Alimentarius Commission, 2002).
103

Shigella toxins produced by EHEC attack the lining of the blood vessels throughout the body, predominantly affecting the kidney. However other organs such as the brain, pancreas, gut, liver and heart are also affected and may result in further complications such as thrombotic thrombocytopenic purpuria.
Table 5.2 Clinical, pathological and epidemiological characteristics of disease caused by the five principal pathotypes of E. coli (Robins-Brown, 1987)
Pathotype Clinical symptoms Intestinal pathology Susceptible population
ETEC Watery, cholera-like diarrhoea
No notable change Children in developing countries; travellers to those countries
EIEC Bacillary dysentery Inflammation and disruption of the mucosa, mostly of the large intestine
All ages; more common in developing countries
EPEC Non-specific gastroenteritis
Attaching-effacing lesions throughout the intestine
Children under 2 years of age in developing countries
EHEC Bloody diarrhoea “Haemorrhagic colitis”; attaching-effacing lesions confined to the large intestine; necrosis in severe cases
Children and the elderly in developed countries.
EAEC Persistent diarrhoea Inflammation, cytotoxic changes in enterocytes (data from experimental studies)
Children in developing countries; travellers to those countries
Dose-response
EPEC: It is thought that only a few EPEC cells are necessary to cause illness in children (FDA 2003). Volunteer studies in adults demonstrated that illness could be caused by ingesting 10 6–1010 cells with sodium bicarbonate to neutralise stomach acidity (Doyle and Padhye, 1989).
ETEC: Volunteer studies have shown that 108–1010 cells of ETEC are necessary for illness in adults (DuPont et al., 1971), although the infective dose is probably less for infants and children (FDA, 2003).
EIEC: Volunteer studies have shown that 108 EIEC cells are necessary to cause illness in adults, with the infectious dose reduced to 106 when ingested with sodium bicarbonate (DuPont et al., 1971). However, the United States Food and Drug Administration (FDA) suggest that as few as 10 cells may be needed to cause illness in adults, based on the organisms similarity with Shigella (FDA, 2003).
The dose-response relationship for EHEC is complicated by the large number of serotypes and the association of EHEC with a variety of foods. Haas et al. (2000) developed a dose-response relationship for E. coli O157:H7 based on data from a prior animal study undertaken by Pai et al. (1996), which involved oral distraction of bacterial suspension to infant rabbits. The model was validated by comparison with two well-document human outbreaks, one food-borne and the other waterborne. The model estimated that the dose required to result in 50% of the exposed population to become ill was 5 105 organisms. The corresponding probability of illness for the ingestion of 100 organisms was 2.6 10-4.
Dose-response relationships for E. coli O111 and O55 have been developed from human feeding trial data (Haas et al., 1999). The relationship estimated a dose required for 50% of the exposed population to become ill was 2.55 106 and the probability of illness for ingestion of 100 organisms was 3.5 10-4.
Investigations of other known outbreaks of food-borne illness due to E. coli O157:H7 and systematic studies aimed at quantifying the dose–response relationship suggest as few as 1–700 EHEC organisms can cause human illness (FDA, 2003).
104

Host susceptibility
A variety of host factors may be important in the pathogenesis of specific E. coli serotypes. In general, the young and the elderly appear to be more susceptible to pathogenic E. coli infection. Epidemiological studies have identified that children are at higher risk of developing post-diarrhoeal HUS than other age groups (Cummings et al., 2002).
5.1.3 Exposure Assessment
Certain strains of E. coli are known to cause disease in poultry (avian pathogenic E. coli; APEC). These organisms principally result in respiratory tract and systemic illness (Dho-Moulin and Fairbrother, 1999). Infection of the egg yolk can occur during the egg incubation period, usually associated with faecal contamination of the egg surface. This may lead to death of the embryo or mortality of young birds up to 3 weeks following hatching. Illness in birds is associated with decreased growth rate and feed conversion efficiency, significant flock mortality and possible rejection of carcasses at the processing plants due to poor bird health. Studies have demonstrated, however, that E. coli strains isolated from chickens with airsacculitis and cellulitis possess very few of the attributes required to cause disease in humans (Caya et al., 1999).
Although rarely isolated from commercial poultry meat, studies have shown that E. coli O157:H7 can colonise the caeca of experimentally infected chickens for up to 90 days post-inoculation, and have the ability to pass through the colon with faecal excrement (Beery et al., 1985; Schoeni and Doyle, 1994). This suggests chickens have the ability to serve as hosts for E. coli O157:H7 although this is not supported by survey or epidemiological data.
There is very little evidence of the association of human pathogenic E. coli with commercial poultry. Of surveys undertaken, there is only one report of EHEC being isolated, with 4 out of 263 (1.5%) poultry meat samples testing positive (Doyle and Schoeni, 1987). No Australian data is available on the prevalence of EHEC in poultry meat. The majority of studies undertaken have focused on the specific isolation of E. coli O157, however the possibility of contamination with other EHEC pathotypes requires further investigation. Reported isolations of EHEC organisms from poultry meat is summarised in Table 5.3
Table 5.3 Prevalence of EHEC in processed poultry meat.Poultry species Organisms
IsolatedCountry No.
Sampled%
PositiveReference
Chicken (carcass) E. coli O157 UK 1000 ND* (Chapman et al., 1997)Chicken (carcass) E. coli O157:H7 USA 1297 ND (FSIS, 1996a)Turkey (carcass) E. coli O157:H7 USA 1221 ND (FSIS, 1998)Ground chicken E. coli O157:H7 USA 285 ND (FSIS, 1996b)Chicken (carcass) VTEC Canada 200 ND (Read et al., 1990)Chicken (carcass) STEC Australia 432 ND (King and Hornitzky,
2001)Chicken (carcass) STEC New Zealand 36 ND (Brooks et al., 2001)Poultry E. coli O157:H7 USA 263 1.5 (Doyle and Schoeni, 1987)Chicken (cloacal swab
at processing)VTEC Canada 500 ND (Irwin et al., 1989)
*ND = Not Detected
Studies have isolated VTEC/STEC from wild birds including pigeons and seagulls, suggesting these species may be potential vectors in the spread of pathogenic E. coli throughout the environment (Kobayashi et al., 2002; Schmidt et al., 2000; Wallace et al., 1997)
105

5.1.4 Risk Characterisation
Health outcomes following infection with pathogenic E. coli (EHEC in particular) varies significantly, ranging from symptoms of gastroenteritis through to severe illness resulting in hospitalisation, long term sequelae, and death in a proportion of cases.
Generic E. coli is often present on raw poultry meat, and is associated with faecal contamination during processing. However, unlike the normal commensal strains of E. coli, human pathogenic strains such as EHEC have rarely been isolated from poultry. In addition, despite widespread consumption of poultry meat, it has rarely been implicated as a source of food-borne exposure in pathogenic E. coli cases. There has no documented case of food-borne illness due to E. coli associated with consumption of poultry meat in Australia. Pathogenic E. coli are therefore considered a minimal public health and safety risk in regards to consumption of poultry meat, despite the relative severity of illness.
References
Abbar, F. and Kaddar, H.K. (1991) Bacteriological studies on Iraqi milk products. J Appl Bacteriol. 71(6):497-500.
ACMF (1996) Report on poultry. Advisory Committee on the Microbiological Safety of Food; HMSO, London.
ACMF (2003) National biosecurity manual for meat chicken farming. Australian Chicken Meat Federation, Sydney, Australia.
Adachi, J.A., Mathewson, J.J., Jiang, Z.D., Ericsson, C.D. and DuPont, H.L. (2002) Enteric pathogens in Mexican sauces of popular restaurants in Guadalajara, Mexico, and Houston, Texas. Ann.Intern.Med 136(12):884-887.
Adak, G.K., Long, S.M. and O'Brien, S.J. (2002) Trends in indigenous food-borne disease and deaths, England and Wales: 1992 to 2000. Gut 51(6):832-841.
Anon. (1984) Update: gastrointestinal illness associated with imported semi-soft cheese. Morbidity and Mortality Weekly Review 33(2):22.
Anon (1998) Zoonotic non-O157 shiga toxin-producion Escherichia coli (STEC). Report of a WHO Scientific Working Group meeting. World Health Organization, Geneva, Switzerland.
Anon. (2002) OzFoodNet: enhancing food-borne disease surveillance across Australia: quarterly report, April to June 2002. Commun Dis Intell. 26(4):546-551.
Anon. (2002) OzFoodNet: enhancing food-borne disease surveillance across Australia: quarterly report, October to December 2001. Commun Dis Intell. 26(2):248-252.
Anon. (2002) OzFoodNet: enhancing food-borne disease surveillance across Australia: quarterly report, July to September 2001. Commun Dis Intell. 26(1):22-27.
Anon. (2003) Foodborne disease in Australia: incidence, notifications and outbreaks. Annual report of the OzFoodNet network, 2002. Commun Dis Intell. 27(2):209-243.
Anon. (2003) OzFoodNet: Enhancing food-borne disease surveillance across Australia: quarterly report, July to September 2002. Commun Dis Intell. 27(1):89-93.
Anon. (2004) OzFoodNet: enhancing food-borne disease surveillance across Australia: quarterly report, 1 October to 31 December 2003. Commun Dis Intell. 28(1):86-89.
Araújo, V.S., Pagliares, V.A., Queiroz, M.L.P. and Freitas-Almeida, A.C. (2002) Occurrence of Staphylococcus and enteropathogens in soft cheese commercialized in the city of Rio de Janeiro, Brazil. Journal of Applied Microbiology 92(6):1172-1177.
Arnold, K.W. and Kaspar, C.W. (1995) Starvation- and stationary-phase-induced acid tolerance in Escherichia coli O157:H7. Appl Environ.Microbiol 61(5):2037-2039.
Arumugaswamy, R.K., Rusul, G., Hamid, S.N.A. and Cheah, C.T. (1995) Prevalence of Salmonella in raw and cooked foods in Malaysia. Food Microbiology 12(1):3-8.
106
Ashbolt, R., Bell, R., Crerar, S., Dalton, C., Givney, R., Gregory, J., Hall, G., Hardy, B., Hogg, G., Hundy, R., Kirk, M., Lalor, K., McKay, I., Madden, V., Markey, P., Meuleners, L., Merrett, T., Millard, G., Raupach, J., Roche, P., Sarna, M., Shadbolt, C., Stafford, R., Tomaska, N., Unicomb, L. and Williams, C. (2002) OzFoodNet: enhancing food-borne disease surveillance across Australia: quarterly report, January to March 2002. Commun Dis Intell. 26(3):430-435.
Ashbolt, R., Givney, R., Gregory, J.E., Hall, G., Hundy, R., Kirk, M., McKay, I., Meuleners, L., Millard, G., Raupach, J., Roche, P., Prasopa-Plaizier, N., Sama, M.K., Stafford, R., Tomaska, N., Unicomb, L. and Williams, C. (2002) Enhancing food-borne disease surveillance across Australia in 2001: the OzFoodNet Working Group. Commun Dis Intell. 26(3):375-406.
Bailey, J.S., Stern, N.J., Fedorka-Cray, P., Craven, S.E., Cox, N.A., Cosby, D.E., Ladely, S. and Musgrove, M.T. (2001) Sources and movement of Salmonella through integrated poultry operations: a multistate epidemiological investigation. J Food Prot. 64(11):1690-1697.
Beery, J.T., Doyle, M.P. and Schoeni, J.L. (1985) Colonization of chicken cecae by Escherichia coli associated with hemorrhagic colitis. Appl Environ.Microbiol 49(2):310-315.
Beli, E., Duraku, E. and Telo, A. (2001) Salmonella serotypes isolated from chicken meat in Albania. Int J Food Microbiol 71(2-3):263-266.
Beli, E., Telo, A. and Duraku, E. (2001) Salmonella serotypes isolated from turkey meat in Albania. Int J Food Microbiol 63(1-2):165-167.
Bell, C. and Kyriakides, A. (1998) E. coli: a practical approach to the organism and its control in foods. Blackwell Science, Oxford, UK.
Bell, C. and Kyriakides, A. (2002) Salmonella: a practical approach to the organism and its control in foods. Blackwell Science, Oxford, UK.
Benjamin, M.M. and Datta, A.R. (1995) Acid tolerance of enterohemorrhagic Escherichia coli. Applied and Environmental Microbiology 61(4):1669-1672.
Beutin, L., Geier, D., Zimmermann, S. and Karch, H. (1995) Virulence markers of Shiga-like toxin-producing Escherichia coli strains originating from healthy domestic animals of different species. J Clin Microbiol 33(3):631-635.
Blanco, J., Blanco, M., Blanco, J.E., Mora, A., Gonzalez, E.A., Bernardez, M.I., Alonso, M.P., Coira, A., Rodriguez, A., Rey, J., Alonso, J.M. and Usera, M.A. (2003) Verotoxin-producing Escherichia coli in Spain: prevalence, serotypes, and virulence genes of O157:H7 and non-O157 VTEC in ruminants, raw beef products, and humans. Exp.Biol Med (Maywood.) 228(4):345-351.
Blumer, C., Roche, P., Spencer, J., Lin, M., Milton, A., Bunn, C., Gidding, H., Kaldor, J., Kirk, M., Hall, R., Della-Porta, T., Leader, R. and Wright, P. (2003) Australia's notifiable diseases status, 2001: annual report of the National Notifiable Diseases Surveillance System. Commun Dis Intell. 27(1):1-78.
Bonardi, S., Brindani, F., Pizzin, G., Lucidi, L., D'Incau, M., Liebana, E. and Morabito, S. (2003) Detection of Salmonella spp., Yersinia enterocolitica and verocytotoxin-producing Escherichia coli O157 in pigs at slaughter in Italy. Int J Food Microbiol 85(1-2):101-110.
Bouvet, J., Bavai, C., Rossel, R., Le Roux, A., Montet, M.P., Ray-Gueniot, S., Mazuy, C., Arquilliere, C. and Vernozy-Rozand, C. (2001) Prevalence of verotoxin-producing Escherichia coli and E. coli O157:H7 in pig carcasses from three French slaughterhouses. Int J Food Microbiol 71(2-3):249-255.
Bouvet, J., Montet, M.P., Rossel, R., Le Roux, A., Bavai, C., Ray-Gueniot, S., Mazuy, C., Atrache, V. and Vernozy-Rozand, C. (2002) Effects of slaughter processes on pig carcass contamination by verotoxin-producing Escherichia coli and E. coli O157:H7. Int J Food Microbiol 77(1-2):99-108.
Bouvet, J., Bavai, C., Rossel, R., Le Roux, A., Montet, M.P., Ray-Gueniot, S., Mazuy, C., Atrache, V. and Vernozy-Rozand, C. (2002) Effects of cutting process on pork meat contamination by verotoxin-producing Escherichia coli (VTEC) and E. coli O157:H7. Int J Food Microbiol 77(1-2):91-97.
Bouvet, J., Montet, M.P., Rossel, R., Le Roux, A., Bavai, C., Ray-Gueniot, S., Mazuy, C., Atrache, V. and Vernozy-Rozand, C. (2002) Prevalence of verotoxin-producing Escherichia coli (VTEC) and E. coli O157:H7 in French pork. J Appl Microbiol 93(1):7-14.
Brenner, F.W., Villar, R.G., Angulo, F.J., Tauxe, R. and Swaminathan, B. (2000) Salmonella nomenclature. J Clin Microbiol 38(7):2465-2467.
107
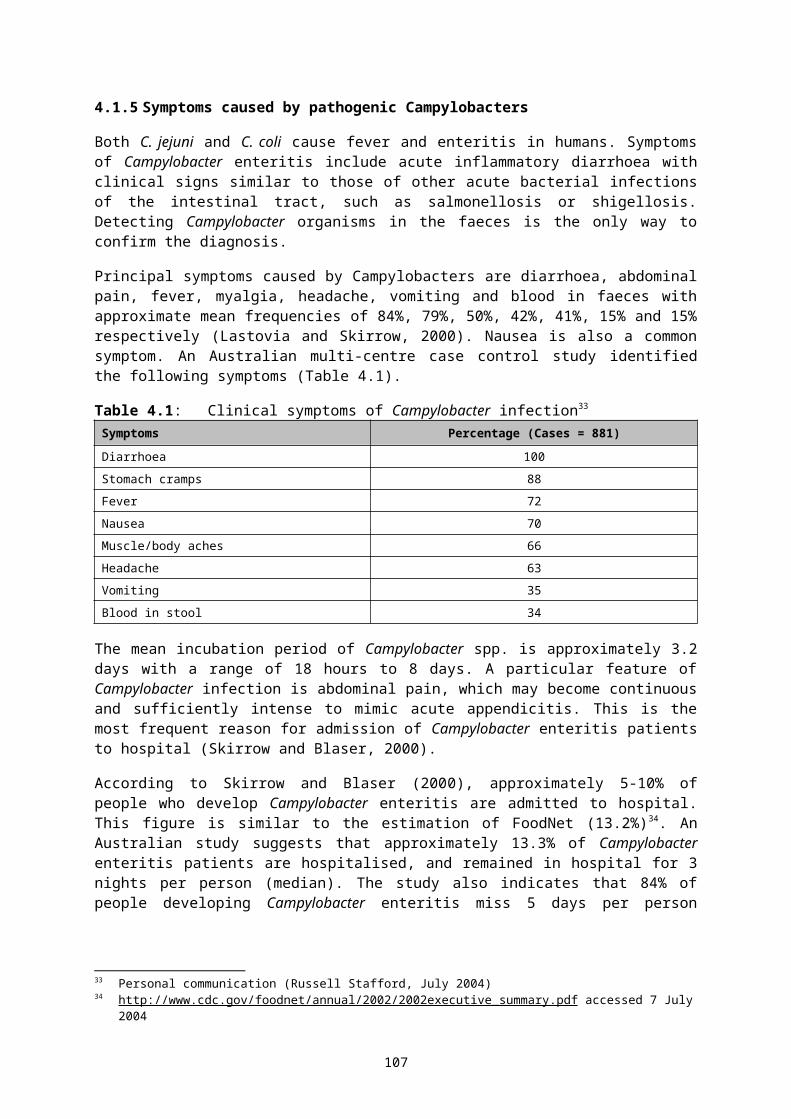
Brockmann, S.O., Piechotowski, I. and Kimmig, P. (2004) Salmonella in sesame seed products. J Food Prot. 67(1):178-180.
Brooks, H.J., Mollison, B.D., Bettelheim, K.A., Matejka, K., Paterson, K.A. and Ward, V.K. (2001) Occurrence and virulence factors of non-O157 Shiga toxin-producing Escherichia coli in retail meat in Dunedin, New Zealand. Lett Appl Microbiol 32(2):118-122.
Bryan, F.L. and Doyle, M.P. (1995) Health risks and consequences of Salmonella and Campylobacter jejuni in raw poultry. J Food Prot. 58(3):326-344.
Buhr, R., Hinton, A. and Ingram, K. (2002) Carcass Salmonella and Campylobacter contamination resulting from crop content: Spillage during evisceration can be removed by carcass washing. Southern Poultry Science Society Meeting. Accessed on 11 August 2002.
Carli, K.T., Eyigor, A. and Caner, V. (2001) Prevalence of Salmonella serovars in chickens in Turkey. J Food Prot. 64(11):1832-1835.
Caya, F., Fairbrother, J.M., Lessard, L. and Quessy, S. (1999) Characterization of the risk to human health of pathogenic Escherichia coli isolates from chicken carcasses. J Food Prot. 62(7):741-746.
CFIA (2000) Canadian microbiological baseline survey of chicken broiler and young turkey carcasses, June 1997 - May 1998. Canadian Food Inspection Agency, Canada.
Chapman, P.A. and Mitchelmore, D.L. (1988) A two-year survey of the incidence of heat-labile enterotoxin-producing Escherichia coli and other enteric pathogens in travellers returning to the Sheffield area. Epidemiol Infect 101(2):239-247.
Chapman, P.A., Siddons, C.A., Gerdan Malo, A.T. and Harkin, M.A. (1997) A 1-year study of Escherichia coli O157 in cattle, sheep, pigs and poultry. Epidemiol Infect 119(2):245-250.
Codex (2002) Risk profile for enterohemorragic E. coli including the identification of commodities of concern, including sprouts, ground beef and pork (CX/FH 03/5-Add .4). Codex Alimentarius Commission, Rome, Italy. ftp://ftp.fao.org/codex/ccfh35/fh0305de.pdf.
Cogan, T.A. and Humphrey, T.J. (2003) The rise and fall of Salmonella Enteritidis in the UK. J Appl Microbiol 94 Suppl:114S-119S.
Cornick, N.A., Booher, S.L., Casey, T.A. and Moon, H.W. (2000) Persistent colonization of sheep by Escherichia coli O157:H7 and other E. coli pathotypes. Appl Environ.Microbiol 66(11):4926-4934.
Cory, J.E.L., Allen, V.M., Hudson, W.R., Breslin, M.F. and Davies, R.H. (2002) Sources of Salmonella on broiler carcasses during transportation and processing: modes of contamination and methods for control. J Appl Microbiol 92:424-432.
Crerar, S.K., Nicholls, T.J. and Barton, M.D. (1999) Multi-resistant Salmonella Typhimurium DT104--implications for animal industries and the veterinary profession. Aust Vet J 77(3):170-171.
Crump, J.A., Griffin, P.M. and Angulo, F.J. (2002) Bacterial contamination of animal feed and its relationship to human food-borne illness. Clin Infect Dis 35(7):859-865.
Cummings, K.C., Mohle-Boetani, J.C., Werner, S.B. and Vugia, D.J. (2002) Population-based trends in pediatric hemolytic uremic syndrome in California, 1994-1999: substantial underreporting and public health implications. Am J Epidemiol 155(10):941-948.
Curran, M., Harvey, B., Crerar, S., Oliver, G., D'Souza, R., Myint, H., Rann, C. and Andrews, R. (1997) Australia's notifiable diseases status, 1996. Annual report of the National Notifiable Diseases Surveillance System. Commun Dis Intell. 21(20):281-307.
D'Aoust, J.Y. (1994) Salmonella and the international food trade. Int J Food Microbiol 24(1-2):11-31.
D'Aoust, J.Y. (1997) Salmonella species. In: Doyle, M.P., Beuchat, L.R., and Montville, T.J. eds. Food Microbiology: fundamentals and frontiers. ASM Press, Washington DC, USA, pp129-158.
da Silva, Z.N., Cunha, A.S., Lins, M.C., de AM, C.L., Almeida, A.C. and Queiroz, M.L. (2001) Isolation and serological identification of enteropathogenic Escherichia coli in pasteurized milk in Brazil. Rev Saude Publica 35(4):375-379.
Dalton, C.B., Mintz, E.D., Wells, J.G., Bopp, C.A. and Tauxe, R.V. (1999) Outbreaks of enterotoxigenic Escherichia coli infection in American adults: a clinical and epidemiologic profile. Epidemiol Infect 123(1):9-16.
108

Dalton, C.B., Gregory, J., Kirk, M.D., Stafford, R.J., Givney, R., Kraa, E. and Gould, D. (2004) Foodborne disease outbreaks in Australia, 1995 to 2000. Commun Dis Intell. 28(2):211-224.
Davies, R.H. and Wray, C. (1997) Distribution of Salmonella contamination in ten animal feedmills. Vet Microbiol 57(2-3):159-169.
Desmarchelier, P.M. and Fegan, N. (2003) Enteropathogenic Escherichia coli. In: Hocking, A.D. eds. Foodborne microorganisms of public health significance. Sixth ed, Australian Institute of Food Science and Technology (NSW Branch), Sydney, Australia, pp267-310.
Dho-Moulin, M. and Fairbrother, J.M. (1999) Avian pathogenic Escherichia coli (APEC). Vet Res 30(2-3):299-316.
Dominguez, C., Gomez, I. and Zumalacarregui, J. (2002) Prevalence of Salmonella and Campylobacter in retail chicken meat in Spain. Int J Food Microbiol 72(1-2):165-168.
Doyle, M.P. and Schoeni, J.L. (1984) Survival and growth characteristics of Escherichia coli associated with hemorrhagic colitis. Appl Environ.Microbiol 48(4):855-856.
Doyle, M.P. and Schoeni, J.L. (1987) Isolation of Escherichia coli O157:H7 from retail fresh meats and poultry. Appl Environ.Microbiol 53(10):2394-2396.
Doyle, M.P. and Padhye, V.V. (1989) Escherichia coli. In: Doyle, M.P. eds. Foodborne bacterial pathogens. Marcel Dekker Inc, New York, USA, pp235-281.
Doyle, M.P., Zhao, T., Meng, J. and Zhao, S. (1997) Escherichia coli O157H:7. In: Doyle, M.P., Beuchat, L.R., and Montville, T.J. eds. Food Microbiology: Fundamentals and frontiers. ASM Press, Washington, USA, pp171-191.
Duffy, G., Cloak, O.M., Sheridan, J.J., Blair, I.S. and McDowell, D.A. (1999) The development of a combined surface adhesion and polymerase chain reaction technique in the rapid detection of Listeria monocytogenes in meat and poultry. Int J Food Microbiol 49(3):151-159.
Duffy, G., Cloak, O.M., O'Sullivan, M.G., Guillet, A., Sheridan, J.J., Blair, I.S. and McDowell, D.A. (1999) The incidence and antibiotic resistance profiles of Salmonella spp. on Irish retail meat products. Food Microbiology 16(6):623-631.
Duffy, L.L., Grau, F.H. and Vanderlinde, P.B. (2000) Acid resistance of enterohaemorrhagic and generic Escherichia coli associated with food-borne disease and meat. Int J Food Microbiol 60(1):83-89.
DuPont, H.L., Formal, S.B., Hornick, R.B., Snyder, M.J., Libonati, J.P., Sheahan, D.G., LaBrec, E.H. and Kalas, J.P. (1971) Pathogenesis of Escherichia coli diarrhea. N Engl.J Med 285(1):1-9.
Elliott, E.J., Robins-Browne, R.M., O'Loughlin, E.V., Bennett-Wood, V., Bourke, J., Henning, P., Hogg, G.G., Knight, J., Powell, H. and Redmond, D. (2001) Nationwide study of haemolytic uraemic syndrome: clinical, microbiological, and epidemiological features. Arch.Dis Child 85(2):125-131.
Estrada-Garcia, T., Cerna, J.F., Thompson, M.R. and Lopez-Saucedo, C. (2002) Faecal contamination and enterotoxigenic Escherichia coli in street-vended chili sauces in Mexico and its public health relevance. Epidemiol Infect 129(1):223-226.
European Commission (2000) Opinion of the scientific committee on veterinary measures relating to public health on food-borne zoonoses. Health and Consumer Protection Directorate-General, European Commission, Brussels, Belgium.
Fantelli, K. and Stephan, R. (2001) Prevalence and characteristics of shigatoxin-producing Escherichia coli and Listeria monocytogenes strains isolated from minced meat in Switzerland. Int J Food Microbiol 70(1-2):63-69.
FAO/WHO (2002) Risk Assessments of Salmonella in eggs and broiler chickens. Food and Agriculture Organization/World Health Organization, Geneva, Switzerland. ftp://ftp.fao.org/docrep/fao/005/y4392e/y4392e00.pdf.
FDA (2001) FDA survey of imported fresh produce . U.S. Food and Drug Administration, USA.
FDA (2003) The bad bug book (Foodborne Pathogenic Microorganisms and Natural Toxins Handbook ). US Food and Drug Administration. http://www.cfsan.fda.gov/~mow/intro.html. Accessed on 8 August 2004.
109

FDA/FSIS. (2003) Quantitative assessment of relative risk to public health from food-borne Listeria monocytogenes among selected categories of ready-to-eat foods. Food and Drug Administration, US Dept of Health and Human Services; Food Safety Inspection Service, United States Department of Agriculture, USA.
Fegan, N. and Desmarchelier, P. (1999) Shiga toxin-producing Escherichia coli in sheep and pre-slaughter lambs in eastern Australia. Lett Appl Microbiol 28(5):335-339.
Fegan, N. and Desmarchelier, P. (2002) Comparison between human and animal isolates of Shiga toxin-producing Escherichia coli O157 from Australia. Epidemiol Infect 128(3):357-362.
FSA (2001) UK-wide survey of Salmonella and Campylobacter contamination of fresh and frozen chicken on retail sale. Food Standards Agency, London, UK.
FSA (2004) Report on the survey of Salmonella contamination of UK produced shell eggs retail sale. Food Standards Agency, London, UK.
FSIS (1996) Nationwide broiler chicken microbiological bastline data collection program, July 1994 - June 1995. Food Safety Inspection Service, United States Department of Agriculture, USA.
FSIS (1996) Nationwide raw ground chicken microbiological survey. Food Safety Inspection Service, United States Department of Agriculture, USA.
FSIS (1998) Nationwide young turkey microbiological baseline data collection program, August 1996 - July 1997. Food Safety Inspection Service, United States Department of Agriculture, USA.
Gerba, C.P., Rose, J.B. and Haas, C.N. (1996) Sensitive populations: who is at the greatest risk? Int J Food Microbiol 30(1-2):113-123.
Grauke, L.J., Kudva, I.T., Yoon, J.W., Hunt, C.W., Williams, C.J. and Hovde, C.J. (2002) Gastrointestinal tract location of Escherichia coli O157:H7 in ruminants. Appl Environ.Microbiol 68(5):2269-2277.
Gross, R.J. and Rowe, B. (1985) Escherichia coli diarrhoea. J Hyg.(Lond) 95(3):531-550.
Guard-Petter, J. (2001) The chicken, the egg and Salmonella enteritidis. Environ.Microbiol 3(7):421-430.
Haas, C.N., Thayyar-Madabusi, A., Rose, J.B. and Gerba, C.P. (2000) Development of a dose-response relationship for Escherichia coli O157:H7. Int J Food Microbiol 56(2-3):153-159.
Hald, T., Vose, D., Wegener, H.C. and Koupeev, T. (2004) A Bayesian approach to quantify the contribution of animal-food sources to human salmonellosis. Risk Anal. 24(1):255-269.
Hall, G.V. (2003) Gastroenteritis survey and food-borne disease in Australia 2002. Working paper series National Centre for Epidemiology and Population Health, Australian National University, Canberra, ACT.
Hall, R., Shaw, D., Lim, I., Murphy, F., Davos, D., Lanser, J., Delroy, B., Tribe, I., Holland, R. and Carman, J. (1996) A cluster of listeriosis cases in South Australia. Commun Dis Intell. 20(21):465.
Harrison, W.A., Griffith, C.J., Tennant, D. and Peters, A.C. (2001) Incidence of Campylobacter and Salmonella isolated from retail chicken and associated packaging in South Wales. Lett Appl Microbiol 33(6):450-454.
Hazariwala, A., Sanders, Q., Hudson, C.R., Hofacre, C., Thayer, S.G. and Maurer, J.J. (2002) Distribution of staphylococcal enterotoxin genes among Staphylococcus aureus isolates from poultry and humans with invasive staphylococcal disease. Avian Dis 46(1):132-136.
Helms, M., Vastrup, P., Gerner-Smidt, P. and Molbak, K. (2003) Short and long term mortality associated with food-borne bacterial gastrointestinal infections: registry based study. BMJ 326(7385):357.
Heres, L., Engel, B., Urlings, H.A., Wagenaar, J.A. and van Knapen, F. (2004) Effect of acidified feed on susceptibility of broiler chickens to intestinal infection by Campylobacter and Salmonella. Vet Microbiol 99(3-4):259-267.
Heuvelink, A.E., Zwartkruis-Nahuis, J.T., Beumer, R.R. and de Boer, E. (1999) Occurrence and survival of verocytotoxin-producing Escherichia coli O157 in meats obtained from retail outlets in The Netherlands. J Food Prot. 62(10):1115-1122.
Heuzenroeder, M.W., Murray, C.J., Dalcin, R.M. and Barton, M. (2001) Molecular basis of benign colonisation of Salmonella Sofia in Chickens. Rural Industries Research and Development Corporation, Barton, ACT.
Hohmann, E.L. (2001) Nontyphoidal salmonellosis. Clin Infect Dis 32(2):263-269.
110

Humphrey, T.J. and Lanning, D.G. (1987) Salmonella and Campylobacter contamination of broiler chicken carcasses and scald tank water: the influence of water pH. J Appl Bacteriol. 63(1):21-25.
ICMSF. (1996) Salmonellae. In: Roberts, T.A., Baird-Parker, A.C., and Tompkin, R.B. eds. Microorganisms in foods 5: Microbiological specifications of food pathogens. First ed, Blackie Academic and Professional, London, UK, pp217-264.
ICMSF. (1996) Intestinally pathogenic Escherichia coli. In: Roberts, T.A., Baird-Parker, A.C., and Tompkin, R.B. eds. Microorganisms in foods 5: Microbiological specifications of food pathogens. First ed, Blackie Academic and Professional, London, UK, pp217-264.
Irwin, R.J., McEwen, S.A., Clarke, R.C. and Meek, A.H. (1989) The prevalence of verocytotoxin-producing Escherichia coli and antimicrobial resistance patterns of nonverocytotoxin-producing Escherichia coli and Salmonella in Ontario broiler chickens. Can.J Vet Res 53(4):411-418.
Jay, S., Davos, D., Dundas, M., Frankish, E. and Lightfoot, D. (2003) Salmonella. In: Hocking, A.D. eds. Foodborne microorganisms of public health significance. 6 ed, Australian Institute of Food Science and Technology, NSW Branch, Food Microbiology Group, Waterloo, NSW, pp207-266.
Jay, S.L., Comar, D. and Govenlock, L.D. (1999) A video study of Australian domestic food handling practices. J Food Prot. 62(11):1285-1296.
Kessel, A.S., Gillespie, I.A., O'Brien, S.J., Adak, G.K., Humphrey, T.J. and Ward, L.R. (2001) General outbreaks of infectious intestinal disease linked with poultry, England and Wales, 1992-1999. Commun Dis Public Health 4(3):171-177.
Khan, A., Yamasaki, S., Sato, T., Ramamurthy, T., Pal, A., Datta, S., Chowdhury, N.R., Das, S.C., Sikdar, A., Tsukamoto, T., Bhattacharya, S.K., Takeda, Y. and Nair, G.B. (2002) Prevalence and genetic profiling of virulence determinants of non-O157 Shiga toxin-producing Escherichia coli isolated from cattle, beef, and humans, Calcutta, India. Emerg.Infect Dis 8(1):54-62.
Kimura, A.C., Reddy, V., Marcus, R., Cieslak, P.R., Mohle-Boetani, J.C., Kassenborg, H.D., Segler, S.D., Hardnett, F.P., Barrett, T. and Swerdlow, D.L. (2004) Chicken consumption is a newly identified risk factor for sporadic Salmonella enterica serotype Enteritidis infections in the United States: a case-control study in FoodNet sites. Clin Infect Dis 38 Suppl 3:S244-S252.
King, S. and Hornitzky, M. (2001) Second microbiological survey of primary poultry processors in New South Wales 2001. NSW Poultry Processing Consultative Committee of Safefood Production NSW, Sydney.
King, S., Hornitzky, M. and Sergeant, E. (2001) Microbiological baseline survey of primary poultry processors in New South Wales 1999. NSW Poultry Processing Consultative Committee of Safefood Production NSW, Sydney.
Kirk, M. (2001) OzFoodNet: enhancing food-borne disease surveillance across Australia: quarterly report, April-June 2001. Commun Dis Intell. 25(4):270-272.
Kirk, M. (2001) OzFoodNet: enhancing food-borne disease surveillance across Australia: quarterly report January to March 2001. Commun Dis Intell. 25(3):103-106.
Kobayashi, H., Pohjanvirta, T. and Pelkonen, S. (2002) Prevalence and characteristics of intimin- and Shiga toxin-producing Escherichia coli from gulls, pigeons and broilers in Finland. J Vet Med Sci 64(11):1071-1073.
Lake, R., Hudson, A. and Cressey, P. (2002) Risk profile: Salmonella (non-typhoid) in poultry (whole and pieces). New Zealand Food Safety Authority, Christchurch, New Zealand.
Lake, R., Hudson, A. and Cressey, P. (2002) Risk Profile: Shiga toxin-producing Escherichia coli in red meat and meat products. Institute of Environmental Science and Research Limited, Christchurch, New Zealand.
Lake, R., Hudson, A. and Cressey, P. (2003) Risk Profile: Shiga-like toxin producing Escherichia coli in uncooked comminuted fermented meat products. Institute of Environmental Science and Research Limited, Christchurch, New Zealand.
Lammerding, A.M., Garcia, M.M., Mann, E.D., Robinson, M.Y., Doward, W.J., Truscott, R.B. and Tittiger, F. (1988) Prevalence of Salmonella and thermophilic Campylobacter in fresh pork, beef, veal and poultry in Canada. J Food Prot. 51:47-52.
111

Leung, P.H., Yam, W.C., Ng, W.W. and Peiris, J.S. (2001) The prevalence and characterization of verotoxin-producing Escherichia coli isolated from cattle and pigs in an abattoir in Hong Kong. Epidemiol Infect 126(2):173-179.
Lin, M., Roche, P., Spencer, J., Milton, A., Wright, P., Witteveen, D., Leader, R., Merianos, A., Bunn, C., Gidding, H., Kaldor, J., Kirk, M., Hall, R. and Della-Porta, T. (2002) Australia's notifiable diseases status, 2000. Annual report of the National Notifiable Diseases Surveillance System. Commun Dis Intell. 26(2):118-203.
MacDonald, K.L., Eidson, M., Strohmeyer, C., Levy, M.E., Wells, J.G., Puhr, N.D., Wachsmuth, K., Hargrett, N.T. and Cohen, M.L. (1985) A multistate outbreak of gastrointestinal illness caused by enterotoxigenic Escherichia coli in imported semisoft cheese. J Infect Dis 151(4):716-720.
Makino, S.I., Kii, T., Asakura, H., Shirahata, T., Ikeda, T., Takeshi, K. and Itoh, K. (2000) Does Enterohemorrhagic Escherichia coli O157:H7 Enter the Viable but Nonculturable State in Salted Salmon Roe? Applied and Environmental Microbiology 66(12):5536-5539.
Mann, E.D. and McNabb, G.D. (1984) Prevalence of Salmonella contamination in market-ready geese in Manitoba. Avian Dis 28(4):978-983.
Massa, S., Goffredo, E., Altieri, C. and Natola, K. (1999) Fate of Escherichia coli O157:H7 in unpasteurized milk stored at 8 degrees C. Lett Appl Microbiol 28(1):89-92.
McCullough, N. and Eisele.C.W. (1951) Experimental human salmonellosis. IV. Pathogenicity of strains of Salmonella pullorum obtained from spray-dried whole egg. J Infect Dis 89(3):259-265.
McCullough, N. and Eisele.C.W. (1951) Experimental human salmonellosis. III. Pathogenicity of strains of Salmonella newport, Salmonella derby, and Salmonella bareilly obtained from spray-dried whole egg. J Infect Dis 89(3):209-213.
McCullough, N. and Eisele.C.W. (1951) Experimental human salmonellosis. I. Pathogenicity of strains of Salmonella meleagridis and Salmonella anatum obtained from spray-dried whole egg. J Infect Dis 88(3):278-289.
McCullough, N. and Eisele.C.W. (1951) Experimental human salmonellosis. II. Immunity studies following experimental illness with Salmonella meleagridis and Salmonella anatum. J Immunol. 66(5):595-608.
Mead, P.S. and Griffin, P.M. (1998) Escherichia coli O157:H7. Lancet 352(9135):1207-1212.
Mead, P.S., Slutsker, L., Griffin, P.M. and Tauxe, R.V. (1999) Food-related illness and death in the united states reply to dr. hedberg. Emerg.Infect Dis 5(6):841-842.
Mead, P.S., Slutsker, L., Dietz, V., McCaig, L.F., Bresee, J.S., Shapiro, C., Griffin, P.M. and Tauxe, R.V. (1999) Food-related illness and death in the United States. Emerg.Infect Dis 5(5):607-625.
Midgley, J., Fegan, N. and Desmarchelier, P. (1999) Dynamics of Shiga toxin-producing Escherichia coli (STEC) in feedlot cattle. Lett Appl Microbiol 29(2):85-89.
Millard, G. and Rockliff, S. (2000) Microbiological status of raw chilled chicken, July 1999 - August 2000. ACT Health Protection Service, Canberra, ACT.
Mitsuda, T., Muto, T., Yamada, M., Kobayashi, N., Toba, M., Aihara, Y., Ito, A. and Yokota, S. (1998) Epidemiological study of a food-borne outbreak of enterotoxigenic Escherichia coli O25:NM by pulsed-field gel electrophoresis and randomly amplified polymorphic DNA analysis. J Clin Microbiol 36(3):652-656.
Naimi, T.S., Wicklund, J.H., Olsen, S.J., Krause, G., Wells, J.G., Bartkus, J.M., Boxrud, D.J., Sullivan, M., Kassenborg, H., Besser, J.M., Mintz, E.D., Osterholm, M.T. and Hedberg, C.W. (2003) Concurrent outbreaks of Shigella sonnei and enterotoxigenic Escherichia coli infections associated with parsley: implications for surveillance and control of food-borne illness. J Food Prot. 66(4):535-541.
Nataro, J.P. and Levine, M.M. (1994) Escherichia coli diseases in humans. In: Gyles, C.L. eds. Escherichia coli in domestic animals and humans. CAB International, Wallingford, UK, pp285-333.
Nataro, J.P. and Kaper, J.B. (1998) Diarrheagenic Escherichia coli. Clin Microbiol Rev 11(1):142-201.National Enteric Pathogens Surviellance Scheme (2002) Human anual report 2001. University of Melbourne,
Melbourne, Australia.
112
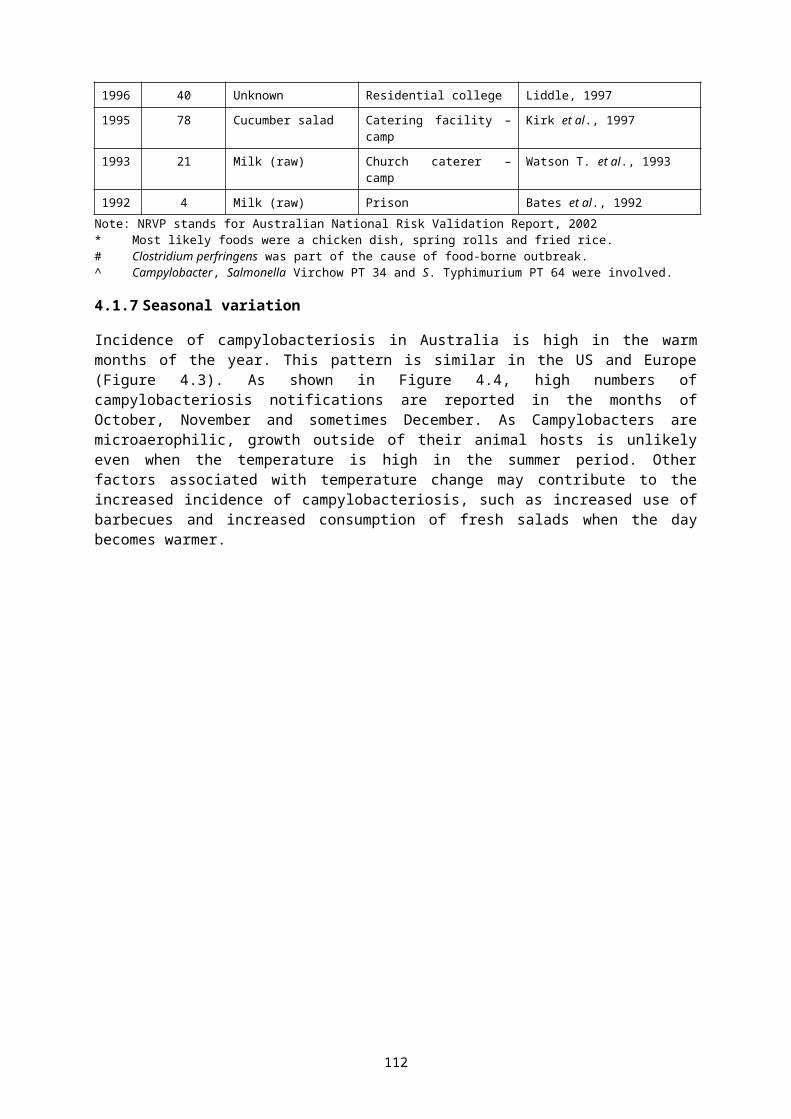
Neumeyer, K., Ross, T. and McMeekin, T.A. (1997) Development of a predictive model to describe the effects of temperature and water activity on the growth of spoilage pseudomonads. Int J Food Microbiol 38(1):45-54.
Norazah, A., Rahizan, I., Zainuldin, T., Rohani, M.Y. and Kamel, A.G. (1998) Enteropathogenic Escherichia coli in raw and cooked food. Southeast Asian J Trop.Med Public Health 29(1):91-93.
O'Brien, E., D'Souza, R., Gilroy, N., Burgess, M., Lister, S., McIntyre, P., Torvaldsen, S., Moser, K. and Milton, A. (1999) Australia's notifiable diseases status, 1997. Annual report of the National Notifiable Diseases Surveillance System. Commun Dis Intell. 23(1):1-27.
O'Donnell, E.T. (1995) The incidence of Salmonella and Listeria in raw milk from farm bulk tanks in England and Wales. Journal of the Society of Dairy Technology 18:25-29.
Olsen, S.J., MacKinnon, L.C., Goulding, J.S., Bean, N.H. and Slutsker, L. (2000) Surveillance for food-borne-disease outbreaks--United States, 1993-1997. MMWR CDC Surveill Summ. 49(1):1-62.
Olsen, S.J., Bishop, R., Brenner, F.W., Roels, T.H., Bean, N., Tauxe, R.V. and Slutsker, L. (2001) The changing epidemiology of salmonella: trends in serotypes isolated from humans in the United States, 1987-1997. J Infect Dis 183(5):753-761.
Olsvik, Ø., Wasteson, Y., Lund, A. and Hornes, E. (1991) Pathogenic Escherichia coli found in food. Int J Food Microbiol 12(1):103-113.
OzFoodNet. (2004) Foodborne disease investigations across Australia: Annual report of the OzFoodNet network, 2003. Commun Dis Intell. 28(3):359-389.
Pai, C.H., Kelly, J.K. and Meyers, G.L. (1986) Experimental infection of infant rabbits with verotoxin-producing Escherichia coli. Infect Immun. 51(1):16-23.
Parma, A.E., Sanz, M.E., Blanco, J.E., Blanco, J., Vinas, M.R., Blanco, M., Padola, N.L. and Etcheverria, A.I. (2000) Virulence genotypes and serotypes of verotoxigenic Escherichia coli isolated from cattle and foods in Argentina. Importance in public health. Eur J Epidemiol 16(8):757-762.
Paton, A.W., Ratcliff, R.M., Doyle, R.M., Seymour-Murray, J., Davos, D., Lanser, J.A. and Paton, J.C. (1996) Molecular microbiological investigation of an outbreak of hemolytic-uremic syndrome caused by dry fermented sausage contaminated with Shiga-like toxin-producing Escherichia coli. J Clin Microbiol 34(7):1622-1627.
Paton, J.C. and Paton, A.W. (1998) Pathogenesis and diagnosis of Shiga toxin-producing Escherichia coli infections. Clin Microbiol Rev 11(3):450-479.
Phillips, D., Sumner, J., Alexander, J.F. and Dutton, K.M. (2001) Microbiological quality of Australian beef. J Food Prot. 64(5):692-696.
Phillips, D., Sumner, J., Alexander, J.F. and Dutton, K.M. (2001) Microbiological quality of Australian sheep meat. J Food Prot. 64(5):697-700.
Pierard, D., Van Damme, L., Moriau, L., Stevens, D. and Lauwers, S. (1997) Virulence factors of verocytotoxin-producing Escherichia coli isolated from raw meats. Appl Environ.Microbiol 63(11):4585-4587.
Plummer, R.A.S., Blissett, S.J. and Dodd, C.E.R. (1995) Salmonella contamination of retail chicken products sold in the UK. Journal of Food Protection 58(8):-846.
Pommepuy, M., Butin, M., Derrien, A., Gourmelon, M., Colwell, R.R. and Cormier, M. (1996) Retention of enteropathogenicity by viable but nonculturable Escherichia coli exposed to seawater and sunlight. Applied and Environmental Microbiology 62(12):4621-4626.
Pradel, N., Livrelli, V., De Champs, C., Palcoux, J.B., Reynaud, A., Scheutz, F., Sirot, J., Joly, B. and Forestier, C. (2000) Prevalence and characterization of Shiga toxin-producing Escherichia coli isolated from cattle, food, and children during a one-year prospective study in France. J Clin Microbiol 38(3):1023-1031.
Read, S.C., Gyles, C.L., Clarke, R.C., Lior, H. and McEwen, S. (1990) Prevalence of verocytotoxigenic Escherichia coli in ground beef, pork, and chicken in southwestern Ontario. Epidemiol Infect 105(1):11-20.
Rivas, L., Fegan, N. and Vanderlinde, P. (2004) Isolation and characterisation of Arcobacter butzleri from meat. Int J Food Microbiol 91(1):31-41.
Roberts, D. (1991) Salmonella in chilled and frozen chicken. Lancet 337(8747):984-985.
113

Robins-Brown, R.M. (1987) Traditional enteropahogenic Escherichia coli of infantile diarrhea. Rev.Infect.Dis. 9:28-53.
Roche, P., Spencer, J., Lin, M., Gidding, H., Kirk, M., Eyeson-Annan, M., Milton, A., Witteveen, D. and Merianos, A. (2001) Australia's notifiable diseases status, 1999: annual report of the National Notifiable Diseases Surveillance System. Commun Dis Intell. 25(4):190-245.
Roche, P., Spencer, J. and Hampson, A. (2002) Annual report of the National Influenza Surveillance Scheme, 2001. Commun Dis Intell. 26(2):204-213.
Rose, N., Beaudeau, F., Drouin, P., Toux, J.Y., Rose, V. and Colin, P. (1999) Risk factors for Salmonella enterica subsp. enterica contamination in French broiler-chicken flocks at the end of the rearing period. Prev Vet Med 39(4):265-277.
Ross, I.L., Willmore, R. and Heuzenroeder, M.W. (2003) A fluorescent amplified fragment length polymorphism study of Salmonella enterica serovar Sofia, the major Salmonella serovar isolated from chickens in Australia. Int J Med Microbiol 293(5):371-375.
Russell, S.M. (2005) Intervention strategies for reducing Salmonella prevalence of ready-to-cook chicken. University of Georgia College of Agricultural and Environmental Sciences.
Sagoo, S.K., Little, C.L., Ward, L., Gillespie, I.A. and Mitchell, R.T. (2003) Microbiological study of ready-to-eat salad vegetables from retail establishments uncovers a national outbreak of salmonellosis. J Food Prot. 66(3):403-409.
Samadpour, M., Kubler, M., Buck, F.C., Depavia, G.A., Mazengia, E., Stewart, J., Yang, P. and Alfi, D. (2002) Prevalence of Shiga toxin-producing Escherichia coli in ground beef and cattle feces from King County, Washington. J Food Prot. 65(8):1322-1325.
Sanath Kumarma, H., Otta, S.K., Karunasagar, I. and Karunasagar, I. (2001) Detection of Shiga-toxigenic Escherichia coli (STEC) in fresh seafood and meat marketed in Mangalore, India by PCR. Lett Appl Microbiol 33(5):334-338.
Sarwari, A.R., Magder, L.S., Levine, P., McNamara, A.M., Knower, S., Armstrong, G.L., Etzel, R., Hollingsworth, J. and Morris, J.G., Jr. (2001) Serotype distribution of Salmonella isolates from food animals after slaughter differs from that of isolates found in humans. J Infect Dis 183(8):1295-1299.
Schmidt, H., Scheef, J., Morabito, S., Caprioli, A., Wieler, L.H. and Karch, H. (2000) A new Shiga toxin 2 variant (Stx2f) from Escherichia coli isolated from pigeons. Appl Environ.Microbiol 66(3):1205-1208.
Schoeni, J.L. and Doyle, M.P. (1994) Variable colonization of chickens perorally inoculated with Escherichia coli O157:H7 and subsequent contamination of eggs. Appl Environ.Microbiol 60(8):2958-2962.
Schultsz, C., van den, E.J., Cobelens, F., Vervoort, T., van Gompel, A., Wetsteyn, J.C. and Dankert, J. (2000) Diarrheagenic Escherichia coli and acute and persistent diarrhea in returned travelers. J Clin Microbiol 38(10):3550-3554.
Smith, D., Northcutt, J. and Musgrove, M. (2004) Effect of commercial inside-outside bird washer (IOBW) on Campylobacter, Salmonella, E. coli and aerobic plate counts (APC) of uncontaminated, contaminated and cross-contaminated broiler carcasses. Poultry Science 83(Suppl. 1):155.
Solomon, E.B., Potenski, C.J. and Matthews, K.R. (2002) Effect of irrigation method on transmission to and persistence of Escherichia coli O157:H7 on lettuce. J Food Prot. 65(4):673-676.
Solomon, E.B., Yaron, S. and Matthews, K.R. (2002) Transmission of Escherichia coli O157:H7 from contaminated manure and irrigation water to lettuce plant tissue and its subsequent internalization. Appl Environ.Microbiol 68(1):397-400.
Soriano, J.M., Rico, H., Molto, J.C. and Manes, J. (2001) Incidence of microbial flora in lettuce, meat and Spanish potato omelette from restaurants. Food Microbiology 18(2):159-163.
Stern, N.J., Hiett, K.L., Alfredsson, G.A., Kristinsson, K.G., Reiersen, J., Hardardottir, H., Briem, H., Gunnarsson, E., Georgsson, F., Lowman, R., Berndtson, E., Lammerding, A.M., Paoli, G.M. and Musgrove, M.T. (2003) Campylobacter spp. in Icelandic poultry operations and human disease. Epidemiol Infect 130(1):23-32.
Sumner, J., Raven, G., Dean, P., Dowsett, P., Petrenas, E., Weiring, R., West, G., Lillie, M., Holds, G. and Pointon, A. (2004) A microbiolgoical profile of poultry processed in South Australia. Food Australia 56(7):335-340.
114

Tauxe, R.V. (1997) Emerging foodborne diseases: an evolving public health challenge. Emerg.Infect Dis 3(4):425-434.
Teophilo, G.N., dos, F., V, dos Prazeres, R.D. and Menezes, F.G. (2002) Escherichia coli isolated from seafood: toxicity and plasmid profiles. Int Microbiol 5(1):11-14.
Thomson, J., Lin, M., Halliday, L., Preston, G., McIntyre, P., Gidding, H., Amin, J., Roberts, L., Higgins, K., Brooke, F., Milton, A., O'Brien, E., Witteveen, D. and Crerar, S. (1999) Australia's notifiable diseases status, 1998. Annual report of the National Notifiable Diseases Surveillance System. Commun Dis Intell. 23(11):277-305.
Thorpe, C.M. (2004) Shiga toxin-producing Escherichia coli infection. Clin Infect Dis 38(9):1298-1303.
Trabulsi, L.R., Keller, R. and Tardelli Gomes, T.A. (2002) Typical and atypical enteropathogenic Escherichia coli. Emerg.Infect Dis 8(5):508-513.
Uyttendaele, M., De Troy, P. and Debevere, J. (1999) Incidence of Salmonella, Campylobacter jejuni, Campylobacter coli, and Listeria monocytogenes in poultry carcasses and different types of poultry products for sale on the Belgian retail market. J Food Prot. 62(7):735-740.
Uyttendaele, M.R., Debevere, J.M., Lips, R.M. and Neyts, K.D. (1998) Prevalence of Salmonella in poultry carcasses and their products in Belgium. Int J Food Microbiol 40(1-2):1-8.
Vanderlinde, P.B., Shay, B. and Murray, J. (1998) Microbiological quality of Australian beef carcass meat and frozen bulk packed beef. J Food Prot. 61(4):437-443.
Vanderlinde, P.B., Shay, B. and Murray, J. (1999) Microbiological status of Australian sheep meat. J Food Prot. 62(4):380-385.
Wallace, J.S., Cheasty, T. and Jones, K. (1997) Isolation of vero cytotoxin-producing Escherichia coli O157 from wild birds. J Appl Microbiol 82(3):399-404.
Wani, S.A., Bhat, M.A., Samanta, I., Nishikawa, Y. and Buchh, A.S. (2003) Isolation and characterization of Shiga toxin-producing Escherichia coli (STEC) and enteropathogenic Escherichia coli (EPEC) from calves and lambs with diarrhoea in India. Lett Appl Microbiol 37(2):121-126.
Wedderkopp, A., Gradel, K.O., Jorgensen, J.C. and Madsen, M. (2001) Pre-harvest surveillance of Campylobacter and Salmonella in Danish broiler flocks: a 2-year study. Int J Food Microbiol 68(1-2):53-59.
Western Australian Food Monitoring Program (2004) Microbiological quality of cooked chicken meat 2003-2004. WA Department of Health, Perth, Australia. http://www.health.wa.gov.au/pophealth/environmental/resources/microbiologicalqualitycookedchicken041026.pdf. Accessed on 6 December 2004.
White, D.G., Zhao, S., Sudler, R., Ayers, S., Friedman, S., Chen, S., McDermott, P.F., McDermott, S., Wagner, D.D. and Meng, J. (2001) The isolation of antibiotic-resistant salmonella from retail ground meats. N.Engl.J Med 345(16):1147-1154.
WHO (1998) Zoonotic non-O157 shiga toxin-producing Escherichia coli (STEC). Preport of a WHO Scientific Working Group Meeting. Berlin, Germany, 26-26 June 1998. World Health Organization, Geneva.
FAO/WHO (2004) Risk assessment of Listeria monocytogenes in ready-to-eat foods. World Health Organization and Food and Agriculture Organization of the United Nations, Geneva, Switzerland. http://www.fao.org/es/ESN/food/risk_mra_riskassessment_listeria_en.stm.
Widiasih, D.A., Ido, N., Omoe, K., Sugii, S. and Shinagawa, K. (2004) Duration and magnitude of faecal shedding of Shiga toxin-producing Escherichia coli from naturally infected cattle. Epidemiol Infect 132(1):67-75.
Wight, J.P., Rhodes, P., Chapman, P.A., Lee, S.M. and Finner, P. (1997) Outbreaks of food poisoning in adults due to Escherichia coli O111 and campylobacter associated with coach trips to northern France. Epidemiol Infect 119(1):9-14.
Yatsuyanagi, J., Saito, S., Sato, H., Miyajima, Y., Amano, K. and Enomoto, K. (2002) Characterization of enteropathogenic and enteroaggregative Escherichia coli isolated from diarrheal outbreaks. J Clin Microbiol 40(1):294-297.
115

Yohannes, K., Roche, P., Blumer, C., Spencer, J., Milton, A., Bunn, C., Gidding, H., Kirk, M. and Della-Porta, T. (2004) Australia's notifiable diseases status, 2002: Annual report of the National Notifiable Diseases Surveillance System. Commun Dis Intell. 28(1):6-68.
Zhao, C., Ge, B., De Villena, J., Sudler, R., Yeh, E., Zhao, S., White, D.G., Wagner, D. and Meng, J. (2001) Prevalence of Campylobacter spp., Escherichia coli, and Salmonella serovars in retail chicken, turkey, pork, and beef from the Greater Washington, D.C., area. Appl Environ.Microbiol 67(12):5431-5436.
Zhou, Z., Nishikawa, Y., Zhu, P., Hong, S., Hase, A., Cheasty, T., Smith, H.R., Zheng, M. and Haruki, K. (2002) Isolation and characterization of Shiga toxin-producing Escherichia coli O157:H7 from beef, pork and cattle fecal samples in Changchun, China. J Vet Med Sci 64(11):1041-1044.
Zschock, M., Hamann, H.P., Kloppert, B. and Wolter, W. (2000) Shiga-toxin-producing Escherichia coli in faeces of healthy dairy cows, sheep and goats: prevalence and virulence properties. Lett Appl Microbiol 31(3):203-208.
5.2 Staphylococcus aureus
5.2.1 Hazard Identification
The genus Staphylococcus is subdivided into 28 species and 8 subspecies. S. aureus is a non-motile, gram-positive, non-spore forming spherical bacterium. On microscopic examination, S. aureus appears in pairs, short chains, or bunched, grape-like clusters (Stewart, 2003).
S. aureus is ubiquitous and inhabits the mucous membranes and skin of most warm-blooded animals, including food animals and humans. Up to 50% of humans may carry this organism in their nasal passages and throats and on their hair and skin (USFDA Centre for Food Safety and Applied Nutrition, 2004b).
Growth characteristics
The temperature range for growth of S. aureus is 7-48°C with optimum growth occurring at 35-40oC. The temperature range for toxin production is 10-48°C with the optimum temperature being from 40-45oC. S. aureus grows over a wide aw range (0.83-0.99) with an optimum aw of >0.99. The pH range for growth is 4.0-10 and the pH range for toxin production is 4.5-9.6 (ICMSF, 1996). S. aureus is tolerable to salt up to 25% NaCl (aw 0.85).
S. aureus counts are often estimated by detecting coagulase-positive staphylococci, with further confirmatory tests required to specifically identify S. aureus. Nevertheless, the identification of coagulase-positive staphylococci or S. aureus is essentially an indicator test for the likelihood of enterotoxin production, as not all of these organisms have the ability to produce toxin (Stewart, 2003). In addition, some strains of enterotoxin-producing staphylococci do not produce coagulase.
S. aureus grows under both aerobic and anaerobic conditions, however growth is better in the presence of oxygen. Toxins are also produced under both aerobic and anaerobic conditions with greatest toxin production in the presence of oxygen (Bergdoll, 1989). S. aureus is generally considered a poor competitor with other bacteria.
S. aureus is readily killed at cooking and pasteurisation temperatures, however heat resistance is increased in dry, high-fat and high-salt foods. In contrast, S. aureus enterotoxins are extremely resistant to heat. Heat resistance for enterotoxin B has been reported at D 149=100 min (aw of 0.99) (ESR, 2001). Heat resistances for S. aureus vegetative cells have been reported at D60 = 0.43-8.0 MIN whereas a time/temperature equivalent for enterotoxin is 121oC for 3-8 min (Baird-Parker, 1990; ICMSF, 1996). The enterotoxin is not affected by frozen storage.
116

Preservatives such as sorbate and benzoate are inhibitory to S. aureus, with their effectiveness increasing with a reduction in pH. Methyl and propyl parabens also have an effect on S. aureus, and high concentrations of carbon dioxide cause a substantial reduction in growth rates of S. aureus (Molin, 1985).
Most chemical sanitisers used routinely in food industry such as chlorine, other halogens and quaternary ammonium compounds destroy S. aureus on surfaces. However some strains, for example those that become established on poultry processing equipment, have increased resistance (Bolton et al., 1988).
Mode of transmission
Staphylococcal food poisoning is caused by the consumption of food containing enterotoxins produced by certain stains of S. aureus. Despite the wide-spread association of S. aureus with animals, humans are the main reservoir for S. aureus involved in human disease (Jablonski and Bohach, 1997). Hand contact with ready-to-eat foods is an important means by which S. aureus may enter food supply by food handlers.
Foods that present the greatest risk of causing illness are those in which the normal flora has been destroyed (e.g. cooked meats) or inhibited (eg cured meats containing high salt content) (Stewart, 2003).
Occurrence in foods
Animals carry S. aureus on various parts of their bodies. Cows udders and teats, and the tonsils and skin of pigs, chickens and turkeys are also known sources. Occurrence of staphylococci is common in raw milk. S. aureus in milk is related to the health status of the herd in respect to mastitis, and organisms numbers can range from <10 to several thousands per ml of milk with occasional counts of 105 cfu/ml (Asperger and Zangerl, 2002).
The prevalence of coagulase-positive staphylococci (which can include S. aureus, S. intermedius and some S. hyicus) in Australian beef and sheep carcasses and boneless beef and sheep surveyed in 1998 were 24.3% (beef carcasses), 24.1% (sheep carcasses), 17.5% (boneless beef) and 38.6% (boneless sheep) respectively (Phillips et al, a, b 2001).
S. aureus is commonly found on the skin, nasopharynx and alimentary tract of healthy poultry. A survey in Western Australia of two poultry processing plants found 18.4% of chickens positive for S. aureus in one plant, and 10.6% of chickens positive for S. aureus in the second plant. Seven percent of turkeys examined in the same survey were also found positive for S. aureus (Bertolatti et al., 1996a).
Incidence of illness
Food poisoning caused by S. aureus is one of the most common type of food-borne disease world-wide. The incidence of staphylococcal food poisoning is often under-reported due largely to the self-limiting nature of illness, with most people recovering within 1-2 days without requiring medical attention. Foods commonly associated with Staphylococcal food poisoning are meat and poultry, dairy products (particularly cheese and cream due to inappropriate handling as well as raw milk), salads, cream filled bakery products, and processed meat (especially ham, hot dogs, salami). Improper storage/temperature abuse of food is greatest factor attributing to outbreaks (Homberg and Blake, 1984).
S. aureus is not a notifiable illness in Australia. However in 2002, three outbreaks of food poisoning attributed to S. aureus were reported. In one outbreak, a meal of lamb, rice and potatoes was implicated, in which Bacillus cereus was also identified. Other outbreaks implicated rice served in a childcare centre and pizza as the causative agent (OzFoodNet Working Group, 2003a; OzFoodNet Working Group, 2002b; OzFoodNet Working Group, 2002c) .
117
An outbreak was also reported in 2001 from consumption of BBQ chicken strongly suggesting an enterotoxin-producing bacterium as the causative agent, possibly S. aureus (Armstong et al., 2002). In 2003, S. aureus was also implicated in food-borne illness after the consumption of a rice, beef and black bean sauce meal (OzFoodNet Working Group, 2003b).
Mead et al. (1999) state that sporadic illness from S. aureus is not reportable in the US through either passive or active systems.
In the US, it is estimated 185,060 illnesses, 1753 hospitalisations and 2 deaths per year are attributed to S. aureus illness via contaminated food (Mead et al., 1999). Between 1975 and 1982, 36% of all reported S. aureus illness in the US was attributed to red meat, 12.3% to salads, 11.3% to poultry, 5.1% to pastries and 1.4% attributed to milk products and seafoods. In 17.1% of cases, the food involved was unknown (Genigeorgis, 1989).
In Canada, the average number of cases of illness from Staphylococcus for the years 1975-1984 was 232 cases per year (Todd, 1992). Foods implicated included pork (ham), turkey, chicken, cheese, pasta, salads and sandwiches.
In France, S. aureus was attributed to 16 of 530 food-borne disease outbreaks recorded between 1999 and 2000 (Le Loir et al., 2003). Of these outbreaks, milk products and especially cheeses were responsible for 32% of cases, meats 22%, sausages and pies, 15%, fish and seafood 11%, eggs and egg products 11% and poultry 9.5% (Haeghebaert et al., 2002).
In the United Kingdom for the years 1969-81, 1-6% of all cases of bacterial food poisoning were attributed to S. aureus. From 1982-1990, 0.5-1% of all cases of bacterial food poisoning was attributed to staphylococcal food poisoning. For the years 1969-90 a study of 359 incidents of staphylococcal food poisoning was investigated (Table 5.4). Poultry and poultry products accounted for 22% of incidents, most attributed to cold cooked chicken and in nine incidents turkey was the vehicle of intoxication (Bertolatti et al., 1996b; Wieneke et al., 1993).
Table 5.4: Foods implicated in staphylococcal food poisoning in the UK from 1969-1990 (Wieneke et al., 1993)
Type of Food Number of incidentsHam 65
53%
Meat pies 25Corned beef 20Tongue 16Jars of meat, chicken or fish paste 12Other meats and meat containing products 43Meat dishes 9Poultry (chicken, turkey, duck) 64
22%Poultry dishes 15Fish and shellfish 24 7%Milk and desserts containing milk or cream 23
8%Cheese 5Boiled eggs and egg dishes 13 3.5%Other foods 20 5.5%Not known 5 1%Total 359
118

5.2.2 Hazard Characterisation
Pathology of illness
Staphylococcal food-borne illness is caused by the ingestion of food that contains one or more preformed toxins produced by S. aureus. Usually this occurs when S. aureus is introduced into a food that will support growth of the organism, and that food is stored under conditions allowing the organism to grow and produce sufficient quantities of enterotoxin (Ash, 1997).
Symptoms generally appear around 3 hours after ingestion but can occur as little as 1 hour (range 1-6 hours) and are self-limiting (Stewart, 2003; Ash, 1997). Symptoms include nausea, vomiting, abdominal cramps of varying severity, and diarrhoea. Some individuals may not demonstrate all the symptoms associated with the illness. In severe cases, blood and mucus may be observed in stools and vomitus. Marked prostration, headaches and sweating accompany severe attacks and there may be fever or shock with subnormal temperatures and lowered blood pressure. Recovery is usually between 1-3 days requiring no medical treatment. Fatalities are rare, but are occasionally reported in young children and the elderly (Ash, 1997). All people are susceptible to staphylococcal food poisoning, however the intensity/severity may vary, depending of individual sensitivities.
S. aureus is also an opportunistic pathogen that causes infections via open wounds. S. aureus causes several types of infection including skin eruptions and inflammations (boils, acne, sties, etc.) and wounds. S. aureus can also cause respiratory infections or may become established in the gut causing enteritis.
Virulence and infectivity of S. aureus
S. aureus forms a wide range of substances associated with infectivity and illness, including the heat stable enterotoxins that cause food poisoning (Ash, 1997). Eleven antigenic types of staphylococcal enterotoxins are currently recognised, with types A and D being most commonly involved in food poisoning outbreaks.
To date, staphylococcal enterotoxins A, B, C1, C2, C3, D, E, G, H, I and J toxins have been identified (Balaban and Rasooly, 2000). These enterotoxins are single-chain proteins comprising a polypeptide chain containing relatively large amounts of lysine, tyrosine and aspartic and glutamic acids and characterised by containing only two residues of half cystine and one or two residues of tryptophan. Most of them possess a cystine loop required for proper conformation and which is probably involved in the emetic activity. They are highly stable, resist most proteolytic enzymes, such as pepsin or trypsin, and thus keep their activity in the digestive tract after ingestion. They also resist chymotrypsine, rennin and papain (Bergdoll, 1989).
The production of enterotoxins is dependent on de novo synthesis within the cell. The quantity of toxin produced is variable and can be categorised by type of toxin produced. Although weakly antigenic, enterotoxin antibodies have been produced in a variety of animal hosts.
The mode of action of the toxin causing illness is not fully understood, although it is thought that the vomiting response to ingestion of preformed toxin is the result of the stimulation of local neuroreceptors in the intestinal tract which transmit the stimuli to the vomiting centre of the brain via the vagus and other parts of the sympathetic nervous system (ICMSF, 1996).
Dose response
The amount of enterotoxin that must be ingested to cause illness is not known exactly, but it is generally believed to be in the range 0.1-1.0 µg/kg (ICMSF, 1996). Toxin levels within this range are typically reached when S. aureus populations exceed 100,000/g (Ash, 1997).
119

Immune status
All people are believed to be susceptible to staphylococcal intoxication, but the severity of symptoms may vary depending on the amount of food ingested and the susceptibility of the individual to the toxin.
Food Matrix
The range of conditions that allow growth of staphylococci and the production of toxin vary with food type. The amount of starch and protein present in the food may enhance toxin production (Frazier and Westhoff, 1988).
5.2.3 Exposure Assessment
Sources and routes of contamination of poultry with S. aureus
Farm environment
Live poultry can carry staphylococci in bruised tissues, infected lesions, nasal sites, arthritic joints, and on skin surfaces (ICMSF, 2000).
Chickens become contaminated with S. aureus during the first few days of life and S. aureus can be isolated from the hatchery (Kusch and Goetze, 1976; Thompson et al., 1980). However, the degree of surface colonisation of chicks is low during the first weeks of life and few if any are normally found in the alimentary tract (Devriese et al., 1975). Populations increase during rearing until about the seventh week of life and thereafter the levels remain high, close to the point at which many poultry are slaughtered for meat purposes (Devriese et al., 1975). S. aureus is widely distributed amongst flocks, in one study, 97.9% of caged hens (48) were carriers with counts ranging per swab <10 2 – 4 x 10⁵
(Thompson et al, 1980).
At 9 weeks of age, a significant proportion of caged reared pullets are contaminated but the numbers of S. aureus are generally low (mostly <103 per swab). However at 50 weeks, 100% of tested hens were carriers and many (88.9%) yielded >104 per swab. For floor-reared pullets, the proportion of pullets colonised by S. aureus did not increase to more than 50% during rearing but as with cage-reared hens, this proportion had increased by mid-lay to almost 100%. S. aureus counts were low (98.5%, <1 x 10³ per swab) during rearing and high (>5 x 10³ per swab) at mid lay, but by the end of lay the levels and proportion of carriers had decreased almost to that found at point-of-lay. Cage reared birds had lower staphylococcal counts than those reared on floor (Anand et al., 1989).
Environmental surfaces such as drinkers, feeders and litter are also commonly contaminated. Total counts from equivalent surface areas of feeders were consistently higher than for the cage-reared flock. Drinkers (trough type) also gave very high counts. (Thompson et al, 1980).
Despite the relatively high prevalence of S. aureus on birds, strains isolated from poultry are often distinctly different from those strains isolated from humans (Hazariwal et al., 2002; Devrise et al., 1975). The occurrence of enterotoxin-producing strains isolated from poultry is reportedly low, especially those strains that produce enterotoxin A.
Processing
Processing was previously described graphically in Figure 1.2.
Initial counts of S. aureus at the beginning of processing are generally low (Mead and Dodd, 1990). Studies have demonstrated that S. aureus is present only in small numbers on skin (<10/g) of broiler chickens (Notermans et al., 1982). On the carcasses, levels of S. aureus on incoming birds were 5-20 times higher in the summer than in winter. (Dodd et al, 1988)
120

At the processing plant, the microbiological status of freshly processed poultry carcasses is influenced by factors including levels of incoming contamination on live birds, numbers and types of microorganisms introduced through contamination or cross-contamination, design of processing equipment, efficiency of processing methods, temperature control, and sanitary and hygienic practices in the plant.
During scalding the majority of the resident staphylococci on the surface of live birds are destroyed. Counts of S. aureus samples from neck skin on poultry carcasses showed that numbers decreased approximately 10-fold during scalding (Dodd et al., 1988). However some organisms survive scalding at low temperatures (Abu Ruwaida et al., 1994).
The defeathering stage is a significant cause of carcass contamination, particularly from the rubber fingers of the defeathering machinery. Conditions in defeathering machines are favourable for bacterial growth, and the equipment is difficult to clean and disinfect post processing. Hence colonising organisms may persist for long periods. Factors contributing to favourable conditions for growth of S. aureus in defeathering machines include the presence of blood and other organic material such as feathers, plus the close proximity of defeathering machines to scalding tanks (Bertolatti et al., 1996b). Counts of S. aureus samples on neck skin may increase by almost 1000-fold during defeathering, reaching up to 104/g (Dodd et al., 1988).
Strains of S. aureus which colonise defeathering equipment appear to be resistant to normal cleaning and disinfection processes (Bolton et al, 1988). Research has shown endemic strains to be 8 times more resistant to hypochlorite than non-endemic strains (Bertolatti et al., 1996b; Chaffey et al., 1991).
There appears to be no substantial change to S. aureus counts following evisceration, although levels appear to decrease after spray washing. Air chilling, packaging and cold storage do not appear to change levels of contamination. (Abu-Ruwaida et al., 1994; Notermans et al., 1982).
Populations of S. aureus inoculated on chicken skin after washing with water were log10 4.8 cfu/cm3. Populations on skin washed with lactic acid/sodium benzoate were generally lower. After storing at 4oC for 8 days. Populations of S. aureus that had been washed with water decreased slightly, and decreased steadily on skin washed with lactic acid/sodium benzoate. No viable cells of S. aureus were detected after 8 days (Hwang and Beuchat, 1995).
In a Western Australian study 5 of 83 (6%) samples collected from broiler carcasses were positive for presence of S. aureus following the chlorinated wash-chill water processing stage (Bertoliatti et al., 1996).
Prevalence of S. aureus in poultry meat products
Data indicates that most raw fresh and frozen poultry both chicken and turkey are contaminated with S. aureus and usually at high levels >1000 per g or per cm2 (Table 5.5) (Waldroup, 1996).
Table 5.5: Incidence and numbers of S. aureus on raw poultry (Waldroup, 1996)Country Food Incidence
(% positive)cfu/ unit No.
samplesReference
USA Raw further processed turkey 71.4 No data 35 Zottola and Busta, 1971
USA Raw turkey 54.0 No data 85 Hagberg et al, 1973USA Frozen fryers 42/0 <1000/cm2 60 Sauter et al, 1978Poland Skin and meat of raw broilers 78.2 No data ? Wos and Jagodzinska,
1978Germany Broiler carcasses 35-47 No data ? Hentschel et al, 1979Sweden MDPM 80 >1000/g ? Fuches et al, 1980Netherlands Poultry skin ? 10-50,000/g ? Notermans and van
Leeuwen, 1981
121
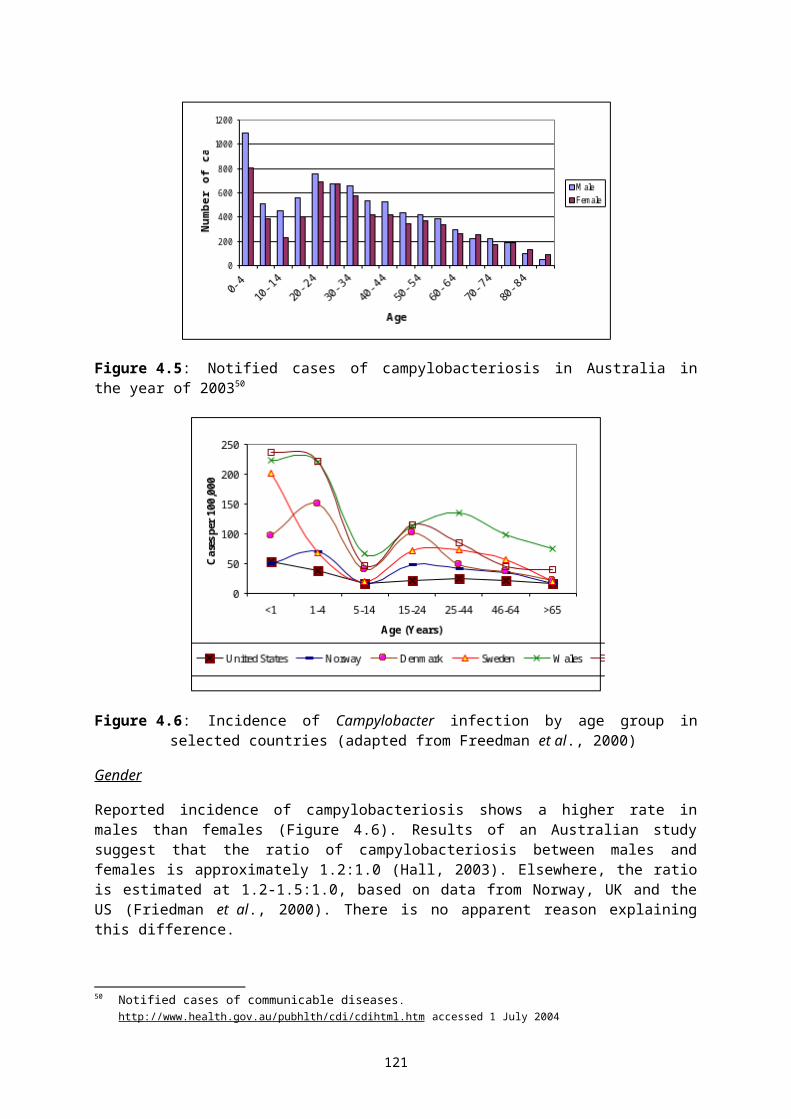
Country Food Incidence (% positive)
cfu/ unit No. samples
Reference
UK Turkey neck skin ? 10-100,000/cm2
? Adams and Mead, 1983
Czechoslovakia
Poultry carcasses ? 2400/cm2 ? Turek et al., 1983
Spain Refrigerated chicken 43.1 No data 51 Manso et al., 1987India Fresh/frozen chicken ‘most’ 15,000/cm2 25 Kamat et al., 1991Japan Retail chicken 92.7 No data 110 Shimizu et al., 1991UK Chicken/turkey carcasses 71 <1000/g 140 Mead et al, 1993
MDPM – mechanically deboned poultry meatcfu – colony forming unit
Growth of S. aureus in poultry meat products
S. aureus competes poorly with other bacteria. The temperature range for growth is 7-48 oC, therefore the low storage temperatures (refrigeration) and competitive spoilage flora will prevent multiplication of S. aureus in raw poultry meat products. S. aureus will survive freezing and thawing but is readily destroyed by cooking, except for the enterotoxins which are heat stable.
Preparation and handling of poultry meat products
In addition to S. aureus being introduced during the production and processing of poultry meat, S. aureus may also be introduced at the retail and consumer-end, either through cross-contamination or inadequate cooking at the retail outlet or consumer (food service or home preparation).
The majority of staphylococcal food-borne illness associated with consumption of poultry is due to recontamination of cooked meat by a food handler. Low storage temperatures and competitive spoilage flora prevent staphylococcal multiplication in raw poultry products.
Consumption data
The total number of poultry servings in Australia annually (2,880,000,000) was estimated from annual consumption data (36 kg per person per year, average serving size 250g) and the Australian population (20 million).
5.2.4 Risk Characterisation
Initial counts of S. aureus at the beginning of processing are generally low, however by the end of processing the prevalence of S. aureus can be very high, with numbers with levels often >1000 per g or per cm2 (Waldroup, 1996).
The presence of S. aureus on raw poultry meat may consist of a mixture of strains from the live birds which survive scalding and processing plus indigenous strains acquired from defeathering equipment.
Difficulties in controlling S. aureus in poultry meat processing include (Mead et al, 1993): the rapid rate of production which often exceeds 6000 carcasses/h in the larger plants and keeps
birds in close proximity throughout; limitations in design of processing equipment including that used in scalding, defeathering, and
evisceration, which favour spread of S. aureus; difficulty washing the abdominal cavity effectively after evisceration because carcasses remain
whole; and retention of skin which tends to trap bacteria.
122

For S. aureus to cause food-borne illness, the organism must multiply to reach high numbers in a food to produce toxin (Waldroup, 1996). Due to the low storage temperatures and competitive spoilage flora preventing staphylococcal multiplication in raw poultry products, levels of S. aureus are unlikely to reach numbers to produce toxin and cause food-borne illness.
Enterotoxin production by S. aureus associated with live poultry and poultry carcasses appears to be uncommon and generally not of public health concern (Hajek and Marsalck, 1973; Shiozawa et al, 1980: Isigidi et al., 1992)
Foodborne illness from consumption of poultry meat is well documented, however, it is generally associated with recontamination of cooked meat by food handlers and poor storage conditions. Illness from cooked poultry contaminated from S. aureus presents a human health risk as the normal competitive spoilage flora has been destroyed, and any time and temperature abuse would allow growth of S. aureus and subsequent toxin production (Stewart, 2003).
ReferencesAbu Ruwaida, A.S., Sawaya, W.N., Dashti, B.H., Murad, M. and Al Othman, H.A. (1994) Microbiological
quality of broilers during processing in a modern commercial slaughterhouse in Kuwait. J.Food Prot. 57(10):887-892.
Adams, B.W. and Mead, G.C. (1983) Incidence and properties of Staphylococcus aureus associated with turkeys during processing and further processing operations. J.Hyg. 91:479-490.
Anand, S.K., Mahapatra, C.M., Pandey, N.K. and Verma, S.S. (1989) Microbial changes on chicken carcasses during processing. Ind.J.Poultry Sci. 24:203-209.
Armstong, P., Peacock, D. and Cameron, S. (2002) Gastroenteritis outbreak in a sporting team linked to a barbequed chicken. Communicable Disease Intelligence 26(3): http://www.cda.gov.au/pubs/cdi/2002/cdi2603/htm/cdi2603.htm,
Ash, M. (1997) Staphylococcus aureus and staphylococcal enterotoxins. In: A.D.Hocking, G.A.I.J.K.N.a.P.S. eds. Foodborne Microorganisms of Public Health Significance. 5th ed, AIFST (NSW Branch) Food Microbiology Group, Sydney, pp313-332.
Asperger, H. and Zangerl, P. (2002) Staphylococcus aureus. In: Roginski, H.F.J.W.F.P. eds. Encyclopedia of Dairy Science. Elsevier Science, London, pp2563-2569.
Baird-Parker, A.C. (1990) The staphylococci: an introduction. Journal Applied Bacteriology Symposium Supplement:1S-8S.
Balaban, N. and Rasooly, A. (2000) Staphylococcal enterotoxins. Int.J.Food Microbiol. 61:1-10.
Bergdoll, M.S. (1989) Staphylococcus aureus. In: M.P Doyle. eds. Foodborne Bacterial Pathogens. Marcel Dekker Inc., New York, pp463-513.
Bertolatti, D., Hanelly, T., Bishop, M., French, E. and Marendoli, M. (1996) Staphylococcus aureus in Western Australian poultry. International Journal of Environmental Health Research 6(4):277-287.
Bolton, K.J., Dodd, E.E.R., Mead, G.C. and Waites, W.M. (1988) Chlorine resistance of strains of Staphylococcus aureus isolated from poultry processing plants. Letters in Applied Microbiology 6:31-34.
Chaffey.B.J., Dodd.C.E.R., Bolton, K.J. and Waites, W.M. (1991) Adhesion of Staphylococcus aureus: its importance in poultry processing. Biofouling 5:103-114.
Devriese, L.A., Devos, A.H. and van Damme, L.R. (1975) Quantitative aspects of the Staphylococcus aureus flora of poultry. Poult.Sci 54(1):95-101.
Dodd, C.E.R., Mead, G.C. and Waites, W.M. (1988) Detection of the site of contamination by Staphylococcus aureus within the defeathering machinery of a poultry processing plant. Lett.Appl.Microbiol. 7:63-66.
ESR. (2001) Staphylococcus aureus. Microbial Pathogen Datasheet. http://www.nzfsa.govt.nz/science-technology/data-sheets/staphylococcus-aureus.pdf,
Frazier, W.C. and Westhoff, D.C. (1988) Food Microbiology, 4th edition. McGraw Hill, Singapore,
123

Fuchs, G., Jansson, S. and Norberg, P. (1980) Studies on the soft fraction form mechanical deboning equipment. Var Foeda 32:50-63.
Genigeorgis, C.A. (1989) Present state of knowledge on staphylococcal intoxication. Int.J.Food Microbiol. 9:327-360.
Haeghebaert, S., Le Querrec, F., Gallay, A., Bouvet, P. and Gomez, M. (2002) les toxi-infections alimentaries collectives en France, en 1999 et 2000. Bull.Epidemiol.Hebdo. 23:105-109.
Hagberg, M.M., Busta, F.F., Zottola, E.A. and Arnold, E.A. (1973) Incidence of potentially pathogenic microorganisms in further-processed turkey products. Journal of Milk Food Technology 36:625-634.
Hajek, V. and Marsalek, E. (1973) The occurrence of enterotoxigenic staphylococcus aureus strains in hosts of different animal species. Zentralbl.Bakteriol.[Orig.A] 223(1):63-68.
Hazariwala, A., Sanders, Q., Hudson, C.R., Hofacre, C., Thayer, S.G. and Maurer, J.J. (2002) Distribution of staphylococcal enterotoxin genes among Staphylococcus aureus isolates from poultry and humans with invasive staphylococcal disease. Avian Dis 46(1):132-136.
Hentschel, S., Kusch, D. and Sinell, H.J. (1979) [Staphylococcus aureus in poultry--biochemical characteristics, antibiotic resistance and phage pattern (author's transl)]. Zentralbl.Bakteriol.[B] 168(5-6):546-561.
Homberg, S.D. and Blake, P.A. (1984) Staphylococcal food poisoning in the United States. J.Am.Med.Assoc. 251:487-489.
Hwang, C.A. and Beuchat, L.R. (1995) Efficacy of a lactic acid/sodium benzoate wash solution in reducing bacterial contamination of raw chicken. Int J Food Microbiol 27(1):91-98.
ICMSF. (1996) Microorganisms in Food 5: Microbiological Specifications of Food Pathogens. Blackie Academic and Professional, London,
Isigidi, B.K., Mathieu, A.M., Devriese, L.A., Godard, C. and van Hoof, J. (1992) Enterotoxin production in different Staphylococcus aureus biotypes isolated from food and meat plants. Journal Applied Bacteriology 72:16-20.
Kamat, A.S., Alur, M.D., Nerkar, D.P. and Nair, P.M. (1991) Hygienization of Indian chicken meat by ionizing radiation. Journal of Food Safety 12:59-71.
Kusch, D. and Götze, U. (1976) Die Ursachen der Staphylokokkenkontamination bei der Gewinnung von Brathähnchen. Die Fleischwirtschaft 56:707-709.
Le Loir, Y., Baron, F. and Gautier, M. (2003) Staphylococcus aureus and food poisoning. Genetics and Molecular Reseach 2(1):63-76.
Manso, R., Perez, M.L., Delgada, M.J., Gonzalez, B., Fernandez-Cuesta, D., Leon, M.P. and Moreno, E. (1987) Bacteriological study of refrigerated chicken carcasses. Alimentaria 185:11-13.
Mead, G.C., Hudson, W.R. and Hinton, M.H. (1993) Microbiological survey of five poultry processing plants in the UK. British Poultry Science 34:497-503.
Mead, P.S., Slutsker, L., Dietz, V., McCraig, L.F., Bresee, J.S., Shapiro, C., Griffin, P.M. and Tauxe, R.V. (1999) Food-related illness and death in the United States. Emerg.Infect.Disea. 5:607-625.
Molin, G. (1985) The resistance to carbon dioxide of some food related bacteria. Eur.J.Appl.Microbiol.Biotechnol. 18:214-217.
Notermans, S., Dufrenne, J. and van Leeuwen, W.J. (1982) Contamination of broiler chickens by Staphylococcus aureus during processing; incidence and origin. J.Appl.Bact. 52:275-280.
Phillips, D., Sumner, J., Alexander, J.F. and Dutton, K.M. (2001) Microbiological quality of Australian beef. J.Food Prot. 64(5):692-696.
Phillips, D., Sumner, J., Alexander, J.F. and Dutton, K.M. (2001) Microbiological quality of Australian sheep meat. J.Food Prot. 64(5):697-700.
Sauter, E.A., Petersen, C.F. and Parkinson, J.F. (1978) Microfloral comparison of fresh and thawed frozen fryers. Poult.Sci 57(2):422-424.
Shimizu, A., Ozaki, J., Kawano, J. and Kimura, S. (1991) Isolation and characterisation of Staphylococcus aureus from raw fish and meat. Japanese Journal of Food Microbiology 8:135-141.
124

Shiozawa, K., Kato, E. and Shimizu, A. (1980) Enterotoxigenicity of Staphylococcus aureus strains isolated from chickens. J.Food Prot. 43:683-685.
125

Stewart, C.M. (2003) Staphylococcus aureus and staphylococcal enterotoxins. Foodborne Microorganisms of Public Health Significance. 6th ed, AIFST (NSW) Branch, Sydney, pp359-380.
The OzFoodNet Working Group. (2002) OzFoodNet: enhancing foodborne disease across Australia: Quarterly Report, April - June 2002. Communicable Diseases Intelligence 26(4): http://www.cda.gov.au/pubs/cdi/2002/cdi2604/htm/cdi2604g.htm,
The OzFoodNet Working Group. (2002) OzFoodNet: enhancing foodborne disease surveillance across Australia, Quarterly Report, January to March 2002. Communicable Diseases Intelligence 26(3): http://www.cda.gov.au/pubs/cdi/2002/cdi2603/htm/cdi2603h.htm,
The OzFoodNet Working Group. (2002) Foodborne disease in Australia: incidence notifications and outbreaks. Annual report of the OzFoodNet network, 2002. Communicable Diseases Intelligence 27(2):
The OzFoodNet Working Group. (2003) OzFoodNet: enhancing foodborne disease across Australia: Quarterly Report, July to September 2003. Communicable Disease Intelligence 27(4): http://www.cda.gov.au/pubs/cdi/2003/cdi2704/pdf/cdi2704k.pdf,
Thompson, J.K., Gibbs, P.A. and Patterson, J.T. (1980) Staphylococcus aureus in commercial laying flocks: incidence and characteristics of strains isolated from chicks, pullets and hens in an integrated commercial enterprise. Br.Poult.Sci 21(4):315-330.
Todd, E.C.D. (1992) Foodborne disease in Canada – a 10 year summary from 1975 to 1984. Journal Applied Microbiology 55(2):123-132.
Turek, P., Grieger, C., Burdova, O. and Lengyel, G. (1983) Surfaces of poultry during processing as regards occurrence of some hygienically significant microorganisms. Hydinarsky Priemysel 25:286-291.
USFDA Centre for Food Safety and Applied Nutrition. (2004) Staphylococcus aureus. Bad Bug Book. Foodborne pathogenic Microorganisms and Natural Toxins Handbook. Chapter accessed February 2004. http:/www.cfsan.fda.gov/~mow/chap3.html,
Waldroup, A.L. (1996) Contamination of raw poultry with pathogens. World's Poultry Science Journal 52(1):7-25,84,90,93.
Wieneke, A.A., Roberts, D. and Gilbert, R.J. (1993) Staphylococcal food poisoning in the United Kingdom, 1969-90. Epidemiology and Infection 110(3):519-531.
Wos, Z. and Jagodzinska, H. (1978) Characteristics of staphylococci found on chicken carcasses. Przemysl Spozywcsy 32:186-187.
Zottola, E.A. and Busta, F.F. (1971) Microbiological quality of further processed turkey products. Journal of Food Science 36:1001-1004.
5.3 Clostridium perfringens
5.3.1 Hazard Identification
C. perfringens is an anaerobic (microaerophilic) Gram-positive bacillus with a square-ended rod morphology and oval central or sub-terminal spores. It is widely distributed in soil and vegetation and is often part of the intestinal flora of humans and animals (Labbe, 1989).
C. perfringens is grouped into five types (A - E) according to the particular soluble antigens (exotoxins) produced (Labbe, 1989). Only types A, C and D are human pathogens, and only types A and C have been associated with food-borne illness (Bates and Bodnaruk, 2003).
There are four major exotoxins, , , and (iota), and eight minor ones. All strains produce the -toxin, a phospholipase C (lecithinase C) which causes enzymatic degradation of bilayer phospholipids (Bernheimer and Rudy, 1986) leading to disruption of cell membranes and cell lysis of erythrocytes, leukocytes, platelets, fibroblasts, and muscle cells (Titball, 1993). Several of the other toxins possess enzymatic activities, including a protease (-toxin), a deoxyribonuclease (-toxin) and a collagenase (-toxin). The -toxin is implicated as the necrotic factor in enteritis necroticans (‘pigbel’).
126

Types A and C also produce an enterotoxin (Clostridium perfringens enterotoxin; CPE) associated with the acute abdominal pain, nausea and diarrhoea of C. perfringens food poisoning.
Growth and survival
Cells of C. perfringens will grow between 12°C and 50°C, with an optimum temperature of 43-45°C (Solberg and Elkind, 1970; Labbe, 1989). The organism is capable of rapid growth. Generation times as short as 7.1 min at 41°C were reported in a study of a number of strains having an average generation time of 13 min at 40°C (Willardsen et al., 1978). Vegetative cells die rapidly below 10°C. In experiments in laboratory media it has been shown that the thermal resistance of vegetative cells increases as the growth temperature increases (Roy et al., 1981). It has also been suggested that temperature stability is enhanced in foods, perhaps due to a protective effect of fats (Labbe, 1989; Bradshaw et al., 1977).
Optimum pH for growth is in the range 6.0 to 7.0, with growth inhibited below pH 5.5 and cell death occurring slowly below pH 5.0 (Bates and Bodnaruk, 2003). Growth is also inhibited below an aw of 0.93.
In general, conditions for sporulation are more limited than for growth. The optimal temperature range is 35 - 40°C, and good sporulation can be obtained between pH 6.0 and 8.0 (Labbe and Duncan, 1974). The aw must be above 0.98 for sporulation to occur (Labbe, 1989). A large amount of enterotoxin formation accompanies sporulation, so the optimal conditions for sporulation and enterotoxin formation are similar. In food-borne outbreaks, sporulation occurs primarily in the small intestine (Labbe, 1989).
There is a wide range of thermal resistance in spores of C. perfringens strains. In water, D90°C can be as long as 27.5 minutes (Adams, 1973), and thermal stability is greater in cooked meats than in water (Collee et al., 1961).
Germination in some strains of C. perfringens is improved by a moderate heat shock, in the range of 65-80°C, usually for up to ten minutes (Labbe, 1989). Strains implicated in food poisoning are more likely to require heat-activation of germination.
Mode of transmission
C. perfringens is transmitted by the faecal-oral route and by contamination from the environment.
C. perfringens produces spores which vary in their heat resistance. Those spores which are highly heat resistant will be more likely to cause food poisoning due to survival and subsequent outgrowth during and after cooking. The food vehicles are usually cooked meat and poultry dishes stored for long periods of time at ambient temperature after cooking.
Spores may survive normal cooking procedures, with germination being triggered by the heat shock received during cooking. Slow cooling and non-refrigerated storage can permit growth of vegetative cells to high numbers, particularly in anaerobic environments in cooked meat and poultry dishes. Outgrowth of spores commonly occurs after the heat shock encountered during cooking, and is favoured in anaerobic microenvironments within the food. The high number of vegetative cells produced under these conditions allows some to survive through the acidic environment of the stomach to reach the intestine, where sporulation is accompanied by production of the enterotoxin.
Type A strains also cause gas gangrene, a wound necrosis associated with poor hygiene which was widespread in troops in both world wars (Labbe, 1989).
127

Occurrence in food
C. perfringens spores and vegetative cells are likely to be present in uncooked foods of animal origin, vegetables exposed to soil, dust or faecal material, and in some dried spices (ICMSF, 1996).
During the mid-1990s, the Food Safety and Inspection Service (FSIS) of the United States Department of Agriculture conducted a number of surveys of the microbiological status of raw meat products. The results for C. perfringens, summarised in Table 1, show a high prevalence of contamination in poultry meat products, at relatively low levels, while for pork and beef the prevalence was lower but the level of contamination was generally higher.
C. perfringens contamination has been found at relatively high prevalence, but usually at low levels, in some dried spices (ICMSF, 1998; Banerjee and Sarkar, 2003).
Carlin et al. (2000) reviewed the scientific literature on the incidence of pathogenic spore-forming bacteria (including C. perfringens) in vegetables, spices and foods containing vegetables. In summary, they report that of 4040 samples, 3998 had <2 log cfu per gram C. perfringens, and the remaining 42 samples had less than 5 log cfu per gram.
Table 5.6 FSIS Microbiological Baseline Data (FSIS, 2004).
Source Prevalence(%)
cfu/ carcass1
Highestcfu/carcass
cfu/sq.cm1 Highestcfu/sq.cm
cfu/g1
broiler chicken carcassesn=1297 42.9 2.88 × 10³ 3.48 × 10⁵ 1.5 284
raw ground chickenn=285(25 gram samples)
50.6 25
young turkey carcassesn=1221 29.2 2.4 × 10³ 1.95 × 10⁶ 0.54 383
raw ground turkeyn=296(25 gram samples)
28.1 39
raw beef (cow and bull) carcassesn=2112
8.3 47 <1 × 10⁵
raw beef (steer and heifer) carcassesn=2079
2.6 45.1 <1 × 10⁵
raw ground beefn=563(25 gram samples)
53.3 67
market hog carcassesn=2112 10.4 71 <1 × 10⁵
1. The geometric mean of positive samples, calculated as the antilog of the log mean.
Incidence and outbreak data
Outbreaks of C. perfringens food poisoning are usually associated with inadequately heated or reheated meats, pot pies, stews, or gravies. Spores become activated by the temperature shock of cooking, and if the food is not cooled to below 15°C rapidly enough, vegetative cells are able to rapidly multiply to high levels, as competing bacteria are greatly reduced in numbers by the cooking.
Vegetable dishes are only rarely implicated in outbreaks of C. perfringens poisoning. In an analysis of several databases, only 1 outbreak due to C. perfringens related to a vegetable product was identified in the period 1969 to 1998 (Carlin et al., 2000; Roach and Sienko, 1992)
Outbreaks are often in institutional or mass-catering settings, where the large volumes of food prepared and/or inherent difficulties in maintaining appropriate standards of hygiene and sanitation may lead to improper cooking, cooling, holding and handling of potentially hazardous food.
128

Because of the specific conditions leading to sporulation and growth of C. perfringens to high levels, it is believed that relatively few sporadic cases occur.
Dalton et al. (2004), summarising the epidemiology of food-borne disease outbreaks in Australia from 1995 to 2000, report that C. perfringens was the responsible agent in 30 outbreaks (14% of 214 outbreaks) involving 787 cases (10% of total cases) and 1 death. The median number of cases per outbreak was 25, with a range from 2 to 171. Meats were the food vehicles in 60% (18 of 30) of those outbreaks, with chicken accounting for 1/3 of the meat-associated outbreaks. The outbreak settings were approximately equally split between restaurants, commercial caterers, institutional and ‘other’ settings.
In 2001-2002 OzFoodNet, Australia’s enhanced food-borne disease surveillance network, catalogued a further 10 outbreaks of C. perfringens food poisoning involving 102 cases64. Food vehicles included beef curry, a spit roast, potato pie and pea and ham soup.
The US Centres for Disease Control and Prevention (CDC) listings of food-borne disease outbreaks for 1990 to 2002 (CDC, 2004), as reported to CDC through the Foodborne Disease Outbreak Surveillance System, demonstrate that C. perfringens was responsible for about 6% of outbreaks (10% of cases) of food-borne illness of confirmed aetiology during that period. The number of outbreaks due to C. perfringens ranged from 10 to 30 each year. Approximately 70% of the C. perfringens outbreaks were attributable to meat products or dishes.
There are few data on the incidence of enteritis necroticans (also known as pigbel or darmbrand) due to C. perfringens. The disease is most commonly encountered in developing countries and is associated with poor nutrition and protein-poor and/or trypsin-inhibitor rich diets. These conditions allow for survival of the -toxin of type C strains, a protein which is usually rapidly proteolysed in healthy and well-nourished individuals.
5.3.2 Hazard Characterisation
Pathology of illness
Only the symptoms of C. perfringens food poisoning and (briefly) enteritis necroticans are described in this section. Discussion of gas gangrene is outside the scope of this assessment.
Symptoms of enteritis necroticans include abdominal pain and swelling, vomiting, profuse and often bloody diarrhoea, and patchy necrosis of the upper small intestine that can lead to obstruction requiring surgical intervention. It can be fatal.
Symptoms of C. perfringens food poisoning include diarrhoea and abdominal cramps (sometimes severe), typically without fever. There is normally no vomiting, fever, shivering, headache or nausea. Onset of symptoms is usually within 8-24 hours after ingestion, and full recovery occurs within 24-48 hours.
Host factors
C. perfringens food poisoning may be more serious in the elderly and debilitated, but fatal cases are rare (Bates and Bodnaruk, 2003).
64 Data summarised from OzFoodNet Quarterly Reports, available from http://www.ozfoodnet.org.au/reports.htm, accessed 2 September 2004.
129

Dose response
Ingestion of a large number of vegetative cells is required to cause C. perfringens food poisoning. From outbreak investigations, it has been estimated that levels of around 106 to 108 cfu/g in implicated foods will cause illness (Bates and Bodnaruk, 2003). Volunteer feeding studies have suggested a total dose of 5x10⁹ cells is required to cause illness (Hauschild and Thatcher, 1967). Ingestion of 8-10 mg of purified enterotoxin induces symptoms of gastroenteritis (Skjelkvale and Uemura, 1977a,b). However, food poisoning usually occurs from production of the enterotoxin in the gut, rather than ingestion of preformed toxin, so those levels may not represent a toxic dose under normal conditions of food poisoning.
Food matrix
Germination and outgrowth of C. perfringens is enabled by the generation of microaerophilic environments in foods cooked for long periods of time with poor heat penetration and inadequate aeration (Bates and Bodnaruk, 2003).
It has been suggested that the temperature stability of C. perfringens vegetative cells is enhanced in foods, perhaps due to a protective effect of fats (Labbe, 1989; Bradshaw et al., 1977).
5.3.3 Exposure Assessment
Sources and routes of contamination of poultry with C. perfringens
Type A C. perfringens is routinely isolated from soils and vegetation and may be considered as part of the normal intestinal microflora of chickens and other poultry species.
C. perfringens is a potential source of economic loss in broiler production as it causes necrotic enteritis, a condition characterised by the death or necrosis of the intestinal lining, predominantly of the upper small intestine, causing significant mortality, increased feed conversion ratio and slower growth rates. The presence of coccidia (single celled parasites that live in the gut wall) such as Eimeria species predisposes birds to necrotic enteritis (Balauca, 1976; Al-Sheikhly and Al-Saieg, 1980; Shane et al., 1985; Baba et al., 1992). Anticoccidial agents (e.g. ionophores such as narasin, lasalocid and maduramicin) also have antimicrobial action against C. perfringens (Martel et al., 2004) and reduce caecal carriage of C. perfringens in poultry (Elwinger et al., 1992; 1998; Watkins et al., 1997). Anticoccidials are routinely used in the Australian poultry industry for these dual purposes.
The following material on sources, prevalence and levels of C. perfringens in production and processing facilities for poultry is mainly derived from a long term series of studies undertaken in the USA by researchers in the Department of Agriculture. There is a significant lack of similar data generated for the Australian situation.
Farm environment
C. perfringens has been found to be a common intestinal resident of wild birds near broiler chicken houses (Craven et al., 2000). The study sampled dry and wet droppings from the environs of the chicken houses, as well as intestinal contents and cloacal swabs from euthanased birds. Overall, 23% of 124 samples tested positive. The potential for transmission of C. perfringens to broiler flocks if wild birds were able to gain entry was raised (Craven et al., 2000), but actual transmission was not investigated (e.g. by comparison of biotypes in wild birds and broiler flocks).
A study of the prevalence of C. perfringens in the broiler hatcheries operated by three different integrated poultry production and processing companies found C. perfringens in eggshell fragments and chick fluff and in paper pads placed beneath chicks. Overall, 20% of such samples were positive for C. perfringens (13-23% range for the three hatcheries; Craven et al., 2001a). These data indicate the potential for vertical transmission of C. perfringens through the poultry production process.
130

In a study of broiler flocks throughout the hatching and grow-out period, colonisation of the intestinal tract of broilers by C. perfringens was recognised as an early event. Most of 16 flocks on four farms of two integrated poultry production and processing companies were positive (faecal or caecal samples) by two weeks of age (Craven et al., 2001b). Investigations of the poultry houses and environment showed that C. perfringens could be routinely detected in wall swabs, fan swabs, fly strips, dirt outside the entrance and on workers boots, and transport cages/coops (Craven et al., 2001b). These results imply a number of potential horizontal routes of contamination of flocks.
Feed has been recognised as a potential source of C. perfringens contamination of poultry. Craven et al. (2001b) isolated the organism from 7% of 139 feed storage hoppers and 17% of feeders within growing sheds. Zimmer et al. (2002) state that C. perfringens commonly occurs in poultry feed. While vegetative cells of C. perfringens are not particularly desiccation tolerant, spores are very resistant to dry conditions (Craven et al., 2000) and could survive the feed production process.
The prevalence and level of C. perfringens carriage in broilers is very dependent on their diet, particularly the level and source of protein (Drew et al., 2004) and the level of antitryptic factors present. Diets rich in certain grains (wheat, barley, rye and oats) lead to increased prevalence and higher levels of C. perfringens (Craven, 2000; Annett et al., 2002) and to increased mortality due to necrotic enteritis. These effects are probably due to the increased rates of growth and proliferation of C. perfringens in the intestinal tract compared with birds on diets based on corn (Branton et al., 1987; Riddell and Kong, 1992; Annett et al., 2002). It has been suggested that protease-inhibitory substances in some grains might also have a role in the disease (Wobeser and Rainnie, 1987), through increased stability of the -exotoxin, the key virulence determinant associated with the production of necrotic lesions (Niilo, 1978; Fukata et al., 1988; Sheedy et al., 2004).
Processing
A study tracking C. perfringens ribotypes through two integrated broiler chicken production and processing operations showed that at least some of the C. perfringens contamination present on broiler chicken carcasses at the end of processing may have originated in the breeder flocks and been vertically transmitted through hatchery and grow-out phases of the operation (Craven et al., 2003). This study also showed that some ribotypes appear to persist for long periods of times within the production and processing environments.
Craven (2001) conducted a study to determine the incidence and numbers of C. perfringens in the scald and chill waters and processed broiler carcasses in a broiler processing facility. In the first experiment, samples were taken from the first flock processed in that shift. Incidence of C. perfringens ranged from 13% in chill water samples to 40% of post-processing scald water samples (taken after all birds in the flock were processed). Prevalence in carcass rinses was 19%.
A second experiment was conducted with samples taken in the middle of a processing shift. Reported incidences were 100% in each of three scald tanks, 88% in the prechill tank and 63% in the chill tank (Craven, 2001). Prevalence in carcass rinses in this experiment was 67%. The mean level of C. perfringens in carcass rinse samples was 1.20 log MPN per carcass, with much of this contamination present as heat-resistant spores of the organism rather than vegetative cells. In a follow-up experiment, 13 of 16 flocks processed in two separate plants had C. perfringens positive carcasses at the end of processing at a prevalence of 8-68% (mean 30%; Craven et al., 2001b). It is clear that spores of C. perfringens are dispersed throughout carcasses during the processing, with the scald and, to a lesser extent, chill waters being major sources of cross-contamination.
Prevalence and levels of C. perfringens in poultry
There are no Australian data on prevalence and/or levels of C. perfringens in poultry products in Australia to draw upon.
131

The USDA Baseline study (Table 1) and the series of papers by Craven and co-workers referenced in the preceding section provide the best indication of prevalence and levels of C. perfringens in poultry from modern processing facilities. In these studies, prevalence ranged from 8-68% of carcasses, and levels were found to be up to 106 cfu/carcass (with a geometric mean around 103 cfu/carcass in the Baseline study). It is noteworthy that the mean level of C. perfringens in broiler carcasses at the end of processing (1.20 log MPN per carcass) determined by Craven (2001) is significantly lower than that reported in the Baseline study conducted in 1994/1995 (3.5 log cfu per carcass), perhaps reflecting improvements in production and processing practises in the interim.
Other studies indicate that C. perfringens spores are a common contaminant of poultry meat products at retail.
A study of C. perfringens in American foods at retail found ~35% of samples of raw turkey and chicken contaminated with C. perfringens. However, only ~2% of samples (i.e. ~5% of contaminated samples) were contaminated with enterotoxin-positive strains of Type A C. perfringens capable of causing food-borne illness (Wen and McClane, 2004).
Similar conclusions were reached in a study of meat samples from a retail market in Shizuoke prefecture, Japan (Miwa et al., 1998). While 84% of chicken samples were contaminated with C. perfringens, at levels up to 102 MPN per gram, only 12% of samples contained enterotoxigenic C. perfringens strains, and the maximum levels of these were approximately 1.3 log units lower than the total C. perfringens level.
There are no data on the effect of further processing of carcasses into portions and various value-added and ready-to-eat poultry products on prevalence and levels of C. perfringens.
Growth of C. perfringens in poultry meat
Several studies indicate the potential for C. perfringens to grow on raw and cooked poultry under appropriate conditions (summarised in ICMSF, 1996).
Mead (1969) demonstrated growth of spores and vegetative cells under aerobic conditions in raw minced chicken leg and breast meat at temperatures of 22ºC, 30ºC, 37ºC and 50ºC. At the higher temperature, lag times of 1 and zero hours (resp.) and generation times of 28 and 40 minutes (resp.) were calculated from this data (ICMSF, 1996).
The growth, sporulation and enterotoxin formation of C. perfringens in autoclaved and cooked chicken dark meat and drumsticks was demonstrated by Craven et al. (1981). Chicken samples were inoculated with cultures of vegetative cells, and no special provision for anaerobiosis was made. Generation times as low as 12 min were calculated from the data for growth at 45ºC (ICMSF, 1996).
Growth of C. perfringens in turkey loaf at 45ºC has been reported, with generation times of the order of 15 minutes (Busta and Schroder, 1971).
Naik and Duncan (1977) reported growth in cooked chicken and turkey in experiments conducted under anaerobic conditions at 37ºC, with generation times of 42 and 19 minutes, respectively, calculated from their data (ICMSF, 1996)
Preparation and handling of poultry meat
Outbreaks of C. perfringens food poisoning are often associated with inadequate cooking and food handling practices, where germination and outgrowth is enabled by the generation of microaerophilic environments in foods cooked for long periods of time with poor heat penetration and inadequate aeration (Bates and Bodnaruk, 2003). Significant temperature abuse is usually reported in investigations, typically with large volumes of foods not being cooled sufficiently rapidly to hinder outgrowth to the high levels of vegetative cells associated with outbreaks.
132

As C. perfringens is widely distributed in the environment and spores of Type A strains can survive for long periods in soil and under conditions of desiccation, there is a possibility of contamination of raw or cooked poultry products at the retail and consumer level.
Since C. perfringens has been isolated from spices and vegetables, it may be that some outbreaks in poultry dishes are due to spores present on other components of the dish. However, the high growth rates described in chicken and turkey meat products indicate that, whatever the source of contamination, growth to high levels may be a function of the poultry meat component of the dish.
Consumption data
The total number of poultry servings in Australia annually (2,880,000,000) was estimated from annual consumption data (36 kg per person per year, average serving size 250g) and the Australian population (20 million).
5.3.4 Risk Characterisation
C. perfringens is an unavoidable contaminant of poultry through the on-farm production phase. Several potential sources of contamination of flocks have been identified, including feed, rodents, wild birds and soil and litter in sheds. Treatment of flocks with anticoccidials reduces the carriage of C. perfringens in flocks, also lowering the incidence of necrotic enteritis, a major source of economic loss if not controlled. However, data from the USA indicate high flock prevalence of C. perfringens at the end of the on-farm phase of production (Craven et al., 2001b).
Levels of C. perfringens at the end of processing are generally low, and comparison of the USDA Baseline survey data (geometric mean around 103 cfu/carcass) with those generated more recently by Craven (2001) (1.20 log MPN per carcass) may perhaps indicate improvements in control of this pathogen through processing. However, endemic contamination of the poultry meat processing environment is still evident in the later study (Craven, 2001).
However, recent studies have determined that, while the prevalence of C. perfringens in poultry meat products at retail is quite high (in Japan and the USA), only a small proportion of isolates carry the gene for the enterotoxin (CPE) primarily responsible for symptoms of food-borne illness (Miwa et al., 1998; Wen and McClane, 2004).
For C. perfringens to cause foodborne illness, the organism must multiply to reach high numbers in a food, allowing sufficient vegetative cells to survive passage through the stomach and subsequent sporulation and enterotoxin production in the intestine. In outbreaks, it is often the case that large portions of food are prepared and stored for consumption on the following day, with inadequate cooling leading to product that has undergone time and temperature abuse, thus allowing sufficient growth of C. perfringens.
The public health and safety risk due to C. perfringens in poultry meat products in Australia is considered to be of minor significance. Epidemiological data indicate an average of one outbreak per annum, although there is likely to be a significant level of underreporting. Peck (2002) reports a UK estimate of greater than 300-fold underreporting, but no supporting evidence is tendered. The risk factors are primarily in the retail, foodservice/catering and home sectors, rather than the primary production and processing environments.
133

ReferencesAdams, D.M. (1973) Inactivation of Clostridium perfringens type A spores at ultrahigh temperatures. Appl.
Microbiol. 26(3): 282-287.
Al-Sheikhly, F. and Al-Saieg, A. (1980) Role of Coccidia in the occurrence of necrotic enteritis of chickens. Avian Dis. 24(2): 324-333.
Annett, C.B., Viste, J.R., Chirino-Trejo, M., Classen, H.L., Middleton, D.M. and Simko, E. (2002) Necrotic enteritis: effect of barley, wheat and corn diets on proliferation of Clostridium perfringens type A. Avian Pathol. 31(6): 598-601.
Baba, E., Fuller, A.L., Gilbert, J.M., Thayer, S.G. and McDougald, L.R. (1992) Effects of Eimeria brunetti infection and dietary zinc on experimental induction of necrotic enteritis in broiler chickens. Avian Dis. 36(1): 59-62.
Balauca, N. (1976) Experimental reproduction of necrotic enteritis in fowl I: Mono infection and poly infection with Clostridium perfringens and coccidia in regard of cage kept hens [Experimentelle reproduktion der nekrotischen Enteritis beim Huhn. 1. mono und Polyinfektionen mit Clostridium perfringens und Kokzidien unter Beruksichtigung der Kafighaltung]. Arch. Exp. Veterinarmed. 30(6): 903-912.
Banerjee, M. and Sarkar, P.K. (2003) Microbiological quality of some retail spices in India. Food Res. Int. 36: 469-474.
Bates, J.R. and Bodnaruk, P.W. (2003) Clostridium perfringens, in Foodborne Microorganisms of Public Health Significance, 6th edn, Australian Institute of Food Science and Technology (New South Wales Branch) Food Microbiology Group, pp. 492–504.
Bernheimer, A.W. and Rudy, B. (1986) Interactions between membranes and cytolytic peptides. Biochim. Biophys. Acta 864(1): 123-141.
Bradshaw, J.G., Peeler, J.T. and Twedt, R.M. (1977) Thermal inactivation of ileal loop-reactive Clostridium perfringens type A strains in phosphate buffer and beef gravy. Appl. Environ. Microbiol. 34(3): 280-284.
Branton, S.L., Reece, F.N. and Hagler, W.M. Jr. (1987) Influence of a wheat diet on mortality of broiler chickens associated with necrotic enteritis. Poult. Sci. 66(8): 1326-1330.
Busta, F.F. and Schroder, D.J. (1971) Effect of soy proteins on the growth of Clostridium perfringens, Appl. Microbiol. 22(2): 177-183.
Carlin, F., Girardin, H., Peck, M.W., Stringer, S.C., Barker, G.C., Martinez, A., Fernandez, A., Fernandez, P., Waites, W.M., Movahedi, S., van Leusden, F., Nauta, M., Moezelaar, R., Del Torre, M., Litman, S., (2000) Research on factors allowing a risk assessment of spore-forming pathogenic bacteria in cooked chilled foods containing vegetables: a FAIR collaborative project. Int. J. Food Microbiol. 60(2-3): 117-135.
CDC (2004) U.S. Foodborne Disease Outbreaks, Centers for Disease Control and Prevention. Available at http://www.cdc.gov/foodborneoutbreaks/us_outb.htm. Accessed 2 September 2004.
Collee, J.G., Knowlden, J. A. and Hobbs, B. C. (1961) Studies on the growth, sporulation and carriage of Clostridium welchii with special reference to food poisoning strains. J. Appl. Bacteriol. 24: 326-339.
Craven, S.E. (2000) Colonization of the intestinal tract by Clostridium perfringens and fecal shedding in diet-stressed and unstressed broiler chickens. Poult. Sci. 79(6): 843-849.
Craven, S.E. (2001) Occurrence of Clostridium perfringens in the broiler chicken processing plant as determined by recovery in iron milk medium. J. Food Prot. 64(12): 1956-1960.
Craven, S.E., Blankenship, L.C. and McDonel, J.L. (1981) Relationship of sporulation, enterotoxin formation, and spoilage during growth of Clostridium perfringens type A in cooked chicken. Appl. Environ. Microbiol. 41(5): 1184-1191.
Craven, S.E., Stern, N.J., Line, E., Bailey, J.S., Cox, N.A. and Fedorka-Cray, P. (2000) Determination of the incidence of Salmonella spp., Campylobacter jejuni, and Clostridium perfringens in wild birds near broiler chicken houses by sampling intestinal droppings. Avian Dis. 44(3): 715-720.
Craven, S.E., Cox, N.A., Stern, N.J. and Mauldin, J.M. (2001a) Prevalence of Clostridium perfringens in commercial broiler hatcheries. Avian Dis. 45(4): 1050-1053.
134

Craven,, S.E., Stern, N.J., Bailey, J.S. and Cox, N.A. (2001b) Incidence of Clostridium perfringens in broiler chickens and their environment during production and processing. Avian Dis. 45(4): 887-896.
Craven, S.E., Cox, N.A., Bailey, J.S. and Cosby, D.E. (2003) Incidence and tracking of Clostridium perfringens through an integrated broiler chicken operation. Avian Dis. 47(3): 707-711.
Dalton, C.B., Gregory, J., Kirk, M.D., Stafford, R.J., Givney, R., Kraa, E. and Gould, D. (2004) Foodborne disease outbreaks in Australia, 1995 to 2000. Commun. Dis. Intell. 28(2): 211-224.
Drew, M.D., Syed, N.A., Goldade, B.G., Laarveld, B. and Van Kessel, A.G. (2004) Effects of dietary protein source and level on intestinal populations of Clostridium perfringens in broiler chickens. Poult. Sci. 83(3): 414-420.
Elwinger, K., Schneitz, C., Berndtson, E., Fossum, O., Teglof, B. and Engstom, B. (1992) Factors affecting the incidence of necrotic enteritis, caecal carriage of Clostridium perfringens and bird performance in broiler chicks. Acta Vet. Scand. 33(4): 369-378.
Elwinger, K., Berndtson, E., Engstrom, B., Fossum, O. and Waldenstedt, L. (1998) Effect of antibiotic growth promoters and anticoccidials on growth of Clostridium perfringens in the caeca and on performance of broiler chickens. Acta Vet. Scand. 39(4): 433-441.
Food Safety and Inspection Service (2004) Baseline Data. Available at http://www.fsis.usda.gov/Science/Baseline_Data/index.asp. Accessed 31 August 2004.
Fukata, T., Hadate, Y., Baba, E., Uemura, T. and Arakawa, A. (1988) Influence of Clostridium perfringens and its toxin in germ-free chickens. Res. Vet. Sci. 44(1): 68-70.
Hauschild, A.H.W and Thatcher, F.S. (1967) Experimental food poisoning with heat-susceptible Clostridium perfringens. J. Food Sci. 32: 467-471.
ICMSF (1996) Microorganisms in Foods 5. Characteristics of Microbial Pathogens. Blackie Academic and Professional, London.
ICMSF (1998) Microorganisms in Foods 6. Microbial Ecology of Food Commodities. Blackie Publishers Inc., Maryland.
Labbe, R. (1989) Clostridium perfringens, in M.P. Doyle (ed.), Foodborne Bacterial Pathogens. Marcel Dekker, Inc., New York. pp 191–234.
Labbe, R.G. and Duncan, C.L. (1974) Sporulation and enterotoxin production by Clostridium perfringens type A under conditions of controlled pH and temperature. Can. J. Microbiol. 20(11): 1493-1501.
Martel, A., Devriese, L.A., Cauwerts, K., De Gussem, K., Decostere, A. and Haesebrouck, F. (2004) Susceptibility of Clostridium perfringens strains from broiler chickens to antibiotics and anticoccidials. Avian Pathol. 33(1): 3-7.
Mead, GC. (1969) Growth and sporulation of Clostridium welchii in breast and leg muscle of poultry. J. Appl. Bacteriol. 32(1): 86-95.
Miwa, N., Nishina, T., Kubo, S., Atsumi, M. and Honda, H. (1998), Amount of enterotoxigenic Clostridium perfringens in meat detected by nested PCR. Int. J. Food Microbiol. 42(3), 195-200.
Naik, H.S. and Duncan, C.L. (1977) Enterotoxin formation in foods by Clostridium perfringens type A. J. Food Saf. 1(1): 7-18.
Niilo, L. (1978) Enterotoxigenic Clostridium perfringens type A isolated from intestinal contents of cattle, sheep and chickens. Can. J. Comp. Med. 42(3): 357-363.
Peck, M.W. (2002) Clostridia and food-borne disease. Microbiol. Today 29: 9-12.
Riddell, C. and Kong, X.M. (1992) The influence of diet on necrotic enteritis in broiler chickens. Avian Dis. 36(3),:499-503.
Roach, R.L. and Sienko, D.G. (1992) Clostridium perfringens outbreak associated with minestrone soup. Am. J. Epidemiol. 136(10): 1288-1291.
Roy, R.J., Busta, F.F. and Thompson, D.R. (1981) Thermal inactivation of Clostridium perfringens after growth at several constant and linearly rising temperatures. J. Food Sci. 46(5): 1586-1591.
Shane, S.M., Gyimah, J.E., Harrington, K.S. and Snider, T.G. 3rd. (1985) Etiology and pathogenesis of necrotic enteritis. Vet. Res. Commun. 9(4): 269-287.
135

Sheedy, S.A., Ingham, A.B., Rood, J.I. and Moore, R.J. (2004) Highly conserved alpha-toxin sequences of avian isolates of Clostridium perfringens. J. Clin. Microbiol. 42(3): 1345-1347.
Skjelkvale, R. and Uemura, T. (1997a) Detection of enterotoxin in faeces and anti-enterotoxin in serum after Clostridium perfringens food-poisoning. J. Appl. Bacteriol. 42(3): 355-363.
Skjelkvale, R. and Uemura, T. (1997b) Experimental diarrhoea in human volunteers following oral administration of Clostridium perfringens enterotoxin. J. Appl. Bacteriol. 43(2): 281-286.
Solberg, M. and Elkind, B. (1970) Effect of processing and storage conditions on the microflora of Clostridium perfringens-inoculated frankfurters. J. Food Sci. 35(2): 126-129.
Titball, R.W. (1993) Bacterial phospholipases C. Microbiol. Rev. 57(2): 347-366.
Watkins, K.L., Shryock, T.R., Dearth, R.N. and Saif, Y.M. (1997) In-vitro antimicrobial susceptibility of Clostridium perfringens from commercial turkey and broiler chicken origin. Vet. Microbiol. 54(2): 195-200.
Wen, Q. and McClane, B.A. (2004) Detection of enterotoxigenic Clostridium perfringens type A isolates in American retail foods. Appl. Environ. Microbiol. 70(5): 2685-2691.
Willardsen, R.R., Busta, F.F., Allen, C.E. and Smith, L.B. (1978) Growth and survival of Clostridium perfringens during constantly rising temperatures. J. Food Sci., 43(2): 470-475.
Wobeser, G. and Rainnie, D.J. (1987) Epizootic necrotic enteritis in wild geese, J. Wildl. Dis. 23(3): 376-385.
Zimmer, M., Vukov, N., Scherer, S. and Loessner, M.J. (2002) The murein hydrolase of the bacteriophage 3626 dual lysis system is active against all tested Clostridium perfringens strains. Appl. Environ. Microbiol. 68(11): 5311-5317.
5.4 Listeria monocytogenes
5.4.1 Hazard Identification
Listeria monocytogenes (L. monocytogenes) is a gram positive, non-spore forming rod that may be isolated from a variety of sources including soil, silage, sewage, food-processing environments, raw meats and the faeces of healthy humans and animals (USFDA CFSAN, 2004a). L. monocytogenes belongs to the genus Listeria along with L. innocua, L. welshimeri, L. selligeri, L. ivanovii and L. grayi. Thirteen serotypes are associated with L. monocytogenes (1/2a, 1/2b, 1/2c, 3a, 3b, 3c, 4a, 4ab,4b, 4c, 4d, 4e, 7).
Growth characteristics
Growth of L. monocytogenes in foods is influenced by a variety of factors, including the nature and concentration of essential nutrients, pH, temperature, water activity, the presence of food additives that could enhance or inhibit growth and presence of other microbial flora (Lovett et al., 1990). The limits and optima for key factors are summarised in Table 5.7.
Table 5.7 Growth conditions for L. monocytogenes (ANZFA unpublished)Minimum Optimum Maximum
Temperature (oC) -1.5 37 45pH 4.39 7.0 9.4Water activity (aw) 0.90 - -
Under conditions outside the growth range, the bacteria may survive, so that growth will recommence once suitable conditions are encountered.
Temperatures of >50oC are lethal to L. monocytogenes. When in a suitable medium, L. monocytogenes can grow between ~0-45oC. Although L. monocytogenes does not grow below –1.5oC, it can readily survive at much lower temps.
136

Nonetheless, freezing and frozen storage will cause a limited reduction in the viable population of L. monocytogenes. Optimal conditions for growth are between 30 and 37oC (Ryser and Marth, 1999).
L. monocytogenes will grow in a broad pH range with the upper limit being about 9.3 and the lower limit being 4.6-5.0 (ICMSF, 1996). Although growth at pH <4.3 has not yet been documented, L. monocytogenes appears to be fairly acid tolerant. It has been suggested that food fermentations, which involve a gradual lowering of pH, could lead to acid adaptation of L. monocytogenes.
Like most bacterial species, L. monocytogenes grows optimally at a aw of approximately 0.97. However, when compared with most food-borne pathogens, the bacterium has the unique ability to multiply at aw values as low as 0.90. While it does not appear to be able to grow below 0.90, the bacterium can survive for extended periods at lower values (Ryser and Marth, 1999).
L. monocytogenes is reasonably tolerant to salt and can grow in NaCl concentrations up to 10% (European Commission, 2003). Extended survival occurs at a wide range of salt concentrations and L. monocytogenes has survived for up to 8 weeks in a concentration of 20% NaCl (Sutherland et al., 2003). Survival in the presence of salt varies with storage temperature and studies indicate that survival by Listeria in concentrated salt solutions can be increased dramatically by lowering the incubation temperature (Ryser and Marth, 1999).
Listeria grows well under both aerobic and anaerobic conditions. L. monocytogenes grows well in the presence of CO2 (Ryser and Marth, 1999; Sutherland et al., 2003).
The ability of preservatives to act as antilistericidal agents is strongly influenced by the interactive effects of temperature, pH, type of acidulant, salt content, water activity, and type and concentration of food additives present in the food. For example the ability of potassium sorbate to prevent growth of L. monocytogenes is related to temperature and pH. The lower the storage temperature and pH of the medium, the greater the effectiveness of sorbates against L. monocytogenes. Sodium benzoate is more inhibitory to L. monocytogenes than is either potassium sorbate or sodium propionate. Inhibition and inactivation of L. monocytogenes in the presence of sodium benzoate is affected by (a) temperature (more rapid at higher than lower incubation temperatures) (b) concentration of benzoic acid (more rapid at higher than lower concentrations) and (c) pH (more rapid at lower rather than higher pH values) as well as the type of acid used to adjust the growth medium (Ryser and Marth, 1999).
Pathology of illness
There are two main forms of illness associated with L. monocytogenes infection; listerial gastroenteritis, where usually only mild, flu-like symptoms are reported, and the classic invasive Listeriosis, where the bacteria penetrate the gastrointestinal tract and invade normally sterile sites within the body (USFDA Centre for Food Safety and Applied Nutrition, 2004a).
Symptoms associated with the mild form of L. monocytogenes infection are primarily those associated with gastrointestinal illness: chills, diarrhoea, headache, abdominal pain and cramps, nausea, vomiting, fatigue, and myalgia (FDA/CFSAN and USDA FSIS, Centers for Disease Control and Prevention, 2003). The onset time to gastrointestinal illness is probably greater than 12 hours (USFDA CFSAN, 2004a).
Invasive Listeriosis is clinically defined when the organism is isolated from blood, cerebrospinal fluid or an otherwise normally sterile site (e.g. placenta, foetus). The manifestations include septicaemia, meningitis (or meningoencephalitis), encephalitis, and intrauterine or cervical infections in pregnant women, which may result in spontaneous abortion in the second or third trimester, or stillbirth (USFDA CFSAN, 2004a). The onset of these manifestations is usually preceded by influenza-like symptoms including persistent fever. Gastrointestinal symptoms such as nausea, vomiting and diarrhoea may also precede the serious forms of Listeriosis. Listeriosis typically has a 2 to 3 week incubation time, but onset time may extend to 3 months (FDA/ CFSAN and USDA FSIS and Centers for Disease Control and Prevention, 2003).
137

It is estimated that approximately 2-6 percent of the healthy human population harbours L. monocytogenes in their intestinal tract, which suggests that people are frequently exposed to L. monocytogenes (Rocourt and Bille, 1997; Farber and Peterkin, 1991). This may also suggest that most people have tolerance to infection by L. monocytogenes, and given the relatively low number of reported cases, exposure rarely leads to serious illness in health individuals;(USFDA CFSAN, 2004a; Hitchins, 1996; Marth, 1988).
Mode of transmission
Foodborne exposure is the primary route of transmission for Listeriosis, however Listeriosis can be transmitted vertically (i.e. mother to child), zoonotically and through hospital acquired infections.
Incidence of illness
Most cases of Listeriosis are sporadic. The number of cases of invasive Listeriosis reported in Australia in 2001 was 61, with 62 cases reported in 2002, (OzFoodNet Working Group, 2001; OzFoodNet Working Group, 2002a) which equates to approximately three cases per million persons. In Australia, the exact mortality rate is not known, although the data available would suggest a rate of approximately 23%.
The estimated incidence of invasive Listeriosis in New Zealand is five cases per million (average number of cases 17 per annum) of the general population per year (Anon, 1996; Anon, 1997; Anon, 1998; Anon, 1999; Anon, 2000; Anon, 2001). The case fatality rate in New Zealand since 1995 is approximately 17%.
The estimated incidence of invasive Listeriosis in European countries has been reported to between 0.3-7.5 cases per million of the general population per year (European Commission, 2003). In France, the estimated incidence is sixteen cases per million (general population) per year (ICMSF, 1996; Bille, 1990b). The annual incidence of Listeriosis in the United States has been estimated to range from 3.4 per million (Centers for Disease Control and Prevention, 2000) to 4.4 per million (Tappero et al., 1995). Of all food-borne pathogens, L. monocytogenes results in the highest hospitalisation rate in the United States, with fatality rates of 20-30% being common (FAO/WHO, 2004).
Outbreaks have been linked to Hispanic-style soft cheeses; soft, semi-soft and mould-ripened cheeses; hot dogs; pork tongue jelly; processed meats; pate; salami; pasteurised chocolate flavoured milk; pasteurised and unpasteurised milk; butter; cooked shrimp; smoked salmon; maize and rice salad; maize and tuna salad; potato salad; raw vegetables; and coleslaw (FDA/FSIS, 2003). In addition, sporadic cases have been linked to the consumption of raw milk; unpasteurised ice cream; ricotta cheese; goat, sheep and feta cheeses; soft, semi-soft and mould-ripened cheeses; Hispanic-style cheese; salami; hot dogs; salted mushrooms; smoked code roe; smoked mussels; undercooked fish; pickled olives; raw vegetables; and coleslaw (FAO/WHO, 2004).
An outbreak of Listeriosis associated with consumption of pre-cooked, diced chicken occurred in South Australia during 1996 (Hall et al., 1996). There were five confirmed cases of Listeriosis, including one death. The majority of cases were patients of health care facilities.
138

Table 5.8 Outbreaks of Listeriosis (US: 1970-2002; Outside US: 1970-2000) with known food vehicle(s) (FDA/CFSAN, USDA FSIS, CDC, 2003).
Year Food Vehicle Country Cases Deaths (% total) Sero-type Reference
Not Specified
Frozen vegetables US 7 Unknown 4b Simpson.D.M., 1996
1983-1987 Vacherin Mont d'Or cheese Switzer-land
122 31 (25.4) 4b Bille, 1990a; Bula et al., 1995
1987-1989 Pâté and meat spreads England 355 94 (26.5) 4b McLauchlin et al., 1991
1986-1987 Ice cream, salami, brie cheese
US 36 16 (44.4) 4b,1/2b, 1/2a
Schwartz et al., 1989
1986-1987 Raw eggs US 2 Unknown 4b Schwartz et al., 1989
1998-1999 Hot dogs, deli meats US 101 21 (20.8) 4b Mead, 2004
2000-2001 Homemade Mexican-style cheese (raw milk)
US 12 5 (41.7) unknown CDC, 2001
1978-1979 Vegetables (raw) Australia 12 0 (0) Unknown Le Souëf and Walters, 1981
1989-1990 Semi-soft Cheese (blue) Denmark 23 0 (0) 4b Jensen et al., 1994
1994-1995 Smoked Seafood (finfish and molluscs)
Sweden 9 2 (22.2) 4b Ericsson et al., 1997
1998-1999 Butter Finland 25 6 (0) 3a Lyytikainen et al., 2000
1999-2000 Pigs tongue in aspic France 26 7 (0) Unknown Dorozynski, 2000
1979 Raw vegetables or cheese US 20 3 (15.0) 4b Ho et al., 1986
1980 Raw seafood (finfish and molluscs)
New Zealand
22 6 (27.3) 1b Lennon et al., 1984
1981 Miscellaneous Dairy Products
England 11 5 (45.5) 1/2a Ryser, 1999
1981 Vegetables (raw) Canada 41 17 (41.5) 4b Schlech, III et al., 1983
1983 Pasteurized fluid milk US 32 14 (43.8) 4b Fleming et al., 1985
1985 Mexican-style cheese (raw milk)
US 142 48 (33.8) 4b Linnan et al., 1988
1986 Unpasteurised milk, organic vegetables
Austria 28 5 (17.9) Unknown Allerberger and Guggenbichler, 1989
1987 Butter US 11 Unknown Unknown Ryser, 1999
1990 Pâté and meat spreads Australia 11 6 (54.5) 1/2a Ryser, 1999
1991 Smoked mussels Australia 4 0 (0) 1/2a Mitchell, 2001; Misrachi et al., 1991
1992 Smoked mussels New Zealand
4 0 (0) 1/2 Brett et al., 1998
1992 Pork tongue in jelly France 280 63 (22.5) 4b Jacquet et al., 1995
1993 Rillettes France 38 11 (28.9) 4b Goulet et al., 1998
1995 Soft Ripened Cheese, >50% moisture (brie, feta, camembert, mozzarella)
France 33 4 (20.0) 4b Jacquet et al., 1995; Goulet et al., 1995
1996 Cooked chicken Australia 5 1 (20.0) Hall et al., 1996
1997 Pon l'Eveque cheese France 14 0 (0) 4b Ryser, 1999
1999 Pâté US 11 unknown 1/2a Carter, 2000
2000 Deli turkey meat US 29 7 (24.1) unknown CDC, 2000
2002 Deli turkey meat, sliceable US 63 7 (11.1) unknown CDC, 2002
139

Occurrence in foods
L. monocytogenes has been found in foods such as milk, dairy products (particularly soft-ripened cheeses), meat, poultry, seafood and vegetables.
The worldwide incidence rate for L. monocytogenes spp. in raw milk is estimated to be around 3-4% (Doores and Amelang, 1988; Hayes et al., 1986; Lovett et al., 1987). In Australian surveys on soft and surface ripened cheeses and ice-cream, L. monocytogenes has been isolated from 2% of locally produced cheese samples and 6% of ice-cream samples (Sutherland et al., 2003). 7% of imported cheeses, camembert and blue vein were positive for L. monocytogenes (Sutherland et al., 2003). 25% of European soft and surface-ripened cheeses have been found to be positive for L. monocytogenes (Terplan, 1988).
The incidence of listeriae in slaughter animals is generally low (0-9%) (Farber and Peterkin, 1999). Overseas studies have shown the prevalence of L. monocytogenes contamination in raw meat to be in the range 5-20% (Farber and Peterkin, 1999). In Australia, levels of 24% in beef, 16% in lamb and 10% in pork have been found (Ibrahim and MacRae, 1991). Other meat products from which L. monocytogenes has been isolated include minced meat products, sausages, salami, ham, mettwurst, pate, frankfurters and vacuumed packed meat (Farber and Peterkin, 1991).
Incidence in poultry meat products ranges from 12-60% (Ojeniyi et al., 2004), and has been isolated from fresh, frozen, cook-chill and precooked ready to eat chicken piece products (Cox et al., 1999).
L. monocytogenes has been detected in fresh, frozen and processed seafood. Prevalence rates in fresh processed seafood ranges between 4-12% in published surveys (Sutherland et al., 2003).
Types of vegetable produce where the organism has been detected include radishes, cucumbers, cabbage, potatoes, lettuce, frozen broccoli and cauliflower and endive (Brackett, 1999; Heisick et al., 1989). Levels of 44% have been detected on fresh cut salad vegetables in the Netherlands, and 9% in prepared salads in Ireland (Harvey and Gilmour, 1993). Recent European surveys show the presence of Listeria to be less than 10% (Brackett, 1999).
5.4.2 Hazard Characterisation
Virulence and infectivity of L. monocytogenes
When ingested, L. monocytogenes penetrates the intestinal tissue and is taken up by macrophages and non-phagocytic cells in the host. L. monocytogenes is disseminated throughout the host via blood or lymphatic circulation to various tissues. Its presence intra-cellularly in phagocytic cells permits access to the brain and probably transplacental migration to the foetus in pregnant women. The pathogenesis of L. monocytogenes relies on its ability to survive and multiply in phagocytic host cells.
Not all strains appear to be equally virulent. The 4b and occasionally 1/2a and 1/2b serovars account for most cases of human Listeriosis (ICMSF, 1996).
The virulence of L. monocytogenes is increased when the bacterium is grown at low rather than high temperatures. The possibility exists that cold storage may enhance virulence of some L. monocytogenes strains isolated from refrigerated foods (Ryser and Marth, 1999).
Dose Response
Cases of non-invasive Listeriosis (also referred to as febrile listerial gastroenteritis) have been observed during outbreaks, involving symptoms such as diarrhoea, fever, headache and myalgia, generally following a short incubation period (FAO/WHO, 2004), Insufficient quantitative data is available to develop a dose-response model for this milder form of Listeriosis, however, outbreak situations have generally involved the ingestion of high doses of L. monocytogenes.
140

The dose-response relationship for invasive Listeriosis is highly dependent on number of factors, such as the virulence characteristics of the organism, the number of cells ingested, the general health and immune status of the host, and the attributes of the food matrix that alter the microbial or host status. FDA/FSIS (2003) and FAO/WHO (2004) developed separate dose-response models for both healthy and susceptible populations by combining data from surrogate animal models with epidemiological data. For the healthy population (classified as “intermediate-age”) the median mortality rate from ingestion of 109 organisms was estimated to be 1.0 10-6 (FDA/FSIS). For neonatal and elderly groups the mean mortality rate at the same dose was estimated to be 1.4 10-3 and 3.3 10-6
respectively
Immune status
At risk groups for invasive Listeriosis include pregnant women and their foetuses, neonates, the elderly and persons with a compromised immune system, whose resistance to infection is lowered (e.g. transplant patients, patients on corticosteroid treatments, HIV/AIDS patients and alcoholics). Less frequently reported, diabetic, cirrhotic, asthmatic and ulcerative colitis patients are also at more risk (USFDA CFSAN, 2004a).
Another physiological parameter thought to be relevant to susceptibility is a reduced level of gastric acidity (FAO/WHO, 2004).
Food Matrix
To date, food has been viewed as a neutral vehicle for L. monocytogenes. However, food vehicles with high buffering capacity may protect the bacteria from inactivation by the pH of gastric acids in the stomach, although there is insufficient data available whether the food matrix effects could influence the dose-response for L. monocytogenes (FAO/WHO, 2004).
5.4.3 Exposure Assessment
Sources and routes of contamination of poultry with L. monocytogenes
Farm environment
Listeria is frequently isolated from poultry, feed samples, and faeces in the farm environment. It appears that L. monocytogenes is transferred from environmental sources to the poultry. Research conducted by Ojeniyi et al (1996) shows an absence of L. monocytogenes in cloacal samples from broilers. A study by Skovgarrd and Morgen (1988) found the presence of L. monocytogenes in 62% of animal feed samples, 33% of poultry faeces, and 47% of poultry neck skin samples. However a study by Fenlon et al, (1996) found poultry faeces to be free of Listeria prior to slaughter. The same study examined the litter from a poultry house being used to intensively rear broiler chickens and found 1 out of 9 samples to be positive for L. monocytogenes. In addition, 1/7 swabs of the crates used to transport the birds to slaughter tested positive for L. innocua only (Fenlon et al 1996).
Table 5.9 Frequencies of L. monocytogenes in bedding samples collected from poultry farms, in cloaca swabbing samples of broilers before exsanguination and in broiler carcasses from the same flock and day as the swabbing (Rorvik et al., 2003)
Source No samples No flocks L. monocytogenes positive samples
Bedding 28 28 1 (3.6%)
Broiler cloaca 596 20 1 (0.2%)
Broiler carcasses 20 20 17 (85%)
141

A study in Denmark estimated a flock prevalence of 3% after L. monocytogenes was isolated from 2/72 broiler flocks (Peterson and Madsen, 2000).
Processing
Processing was previously described graphically in Figure 1.2.
The prevalence of L. monocytogenes on carcasses at the beginning of processing is generally low. An increase of the presence and levels of L. monocytogenes in raw products appears to correlate with the amount of processing (Lawrence and Gilmour, 1994).
L. monocytogenes can be found in many parts of the processing environment including reception areas, floors, equipment of the meat processing area (working tables, transport belts, etc.) (Elise Chasseignaux et al, 2002). L. monocytogenes has also been detected on processing equipment including the rubber fingers of defeathering machines, packaging funnel, air chiller and skin-removing machines (Dykes et al, 1994; Miettinen et al, 2001). In many cases machinery is difficult to clean, with and fat and protein deposits on numerous surfaces providing good conditions for bacterial growth and/or biofilm formation (Ojeniyi et al, 2000). Miettinen et al (2001) suggests that contamination of carcasses probably occurs during or after the chilling step and during skin-removal. Dykes et al (1994) isolated L. monocytogenes only after spin chilling. The environment was colonised by one dominating strain, which was also frequently isolated from the broiler carcasses. Lawrence and Gilmour (1994), Chassienaux et al. (2002) and Berrang et al. (2000) also suggest that L. monocytogenes may persist and colonise the processing environment.
Given the potential of this organisms to establish itself and persist in poultry processing environment, it can be assumed that a low grade but constant cross-contamination (for instance form infected broiler flocks) will allow continued colonisation of processing equipment (Peterson and Madsen, 2000).
Table 5.10 The frequency of Listeria spp. Detection in different types of samples collected from a chicken nugget processing line (Rodrigues et al., 2002)
No positive/No. samples (%) positive
Product contact surfaces 98/198 49.5
Non product contact sites 18/18 100
Food handlers 7/42 16.7
Product 148/155 95.5
Table 5.11 Isolation of L. monocytogenes in environmental samples (296) from the various sites of a slaughterhouse and broiler carcasses (26) (Rorvik et al., 2003).
Source No. Samples L. monocytogenes positive (%)
Receiving area 43 10 (23)
Picking area 48 4 (8)
Evisceration area 87 17 (20)
Sorting and packaging area 118 44 (37)
Broiler carcasses 26 19 (73)
Prevalence of L. monocytogenes in raw and cooked poultry meat products
Depending on the country, as well as isolation techniques utilised, incidence rates for Listeria spp. range from 2-94% (Waldroup, 1996). Jay (1996) summarised 26 reports from 10 countries and found that of 7054 poultry and poultry product samples about 17% where positive for L. monocytogenes (Table 5.12).
142

Table 5.12 L. monocytogenes in poultry and poultry productsCountry Product No. Positive ReferenceUK Raw chicken 20/35 Kwantes and Isaac, 1974UK Oven-ready poultry 17/51 Kwantes and Isaac, 1974UK Oven-ready poultry 10/68 Gitter, 1976USA Poultry 7/22 McClain and Lee, 1988UK Fresh chickens 23/50 Pini and Gilbert, 1988UK Frozen chickens 27/50 Pini and Gilbert, 1988Denmark Neck and skin 8/17 Skovgaard and Morgen, 1988UK Cook-chill 5/21 Kerr et al, 1988Switzerland Poultry 14/56 Breer and Breer, 1988New Zealand Chicken parts 12/25 Lowry and Tiong, 1988UK Ready-to-eat precooked 63/527 Gilbert et al, 1989Canada Chicken legs 9/16 Farber et al, 1989USA Broiler carcasses 21/90 Bailey et al, 1989USA Fresh wings, legs, livers 17/100 Genigeorgis et al, 1989Australia Frozen chicken 12/80 Varabioff, 1990UK Pre-cooked, chilled 27/102 Kerr et al, 1990USA Fresh turkey parts 27/90 NACMSF (1991)USA Broiler backs 448/2072 NACMSF (1991)USA Cooked poultry 280/1730 NACMSF (1991)USA Cooked poultry 22/1580 NACMSF (1991)Taiwan Chicken carcasses 8/16 Wong et al, 1990Taiwan Turkey parts 19/50 Wong et al, 1990UK Raw poultry 34/58 Wang et al, 1992UK Edible offal 13/60 Lawrence and Gilmour, 1994China Chicken 1/21 Pini and Gilbert, 1988Malaysia Chicken, parts 42/67 Arumungaswamy et al, 1994
L. monocytogenes has frequently been isolated from poultry meat product in several studies. Frequencies of 41, 59, and 84% have been reported from broiler carcasses and from raw chicken meat products and from 0 to 61% from processed poultry meat products. The levels are mostly <100 cfu/g–1, but up to 4.2 log cfu/g–1 has been found on raw chicken drumsticks (Lawrence and Gilmour 1994; Franco et al., 1995; Uyttendale et al., 1999).
A recent survey of L. monocytogenes in broilers and poultry meat products has shown levels in raw poultry meat products (carcasses and cuts) to be often low (<100 cfu/g). However 17/123 (14%) of positive samples contained 2-3 long cfu/g and 14/123 (11%) contained 3-4 log cfu/g (Rorvik et al., 2003).
Of raw broiler pieces (portions) sampled from retail stores, 62% (38/61) were positive for L. monocytogenes (Miettinen et al, 2001).
Table 5.13 L. monocytogenes in poultry meat products from seven slaughterhouses and two poultry product processing plants (Rorvik et al., 2003).
No of samples No of plants No of flocks No. positive with L. monocytogenes (%)
Broiler carcasses 150 7 142 75 (50)
Broiler cuts 95 1 48 (50)
Processed poultry* 91 2 1(1)
Grilled broilers 49 6 1 (2)* vacuum packed, processed, sliced
143

Table 5.14 Incidence of L. monocytogenes in poultry carcasses, poultry cuts, and processed poultry in a Belgian retail market (Uyttendaele et al., 1999)
Form Poultry sample >1 cfu/cm2 or g (%) >1 cfu/100 cm2 or 25 g (%)
Carcasses Chicken 15/133 (11.3) 55/133 (41.3)
Boiling hen 9/32 (28.1) 26/32 (81.2)
Spring chicken 8/48 (16.7) 22/48 (45.8)
Guinea fowl 2/32 (6.2) 11/32 (34.4)
Cuts Chicken 36/225 (16) 105/225 (46.7)
Turkey 1/164 (0.6) 30/164 (18.3)
Spring chicken 8/28 (28.6) 12/28 (42.8)
Guinea fowl 0/3 (0) 0/3 (0)
Processed Chicken 14/41 (34.1) 25/41 (61)
Turkey 2/66 (3.0) 9/66 (13.6)
The incidence of Listeria spp. in raw poultry was examined in NSW from 1988-1993. Of samples taken, 15/33 were positive for Listeria spp. (45.5%), with one being positive for L. monocytogenes (Arnold and Coble, 1995). A similar study undertaken in the ACT during 1999-2000 found the incidence of L. monocytogenes on raw chilled chicken meat to be 36% (96/266) at retail (Millard and Rockliff, 2000; Uyttendaele et al., 1999).
Of greatest concern is the presence of L. monocytogenes in fully cooked, ready to eat poultry products (cooked diced chicken meat, sliced meats etc). A survey undertaken by the Western Australian Department of Health isolated L. monocytogenes from 41% (39/94) of cooked chicken meat samples analysed (WAFMP, 2004).
Growth of L. monocytogenes in poultry meat products
Ryser and Marth (1999) summarised studies of the growth of L. monocytogenes in poultry. L. monocytogenes does not appear to grow in anaerobically packaged raw chicken during extended storage, however when packaged microaerobically under conditions stimulating commercial practices, numbers of L. monocytogenes in raw chicken increase rapidly during extended storage at 4oC. Numbers of Listeria in cooked/ready-to-eat poultry meat products increase by 1-6 orders of magnitude after 6-28 days of storage at 3-7oC with populations higher in aerobically packaged as opposed to vacuum-packaged or modified-atmosphere packaged products (Ryser and Marth, 1999).
Preparation and storage of poultry meat
In addition to L. monocytogenes, being introduced during the production and processing of poultry meat, it may also be introduced at the retail and consumer-end (storage and preparation at food service or at the home), either through cross-contamination or inadequate cooking at the retail outlet or consumer household.
Some of these factors that impact on the safety of poultry products in relation to L. monocytogenes include: storage conditions of poultry meat products
time temperature separation of uncooked and cooked poultry products
cross-contamination during the preparation, storage or handling of poultry and ready-to-eat food products
heat treatment of poultry meat products (i.e. inadequate cooking)
144

Consumption data
The total number of poultry servings in Australia annually (2,880,000,000) was estimated from annual consumption data (36 kg per person per year, average serving size 250g) and the Australian population (20 million).
5.4.4 Risk Characterisation
L. monocytogenes is often present on raw poultry meat. There is little evidence, however, that multiplication of L. monocytogenes on raw poultry meat during storage is a major risk factor in human Listeriosis (ICMSF, 2000; Uyttendaele et al., 1999). Case control studies, however, suggest that undercooking raw poultry meat products may be involved in human Listeriosis among susceptible individuals (Schuchat et al., 1992).
L. monocytogenes is primarily a concern for ready-to-eat poultry meat products. Contamination may occur post heat treatment, either directly from the processing environment or via cross-contamination at retail (e.g. sliced ready-to-eat meats). In the absence of competition with normal flora usually associated with raw poultry, the organism can multiply, even when stored at <4C. Ready-to-eat meat poultry products have been implicated in outbreaks of Listeriosis with turkey and chicken meat products in the US in 2002, and cooked chicken meat products being responsible for two outbreaks in Australia in 1996.
References Allerberger, F. and Guggenbichler, J.P. (1989) Listeriosis in Austria--report of an outbreak in 1986. Acta
Microbiol Hung. 36(2-3):149-152.
Anon. (1996) Communicable Disease Surveillance Data. New Zealand Public Health Report 3(2):14.
Anon. (1997) Communicable Disease Surveillance Data. New Zealand Public Health Report 3(2):14.
Anon. (1998) Communicable Disease Surveillance Data. New Zealand Public Health Report 3(2):14.
Anon. (1999) Communicable Disease Surveillance Data. New Zealand Public Health Report 3(2):14.
Anon. (2000) Communicable Disease Surveillance Data. N 3(2):14.
Anon. (2001) Communicable Disease Surveillance Data. New Zealand Public Health Report 3(2):14.
Arnold, G.J. and Coble, J. (1995) Incidence of Listeria species in NSW. Food Australia 47(2): 71-75.
Arumugaswamy, R.K., Ali, G.R.R. and Hamid, S.N.N. (1994) Prevalence of Listeria monocytogenes in foods in Malaysia. Int.J.Food Microbiol. 23:117-121.
Bailey, J.S., Fletcher, D.L. and Cox, N.A. (1989) Recovery and serotype distribution of Listeria monocytogenes from broiler chickens in southeastern United States. J.Food Prot. 52:148-150.
Berrang, M.E., Lyon, C.E. and Smith, D.P. (2000) Incidence of Listeria monocytogenes on pre-scald and post-chill chicken. Journal of Applied Poultry Research 9:546-550.
Bille, J. (1990a) Epidemiology of human listerisosis in Europe, with special reference to the Swiss outbreak . In: A.J.Miller, J.L.S.a.G.A.S. eds. Foodborne Listeriosis. Elsevier, Amsterdam, pp71-74.
Bille, J. (1990b) Epidemiology of human listerisosis in Europe, with special reference to the Swiss outbreak. In: A.J. Miller, J.L. Smith., and G.A. Somkuti, eds. Foodborne Listeriosis. 71-74. Elsevier, Amsterdam.
Brackett, R.E. (1999) Incidence and behaviour of Listeria monocytogenes in products of plant origin. In E. T. Ryser and E. H. Marth (eds), Listeria, Listeriosis and food safety. 631-655. Marcel Dekker, New York.
Breer, C. and Breer, G. (1988) The isolation of Listeria spp. in meat and meat products in: Proc. 34th Int. cong. Meat Sci. and Technol., Pt. B: Australia.
Brett, M.S., Short, P. and McLauchlin, J. (1998) A small outbreak of listeriosis associated with smoked mussels. Int J Food Microbiol 43(3):223-229.
145

Bula, C.J., Bille, J. and Glauser, M.P. (1995) An epidemic of food-borne listeriosis in western Switzerland: description of 57 cases involving adults. Clin Infect Dis 20(1):66-72.
Carter, M. (2000) Final report: Investigation of outbreak 99-372 (unpublished data). Baltimore, MD.
Centers for Diseae Control and Prevention. (2000) Multistate outbreak of listeriosis-United States, 2000. Morbidity and Mortality Weekly Report 49:1129-1130.
Centers for Diseae Control and Prevention. (2001) Outbreak of listeriosis associated with homemade Mexican-style cheese- North Carolina, October 2000 - January 2001. Morbidity and Mortality Weekly Report 50:560-562.
Centers for Diseae Control and Prevention. (2002) Outbreak of listeriosis-Northeastern United States, 2002. Morbidity and Mortality Weekly Report 51:950-951.
Chasseignaux, E., Gerault, P., Toquin, M.T., Salvat, G., Colin, G. and Ermel, G. (2002) Ecology of Listeria monocytogenes in the environment of raw poultry meat and raw pork meat processing plants. FEMS Microbiololgy Letters 210(2):271-275.
Cox, N.A., Bailey, J.S. and Ryser, E.T. (1999) Incidence and behaviour of Listeria monocytogenes in poultry and egg products. In E.T. Ryser and E. H. Marth, (eds.) Listeria, Listeriosis and Food Safety. 565-600. Marcel Dekker, New York.
Doores, S. and Amelang, J. (1988) Incidence of Listeria monocytogenes in the raw milk supply in Pennsylvania. In J.B. Klis (ed.), IFT Ann. Meeting, New Orleans. 19-22 June. IFT Chicago. 157.
Dorozynski, A. (2000) Seven die in French listeria outbreak. BMJ 320(7235):601.
Dykes, G.A., Geornaras, I., Papathanasopoulos, M.A. and Holy, A.v. (1994) Plasmid profiles of Listeria species associated with poultry processing. Food Microbiology 11(6): 519-523.
Ericsson, H., Eklow, A., Danielsson-Tham, M.L., Loncarevic, S., Mentzing, L.O., Persson, I., Unnerstad, H. and Tham, W. (1997) An outbreak of listeriosis suspected to have been caused by rainbow trout. J Clin Microbiol 35(11):2904-2907.
European Commission (2003) Opinion of the Scientific Committee of Veterinary Measures Relating to Public Health on Staphylococcal Enterotoxins in Milk Products, particularly cheeses. http://europa.eu.int/comm/food/fs/sc/scv/out61_en.pdf.
Farber, J.M. and Peterkin, P. (1991a) Listeria monocytogenes, a Food-Borne Pathogen. Microbiol.Rev. 55(3):476-511.
Farber, J.M. and Peterkin, P. (1999) Incidence and behaviour of Listeria monocytogenes in meat products. In E. T. Ryser and E. H. Marth (eds), Listeria, Listeriosis and food safety. 505-564. Marcel Dekker, New York.
Farber, J.M., Sanders, G.W. and Johnston, M.A. (1989) A survey of various foods for the presence of Listeria species. J.Food Prot. 52:456-458.
FDA/Centre for Food Safety and Applied Nutrition and USDA Food Safety and Inspection Services Centers fro Disease control and Prevention. (2003) Quantitative Assessment of Relative Risk to Public Health from Foodborne Listeria monocytogenes Among Selected Categories of Ready-to-eat Foods. http://www.foodsafety.gov/~dms/lmr2-toc.html,
FDA/Centre for Food Safety and Applied Nutrition and USDA Food Safety and Inspection Services Centrers fro Disease control and Prevention. (2003) Quantitative Assessment of Relative Risk to Public Health from Foodborne Listeria monocytogenes Among Selected Categories of Ready-to-eat Foods. http://www.foodsafety.gov/~dms/lmr2-toc.html,
FDA/FSIS. (2003) Quantitative Assessment of Relative Risk to Public Health from Foodborne Listeria monocytogenes Among Selected Categories of Ready-to-eat Foods. http://www.foodsafety.gov/~dms/lmr2-toc.html,
Fenlon, D.R., Wilson, J. and Donachie, W. (1996) The incidence and level of Listeria monocytogenes contamination of food sources at primary production and initial processing. J.Appl.Bact. 81(6):641-650.
Fleming, D.W., Cochi, S.L., MacDonald, K.L., Brondum, J., Hayes, P.S., Plikaytis, B.D., Holmes, M.B., Audurier, A., Broome, C.V. and Reingold, A.L. (1985) Pasteurized milk as a vehicle of infection in an outbreak of listeriosis. N Engl.J Med 312(7):404-407.
146

Franco, C.M., Quinto, E.J., Fente, C., Rodriguez-Otero, J.L., Dominguez, L. and Cepeda, A. (21995) Determination of the principal sources of Listeria spp. contamination in poultry meat and a poultry processing plant. J.Food Prot. 12:1320-1325.
Genigeogis, C.A., Dutulescu, D. and Garayzabal, J.F. (1989) Prevalence of Listeria spp. in poultry meat at the supermarket and slaughterhouse level. J.Food Prot. 52:618-624.
Gitter, M. (1976) Listeria monocytogenes in "oven-ready" poultry. Vet Rec. 99(17):336.
Goulet, V., Jacquet, C., Vaillant, V., Rebiere, I., Mouret, E., Lorente, C., Maillot, E., Stainer, F. and Rocourt, J. (1995) Listeriosis from consumption of raw-milk cheese. Lancet 345(8964):1581-1582.
Goulet, V., Rocourt, J., Rebiere, I., Jacquet, C., Moyse, C., Dehaumont, P., Salvat, G. and Veit, P. (1998) Listeriosis outbreak associated with the consumption of rillettes in France in 1993. J Infect Dis 177(1):155-160.
Hall, R., Shaw, D., Lim, I., Murphy, F., Davos, D., Lanser, J., Delroy, B., Tribe, I., Holland, R. and Carman, J. (1996) A cluster of listeriosis cases in South Australia. Commun.Dis.Intell. 20(21):465.
Harvey, J. and Gilmour, A. (1993) Occurence and characteristics of Listeria in foods produced in Northern Ireland. Int.J.Food Microbiol. 19:193-205.
Hayes, P.S., Feeley, J.C., Graves, L.M., Ajello, G.W. and Fleming, D.W. (1986) Isolation of Listeria monocytogenes from raw milk. Appl.Environ.Microbiol. 51:438-440.
Heisick, J.E., Wagner, D.E., Nierman, M.L. and Peeler, J.T. (1989) Listeria spp. found on fresh market produce. Appl.Environ.Microbiol. 55:1925-1927.
Hitchins, A.D. (1996) Assessment of alimentary exposure to Listeria monocytogenes. Int.J.Food Microbiol. 30:71-85.
Ho, J.L., Shands, K.N., Friedland, G., Eckind, P. and Fraser, D.W. (1986) An outbreak of type 4b Listeria monocytogenes infection involving patients from eight Boston hospitals. Arch.Intern.Med 146(3):520-524.
Ibrahim, A. and MacRae, I.C. (1991) Incidence of Aeromonas and Listeria spp. in red meat and milk samples in Brisbane, Australia. Int.J.Food Microbiol. 12:263-269.
ICMSF. (1996) Microorganisms in Food 5: Microbiological Specifications of Food Pathgens. Blackie Academic and Professional, London.
ICMSF. (2000) Microorganisms in Food 6: Microbial Ecology of Food Commodities. Aspen, Maryland.
Jacquet, C., Catimel, B., Brosch, R., Buchrieser, C., Dehaumont, P., Goulet, V., Lepoutre, A., Veit, P. and Rocourt, J. (1995) Investigations related to the epidemic strain involved in the French listeriosis outbreak in 1992. Appl Environ.Microbiol 61(6):2242-2246.
Jay, J.M. (1996) Prevalence of Listeria spp. in meat and poultry products. Food Control 7(4/5):209-214.
Jensen, A., Frederiksen, W. and Gerner-Smidt, P. (1994) Risk factors for listeriosis in Denmark, 1989-1990. Scand.J Infect Dis 26(2):171-178.
Kerr, K., Dealler, S.F. and Lacey, R.W. (1988) Listeria in cook-chill food. Lancet 2(8601):37-38.
Kerr, K.G., Rotowa, N.A., Hawkey, P.M. and Lacey, R.W. (1990) Incidence of Listeria spp. in pre-cooked, chilled chicken products as determined by culture and enzyme-linked immunoassay (ELISA). J.Food Prot. 53:606-607.
Kwantes, W. and Isaac, M. (1974) Cited by M. Gitter.
Lawrence, L.M. and Gilmour, A. (1994) Incidence of Listeria spp. and Listeria monocytogenes in a poultry processing environment and in poultry products and their rapid confirmation by multiplex PCR. Appl.Environ.Microbiol. 60(12):4600-4604.
Le Souëf, P.N. and Walters, B.N. (1981) Neonatal listeriosis. A summer outbreak. Medical Journal of Australia 2:188-191.
Lennon, D., Lewis, B., Mantell, C., Becroft, D., Dove, B., Farmer, K., Tonkin, S., Yeates, N., Stamp, R. and Mickleson, K. (1984) Epidemic perinatal listeriosis. Pediatr.Infect Dis 3(1):30-34.
147

Linnan, M.J., Mascola, L., Lou, X.D., Goulet, V., May, S., Salminen, C., Hird, D.W., Yonekura, M.L., Hayes, P., Weaver, R. and . (1988) Epidemic listeriosis associated with Mexican-style cheese. N Engl.J Med 319(13):823-828.
Lovett, J., Francis, D.W. and Hunt, J.M. (1987) Listeria monocytogenes in raw milk; detection, incidence and pathogenicity. J.Food Prot. 50: 188-192.
Lyytikainen, O., Autio, T., Maijala, R., Ruutu, P., Honkanen-Buzalski, T., Miettinen, M., Hatakka, M., Mikkola, J., Anttila, V.J., Johansson, T., Rantala, L., Aalto, T., Korkeala, H. and Siitonen, A. (2000) An outbreak of Listeria monocytogenes serotype 3a infections from butter in Finland. J Infect Dis 181(5):1838-1841.
Marth, E.H. (1988) Disease Characteristics of Listeria monocytogenes. Food Technol. 42(4):165-168.
McClain, D. and Lee, W.H. (1988) Development of USDA-FSIS method for isolation of Listeria monocytogenes from raw meat and poultry. J Assoc.Off Anal.Chem 71(3):660-664.
McLauchlin, J., Hall, S.M., Velani, S.K. and Gilbert, R.J. (1991) Human listeriosis and pate: a possible association. BMJ 303(6805):773-775.
Mead, P.S. (2004) Multistate outbreak of listeriosis traced to processed meats, August 1998-March 1999. (Record;Foodborne and diarrheal Disease Braanch, DBMD, NCID, CDC) May 27. 23.
Mead, P.S., Slutsker, L., Dietz, V., McCraig, L.F., Bresee, J.S., Shapiro, C., Griffin, P.M. and Tauxe, R.V. (1999) Food-related illness and death in the United States. Emerg.Infect.Disea. 5:607-625.
Miettinen, M.K., Palmu, L., Bjorkroth, K.J. and Korkeala, H. (2001) Prevalence of Listeria monocytogenes in broilers at the abattoir, processing plant, and retail level. 7. J.Food Prot. 64:994-999.
Millard, G. and Rockliff, S. (2000) Microbiological status of raw chilled chicken. ACT Health Protection Service Food Survey Report 1999-00.
Misrachi, A., Watson, A.J. and Coleman, D. (1991) Listeria in smoked mussels in Tasmania. Communicable Diseases Intelligence 15:427.
Mitchell, M. (2001) Consumption of salad that support the growth of Listeria monocytogenes (unpublished data from Certified laboratories, Plainview, NY).
National Advisory Committee on Microbiological Criteria for Foods (NACMCF). (1991) Listeria monocytogenes in meat, poultry and fishery products. Int.J.Food Microbiol. 14:226-231.
Ojeniyi, B., Wegener, H.C. and Bisgaard, M. (2004) Listeria monocytogenes in Danish poultry production; studies on prevelance and epidemiology. In Proceedings of the XII International Symposium on Problems of Listerioisis. 285. Promaco conventions Pty Ltd., Canning Bridge, Western Australia.
Petersen, L. and Madsen, M. (2000) Listeria spp. in broiler flocks: recovery rates and species distribution investigated by conventional culture and the EiaFoss method. Int.J.Food Microbiol. 58:113-116.
Pini, P.N. and Gilbert, R.J. (1988) The occurrence in the U.K. of Listeria species in raw chickens and soft cheeses. Int J Food Microbiol 6(4):317-326.
Rocourt, J. and Bille, J. (1997) Foodborne listeriosis, World Health Statistics Quarterly. World Health Statistics Quarterly 50:67-73.
Rodrigues, D., Landgraf, M. and Destro, M.T. (2002) Evaluation of 2 commercial methods for the detection of Listeria sp. and Listeria monocytogenes in a chicken nugget processing plant. Canadian Journal of Microbiology 48(3):275-278.
Rorvik, L.M., Aase, B., Alvestad, B. and Caugant, D.A. (2003) Molecular epidemiological survey of Listeria monocytogenes in broilers and poultry products. J.Appl.Bact. 94(4):633-640.
Ryser, E.T. (1999) Foodborne listeriosis. In: Ryser, E.T. and Marth, E.H. eds. Listeria, Listeriosis, and Food Safety. Marcell Dekker, Inc, New York, pp299-358.
Ryser, E.T. and Marth, E.H. (1999) Listeria, Listeriosis, and Food Safety. Marcel Dekker, Inc., New York.
Schlech, W.F., III, Lavigne, P.M., Bortolussi, R.A., Allen, A.C., Haldane, E.V., Wort, A.J., Hightower, A.W., Johnson, S.E., King, S.H., Nicholls, E.S. and Broome, C.V. (1983) Epidemic listeriosis--evidence for transmission by food. N Engl.J Med 308(4):203-206.
148

Schuchat, A., Deaver, K.A., Wenger, J.D., Plikaytis, B.D., Mascola, L., Pinner, R.W., Reingold, A.L. and Broome, C.V. (1992) Role of foods in sporadic listeriosis. I. Case-control study of dietary risk factors. Journal of the American Medical Association 267:2041-2045.
Schwartz, B., Hexter, D., Broome, C.V., Hightower, A.W., Hirschhorn, R.B., Porter, J.D., Hayes, P.S., Bibb, W.F., Lorber, B. and Faris, D.G. (1989) Investigation of an outbreak of listeriosis: new hypotheses for the etiology of epidemic Listeria monocytogenes infections. J Infect Dis 159(4):680-685.
Simpson.D.M. (1996) Microbiolgoy and epidemiology in foodborne disease outbreaks: The whys and when nots. J.Food Prot. 59:93-95.
Skovgaard, N. and Morgen, C.A. (1988) Detection of Listeria spp. in faeces from animals, in feeds, and in raw foods of animal origin. Int J Food Microbiol 6(3):229-242.
Sutherland, P.S., Miles, D.W. and Laboyrie, D.A. (2003) Listeria monocytogenes. In Foodborne Microorganisms of Public Health Significance, 6th Edition, AIFST (NSW) Branch. 381-444. Southwood Press Pty Ltd, Marrickville.
Tappero, J.W., Schuchat, A., Deaver, K.A., Mascola, L. and Wenger, J.D. (1995) Reduction in the incidence of human listeriosis in the United States. Effectiveness of prevention efforts? The Listeriosis Study Group. JAMA 273(14):1118-1122.
Terplan, G. (1988) Listeria in the dairy industry. In Proceedings Behr's seminar on problems of foodborne Listeriosis. European symposium, 7 Sept.Wiesbaden, W.Germany :
The OzFoodNet Working Group. (2001) Enhancing foodborne disease surveillance across Australia in 2001: the OzFoodNet Working Group. Communicable Diseases Intelligence 26(3):http://www.cda.gov.au/pubs/cdi/2002/cdi2603/pdf/cdi2603d.pdf.
The OzFoodNet Working Group. (2002) Foodborne disease in Australia: incidence nfoitifcations and outbreaks. Anuual report of the OzFoodNet network, 2002. Communicable Diseases Intelligence 27(2):
USFDA Centre for Food Safety and Applied Nutrition. (2004) Listeria monocytogenes. In Bad Bug Book - Foodborne Pathogenic Microorganisms and Natrual Toxins Handbook. (accessed March 2004)http:/www.cfsan.fda.gov/~mow/chap6.html,
Uyttendaele, M., de Troy, P. and Debevere, J. (1999) Incidence of Salmonella, Campylobacter jejuni, Campylobacter coli, and Listeria monocytogenes in poultry carcasses and different types of poultry products for sale on the Belgian retail market.. J.Food Prot. 62(7):735-740.
Varabioff, Y. (1990) Incidence and recovery of Listeria from chicken with a pre-enrichment technique. J.Food Prot. 53:555-557.
Waldroup, A.L. (1996) Contamination of raw poultry with pathogens. World's Poultry Science Journal 52(1):7-25,84,90,93.
Wang, G.H., Yan, K.T., Feng, S.M., Chen, S.M., Lui, A.P. and Kokubo, Y. (1992) Isolation and identification of Listeria monocytogenes from retail meats in Beijing. J.Food Prot. 55:56-58.
Western Australian Department of Health (2004) Microbiological quality of cookd chicken meat 2003-2004. WA Department of Health, Perth, Australia.
FAO/WHO (2004) Risk assessment of Listeria monocytogenes in ready-to-eat foods: Technical Report. Microbiological risk assessment series; no 5.
Wong, H.C., Chao, W.L. and Lee, S.J. (1990) Incidence and characterization of Listeria monocytogenes in foods available in Taiwan. Appl Environ.Microbiol 56:3101-3104.
149

6 Review of Chemical Hazards in Poultry Meat
The development of a primary production and processing standard for poultry meat uses an approach that investigates sources of potential chemical risks which may be introduced at different points through the primary production and processing chain. The poultry meat products supply chain is divided into four distinct stages: primary production, processing, retail and the consumer. At each of these stages poultry meat products may be intentionally or unintentionally exposed to chemicals.
The origins of potential chemical risks which may be introduced into poultry meat products vary. Exposure to chemicals may occur at the primary production stage through the ingestion of feed and water, but also through veterinary treatment, air, soil, or from housing materials. Further along the processing chain poultry meat products may under go chemical inputs such as food additives, processing aids and chemicals which migrate from packaging materials. And finally when prepared by the domestic consumer, poultry meat products may be exposed to additional household chemicals and other contaminants.
For the purposes of the Australian New Zealand Food Standards Code, chemical substances present in poultry meat products are either ‘intentionally added’ to food or ‘unintentionally present’ in food. FSANZ uses an evidence-based scientific process to identify and characterise hazards and to evaluate the level of chemical exposure. This information is used to characterise the risk associated with potential chemical hazards (Appendix 5 – Risk Assessment Framework).
Substances in food that arise from ‘intentionally used chemicals, such as, agricultural and veterinary chemicals, food additives and processing aids are introduced for a purpose. The use of these substances is generally supported by extensive safety data suitable to identify and characterise any risks and in most cases to establish a safe level of human exposure. These substances have undergone a pre-market safety evaluation and approval process and generally have maximum levels of use identified in the Code.
Substances that are ‘unintentionally present’ in food serve no technological function and are generally considered to be contaminants. The term ‘contaminant’ for the purposes of this report refers to both metal and non-metal substances. For contaminants, FSANZ assesses the safety on the basis of the best available data and, where possible, establishes a maximum level in food where there is a potential risk to public health and safety from excessive exposure.
6.1 A paddock-to-plate approach to chemical risks
A paddock-to-plate flowchart identifying potential chemical inputs into poultry meat products is presented in Figure 6.1. The flowchart is divided into two stages; primary production and further processing stages. The further processing stage is an amalgam of the processing, retail and consumer stages of the poultry meat product supply chain.
The paddock-to-plate perspective helps to define the identity of chemical inputs at specific stages through the poultry meat supply chain. Inputs represented by a black arrow are chemicals that are ‘intentionally added’ to food and have undergone a pre-market assessment and approval prior to use in food products. Inputs represented by the white arrow are contaminants (‘unintentionally present’) in food. Contaminants are ubiquitous and are regulated in such a way as to ensure levels of these chemicals are as low as reasonably possible. The grey arrow represents the chemicals that may migrate into food from contact with packaging. In Australia and New Zealand, chemicals which may migrate from packaging do not require specific pre-market approval. Chemicals that migrate into food from packaging are generally regulated as contaminants.
150

Figure 6.1 Chemical inputs into poultry meat products
Regulations that control the use of chemicals in food are outlined in the general standards applicable to all food in Chapter 1 of the Australia New Zealand Food Standards Code. There are six Standards in Chapter 1 of the Code that regulate chemical inputs that are relevant to poultry meat products. The Standards are the following;
Primary production
Standard 1.4.2 – Maximum Residue Limits (Agricultural and Veterinary Chemicals)
Standard 1.4.1 – Contaminants and Natural Toxicants
Further processing
Standard 1.3.1 – Food Additives
Standard 1.3.3 – Processing Aids
Standard 1.4.3 – Articles and Materials in Contact with Food
Related Standards
Standard 1.3.4 – Identity and Purity
151

6.2 Agricultural and veterinary chemicals
Maximum residue limits (MRLs) for agricultural and veterinary chemicals are established in the Code. FSANZ evaluates the potential dietary exposure associated with the proposed MRLs and ensures that this exposure does not represent an unacceptable risk to public health and safety. MRLs are listed in Standard 1.4.2 – Maximum Residue Limits of the Code.
The inclusion of the MRLs in the Code allows produce treated according to Good Agricultural Practice (GAP) to be legally sold, provided that the residues in the treated produce do not exceed the MRL. Changes to Australian MRLs reflect the changing patterns of agricultural and veterinary chemicals available to farmers. These changes include both the development of new products and crop uses, and the withdrawal of older products following review.
Standard 1.4.2 lists the maximum permissible limits for agricultural and veterinary chemical residues present in food. Schedule 1 lists all of the agricultural and veterinary chemical limits in specific foods and Schedule 2 lists all extraneous agricultural chemical limits in specific foods. If a maximum residue limit for an agricultural or veterinary chemical in a food is not listed in the schedules there must be no detectable residues of that agricultural or veterinary chemical in that food. Also, if an agricultural or veterinary chemical is not listed in the schedules, there must be no detectable residue of that chemical or its metabolites in any food.
In Australia, the Australian Pesticide and Veterinary Medicines Authority (APVMA) is responsible for registering agricultural and veterinary chemical products, granting permits for use of chemical products and regulating the sale of agricultural and veterinary chemical products. Following the sale of these products, the use of the chemicals is then regulated by State and territory ‘control of use’ legislation.
Before registering such a product, APVMA must be satisfied that the use of the product will not result in residues in food that would present an unacceptable public health and safety risk. The assessment of agricultural and veterinary chemicals is discussed in Appendix 6.
6.2.1 Hazard Assessment
MRLs for poultry products
When an agricultural or veterinary chemical is registered for use or a permit for use granted, the APVMA includes MRLs in the APVMA MRL Standard. These MRLs are then adopted into control of use legislation in some jurisdictions and assist States and Territories in regulating the use of agricultural and veterinary chemicals.
As of August 2004, Standard 1.4.2 had MRLs for 169 chemicals in Schedule 1 – Maximum Residue Limits and 6 chemicals listed in Schedule 2 – Extraneous Residue Limits in association with poultry products (Appendix 8). The list includes veterinary medicines used for prophylaxis and growth promotion, and agricultural chemicals used as crop and grain protection agents.
Clearly not all of these products are used widely in the poultry industry. Products gain and lose favour and in respect to pesticides and veterinary drugs, registrants seek to maintain registration to fill niche markets or for other commercial reasons though use may at times be limited. In some cases, registrants may choose to maintain a product registration but not offer the product for sale.
Hormones in poultry meat products
No hormones are registered for use in poultry and there are no hormone MRLs included in the MRL Standard of the Code. This is consistent with poultry industry practices which has seen the use of hormones as growth promotants banned since the 1960’s.
152

To maintain consumer confidence in poultry products, the Commonwealth Government’s National Residue Survey program tests for hormonal growth promotants. No residues have ever been detected.
Antimicrobial agents in poultry meat products
Antimicrobial agents are a subgroup of the agricultural and veterinary chemicals registered for use in the Australian poultry industry (Appendix 9). Some of these antimicrobial agents are members of the same families as agents used in human medicine. The shaded rows in the table to Appendix 9 indicate the groups of antimicrobial agents that belong to families used in human medicine. The current use of antimicrobial agents in the poultry industry and the potential risks associated with their use is discussed in Appendix 7.
6.2.2 Exposure assessment
Current analytical technology can detect chemicals at very low concentrations. The detection of a residue is not a matter for concern except when the use of the relevant chemical is unauthorised or its concentration is greater than the MRL set on the basis of GAP. In reality, human health is rarely an issue since even at the MRL the level of dietary intake is well below the ADI.
National Residue Survey
Australia has an active national residue-monitoring program. The National Residue Survey (NRS) was established under the National Residue Survey Administration Act 1992 for the purposes of monitoring and reporting levels of contaminants in food, inputs to production and or the environment. Residues are classified as being ‘present’ if their concentration is greater than the limit of reporting (LOR) established for NRS purposes. The NRS typically sets the LOR at 10-20% of the Australian Standard maximum residue limit (MRL), extraneous residue limit (ERL) or maximum level.
The residue monitoring activities for meat are designed so that the probability of an abattoir being selected is proportional to the throughput of the abattoir. Sample requests are sent to abattoirs each month and specify the kind of product required and the production period during which the samples are to be taken. Animals are then selected at random along the slaughter chain.
The results of the National Residue Survey 2002/2003 (NRS, 2003) poultry meat monitoring activities are tabulated in Table 6.1. During the period 2002-2003, 165 poultry samples were analysed. There were 39 samples analysed for hormones and environmental contaminants, 126 samples analysed for antimicrobials and 5 samples analysed for anticoccidials. One sample for the anticoccidial lasalocid was detected above the Australian Standard, though traceback of the samples were unable to indicate the reason for contravention.
Australian Total Diet Survey
FSANZ monitors the food supply to ensure that existing food regulatory measures provide adequate protection to consumer health and safety. The Australian Total Diet Survey (ATDS) is part of that monitoring.
The ATDS, formerly known as the Australian Market Basket Survey, is Australia’s most comprehensive assessment of consumers’ dietary exposure (intake) to pesticide residues, contaminants and other substances. The survey is conducted approximately every two years.
The survey estimates the level of dietary exposure of the Australian population through the testing of food representative of the total diet. In order to achieve more accurate dietary exposure, the foods examined in the ATDS are prepared to a ‘table ready’ state before they are analysed. As a consequence, both raw and cooked foods are examined.
153

FSANZ coordinates the survey while the States and the Northern Territory purchase and prepare the food samples. Poultry meat products are considered as regional foods and therefore the analysis was conducted on three composite samples, consisting of three purchases each, making a total of 21 composite samples for the analysis. The Australian Government Analytical Laboratories (AGAL) perform all tests.
The range of pesticide residues tested in the 19th and 20th ATDS Survey were:
organochlorine insecticides (arising from past use)
organophosphorous insecticides
synthetic pyrethroids
fungicides
other individual pesticides.
No pesticide residues were detected in chicken breast samples in the 20 th ATDS (ATDS, 2003), while the only pesticide detected in chicken drumsticks in the 19th ATDS was pirimicarb at levels 50 to 100 fold below the MRL (ATDS, 2001).
Table 6.1 National Residue Survey Annual Report 2002-2003 poultry meat residue monitoring activities (NRS, 2003)
Matrix Method of analysis
LOR mg/kg
Aust Std mg/kg
Number of analyses
Number of residues
Number > Aust Std
HORMONES
StilbenesDienoestrol Liver GC-MS 0.0002 Not set 39 0 0Diethylstilboestrol Liver GC-MS 0.0002 Not set 39 0 0Hexaestrol Liver GC-MS 0.0002 Not set 39 0 0
ZeranolZeranol Liver GC-MS 0.0020 Not set 39 0 0-Zearalanol (zeranol) Liver GC-MS 0.0020 Not set 39 0 0
ANTIMICROBIALS
AntibioticsAmoxicillin Liver MIT/HPLC 0.01 0.01 126 0 0Ampicillin Liver MIT/HPLC 0.01 Not set 126 0 0Benzylpenicillin (penicillin G)
Liver MIT/HPLC 0.01 0.06 126 0 0
Chlortetracycline Liver MIT/HPLC 0.05 0.60 126 0 0Cloxacillin Liver MIT/HPLC 0.10 Not set 126 0 0Dihydrostreptomycin Liver MIT/HPLC 0.10 Not set 126 0 0Erythromycin Liver MIT/HPLC 0.10 0.30 126 0 0Neomycin Liver MIT/HPLC 0.10 0.50 126 0 0Oxytetracycline Liver MIT/HPLC 0.05 0.60 126 0 0Streptomycin Liver MIT/HPLC 0.10 Not set 126 0 0Tetracycline Liver MIT/HPLC 0.05 Not set 126 0 0Tilmicosin Liver MIT/HPLC 0.20 Not set 126 0 0Tylosin Liver MIT/HPLC 0.10 0.20 126 0 0
Sulphonamides
154
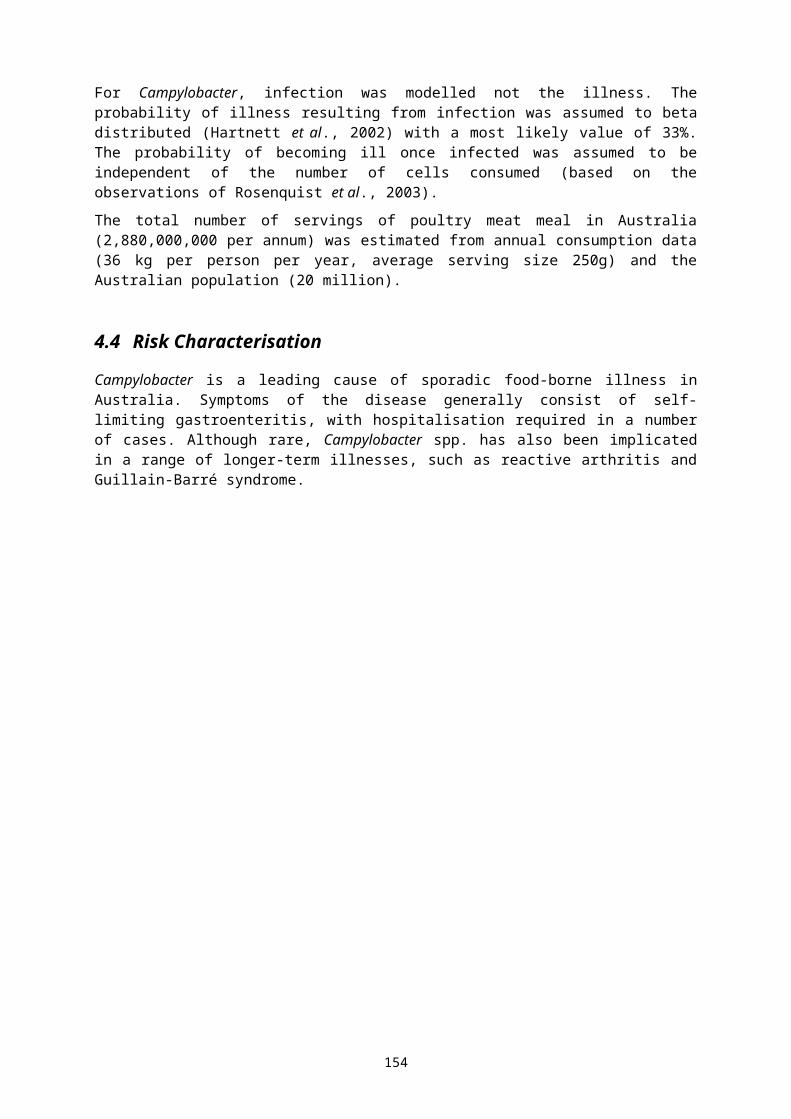
Sulphadiazine Liver MIT/GC/HPLC 0.05 0.10 126 0 0Sulphadimidine (sulphamethazine)
Liver MIT/GC/HPLC 0.05 0.10 126 0 0
Sulphadoxine Liver MIT/GC/HPLC 0.05 Not set 126 0 0Sulphafurazole Liver MIT/GC/HPLC 0.05 Not set 126 0 0Sulphaquinoxaline Liver MIT/GC/HPLC 0.05 0.10 126 0 0Sulphatroxazole Liver MIT/GC/HPLC 0.05 Not set 126 0 0
AnticoccidialsAmprolium Liver LC-MS 0.03 1.00 5 0 0Lasalocid Liver LC-MS 0.03 0.05 5 1 1*Monensin Liver LC-MS 0.03 0.50 5 0 0Narasin Liver LC-MS 0.03 0.10 5 0 0Nicarbazin Liver LC-MS 0.03 20.00 5 1 0Salinomycin Liver LC-MS 0.03 0.50 5 0 0
ENVIRONMENTAL CONTAMINANTS
MycotoxinsZearalenone Liver GC-MS 0.0020 Not set 39 0 n/a
Note:n/a Australian standard does not apply. No standard set.Not set Australian Standard is not set for edible matrix* Product used according to label directions. Reasons for contravention could not be established.
6.2.3 Risk characterisation
Contemporary survey results from the NRS and ATDS indicate that there is a high level of industry compliance associated with agricultural and veterinary chemical MRLs in poultry meat products. These results indicate that dietary exposure to agricultural and veterinary chemicals through poultry meat products presents a negligible risk to the consumer.
6.3 Contaminants
Food standards, when used to establish maximum levels (MLs) for contaminants in various foods, operate within a broader risk management structure to reduce public health risks. Other regulations that encourage practices that in turn reduce contamination of food operate at all levels of government in Australia. These include waste management/disposal programs, water quality programs, industrial zoning regulation and environmental safeguards.
In many cases, the potential for contamination of food is self-limiting because of these other regulations and specific regulation may be unnecessary. When a food standard is considered necessary for a particular contaminant as a risk management option, this is achieved by establishing an ML in particular food commodities. MLs are the legal limits enforced through the State and Territory Food Acts and are, in general, used only when other mechanisms of control are considered insufficient or inadequate to safeguard the health of consumers.
FSANZ regulates the presence of contaminants in food through Standard 1.4.2 – Contaminants and Natural Toxicants. This Standard sets out the maximum levels (MLs) of specified metal and non-metal contaminants and natural toxicants in nominated foods. As a general principle, regardless of whether or not a ML exists, the level of contaminants and natural toxicants in all foods should be kept as low as reasonably achievable (the ALARA principle).
As part of the review of chemical hazards in poultry meat products fifteen contaminants with the potential to contaminate poultry were reviewed (Table 6.2). The reasons for reviewing these potential chemical contaminants are as follows:
155

Current MLs in the Code - lead and polychlorinated biphenyls;
Widespread use of arsenic based anticoccidials in the poultry industry without residue permissions in Standard 1.4.2 – Maximum Residue Limits – arsenic;
Widespread environmental contamination – cadmium;
Widespread use of mechanically manufactured meat processes in the poultry industry – fluoride;
Use of fishmeal starter rations in broilers and the possible contamination of piscivorous waterfowl such as the mutton bird (Puffinus tenuirostris) – mercury;
Use of fishmeal starter rations in broilers – selenium;
Environmental contamination – dioxins;
Effect of food processing on the presence of polycyclic aromatic hydrocarbons and heterocyclic amines; and,
Potential mycotoxin contamination of poultry feeds.
Table 6.2 Potential chemical contaminants in poultry meat products
Contaminant Source Potential adverse effects
Arsenic Environmental contamination. Use of arsenic-based anticoccidial agents.
Human carcinogen - inducing primary skin cancers
Cadmium Environmental contamination Nephrotoxic agent
Fluoride Contamination of mechanically separated poultry with finely powdered bone.
Dental fluorosis
Lead Environmental contaminant. Contamination of wildcrafted birds such as the Magpie Goose.
Human neurodevelopmental toxin with children being particularly sensitive
Mercury Contamination of poultry fishmeal starter rations. Contamination of wildcrafted birds such as the Mutton bird.
Human neurotoxin - developing foetus particularly sensitive
Selenium Contamination of poultry fishmeal starter rations.
Adverse effects on nervous system.
Dioxins Environmental contaminant. Contaminated feed (Belgium)
Potential human carcinogen. Very low tolerable monthly intake.
Polychlorinated biphenyls Environmental contaminant. Potential human carcinogen. Very low tolerable monthly intake.
Polycyclic aromatic hydrocarbons (PAH)
Food processing – cooking and smoking. Some PAHs are likely to be genotoxic carcinogens – with no known level of safe exposure.
Heterocyclic amines (HCA) Food processing – cooking. Some HCA’s are likely to be genotoxic carcinogens – with no known level of safe exposure.
Aflatoxin B1, B2, G1, G2 Aspergillus flavus, and A. parasiticus contamination of corn, peanuts and other feed ingredients
Aflatoxin B1 – potential human carcinogen
TrichothecenesT-2 and HT-2 toxinDeoxynivalenol (DON)Vomitoxin
Fusarium graminearum, F. crookwellense and F. culmorum contamination of wheat, barley and corn
Acute food poisoning
Zearalenone Fusarium graminearum, F. crookwellense Possible carcinogen – effects the
156

Contaminant Source Potential adverse effects
and F. culmorum contamination of wheat and corn
reproductive system of laboratory animals and pigs
Ochratoxin A Aspergillus ochraceus and Penicillium verrucosum contamination of barley, wheat and many other commodities
Nephrotoxin, possible human carcinogen
Fumonisin B1 Fusarium moniliforme plus several less common species contamination of corn
Nephrotoxin, possible human carcinogen
6.3.1 Arsenic
The safety of arsenic was last assessed by ANZFA in Proposal 157 – Review of the maximum permitted concentrations of metal contaminants in food (ANZFA, 1999d).
Arsenic (As) occurs naturally in both the organic and inorganic forms. Inorganic arsenic is the toxic form of arsenic for humans. There is limited information on the organic forms of arsenic in terms of their toxicological properties, but it appears that they are much less toxic than the inorganic forms. Limited studies indicate that people who consume large quantities of organic arsenic in fish do not show any ill effects. Drinking water contains largely the inorganic form of arsenic, whereas food contains more than 90% of its arsenic in the organic form.
Hazard Identification and Characterisation
The most relevant toxicological data, other than industrial exposure, are derived from studies of human populations exposed to arsenic in drinking water. Chronic toxicity and cancer in human populations affords the most sensitive indicators for establishing dietary intake criteria for arsenic. Dermatological effects of the chronic ingestion of low doses of inorganic arsenic initially show as cutaneous vasodilation, than later as hyperpigmentation and hyperkeratosis with subsequent atrophy and degeneration of the skin leading over a period of time to the development of skin cancers. Chronic exposure to inorganic arsenic is associated with a multiplicity of cancers.
ANZFA established a lowest observed effect level (LOEL) or inorganic arsenic, based on population studies in Taiwan, where drinking water exposures for periods of 12 years to whole-of-life were associated with cancers (skin, liver, bladder, lung). Skin cancers, but no other cancers were detected at the lowest LOEL, indicating that skin cancer may be the most sensitive indicator of carcinogenicity of inorganic arsenic in human populations. There is growing evidence for a threshold in a dose-response relationship between inorganic arsenic and various cancers. The lowest LOEL for human skin cancer was approximately 0.0029 mg/kg bw/day, based on a review of epidemiological data. On the basis of the available data, this level is considered to be close to a 'threshold' value, below which increased incidence of skin cancer were not associated with arsenic exposure.
This level, rounded-off to 0.003 mg/kg bw/day was taken to be the provisional tolerable daily intake (PTDI) for inorganic arsenic. While based on exposure to drinking water rather than food, it is considered appropriate for use in assessing the risk from inorganic arsenic in food. It should be noted however, that this PTDI for arsenic does not incorporate any safety factors (ANZFA, 1999d).
The Joint FAO/WHO Expert Committee on Food Additives (JECFA) has assigned a provisional tolerable weekly intake (PTWI) of 0.015 mg/kg bw for inorganic arsenic (WHO, 1989a). This was with the clear understanding that the margin between the PTWI and intakes reported to have toxic effects in epidemiological studies was narrow. The provisional status of the maximum weekly intake was continued due to the desire to lower the arsenic intake of those individuals exposed to high levels of inorganic arsenic in drinking water.
The IARC has classified inorganic arsenic into group 1 (carcinogenic for humans), for the ability to induce primary skin cancers (IARC, 1987).
157

Arsenic will be re-evaluated at the 65th JECFA meeting in 2005.
Exposure Assessment
A dietary exposure assessment was conducted as part of the assessment of arsenic for Proposal P157 – Review of the maximum permitted concentrations of metal contaminants in food. Inorganic arsenic as derived in the 1995 Australian National Nutrition Survey (ANZFA, 1995) was an estimate based on a proportion of total arsenic. For the general community the main foods contributing to inorganic arsenic dietary exposure, excluding water, were prawns (51.9%), marine fish (14.3%), milk (9.8%) and rice (5.5%), poultry products contributed 2.36% (chicken meat) and 0.21% (poultry offal) respectively. Levels of inorganic arsenic were 0.02 mg/kg in chicken meat and 0.42 mg/kg in poultry offal.
The 20th Australian Total Diet Survey estimated exposure to total arsenic between 9-48% of the PTDI set for inorganic arsenic. The 20th ATDS identified total arsenic in poultry breast meat at 0.01-0.03 mg/kg and chicken liver pate at 0.03-0.24 mg/kg (ATDS, 2003). These results demonstrate consistent low levels of total arsenic and as a consequence inorganic arsenic in poultry meat.
Risk Characterisation
Arsenic is carcinogenic in humans and induces primary skin cancers (IARC, 1987). ANZFA established a PTDI of 0.003 mg/kg bw/day for inorganic arsenic based on a lowest observable effect level (LOEL) for skin cancer induction in human populations (WHO, 1983). The LOEL is also defined as a ‘threshold’ value, below which skin cancer does not occur. Estimated dietary exposure to inorganic arsenic, based on the 1995 Australian National Nutrition Survey (ANZFA, 1995) resulted in a mean dietary exposure of all respondents being 0.97-1.1% PTDI excluding water and 4.5-4.7% PTDI when water was included. The 20th Australian Total Diet Survey estimated exposure to total arsenic between 9-48% of the PTDI set for inorganic arsenic (ATDS, 2003). These data are a significant over estimate of the exposure inorganic arsenic as inorganic arsenic is only a proportion of total arsenic. Arsenic dietary exposure from the consumption of poultry meat products presents a negligible risk to the consumer.
6.3.2 Cadmium
The safety of cadmium was last assessed by ANZFA in Proposal 144 – Review of the maximum permitted concentration of cadmium in food (ANZFA, 1997).
Cadmium is a widespread contaminant in many agricultural products in all countries worldwide. The use of phosphate fertilisers and sewage sludge on agricultural land may be a significant source of cadmium and, in some circumstances this could lead to elevated levels in crops. The major route of exposure to cadmium for the non-smoking general population is via food, tobacco is a significant source of cadmium for smokers.
Hazard Identification and Characterisation
Cadmium is a metal with an extremely long biological half-life in man. Even low exposure levels may, in time, cause considerable accumulation, especially in the kidneys. The kidney has been identified as the critical organ in relation to chronic exposure to relatively low levels of cadmium and in particular the renal cortex. An early feature of the renal effects in man is the impairment of the reabsorption functions of the tubules with an increase in urinary excretion of low-molecular weight proteins (LMW proteinuria). Renal injury may progress and, in severe cases, involve glomerular damage with proteinuria, aminoaciduria, glucosuria and phosphaturia. It has generally been found that tubular proteinuria, once manifest, persists even when exposure ceases.
158

Intakes in the range of 140-255 g/day have been associated with increased LMW proteinuria in the elderly. LMW proteinuria is not accompanied by any specific histological changes and the pathological significance of this finding is unclear. However, it can be used to as an indicator of the threshold of a possible toxic effect and it is appropriate to set the provisional tolerable weekly intake on the basis of the dose-response data for this endpoint (WHO, 1989b).
JECFA established a provisional tolerable weekly intake of cadmium to ensure that cadmium concentration does not exceed 50 g/g in the renal cortex assuming an absorption rate of 5% and a daily excretion rate of 0.005% of body burden, over a period of 50 years. A provisional tolerable weekly intake was set at 7 g/kg body weight/week for cadmium (WHO, 1989b).
In 2003, JECFA maintained the current PTWI based on an evaluation of new data submitted on cadmium in humans. The Committee reaffirmed its previous conclusions that an effect on the kidney (renal tubular dysfunction) is the critical health outcome with regard to cadmium toxicity (WHO, 2003a).
The IARC has classified cadmium and cadmium compounds into group 1 (carcinogenic for humans) (IARC, 1993a). Cadmium is carcinogenic in experimental animals when given by injection or inhalation, and exposure of workers by inhalation has been shown to result in pulmonary cancer. There was no evidence that cadmium is carcinogenic to humans exposed by the oral route (WHO, 2001b).
Exposure Assessment
A dietary exposure assessment was conducted as part of the assessment of cadmium for Proposal P144 – Review of the maximum permitted concentrations of cadmium in food. A revised dietary exposure assessment for cadmium was conducted on the basis of additional survey information (ANZFA, 2000). Cadmium concentration data used in this assessment were sourced both within ANZFA as well as submissions from external sources. The survey data indicated cadmium levels of 0.003 mg/kg in chicken meat, 0.003 mg/kg in turkey meat and 0.008 mg/kg in edible offal of chicken.
The primary foods that contribute to dietary cadmium exposure in the Australian population were cereals (9.3%), meat and offal (9.5%), cocoa (5%), fruit (14.7%), potatoes (28%), other roots and tubers (6%) and other vegetables (13.6%). Poultry meat was not a major contributor to cadmium dietary intake.
The 20th Australian Total Diet Survey did not detect cadmium in poultry breast meat, the limit of reporting for this analysis was 0.005 mg/kg (ATDS, 2003). There is limited information in the literature with respect to cadmium contamination of free-range, organic or wild-caught poultry.
Risk Characterisation
Cadmium is a bio-accumulating nephrotoxic agent with the ability to induce impairment of the reabsorption functions of the tubules resulting in an increased urinary excretion of low-molecular weight proteins (WHO, 1989b). Estimated dietary exposure to cadmium, based on the 1995 Australian National Nutrition Survey (ANZFA, 1995) (whole population aged 2 years and over) resulted in a mean dietary exposure of 13-16% PTDI and dietary exposure at the 95 th percentile (consumers only) of 34-41% PTDI. Cadmium dietary exposure from the consumption of poultry meat products presents a negligible risk to the consumer.
6.3.3 Fluoride
The safety of fluoride was last assessed by ANZFA in Proposal 157 – Review of the maximum permitted concentrations of metal contaminants in food (ANZFA, 1999b).
159

Fluorine (F) is a non-metallic, gaseous element, belonging to the halogen group. Except for industrial emissions, the largest environmental source of fluorides is fluoridated water supplies. In some part of the world, deposits of rocks containing a high level of fluoride cause a large increase in the fluoride content of water or food (WHO, 2000a). Although most foods are very low in fluoride content, foods made with mechanically separated meats have the potential to be a significant contributor to total fluoride content due to the potential transfer of bone material in the separated meat.
There is only limited information on the bioavailability of fluoride from fluoride-containing diets. In a balance study in infants, it found that the bioavailability of fluoride in the infants diet was about 90%.
The ingestion of fluoride with food retards its absorption and reduces its bioavailability. When fluoride was ingested as sodium fluoride tablets on a fasting stomach, the bioavailability of fluoride was almost 100%. When the same dose was taken together with a glass of milk, the bioavailability decreased to 70%; when it was taken together with a calcium-rich breakfast, the bioavailability was further reduced to 60%. The decrease in absorption associated with the ingestion of milk or food is probably due to binding of fluoride with certain food constituents, including calcium and other divalent and trivalent cations.
Fluoride is rapidly distributed by the systematic circulation to the intracellular and extracellular water of tissues; however, the ion normally accumulates only in calcified tissues, such as bone and teeth. The rate of clearance of fluoride from plasma by bone is higher than that of calcium. The degree to which fluoride is stored in the skeletal tissue is related to the turnover rate of the skeletal components and the level of previous exposure. Levels of fluoride in calcified tissues are generally highest in bone, dentine and enamel. The concentration of fluoride in bone varies with age, sex, and the type and specific part of bone and is believed to reflect an individuals long-term exposure to fluoride (IPSC, 2002).
Hazard Identification and Characterisation
Chronic exposure to excess fluoride in animals and humans produces dental (enamel) and skeletal fluorosis. Dental fluorosis can occur during the pre-eruptive development of teeth, is largely regarded as a cosmetic effect rather than a severe functional disability, and ranges from slight aberration in normal enamel (a few white specks to occasional white spots) to hypoplasia of the tooth (with discrete confluent pitting and widespread brown stains). The minimal daily fluoride intake in infants that may cause mild fluorosis has been estimated to be 0.1 mg/kg bw/day. This is in agreement with the reported levels of 0.1 to 0.3 mg/kg bw/day necessary to initiate fluorosis in animals.
The most significant toxic effect of chronic excess fluoride in humans is skeletal fluorosis. Symptoms consists of increases in bone density, bone morphometric changes and exostoses and can progress to crippling skeletal fluorosis with accompanying muscle wasting and neurological defects. The development of skeletal fluorosis and its severity is directly related to the level and duration of exposure. Most research has indicated that an intake of at least 10 mg/day for 10 or more years is needed to produce clinical signs of the milder form of the condition. Advanced stages of skeletal fluorosis are associated with intake of fluoride ranging from 20-80 mg/day for 10 or more years (ANZFA, 1999b).
Dietary intakes of young children has been the subject of particular interest largely from the cariostasis effects and the possibility of dental fluorosis, and additionally due to suggestion that infants have a greater capacity to deposit fluoride in bones than adults.
Exposure Assessment
Fluorides in concentrations normally encountered in food and water are considered to be of low risk to human health. A recent US study was conducted to determine the extent to which foods made with
160

mechanically separated chicken can contribute to total fluoride intake (Table 6.3) (Fein and Cerklewski, 2001).
161

Table 6.3 Fluoride content (ppm) of foods made with mechanically separated chicken a
Food Mean ± sd RangePureed chicken
brand A 5.58 ± 1.73 3.22 – 8.63
brand B 2.82 ± 0.90 1.89 – 4.63Pureed chicken plus pear 1.61 ± 0.57 0.08 – 2.01
Chicken sticks 3.61 ± 1.29 1.61 – 6.00Vienna sausage
brand A 2.18 ± 0.45 1.35 – 3.26brand B 1.45 ± 0.27 1.20 –1.89
Luncheon meatbrand A 2.35 ± 0.67 1.53 ± 3.65
brand B 1.60 ± 0.50 1.01 ± 2.64a n = 10 samples; duplicate analyses were within 5% of the mean.
Infant foods had the highest fluoride content followed by chicken sticks, luncheon meats, and canned meats. The study commented that a single serving of infant food (71g) made with chicken would provide as much as 0.6 mg of fluoride. The study concluded that fluoride contributed by foods made with mechanically separated chicken could increase the risk of mild dental fluorosis for children less than eight years of age when combined with other sources of fluoride exposure.
Australian food consumption data indicated that consumers of mechanically separated chicken (MSC) aged between 2-8 years had a mean intake of 36.1g with intake of 102.4g at the 95 th percentile (Table 6.4). Data on infants is not available. Foods identified to contain mechanically separated chicken in Australia are listed in Appendix 10.
Table 6.4 Consumption of foods containing mechanically separated chicken for Australian consumers aged 2-8 years (ANZFA, 1995)
Age No. of respondents in NNS
Average respondent body weight (kg)
No. of consumers of MSC
(% of no. surveyed)
Mean consumer intake of MSC
g/day (g/kg bw/day)
95th percentile intake of MSC
g/day (g/kg bw/day)
2-8 years
1,360 21 128 (9.4%) 36.1 (1.7) 102.4 (4.7)
Risk Characterisation
Excess intake of fluoride in humans may manifest as: (a) acute poisoning, (b) skeletal fluorosis, and (c) mottled tooth enamel (dental fluorosis). In terms of frequency of occurrence only the last category is commonly encountered.
In the past, cases of skeletal fluorosis have been observed following chronic exposure to high fluoride-containing water. However, this required high doses (20-80 mg/day) of fluoride over a considerable period of time (>10 years) and has historically been restricted to tropical and subtropical areas, and is complicated by factors such as malnutrition (ANZFA, 1999b).
Further research is needed to establish the fluoride concentration of mechanically separated poultry meats in Australia as well as to examine the technological factors which influence fluoride content of these meats. Assuming concentrations of fluorides in Australian MSC are similar to those found in the USA, fluoride contributed by foods made with mechanically separated chicken could increase the risk of mild dental fluorosis for children less than eight years of age when combined with other sources of fluoride exposure.
162

6.3.4 Lead
The safety of lead was last assessed by ANZFA in Proposal 157 – Review of the maximum permitted concentrations of metal contaminants in food (ANZFA, 1999e).
Lead (Pb) is a soft, silvery grey metal which is highly resistant to corrosion. Solubilities in water vary, lead sulphide and lead oxides being poorly soluble and the nitrate, chlorate and chloride salts reasonably soluble. Lead also forms salts with such organic acids as lactic and acetic acid, and stable organic compounds such as tetraethyllead and tetramethyllead, the latter two important as fuel additives and as such are sources of environmental lead. In recognition of the toxic effects of lead, Australia has stopped the use of organic lead compounds in petrol.
No organic forms of lead have been reported to occur in food. Thus lead in foodstuffs exists exclusively as salts, oxides or sulphydryl complexes. The elimination of lead solder from food cans has reduced the hazard of exposure to lead from canned food, particularly from canned milk and infant formula.
Regulation of lead in poultry
An ML for lead in poultry was included in Table to clause 3 – Maximum level of non-metal contaminants in food – Standard 1.4.1 – Contaminants and Natural Toxicants; as defined in Table 6.5.
Table 6.5 Maximum levels of metal contaminants in food (lead)
Column 1 Column 2 (mg/kg)
LeadEdible offal of cattle, sheep, pig and poultry 0.5Meat of cattle, sheep, pig and poultry (excluding offal) 0.1
Hazard Identification and Characterisation
In humans, blood levels exceeding 300 g/l as a consequence of occupational exposure have been related to a number of toxic effects such as anaemia, renal toxicity and subsequent carcinogenicity, cardiovascular and neurological/behavioural effects, and impairment of the reproductive system (Gardella, 2001; Gonick and Behari, 2002; Silbergeld, 2003). The most important and best-documented effect of lead at the concentrations most commonly encountered outside occupational settings is retardation in the neurobehavioral development observed in children of mothers having been exposed to lead (Lidsky and Silbergeld, 2003). The most recent research on developmental toxicity in children suggests that detectable deficits may occur even at exposure levels previously considered safe (Canfield et al., 2003; Lanphear et al., 2000; Selevan et al., 2003).
The IARC has classified lead into group 2A (probably carcinogenic for humans) (IARC, 2004).
The Joint FAO/WHO Expert Committee on Food Additives (JECFA) has established a provisional tolerable weekly intake (PTWI) for lead in 1986. It is set to 25 g/kg body weight/week for infants and children (equivalent to 3.6 g/kg body weight/day) on the basis that lead is accumulating in the body and an increase of the body burden should be avoided (WHO, 1986). In 1993 and 2000, the Committee reconfirmed this PTWI and extended it to all age groups (EFSA, 2004b).
Exposure Assessment
A dietary exposure assessment was conducted as part of the assessment of lead for Proposal P157 – Review of the maximum permitted concentrations of metal contaminants in food.
163

The primary foods that contribute to dietary lead exposure in the Australian population, aged 2 years and older, excluding water, were cattle meat (29.9%), pig meat (11.7%), wine (9.8%), peach (8.7%), pineapple (5.4%) and sugar (5.0%). Poultry meat was not a major contributor to lead dietary intake.
The 20th Australian Total Diet Survey identified one sample out of 21 to contain lead at 0.01 mg/kg (ATDS, 2003).
Some consideration also needs to be given to the consumption of poultry harvested from wild sources. High levels of lead poisoning have been observed in Magpie geese (Anseranas semipalmata) harvested in the Northern Territory. The taking of wildlife by Aboriginal people for traditional purposes is not bound by hunting regulations or seasons when taking birds for food or other traditional purposes. The Magpie Goose is a preferred food species in many Aboriginal communities with a subsistence off-take in the order of 100 000 to 150 000 birds per year. Although sale or barter of birds taken for subsistence purposes is illegal, anecdotal evidence suggests a substantial market exists (PWC, 2003). Specific information of the concentration of lead in Magpie geese consumed in the Northern Territory has not been identified. A management strategy has resulted in lead shot being phased out by 2005 in Northern Territory wetlands.
Risk Characterisation
Lead is able to induce retardation in the neurobehavioral development observed in children of mothers having been exposed to lead (WHO, 1986). Estimated dietary exposure to lead, based on the 1995 Australian National Nutrition Survey (whole population aged 2 years and over) (ANZFA, 1995) resulted in a mean dietary exposure of 2.2-5.6% (6.5-9.9% including water) PTDI and dietary exposure at the 95th percentile (consumers only) of 6.2-13.2% (16.1-22.6% including water) PTDI. Lead dietary exposure from the consumption of poultry meat products presents a negligible risk to the consumer.
The risks associated with lead exposure from the consumption of Magpie geese by Aboriginal communities cannot be fully characterised, however, environmental management strategies should reduce exposure to lead via this route in the foreseeable future.
6.3.5 Mercury
The safety of mercury was assessed by ANZFA in Proposal 157 – Review of the maximum permitted concentrations of metal contaminants in food (ANZFA, 1999f).
Mercury (Hg) occurs naturally in the environment with levels in the topsoil vary between 0.02 and 0.15 mg/kg. The primary route of exposure to mercury, primarily in the form of methylmercury, is through the food supply. Occupational exposure to mercury is generally from mercury vapour.
The different chemical forms of mercury can exhibit quite distinct pharmokinetic and toxicological properties. From the perspective of exposure via food, inorganic mercury appears to represent a lesser hazard than organic forms of mercury. There are essentially two reasons for this. Firstly, the levels of inorganic mercury in food are low and secondly, absorption of inorganic mercury from the gastrointestinal tract is also low, therefore it appears unlikely that many people would be subject to the levels of oral intake that might be expected to have an adverse effect.
The predominant source of environmental methylmercury is the methylation of inorganic mercury. This reaction is typically carried out by microorganisms in aquatic sediments, soils and faecal material. Although intake of the methylated form is of primary interest, surveys of contaminants in food typically only measure total mercury (ANZFA, 1999f).
164
Hazard Identification and Characterisation
In humans, methylmercury can induce toxic effects in several organs such as the nervous system, kidney liver and reproductive systems. Neurotoxicity is considered the most sensitive endpoint. The majority of toxicological data, on which tolerable limits were previously set, have come from large scale poisonings of human population with methylmercury in Japan and Iraq. Data from these incidences confirmed an association between the consumption of fish contaminated with methylmercury and the development of neurological symptoms in adults and infants exposed in utero. The data indicated that the most sensitive section of the population to methylmercury poisoning is the unborn foetus (WHO, 2003b).
The IARC has classified methylmercury into group 2B (probably carcinogenic for humans – sufficient evidence in animals and inadequate data in humans) and metallic mercury and inorganic mercury compounds into group 3 (not classifiable as carcinogenic to humans) (IARC, 1993b).
In June 2003, JECFA evaluated new information that became available on methylmercury. This information included results of studies performed on laboratory animals and humans, and epidemiological studies investigating possible effects of prenatal methylmercury exposure on child neurodevelopment. A new PTWI of 1.6 g/kg bw was recommended. This PTWI is considered sufficient to protect the developing foetus, the most sensitive subgroup of the population (WHO, 2003b).
Exposure Assessment
A dietary exposure assessment was conducted as part of the assessment of mercury for Proposal P157 – Review of the maximum permitted concentrations of metal contaminants in food. Fish is by far the greatest contributor to dietary mercury exposure. Poultry meat was not a major contributor to mercury dietary intake.
The 20th Australian Total Diet Survey did not detect mercury in chicken breast meat samples (ATDS, 2003).
Piscivorous waterfowl such as loons, osprey, eagle, herons and kingfishers generally have very high concentration of mercury (Scheuhammer, 1995). The main diet of the short-tailed shearwater or mutton bird (Puffinus tenuriostris) includes krill, squid and fish thereby increasing the possibility that there may be significant mercury contamination issues associated with the consumption of this bird species. Approximately 200,000 chicks are harvested and sold annually (PT, 2004). There is currently an absence of data on the concentration of mercury levels in mutton birds chicks.
Risk Characterisation
Mercury is able to induce neurotoxicity in the peripheral and central nervous systems, with the developing foetus, the most sensitive subgroup of the population (WHO, 2003b). Mercury dietary exposure from the consumption of poultry meat products presents a negligible risk to the consumer.
The risks associated with mercury exposure from the consumption of mutton birds cannot be fully characterised, however, the quantity and age of the birds consumed may limit exposure to mercury via this route in the general community.
6.3.6 Selenium
The safety of selenium was assessed by ANZFA in Proposal 157 – Review of the maximum permitted concentration of metal contaminants in food (ANZFA, 1999g).
165

Selenium is a metallic group VI element that is abundant and which can exist in 4 oxidation states (-2, +1, +2 and +6). Selenium in food is predominantly in the form of organoselenium compounds; selenocysteine is usually the primary form obtained from animal based foods. The selenium content of food varies depending on the selenium content of the soil. Organ meats, such as kidneys or livers, contain the highest levels of selenium, but some seafood products contain almost as much (IPSC, 1986). Selenium is being investigated due to the potential for poultry to contain high levels of selenium, presumably through consumption of meal and fishmeal rations.
Hazard Identification and Characterization
Selenium is an essential element necessary for good health, and the contribution of selenium deficiency to specific diseases are well described (ANZFA, 1999g). However, in excessive quantities in the diet, selenium compounds can cause systematic toxicity in people, stock animals and laboratory species.
Absorption of selenium is efficient and is not regulated. More than 90 percent of selenomethionine, the major dietary form of the element, is absorbed by the same mechanism as methionine itself. Two pools of reserve selenium are present in humans and animals. One of them, the selenium present as selenomethionine, depends on dietary intake of selenium as selenomethionine. The amount of selenium made available to the organism from this pool is a function of turnover of the methionine pool. The second reserve pool of selenium in the selenium present in liver glutathione peroxidase (GSHPx-1).
The mechanism that regulates production of mammalian excretory metabolites has not been elucidated, but excretion has been shown to be responsible for maintaining selenium homeostasis. The excretion occurs largely in the urine.
Prolonged exposure to high levels of selenium induces pathological changes to the hair and nails as well as adverse effects on the nervous system. Common clinical features are hair loss and structural changes in the keratin of hair and of nails, the development of icteroid skin, and gastrointestinal disturbances. Nervous system effects include peripheral anaesthesia “pins and needles”, pain in the extremities and paresthesis. A positive association between dental caries and urinary selenium have been reported. Changes in biochemical parameters have also been reported.
The Chinese human data from the Enshi district, albeit limited, is considered the best, available for the estimation of a LOEL. A chronic dietary intake of 0.75 mg Se/day was noted as the minimum level at which increasing amounts of dietary selenium was associated with a decrease in the plasma/erythrocyte selenium ratio in human blood. The biological significance of the decrease in this ratio is not clear, but may indicate changes in the selenium compartmentation and may be interpreted as the most sensitive biochemical indication of chronic selenosis. Nail changes considered the most sensitive clinical marker of chronic selenosis were observed at 0.85-0.95 mg Se/day. However, the effect on the plasma selenium to erythrocyte selenium ratio could be considered a more acceptable conservative biochemical marker of subclinical selenium toxicity (ANZFA, 1999g).
Based on the subclinical observation of the plasma/erythrocyte plasma selenium ratio in human blood, ANZFA proposed a PTDI of 0.75 mg/day (equivalent of 12.5 g/kg bw/day) for selenium. Furthermore, there are homeostatic mechanisms present in adults, which act to compensate for an excessive intake of selenium and hence clinical signs of toxicity, are reversible (ANZFA, 1999g). A subsequent report utilizing an upper tolerable nutrient intake level (UL) as a reference, provisionally set an intake of 400 g/day for selenium (FAO/WHO, 2001).
Exposure Assessment
A dietary exposure assessment was conducted as part of the assessment of selenium for Proposal P157 – Review of the maximum permitted concentrations of metal contaminants in food.
166

The primary foods that contribute to dietary selenium exposure in the Australian population, aged 2 years and older, were chicken meat (19%), marine fish (11%), pork (10%) eggs (10%), wheat flour (5%) and milk and dairy (5%).
Estimated dietary exposure to selenium, based on the 1995 Australian National Nutrition Survey (whole population aged 2 years and over) resulted in a mean dietary exposure of 7.3-12.6% (8.6-13.8% including water) PTDI and dietary exposure at the 95th percentile (consumers only) of 18.9% and 20.8% including water (ANZFA, 1995).
Australian Total Diet Survey data have indicated selenium levels in chicken breasts (0.245 mg/kg), chicken liver pate (0.403 mg/kg) (ATDS, 2003) and chicken drumsticks (0.312 mg/kg) (ATDS, 2001).
Risk Characterisation
Excessive selenium is able to induce pathological changes to the hair and nails, followed by adverse effects on the nervous system. ANZFA proposed PTDI of 0.75 mg/day (equivalent to 12.5 g/kg bw/day) for selenium that was set for a subclinical toxicological endpoint based on the plasma/erythrocyte plasma selenium ratio in human blood (ANZFA, 1999g).
Estimated dietary exposure to selenium, based on the 1995 Australian National Nutrition Survey (whole population aged 2 years and over) resulted in a mean dietary exposure of 7.3-12.6% (8.6-13.8% including water) PTDI and dietary exposure at the 95th percentile (consumers only) of 18.9% and 20.8% including water (ANZFA, 1995). While selenium derived from poultry makes a significant contribution to selenium dietary exposure, the level of exposure was significantly below the PTDI. Importantly, poultry being a rich source of selenium may have a role in preventing selenium deficiency in the community.
6.3.7 Dioxins
A general review of dioxins in Australia has also been conducted through the National Dioxins Program (2004).
The term ‘dioxins’ is used to describe a group of environmentally persistent halogenated aromatic hydrocarbon chemicals that include polychlorinated dibenzodioxins (PCDDs), polychlorinated dibenzofurans (PCDFs), polybrominated dibenzodioxins (PBDDs), polybrominated dibenzofurans (PBDFs) and a subset of coplanar polychlorinated biphenyls (PCBs). The chlorinated compounds predominate and are the focus of this review. PCDDs, PBDDs, PBDFs and PCDFs are not manufactured intentionally but are by-products of combustion. They are formed naturally by volcanoes and forest fires, as well as by industrial processes such as waste incineration and the synthesis of certain chemicals. PCBs, on the other hand were manufactured for approximately 50 years for use as components of insulating fluids in transformers and other electrical equipment (NDP, 2004b) and will be discussed separately.
The PCDDs and PCDFs are chlorinated tricyclic aromatic hydrocarbons, made up of two benzene rings joined by either two oxygen atoms at adjacent carbons on each of the benzene rings (PCDDs) or by one oxygen atom and one-carbon-carbon bond (PCDFs); their basic structure is given in Figure 6.2 (NDP, 2004b).
167

Figure 6.2 Structures of dibenzo-p-dioxin and dibenzofuran
Both groups of chemicals may have up to eight chlorine atoms attached at carbon atoms 1 to 4 and 6 to 9. Each individual compound resulting from this is referred to as a congener. The number and position of chlorine atoms around the aromatic nuclei distinguish each specific congener. In total, there are 75 possible PCDD congeners and 135 possible PCDF congeners. The most widely studied of the PCDDs and PCDFs is 2,3,7,8-tetrachlorodibenzo-p-dioxin (TCDD). TCCD is often generically referred to as ‘dioxin’, and represents the reference compound for this class of chemicals (NDP, 2004b).
Congeners containing one, two or three chlorine atoms are though to be of no toxicological significance. However, 17 congeners with chlorine atoms substituted in the 2,3,7, and 8 positions (i.e. in the lateral positions of the aromatic rings) are thought to pose a human health and environmental risk. Increasing substitution from four to eight chlorine atoms generally results in a marked decrease in potency (NDP, 2004b).
In general, dioxin-like compounds have very low water solubility, high octanol-water partition coefficients, low vapour pressure and absorb strongly to particles and surfaces and are resistant to chemical degradation under normal environmental conditions. Thus, they are persistent in the environment and their high fat solubility results in their bioconcentration into biota and biomagnification up the food chain (NDP, 2004b).
Toxic equivalency factors
When found in the environment, biological tissue and industrial sources, dioxins are usually present as complex mixtures; this complicates hazard and risk assessment because different congeners vary significantly in their toxicity. However, the potency of different dioxins can be ranked relative to TCDD, the most toxic member of the dioxin class. These rankings are known as toxic equivalency factors (TEFs). To be included in the TEF scheme, a compound must be structurally related to PCDDs and PCDFs, bind to cellular aryl hydrocarbon (Ah) receptor, elicit Ah receptor-mediated biochemical and toxic responses, must be persistent, and accumulate in the food chain.
Several schemes for assigning TEFs to PCDD/Fs and PCBs have been used previously. However, the most recent review of TEFs was that of the World Health Organisation (WHO) in 1998 (van den Berg et al., 1998). Under the WHO TEF scheme, TCDD is assigned a TEF of 1.0, and other PCDDs, PCDFs and PCBs have TEF values ranging from 1.0 down to 0.00001. To estimate the toxic potency of a given dioxin mixture, the mass concentration of each individual component is multiplied by the respective TEF, and the products are summed to represent the TCDD toxic equivalence (TEQ) of the mixture. Intake of dioxins for the purpose of this Report will be expressed in units of TEQs applying the 1998 WHO TEFs (NDP, 2004b).
168

Hazard Identification and Characterisation
The most widely studied of all the dioxin-like compounds is TCDD. It has been shown to affect a wide range of organ systems in many animal species and can induce a wide range of adverse biological responses. The binding of TCDD to the so-called aryl hydrocarbon (Ah) receptor in cells appears to be the first step in a series of events that manifest themselves in biological responses, including changes at the biochemical, cellular and tissue level.
In humans, the most widely recognised and consistently observed effect following high dose exposure to TCDD is chloracne. The condition can disappear after termination of exposure or can persist for many years. Other effects on the skin include hyperpigmentation and hirsutism. TCDD can cause long-term alteration in glucose metabolism and there is some evidence of a weak correlation between incidence of diabetes and occupational or accidental exposure to dioxins; however, background exposure to dioxins is not a significant risk factor for diabetes. TCDD exposure has been suggested to cause slight changes in thyroid function, but clinical illness associated with immune system disorders does not appear to have been associated with TCDD in any cohort studied. There is suggestive evidence of toxicity to the cardiovascular system. Overall, epidemiology studies on populations exposed occupationally or environmentally to TCDD have not demonstrated any significantly increased all-cause or non-cancer mortality (NDP, 2004b).
Experimental studies demonstrate that TCDD is carcinogenic in all species and strains of laboratory animals tested. It has been characterised as a multi-site carcinogen. Epidemiological evidence from the most highly-exposed occupational cohorts studied produces the strongest evidence in humans of an increased cancer risk from exposure to dioxins, when the data is considered for all cancers combined. There is weaker evidence of an increased cancer risk when cancers from particular sites is considered (NDP, 2004b).
IARC has concluded that TCDD is carcinogenic to humans (IARC, 1997).
Largely based on the deliberations of;
the consultation between the technical experts representing the World health Organisation European Centre for Environmental Health (WHO-ECEH) and the International Programme on Chemical Safety in May 1998,
the meeting of the European Community Scientific Committee on Food (EU-SCF) on the risk assessment of dioxins and dioxin-like polychlorinated biphenyls (PCBs) in food, in May 2001, and;
the JECFA evaluation of dioxins, at it 57th meeting in June 2001.
Australia established a Tolerable Monthly Intake (TMI) for dioxins of 70 pg TEQ/kg bw/month from all sources combined. This tolerable intake is equal to that set by JECFA (WHO, 2001a), and includes polychlorinated dioxins, polychlorinated furans and dioxin-like PCBs, as specified under the WHO 1998 TEF scheme. This TMI was endorsed by the National Health and Medical Research Council (NHMRC) on 24th October 2002, as outlined in the booklet, Dioxins: Recommendation for a Tolerable Monthly Intake for Australians, published jointly by the NHMRC and the TGA, organisations within the Department of Health and Ageing (DoHA) (NHMRC, 2002).
169

Exposure Assessment
National Residue Survey
Poultry samples were collected at random from 12 different abattoirs across the country with the largest throughput. It was expected that this strategy would maximise the chance of a broad representation of different diets. Industry quality assurance managers, following instructions provided by the National Residue Survey and using collection materials and containers provided by the laboratory, collected composite samples of poultry fat.
Test results on Australian poultry meat products indicated that at the time of testing that no existing international poultry commodity standards or action levels had been exceeded, however it should be noted that only 15 samples were tested (Table 6.6). It was noted that there would be a very low probability of detecting an isolated instance of contamination in such a limited number of samples. The Dioxins Technical Group recommended that on-going testing of poultry takes place (NDP, 2004a).
Table 6.6 Dioxins and dioxin-like PCBs in poultry – National Residue Survey
Poultry pg TEQ/g fat
Mean Standard deviation
Minimum Median Maximum
Dioxins lower bound
0.00117 0.00236 0.00 0.00 0.00700
Dioxins upper bound
0.330* 0.0862 0.183 0.317 0.529
PCBs lower bound
0.0173 0.0550 0.00 0.00280 0.216
PCBs upper bound
0.249 0.125 0.0846 0.226 0.452
Total TEQ lower bound
0.0184 0.0548 0.00 0.00410 0.216**
Total TEQ upper bound
0.579 0.165 0.302 0.593 0.805**
* The Australian data (mean dioxin upper bound result in pg TEQ/g fat) for poultry was 16.5% of the EC standard. The EU standard for dioxins do not include dioxin-like PCBs.
** Maximum ‘Total TEQ’ results represent the maximum value across all samples for the sum of dioxin and dioxin-like PCB results in an individual sample. For any sample, maximum ‘Total TEQ’ results are not the sum of maximum dioxin TEQ and maximum PCB TEQ values unless both maximums occur in the same sample.
FSANZ survey
FSANZ conducted a survey of dioxins in a range of foods, which are representative of the total diet, in order to estimate the dietary exposure of Australians to dioxins. Each sample analysed for dioxins was made up of a composite of four food purchases for core foods, or three food purchases for all other foods. Where appropriate, the composite food samples were prepared to a ‘table ready’ state before analysis, thus best representing the amounts of dioxins that would be consumed. For example, meat and eggs were cooked (NDP, 2004b).
Survey samples were analysed for the 29 PCDD, PCDF and coplanar dioxin-like PCB congeners for which the WHO derived toxic equivalency factors for human risk assessment. WHO Toxic Equivalents (WHO-TEQs) (picograms/gram) were calculated by summing the weighted concentrations for each of the 17 specified PCDD/F and 12 PCB congeners, on both a fresh weight and lipid weight basis for each food analysis.
170

Results were reported as both lower bound and upper bound WHO-TEQs for each food sample, noting that in this study the limit of quantitation (LOQ) rather than the limit of detection (LOD) was used and the LOQ is higher than the LOD (NDP, 2004b).
A summary of the mean PCDD/F and dioxin-like PCB concentrations for poultry used in the dietary modelling is shown in Table 6.7. Individual composite sample PCDD/F and PCB summary results are available from FSANZ (FSANZ, 2004).
Table 6.7 Mean levels of PCDD/Fs and dioxin-like PCBs in Australian food
Food No. composite samples
PCDD/Fs pg WHO-TEQ/g PCBs pg WHO-TEQ/gLower bound Upper bound Lower bound Upper bound
Chicken breast 11 0.0006 0.0156 0.0038 0.0057
It is noteworthy that there are differences between the data collected in the NRS on poultry meat and that obtained by FSANZ for dietary modelling purposes. Comparison of dioxin concentrations in food across different monitoring programs is difficult since there are differences in food sampled, analytical methodologies and calculation and reporting of TEQs. Generally Australian foods have levels of PCDD/Fs and dioxin-like PCBs that are similar to those reported in New Zealand and lower than those reported from other areas of the world.
Risk Characterisation
For the general population, over 95% of exposure to dioxin-like compounds is through the diet, with foods of animal origin such as meat, dairy products and fish being the main sources (NDP, 2004b). For all Australians aged 2 years or older, mean upper bound monthly intake of dioxins is 15.6 pg TEQ/kg bw/month, significantly below the TMI of 70 pg TEQ/kg bw/month. Poultry meat was not a major contributor.
6.3.8 Polychlorinated Biphenyls
The safety of polychlorinated biphenyls was last assessed by ANZFA in Proposal 158 – Review of the maximum permitted concentration of non-metals in food (ANZFA, 1999c).
Polychlorinated biphenyls (PCBs) are members of a large class of organic compounds known as halogenated aromatic hydrocarbons which do not occur naturally in the environment. Rather, they are manufactured by the addition of chlorine atoms to biphenys in the presence of a suitable catalyst and are chemically similar to the chlorinated organic compounds used in pesticides.
PCBs can exist as 209 individual congeners, however, only about 130 congeners are likely to occur in commercial PCB mixtures. PCBs congeners occur as the monochloro congener through to the fully chlorinated decachloro congener; the basic aromatic nucleus is shown in Figure 6.3.
Figure 6.3 Structure of biphenyl
171
PCBs were produced commercially in the 1920s, although it was not until the 1950s that the industrial application of PCBs increased significantly. They were used as capacitor, hydraulic and transformer fluids, in carbonless copying paper and as plasticisers in paint. PCBs are dispersed into the environment through the atmosphere and following release into water. PCBs are also mobilised in soil or landfills. PCBs degrade very slowly and, as a result, they accumulate and persist for many years in the environment, resulting in contamination of the food chain. In response over the bioaccumulation of PCBs, many industrialised countries including Australia have taken steps to control and restrict the flow of PCBs into the environment.
Food Regulation
As part of Proposal P158 - Review of the maximum permitted concentrations of non-metals in food – a risk management strategy that included a ML for total polychlorinated biphenyls in poultry fat was included in Table to clause 3 – Maximum level of non-metal contaminants in food - Standard 1.4.1 – Contaminants and Natural Toxicants (Table 6.8). The ML was set to include total polychlorinated biphenyl concentrations in food.
Table 6.8 Maximum levels of non-metal contaminants in food (polychlorinated biphenyls, total)
Column 1 Column 2 (mg/kg)Polychlorinated biphenyls, totalMammalian fat 0.2Poultry fat 0.2Milk and milk products 0.2Eggs 0.2Fish 0.5
Hazard Identification and Characterisation
Data concerning the toxicological effects of PCBs in humans appear to be based on two accidental poisonings from contaminated rice oil in Japan and Taiwan. Clinical symptoms were seen in victims three to four months after exposure. Follow-up studies have shown that some victims developed neurological symptoms and malignancies. These toxic effects were originally attributed to PCBs present in the oil. However, further examination of the poisonings indicates that the symptoms were most probably caused by the presence of the more potentially toxic polychlorinated dibenzofurans.
JECFA (1990) has designated non-human primates as the species most sensitive to the toxic effects of PCBs and has assigned a NOEL of 0.04 mg/kg bw/day, based on the general toxicity of Anoclor 1242 in monkeys (WHO, 1990). However, the limitations of the available data and the toxicological differences in PCB mixtures that were used in the animal feeding studies has made it difficult to establish a value for tolerable intake for humans (ANZFA, 1999c).
Exposure Assessment
The 1994 and 1996 Australian Market Basket Surveys did not detect PCBs in any foods tested. PCBs were not included in the 19th and 20th Australian Total Diet Surveys.
A subset of the PCBs, the coplanar PCBs, has been investigated in poultry meat products by the National Dioxins Program (2004). Coplanar PCBs were investigated due to structural similarities to the PCDD/PCDFs and their ability to elicit dioxin–like responses through similar modes of action. Results from the National Residue Survey (Table 6.3.6) shows a maximum total toxic equivalence for PCBs of 0.216 pg TEQ/g fat (lower bound) and 0.452 pg TEQ/g fat (upper bound) (NDP, 2004a). Results from a survey conducted by FSANZ which survey the exposure of food in a ‘table ready’ state (Table 6.3.7) shows a mean concentration of PCBs of 0.0038 pg WHO-TEQ/g (lower bound) and 0.0057 pg WHO-TEQ/g (upper bound) (FSANZ, 2004).
172

Risk Characterisation
Toxicological evaluation of PCBs is complicated by many factors, the first of which is the paucity of data concerning human exposure to, and the effects of, PCBs. Much of the animal toxicity data are based on testing mixtures that contain many PCB congeners with varying degrees of chlorination and different stereochemical structures. Differences in the toxicity between PCB congeners may also be associated with specific metabolite and/or their specific intermediates.
Oral exposure to PCBs is associated with adverse effects in animals, the most consistent and pronounced is the occurrence of liver tumours in rodents. However, the available human data (mainly from accidental exposures) is equivocal in respect of an association between PCBs and increased cancer mortality.
The 1994 and 1996 Australian Market Basket Surveys indicated that PCBs were undetected in the Australian food supply. The National Dioxins Program (2004) investigated coplanar dioxin-like PCBs in poultry and found that these compounds were present at very low levels in poultry fat and meat. Exposure to PCBs through the consumption of poultry meat products presents a negligible risk to the consumer.
6.3.9 Polycyclic Aromatic Hydrocarbons
The term ‘polycyclic aromatic hydrocarbons’ (PAHs) commonly refers to a large class of organic compounds containing two or more fused aromatic rings made up of carbon and hydrogen atoms. PAHs are soluble in many organic solvents and are highly lipophilic. They are chemically rather inert (IPSC, 1998).
Raw food does not normally contain high levels of PAHs. Processing procedures, such as smoking and drying, and cooking of food is commonly thought to be the major source of contamination by PAH (SCF, 2002a). Depending on a number of parameters: time, fuel used, distance from the heat source and drainage of fat, type of cooking (grilling, frying, roasting), cooking results in the production in the food of a number of compounds including PAHs.
PAH contamination of smoked foods can be significantly reduced by replacing direct smoking (smoke developed in the smoking chamber, traditionally in smokehouses), with indirect smoking. The latter is obtained by an external smoke generator which, in modern industrialised kilns, is operated automatically under properly controlled conditions. Also the use of smoke flavourings is generally considered to be of less health concern than the traditional smoking process, as it may minimise PAH contamination. A smoke flavouring (also known as ‘liquid smoke’) is produced from condensed smoke, which is then fractionated and purified to remove most PAHs (SCF, 2002c).
Hazard Identification and Characterization
The acute toxicity of PAHs is moderate to low. The well characterized PAH, naphthalene, showed oral and intravenous LD50 values of 100-500 mg/kg bw in mice and a mean oral LD50 of 2700 mg/kg bw in rats. The values of other PAH are similar (IPSC, 1998).
PAHs have been studied extensively in assays for genotoxicity and cell transformation; most PAHs are positive in some genotoxicity assays. The only compounds for which negative results were found in all assays were anthracene, fluorene and naphthalene. Owing to inconsistent results, phenanthrene and pyrene could not be reliably classified for genotoxicity.
Comprehensive work on the carcinogenicity of PAHs shows that 17 of 33 studied are, or are suspected of being carcinogenic. Only benzo-[a]-pyrene has been adequately tested using dietary administration (SCF, 2002c).
173

In humans the majority of studies available have examined occupational exposure to PAHs via inhalation, and in a few studies, via dermal exposure. Most of the reports are on exposure to mixtures of PAHs, which also contained other potentially carcinogenic chemicals, in occupational or environmental situation (SCF, 2002a).
Exposure Assessment
FSANZ does not have data regarding the exposure of the Australian population to PAHs. The intake of individual PAH from food has been estimated to be 0.10-10 g/day per person. Cereals and cereal products are the main contributors to the intake of PAH from food because they are a major component of the total diet (IPSC, 1998). A Swedish study has found that smoked and grilled foods show the highest PAH levels though they make only a modest contribution to total PAH dietary intake, since they are minor components of the usual diet (IPSC, 1998; Larsson, 1986). However, it should be noted that smoked and grilled food may contribute significantly to the intake of PAH if such food are part of the usual diet.
Risk Characterisation
Data linking dietary exposure of polycyclic aromatic hydrocarbons to possible human health risks are inconclusive. Some PAH are likely to be genotoxic carcinogens – with no known level of safe exposure. Estimated average dietary exposure for the Australian population is unavailable. Exposure is expected to be highly variable and linked to processing practices however, overall exposure from food is likely to be low. Though there is potential risk due to carcinogenic properties of some PAHs, particularly benzo[a]pyrene and as such exposure should be as low as reasonably achievable, the contribution of PAHs in the diet to the development of human cancer is not considered to be high (IPSC, 1998).
6.3.10 Heterocyclic Amines
The term ‘heterocyclic amines’ (HCA) commonly refers to a large class of organic compounds comprised of a series of nitrogen containing aromatic ring structures. Heterocyclic amines are formed in the surface layer of meat during cooking, are mutagenic in Ames’ test and carcinogenic in animal models, but the effect in humans remains to be elucidated. HCAs can be synthesised by heating of amino acids, creatine/creatinine and sugars. More than 20 HCAs have been isolated and identified in cooked foods. The chemical structures of some of the HCAs detected in cooked chicken samples are given in Figure 6.4.
174

Figure 6.4 Chemical structures of some of the HCAs detected in cooked chicken samples (Solyakov and Skog, 2002)
Heterocyclic amines can be divided into different classes: amino-imidazo-azaarenes (imidazo-quinolines, imidazo-quinoxalines and imidazopyridines) and the aminocarbolines (pyrido-indoles and pyrido-imidazoles). Formation of the imidazo-quinoline or imidazo-quinoxaline type (IQ type) HCAs, have been synthesised using creatine and creatinine, free amino acids and sugars as precursors. The same precursors may form the imidazo-pyridines. Amino-carbolines may be produced by the pyrolysis of amino acids and proteins (Skog and Solyakov, 2002).
Hazard Identification and Characterisation
Ten HCAs have been chemically synthesised and assessed in standard long-term assays in mice and rats. Positive results were found in both species. Tumours were observed in the liver, as well as in other organs including mammary glands, skin, Zymbal glands, the small intestine, the large intestine, the prostate, haematopoietic tissue, the urinary bladder and forestomach. Phenylimidazopyridine (PhIP) induced colon and prostate cancers in male rats and breast cancers female rats, but not hepatomas in the liver of rats of either sex (Sugimura and Adamson, 2000).
Three HCAs, IQ, MeIQx and PhIP were selected for carcinogenicity testing in macaques, primarily cynomolgus monkeys. The selection of the HCAs was based on their structure, concentration in cooked foods, mutagenic activity in various systems and carcinogenicity in rodents.
IQ was administered at 10 mg/kg and 20 mg/kg, five times a week by nasogastric intubation for up to 84 months. IQ was found to be a potent carcinogen inducing tumours in 70% of the monkeys at a dose of 10 mg/kg five times a week and 100% of monkeys at 20 mg/kg dose. The average latent period for induction of hepatocellular carcinomas at the 10 mg/kg dose level was about 60 months, while at the 20 mg/kg dose level was about 43 months (Adamson et al., 1994). IQ was also found to form DNA adducts in a number of tissues including the liver (Adamson, 2000).
MeIQx was administered at 10 mg/kg and 20 mg/kg, five times a week by nasogastric intubation for about 84 months with animals euthanased 8 months after cessation of the MeIQx administration. No neoplastic or preneoplastic lesions that were treatment related were found in any organs.
175

The low level of mutagenic activation of MeIQx by hepatic microsomes from cynomolgus monkeys may reflect the low level of DNA adducts found in vivo (Davis et al., 1993; Snyderwine et al., 1997) and therefore it is not surprising that MeIQx was found not to be carcinogenic under the conditions studied (Ogawa et al., 1999). Other factors that may have effected the result are the level of dosing, the duration of dosing and in vivo detoxification mechanisms (Adamson, 2000).
PhIP was administered at 10 mg/kg and 20 mg/kg, five times a week by nasogastric intubation for 96 months with animals euthanased 12 months after cessation of PhIP administration. At the time of this report, the histopathology on these monkeys had not been released (Adamson, 2000).
Three monkeys (20 mg/kg 4-6 years) had previously been euthanased for DNA adduct, PhIP metabolism and histopathology studies. No specific pathological abnormalities attributable to PhIP were noted. However, the metabolic data obtained was consistent with the probability the PhIP would be carcinogenic to cynologus monkeys if treated for a sufficient time period (Adamson, 2000).
PhIP was shown to be activated to the N-hydroxylamine and in addition, the N-hydroxy-N-glucuronide conjugate of PhIP was found in the plasma, bile and urine of cynonolgus monkeys dosed with PhIP (Snyderwine et al., 1997). DNA-PhIP adducts were widely distributed among various organs of the monkeys, suggesting that there was circulation of the proximate reactive metabolites of PhIP from the liver where it is N-hydroxylated (Adamson et al., 1991; Snyderwine et al., 1997). Furthermore, PhIP-DNA adducts as high as or higher than those found in the liver, were present in many tissues (Adamson, 2000).
Table 6.9 IARC classification of four Heterocyclic Aromatic Amines
Abbreviation Compound Classification Reference
IQ 2-Amino-3-methylimidazo[4,5-f]quinoline Group 2A (IARC, 1993d)
MeIQ 2-Amino-3,4-dimethylimidazo[4,5-f]quinoline Group 2B (IARC, 1993e)
MeIQX 2-Amino-3,8-dimethylimidazo[4,5-f]quinoxaline Group 2B (IARC, 1993f)
PhIP 2-Amino-1-methyl-6-phenylimidazo[4,5-b]pyridine
Group 2B (IARC, 1993g)
Exposure Assessment
FSANZ does not have data regarding the exposure of the Australian population to HCAs. Internationally, there have been some reports of human exposure to HCAs (Augustsson et al., 1997; Skog, 2002) and a literature review on HCAs in poultry products (Skog and Solyakov, 2002). Table 6.10 shows the content of heterocyclic amines in various heat-treated poultry products.
Table 6.10 Content of heterocyclic amines in various heat-treated poultry products
Treatment Composition Reference
Stewing and boiling
No detectable amounts of mutagenic HCAs identified.
One study boiled chicken samples were shown to contain harman or norharman.
(Skog and Solyakov, 2002)(Solyakov and Skog, 2002)
MicrowavingOne report on microwaved chicken legs where Trp-P-2, Trp-P-22, AC, MeAC, Harman and norharman were detected, but no heterocyclic amines of the IQ-type or PhiP.
(Chiu et al., 1998)
Deep-frying One study, up to 10 different HCAs were identified in chicken legs, deep-fried at 100-200oC for 5-15 minutes, in amounts up to 1 ng/g and furthermore 2-3 ng/g of both Harman and PhIP
(Chiu et al., 1998)
176

Treatment Composition Reference
Pan-frying In most reports – MeIQx below 3 ng/g and PhIP approx 20 ng/g.
Up to 70 ng/g PhIP – skinless boneless chicken breasts
64.9 ng/g PhIP – turkey breasts
Pan residues from pan-fried chicken breasts were shown to contain low (<1 ng/g) or undetectable amounts of HCAs.
(Skog and Solyakov, 2002)
(Chiu et al., 1998)
(Brockstedt and Pfau, 1998)
(Solyakov and Skog, 2002)
Oven roasting Does not seem to lead to the formation of high levels of HCAs; the highest values reported are 3.2 ng/g MeIQx and 5.3 ng/g PhIP
(Richling et al., 1998; Skog and Solyakov, 2002)
Broiling, grilling and barbecuing
In most reports - MeIQx below 3 ng/g and PhIP below 40 ng/g.
Over 100 ng/g MeIQx - chicken breast prepared over a gas flame for 6 min.
Up to 480 ng/g PhIP – chicken breast barbecued at 177-260oC.Up to 270 ng/g PhIP – edible but well done grilled chicken breast.
(Skog and Solyakov, 2002)
(Holder et al., 1997)
(Sinha et al., 1995)
(Knize et al., 1997)
Therefore stewing and boiling, microwave cooking, deep frying and oven roasting produce low levels of HCAs whereas pan-frying, broiling and barbecuing can produce higher levels of HCAs (Skog and Solyakov, 2002). The data presented makes it difficult to compare the estimates of heterocyclic amines since the values may vary greatly due to different food composition, cooking techniques and methods of analysis.
Risk Characterisation
Data linking heterocyclic amines to possible human health risks are inconclusive. Some HCAs are likely to be genotoxic carcinogens – with no known level of safe exposure. Estimated average dietary exposure for the Australia population is unavailable. Exposure is likely to be highly variable and linked to processing practices. Overall exposure from food is likely to be low. Though there is a potential risk due to carcinogenic properties of some HCAs, and as such should be as low as reasonably achievable, the contribution of HCAs in the diet to the development of human cancer is not considered high.
6.3.11 Aflatoxin
The safety of aflatoxins was last assessed by ANZFA in Proposal 158 – Review of the maximum permitted concentration of non-metals in food (ANZFA, 1999a).
Aflatoxins are a group of naturally occurring toxic secondary metabolites produced primarily by two species of ubiquitous Aspergillus fungi: A. parasiticus and A. flavus. Among the naturally occurring aflatoxins (B1, B2, G1 and G2), aflatoxin B1 is the most important compound with respect to both, prevalence and toxicity for man and animals (EFSA, 2004a). Aflatoxin dietary intake in humans mainly arises from contamination of maize and groundnuts and their products (WHO, 1998). The chemical structures of aflatoxins B1, B2, G1 and G2 are given in Figure 6.5.
177

Figure 6.5 Chemical structures of aflatoxins B1, B2, G1, and G2.
Hazard Identification and Characterisation
The aflatoxins are potent mutagenic and carcinogenic substances. Extensive experimental evidence in test species shows that aflatoxins are capable of inducing liver cancer in most species studied (WHO, 1998). However, assessment of the risk of liver cancer in humans has proved to be difficult because of confounding factors influencing tumour formation, particularly hepatitis B.
The liver is the primary target organ in most species, but tumours of other organs also have been observed in animals treated with aflatoxins. Aflatoxins are metabolised in humans and test species to an epoxide, which usually is considered to be the ultimate reactive intermediate. The effective dose of aflatoxins B1 for induction of liver tumours varies widely over a wide range of species when the carcinogen was administered by continuous feeding, generally for the lifetime of the animal.
Some epidemiological evidence indicates the possibility that humans are at substantially lower risk from aflatoxins than other species. While some studies suggest that intake of aflatoxins poses a detectable risk in the absence of other factors, other studies suggest that it poses risks only in the presence of confounding factors such as hepatitis B infection (WHO, 1998).
IARC has concluded that aflatoxins are carcinogenic to humans (Group 1) (IARC, 2002a).
JECFA has concluded that aflatoxins should be treated as carcinogenic food contaminants, the intake of which should be reduced to levels as low as reasonably achievable. However, JECFA did not believe that there was a firm foundation for setting absolute limits for aflatoxins intake by humans at this time (WHO, 1998).
Residues in poultry
In a study by Bintvihok et al, (2002) residues of aflatoxins in the liver, muscles and eggs of laying ducks, hens and quails and in broiler chickens was examined by conducting 7-day feeding experiments with a diet containing 3 ppm aflatoxins B1. Birds were sacrificed on the 8th or 11th day of after withdrawal of aflatoxins B1 feeding. Aflatoxin residues in the liver (Table 6.11) and muscle (Table 6.12) of poultry, present in free and conjugated form, were quantified to 0.03 ppb (non-detection limit) and are presented below.
178

Table 6.11 Aflatoxin residues in the liver
Bird 8th Day 11th Day
Aflatoxin B1 (ppb) Oxidative Aflatoxin B1
Metabolites (ppb)Aflatoxin B1 (ppb) Oxidative Aflatoxin B1
Metabolites (ppb)
Free Conjugated Free Conjugated Free Conjugated Free Conjugated
Quail 7.83±0.49 5.31±0.22 22.34±2.40 10.54±0.42 3.54±0.23 1.44±0.16 8.13±0.09 5.74±0.16
Duck 0.52±0.04 0.44±0.16 2.74±0.15 3.81±0.25 0.31±0.13 0.32±0.07 2.33±0.12 3.01±0.05
Hen 0.34±0.03 0.23±0.08 2.38±0.36 4.04±0.10 0.13±0.04 0.24±0.04 1.84±0.08 2.03±0.04
Broiler 0.15±0.09 0.10±0.01 1.54±0.36 0.93±0.04 ND 0.10±0.03 0.63±0.04 0.54±0.04
Table 6.12 Aflatoxin residues in the muscle
Bird 8th Day 11th Day
Aflatoxin B1 (ppb) Oxidative Aflatoxin B1
Metabolites (ppb)Aflatoxin B1 (ppb) Oxidative Aflatoxin B1
Metabolites (ppb)
Free Conjugated Free Conjugated Free Conjugated Free Conjugated
Quail 0.38±0.03 ND 0.82±0.05 0.32±0.08 0.13±0.04 ND 0.41±0.17 0.24±0.09
Duck ND ND 0.21±0.09 0.14±0.05 ND ND ND ND
Hen ND ND 0.14±0.04 0.11±0.04 ND ND 0.11±0.05 0.08±0.06
Broiler ND ND 0.11±0.02 0.08±0.05 ND ND 0.05±0.02 0.02±0.01
The tissue levels of aflatoxins B1 and its metabolites were higher in quail than other birds. The levels of aflatoxins B1 and its metabolites, including acid-hydrolysable metabolites, were more than 10-fold higher in the liver than in the muscles in all species. The ratio of aflatoxins B 1 in the feed to the residues level in the liver was 383 in quail, but was ≥ 5769 in the other birds. The levels of aflatoxins B1 and metabolites declined after withdrawal of the contaminated diet (Bintvihok et al., 2002).
Exposure Assessment
Analysis of Australian and New Zealand commodities have indicated that significant levels of aflatoxins are almost entirely confined to peanuts and nut products (ANZFA, 1999a). Aflatoxin levels recorded in the literature as residues in poultry liver (in the order of 10 g/kg) and poultry muscle (in the order of 1 g/kg) are 4 to 5 orders of magnitude lower than observed in some nut products in Australia.
Risk Characterisation
Aflatoxins are regarded as human carcinogens the intake of which should be reduced to levels as low as reasonably achievable. Secondary exposure to aflatoxins through consumption of poultry meat products derived from poultry fed aflatoxin-containing feed, presents a negligible risk to the consumer.
6.3.12 Ochratoxin A
Ochratoxins of which ochratoxin A is the most prevalent, are secondary fungal metabolites of some toxigenic species of Aspergillus or Penicillium. Ochratoxin A consists of a chlorinated dihydroisocoumarin moiety linked through a 7-carboxyl group by an amide bond to one molecule of L--phenylalanine (Bakker and Pieters, 2002). The chemical structure of ochratoxin A is given in Figure 6.6.
179

Figure 6.6 Chemical structure of Ochratoxin A
Hazard Identification and Characterisation
Ochratoxin A is slowly absorbed from the gastrointestinal tract. It is distributed in a number of species via the blood, mainly to the kidneys, with lower concentrations found in liver, muscle and fat. The major metabolite of ochratoxin A in all species examined is ochratoxin alpha. Ochratoxin alpha and other minor metabolites that have been identified are all reported to be less toxic than ochratoxin A.
Ochratoxin A have been shown to be nephrotoxic in all mammalian species tested. The main target is the renal proximal tubule, where it exerts cytotoxic and carcinogenic effects. Significant sex and species differences in sensitivity to nephrotoxicity were evident, in the order pig>rat>mouse. Carcinogenesis was observed at doses higher than those that caused nephrotoxicity in rodents.
IARC has classified Ochratoxin A into group 2B (possibly carcinogenic to humans – sufficient evidence in animals, and inadequate data in humans) (IARC, 1993c).
JECFA recently reviewed Ochratoxin A and retained the previously established PTWI of 100 ng/kg bw per week pending results of on-going studies on the mechanisms of nephrotoxicity and carcinogenicity. JECFA concluded that the new data raised further questions about the mechanisms by which ochratoxin A causes nephrotoxicity and renal carcinogenicity and the interdependence of these effects. In reaching this conclusion, JECFA noted the large safety factor applied to the NOEL for nephrotoxicity in deriving the PTWI, which corresponds to a factor of 1500 applied to the NOEL for carcinogenicity in male rats, the most sensitive species and sex for this end-point (WHO, 2001d).
Residues in poultry
There are limited studies on the presence of ochratoxin A residues in non-ruminant food animals. Residues have been identified in the muscle of hens and chickens, but not in the eggs (IPSC, 1979). Investigations on chickens condemned by meat inspectors because of renal lesions, 4 out of 14 birds were found to have neuropathy associated with the ingestion of ochratoxin A, as revealed by the presence of ochratoxin A in tissues. The renal lesions were characterised by degeneration of proximal and distal tubules of both reptilian and mammalian nephrons and interstitial fibrosis. Ochratoxin A levels of up to 29 g/kg were found in the muscle tissue of the hens and chickens (Elling et al., 1975).
In another study, groups of hens were exposed for 1-2 years to dietary levels of ochratoxin A of 0.3 or 1 mg/kg. The kidneys contained the highest residues with a mean value of 19 g/kg tissue in the group fed 1 mg/kg ochratoxin A; the liver and muscle contained lower levels of residues and no ochratoxin A was found in the eggs (Krogh et al., 1976).
Exposure Assessment
FSANZ does not have data regarding the exposure of the Australian population to ochratoxin A. Survey results used as the basis for an assessment of intake at the international level indicate that ochratoxin A contamination of poultry was low (0.041 g/kg) (WHO, 2001d).
180

Risk Characterisation
Ochratoxin A has been shown to be nephrotoxic in all mammalian species tested (Bakker and Pieters, 2002). JECFA established a PTWI of 100 ng/kg bw per week pending results of on-going studies on the mechanisms of nephrotoxicity and carcinogenicity. Using international exposure assessment food products such as poultry contribute <1 ng/kg bw per week (WHO, 2001d). Secondary exposure to ochratoxin A through consumption of poultry meat products derived from poultry fed ochratoxin A-containing feed, presents a negligible risk to the consumer.
6.3.13 Trichothecene toxins
Trichothecene mycotoxins are produced by several field fungi, including Fusarium graminearum and Fusarium culmorum, and are common in cereals and grains, particularly in wheat, barley and maize. Co-occurrence with other Fusarium toxins, including zearalenone as well as well as the group of fumonisins, is regularly observed. Most reports describe type A: T-2 and HT-2 toxin; type B: DON and NIV, trichothecenes and will be the focus of this review. The chemical structures of the trichothecene mycotoxins T-2, HT-2, DON and NIV are given in Figure 6.7.
Figure 6.7 Trichothecene toxins, T-2, HT-2, DON and NIV
Hazard Identification and Characterisation
Among the naturally occurring trichothecenes in foods, T-2 toxin is the most potent, followed by NIV; DON was the least toxic in acute toxicity studies. In experimental animals, T-2 toxin produce acute systematic effects, with necrosis of epithelial tissues and suppression of haematopoiesis. In contemporary outbreaks of disease, only gastrointestinal symptoms have been reported (IPSC, 1990).
Reported cases of human disease associated with trichothecene exposure are limited in number and information. Symptoms of digestive disorders and throat irritation develop rapidly after ingestion of food contaminated with trichothecenes. At present, there is no evidence of human cancer cause by trichothecenes (IPSC, 1990).
In an epidemiological study, reporting human food poisoning caused by infected wheat in India in 1989 which affected an estimated 50 000 people, a NOAEL of 0.44 g/kg bw was estimated.
181

The symptoms described include abdominal pain or a feeling of fullness in the abdomen, dizziness, headache, throat irritation, nausea, vomiting, diarrhoea, and blood in the stool. However, samples were collected four months after the outbreak, and the exposure was not limited to DON but included other toxins which leads to gross uncertainties in the estimated NOAEL (SCF, 1999).
Although T-2 toxin, HT-2 toxin, deoxynivalenol and nivalenol appear to cause similar effects at the biochemical and cellular level and there are similarities in toxic effects, there are also substantial differences in the spectrum of toxic effects in vitro. Large, non-systematic potency differences between these toxins were seen when different endpoints are considered. There are very few studies addressing the combined effects of these toxins. Moreover, in most of these case studies naturally contaminated feed was used which makes the attribution of a potential effect to a single toxin very difficult (SCF, 2002b).
The EU Scientific Committee on Food (SCF) has assigned temporary daily intakes (TDIs) to DON, nivalenol, T-2 toxin and HT-2 toxin pending among other things, a group evaluation. The TDIs for nivalenol and T-2 toxin were also made temporary because of gaps in the database. Therefore the Committee established a full TDI for DON (TDI = 1 g/kg bw/day) only and confirmed the t-TDI for nivalenol (t-TDI = 0.7 g/kg bw/day) and the combined t-TDI for T-2 toxin and HT-2 toxin (t-TDI = 0.06 g/kg bw/day) (SCF, 2002b).
Residues in poultry
T-2
Several studies have investigated the absorption and tissue distribution of T-2 toxin in poultry (IPSC, 1990). Distribution of T-2 in poultry was investigated in 6-week-old broiler chicks fed with a ration containing T-2 toxin at 2 mg/kg for 5 weeks and then intubated with a single dose of 3H-T-2 at 0.5 mg/kg body weight, the radioactivity reached a maximum concentration in most tissues, 4h after dosing; exceptions were the muscle, skin and bile, in which the maximum level was reached after 12h. After 48h, chicks contained the equivalent of 39 mg T-2 toxin and or its metabolites per kg in the muscle, and 40 mg/kg in the liver, as calculated on the basis of the specific activity of the radiolabelled T-2 toxin administered (Chi et al., 1978).
In chick organs, 18h after intraperitoneal injection of T-2 toxin (3.5 mg/kg), considerable amounts of T-2 metabolites were found in the liver (1370 mg 3’-Hydroxy-HT-2 toxin/kg). Smaller amounts of HT-2 toxin, T-2 triol and other metabolites were detected in the lungs (Visconti and Mirocha, 1985).
An experimentally derived relationship, determined 12 h after dosing, have been calculated on residue of 3H-T-2 radioactivity in animal tissues or plasma and the toxin levels in feed in cows, pigs and poultry. Poultry were intubated with a single dose of 3H-T-2 toxin at three doses levels (1.26, 5.0 and 18.95 mg/kg in the feed) based on consumption of 100g feed daily. The results relevant to poultry are summarized in the Table 6.12 (Yoshizawa et al., 1981).
Table 6.12 The relationship between the level of 3HT-2 toxin and tritium residues in plasma and edible tissues of poultry
Tissue Feed level (mg/kg) Tissue level (g/kg) Tissue/feed ratio Tissue/plasma ratio
Muscle 1.26 17.3 0.0137 1.000
5.0 59.2 0.0118 0.938
18.95 228.6 0.0121 0.875
Heart 1.26 13.7 0.011 0.792
5.0 49.4 0.010 0.783
18.95 207.7 0.011 0.795
Liver 1.26 34.0 0.0270 1.965
182

Tissue Feed level (mg/kg) Tissue level (g/kg) Tissue/feed ratio Tissue/plasma ratio
5.0 107 0.0215 1.700
18.95 431.0 0.0227 1.649
Data derived from the distribution of 3H T-2 toxin in poultry, indicate that T-2 residues in poultry tissues are approximately 50 to 100 fold lower than present in the feed.
DON
Transmission of DON to poultry tissues is limited. In poultry, residues of DON (detection limit 10 ng/g), have neither been found in tissue from chickens fed either 4 ppm for 28 days, 9 or 18 ppm for 35 days, and 83 ppm for 27 days, nor in the eggs from laying hens fed 5 ppm for 190, 18 ppm for 28 days, and 83 ppm for 27 days, respectively (El-Banna et al., 1983; Kubena et al., 1985; Kubena et al., 1987; Lun et al., 1986). A residual amount of 20 ng/g was, however found in the gizzard from laying hens fed 83 mg DON per kg feed for 182 days (Lun et al., 1986). The chemical nature of the residue remains unknown.
The toxicokinetics of DON in poultry has been studied in hens given a single dose (2.2 mg per animal) of radio-labelled 14C-DON. DON was found to be poorly absorbed, as peak plasma levels at 2-2.5 hours accounted for less than 1% of the administered dose. Maximum tissue levels were measured at 3 hours in liver, kidney, heart, spleen and gizzard, while for muscle and fat the maximum radioactivity was measured after 6 hours. Clearance of radioactivity from tissue had an average half-life of 16.83±8.2 hours (range 7.7-33.3 hours depending on the tissue). Elimination of the radio-labelled toxin into excreta occurred rapidly and recovered radioactivity accounted for 78.6, 92.1 and 98.5% of the dose after 24, 48 and 72 hours respectively (Prelusky et al., 1986).
Concentration of DON and its de-epoxidised metabolite in plasma and bile of Pekin ducks exposed to diets containing up to 6-7 mg DON/kg diet were lower than the detection limit of 6 ng/mL and 16 ng/mL, respectively of the applied HPLC-method (Dänicke et al., 2004).
Exposure Assessment
FSANZ does not have data regarding the exposure of the Australian population to trichothecene toxins. Human exposure to the trichothecene toxins occurs predominantly via ingestion of cereals and grains, and therefore animal products do not significantly contribute to this exposure.
Risk Characterisation
On the basis of the data available, there is a possible association between trichothecene exposure through food and episodes of human disease expressed as gastrointestinal symptoms. Secondary exposure to trichothecene toxins through consumption of poultry meat products derived from poultry fed trichothecene-containing feed, however presents a negligible risk to the consumer.
6.3.14 Zearalenone
Zearalenone is a nonsteroidal estrogenic mycotoxin (SCF, 2000) that can be produced by several field fungi including Fusarium graminearum (Gibberella zeae), F. culmorum, F. cerealis, F. equiseti and F. semitectum. The main metabolites of zearalenone are -and -zearalenol and the glucuronide conjugates of both the parent compound and its metabolites (WHO, 2000b). The chemical structures of the zearalenone (ZEA) and -and -zearalenol (ZOL) are given in Figure 6.8.
-Zearalenol has been previously assessed by JECFA as a veterinary medicine (WHO, 1988).
183

Figure 6.8 Chemical structures of zearalenone and primary metabolites
Hazard Identification and Characterisation
Zearalenone causes alterations in the reproductive tract of laboratory animals and domestic animals. Various estrogenic effects like decreased fertility, increased embryolethal resorptions, reduced litter size, changed weight of adrenal, thyroid and pituitary glands and change in serum levels of progesterone and estradiol have been observed but no teratogenic effects were found in mice, rats, guinea pigs and rabbits (Kuiper-Goodman et al., 1987; WHO, 2000b). Pigs and sheep appear to be more sensitive than rodents (SCF, 2000).
In humans, zearalenone has been measured in endometrial tissue from 49 women and found at a concentration of 48 ± 6.5 ng/ml tissue from 27 women with endometrial adenocarcinoma, at 170 ± 18 ng/ml in tissue from 11 women with endometrial hyperplasia, and at concentrations below the limit of detection in tissue from 11 women with normal proliferative endometrium. Zearalenone was not detected in eight samples of hyperplastic and five samples of neoplastic endometrial tissue (Tomaszewski et al., 1998).
Zearalenone or zearalenol was suspected to be the causative agent in an epidemic of premature thelarche (premature sexual development) in girls aged six months to eight years which occurred in Puerto Rico between 1978 and 1981, as these compounds were detected in blood plasma. The authors reported that homogenates of locally produced meat gave strong responses in a cytosol receptor assay with rat uterus, indicating the presence of substances that bind to estrogen receptors, although the United States Food and Drug Administration later failed to detect any of the estrogen growth promoters used in food. The involvement of natural sources of estrogenic compounds, such as some plant metabolites and mycotoxins, has not been ruled out (SCF, 2000). A statistically significant correlation was found between the pubertal changes and the consumption of meat products and soya-based formula, but the association explained only 50% of the investigated cases, and the authors suggested better diagnosis and reporting or some unsuspected factor accounted for the reported increase in precocious pubertal changes (Freni-Titulaer et al., 1986).
JECFA concluded that the safety of zearalenone could be evaluated on the basis of the dose that had no hormonal effects in pigs, the most sensitive species. JECFA established a provisional maximum tolerable daily intake (PMTDI) for zearalenone of 0.5 g/kg bw. This decision was based on the NOEL of 40 g/kg bw/day obtained in a 15-day study in pigs (WHO, 2000b). The Committee also took into account the lowest observed effect level of 200 g/kg bw/day in this pig study and the previously established ADI of 0-0.5 g/kg bw for the metabolite -zearalenol, evaluate as a veterinary drug (WHO, 1988). The Committee recommended that the total intake of zearalenone and its metabolite (including -zearalenol) should not exceed this value (WHO, 2000b).
184

Residues in poultry
Although only few analyses have been performed on residues of zearalenone in animal derived products, the available information indicates rapid metabolism and excretion of zearalenone. Summaries of studies investigating zearalenone in poultry tissue are presented in Table 6.14.
Table 6.14 Carry–over of zearalenone into poultry tissues
Species ZEA-dosage (mg/kg diet)
Duration
(days)
ZEA and metabolites in tissue and foodstuffs (g/kg)
Remarks Reference
Broiler 3H-ZEA: 5 mg/kg bw (appr. 50 mg/kg diet)
Single bolus
Liver: Σ ZEA, - and -ZOL: 17-2540; rapid clearance.
Muscle: ZEA max. 111 (no ZOL)
Conjugates not-detected. (Mirocha et al., 1982)
Laying hen
14C-ZEA: 10 mg/kg bw
Single bolus
Tissue: very low radioactivity 94% radioactivity excreted after 72h
(Dailey et al., 1980)
Laying hen
1.1 112 Liver:a-ZOL 3.5-3.8 (36% free, 28% conjugated with glucuronic acid, and 36% with sulphate); ZEA < 1-3.3 (46% free, 54% conjugated with glucuronic acid and < 5% with sulphate); no residues in yolk, albumen, breast muscle, abdominal fat, ovary and follicles.
(Dänicke et al., 2002)
Chicken 10 mg/kg bw
20 Liver: ZEA 207; Kidney: ZEA 416; Muscle: ZEA 170
Metabolites and conjugates not-detected.
(Maryamma et al., 1992)
Turkey 800 14 Liver: ZEA 2802); -ZOL 27202)
Kidney: ZEA 1202); -ZOL 4802)
-ZOL traces in liver and kidney
(Olsen et al., 1986)
Peking duck
Up to 0.06 49 Liver2): ZEA, - and -ZOL <detection limit.
Dose-response related increase in ZEA, and -ZOL concentration in bile; mean proportions of ZEA, -ZOL and -ZOL of the sum of all three metabolites were 80%, 16% and 4% respectively
(Dänicke et al., 2004)
Exposure Assessment
Estimated average dietary intakes of zearalenone based on individual diet records have been presented by FAO, indicating an exposure of 0.03 to 0.06 g/kg bw/day, thus remaining below the PMTDI of 0.5 g/kg bw/day set by JECFA (WHO, 2000b). Data from the EU SCOOP taskforce showed that the mean intake of zearalenone, estimated from various European countries, might range from 1 ng/kg bw to 420 ng/kg bw/day. Bread and other cereal products were the most prominent sources of exposure (EFSA, 2004c).
Thus although only few analyses have been performed on residues of zearalenone in animal derived products, the available information indicated that due to rapid metabolism and excretion of zearalenone, the contribution of products from animal origin, including poultry, to dietary exposure of zearalenone is very limited (EFSA 2004c).
Risk Characterisation
Zearalenone is a non-steroidal estrogenic mycotoxin implicated in numerous mycotoxicoses in farm animals, especially pigs. Estimated average dietary exposure internationally is below the PMTDI of 0.5 g/kg bw/day set by JECFA (WHO, 2000b). Secondary exposure to zearalenone through consumption of poultry meat products derived from poultry fed zearalenone-containing feed, presents a negligible risk to the consumer.
185

6.3.15 Fumonisin
Fumonisins are mycotoxins produced by fungi of the genus Fusarium that commonly contaminate maize. Fumonisin B1 contamination of maize has been reported worldwide at mg/kg levels. Fumonisin B1 is the diester of propane-1,2,3-tricarboxylic acid and 2S-amino-12S, 16R-diemthyl-3S, 5R, 10R, 14S, 15R-pentahydroxyeicosane in which the C-14 and C-15 hydroxy groups are esterified with terminal carboxyl group of propane-1,2,3-tricarboxylic acid (WHO, 2001c). The chemical structures of fumonisin B1 and closely related chemical substances fumonisin B2, fumonisin B3, and fumonisin B4
are given in Figure 6.9.
Figure 6.9 Chemical structures of fumonisins
Hazard Identification and Characterisation
In all species studied, fumonisins are poorly absorbed from the digestive tract and are rapidly distributed and eliminated. The liver and kidney retain most of the absorbed material, and fumonisin B1 persists longer in rat liver and kidney than in plasma. In pregnant rats and rabbits, very low concentrations of fumonisin B1 were recovered in the uterus and placenta. No fumonisin B1 was found in the foetuses, indicating an absence of placental transfer. There was little evidence of significant transfer during lactation, and fumonisins do not appear to be metabolised in vitro or in vivo (WHO, 2001c).
In all animal species studied, the liver was a target for fumonisin B1; the kidney was also a target in many species. In kidney, the early effects are often increases in sphingoid bases, renal tubule-cell apoptosis, and cell regeneration. In liver, apoptotic and oncotic necrosis, oval-cell proliferation, bile-duct hyperplasia, and regeneration are early signs of toxicity (WHO, 2001c).
A specific role for fumonisins in the development of neural tube defects has been proposed. The hypothesis includes a critical role of fumonisins in disruptions of folate membrane transport, but no specific studies have been designed to confirm this mechanism (WHO, 2001c).
The IARC has classified fumonisin B1 into group 2B (possibly carcinogenic to humans – sufficient evidence in animals, and inadequate data in humans) (IARC, 2002b).
Nephrotoxicity, which was observed in several strains of rats, was the most sensitive toxic effect of pure fumonisin B1. Since the available studies clearly indicate that long-term renal toxicity is a prerequisite for renal carcinogenesis, the potential for the latter is subsumed by the dose-response relationship for renal toxicity. Therefore, the pivotal studies that could serve as the basis for a tolerable intake of fumonisin B1 were the short-term and long-term studies of toxicity in rodents. On the basis of these studies, the overall NOEL for renal toxicity was 0.2 mg/kg bw/day (WHO, 2001c).
JECFA allocated a group provisional maximum tolerable daily intake (PMTDI) for fumonisins B 1, B2, and B3, alone or in combination, of 2 g/kg bw/day on the basis of the NOEL of 0.2 mg/kg bw/day in rats and a safety factor of 100 (WHO, 2001c).
186

Residues in poultry
Fumonisin B1 levels in animal feedstuff can be exceptionally high, and reached maximum values of 330, 70, 38, 9 and 2 mg/kg in North America (USA), Europe (Italy), Latin America (Brazil), Africa (South Africa) and Asia (Thailand), respectively (IPSC, 2000). Only few analyses have been performed on carry-over residues of fumonisins in animal derived products. The available information indicates that fumonisins are poorly absorbed in the laying hen with accumulation of 14C-labelled compounds in tissues estimated to be less than 1% of the dose (Vudathala et al., 1994).
Exposure Assessment
Maize is the only commodity that contains significant amount of fumonisins (IPSC, 2000). Estimated mean dietary intakes of fumonisin B1 based on regional diets and published distributions of concentrations of fumonisin B1 in maize, indicating a mean intake of fumonisin B1 ranging from 0.2 g/kg bw/day in European-type diet to 2.4 g/kg bw/day in the African diet (WHO, 2001c).
Fumonisin B1 is not well absorbed by poultry and should not contribute significantly to human dietary exposure.
Risk Characterisation
Fumonisin B1 is carcinogenic in mice and rats and induces fatal diseases in pigs and horses at levels of exposure that humans encounter. Fumonisin B1 has been associated with sporadic gastrointestinal disorders in humans. Secondary exposure to fumonisin B1 through consumption of poultry meat products derived from poultry fed fumonisin B1-containing feed, presents a negligible risk to the consumer.
6.4 Chemicals used in further processing of poultry meat
Further processing of poultry meat products can range from the minimal cutting and portioning of the carcass through to the shaping, forming, emulsifying, marinating, coating, various methods of cooking and smoking, chilling and freezing systems and packaging of highly transformed poultry meat products. Further processed food products can utilise a range of chemicals such as food additives, processing aids and packaging options to create niche market products. The Standards applicable to the regulation of chemical used in further processed poultry meat products include;
Standard 1.3.1 – Food Additives
Standard 1.3.3 – Processing Aids
Standard 1.3.4 – Identity and Purity
Standard 1.4.3 – Articles and Materials in Contact with Food
6.4.1 Food Additives
Food additives are commonly used in the coating of poultry products. The coatings can vary from minimal seasoning with salt and pepper, through sophisticated sauces to completely battered and breaded (enrobed) products. Coating is often used as a basic preparation technique to add flavour, seal the product so that moisture and juiciness are retained during cooking, and improve product appearance. It is often associated with specific dishes. Coatings are also important in further processing to increase cooked-product yield, both by helping to retain moisture and by the added weight of the coating material itself (Fletcher, 2004).
187

FSANZ regulates food additives through Standard 1.3.1 – Food Additives. A food additive is any substance not normally consumed as a food in itself and not normally used as an ingredient of food, but which is intentionally added to food to achieve one or more of the technological functions specified in Table 6.15. It or its by products may remain in the food.
Food additives should always be used in accordance with GMP. As a guide to assist manufacturers in compliance with this provision, the standard cites the Codex Alimentarius Commission Procedural Manual (CODEX, 1999), which sets out the following relevant criteria for use in assessing compliance with GMP:
the quantity of additive added to food shall be limited to the lowest possible level necessary to accomplish its desired effect;
the quantity of the additive that becomes a component of food as a result of its use in the manufacture, processing or packaging of a food and which is not intended to accomplish any physical, or other technical effect in the finished food itself, is reduced to the extent reasonably possible; and,
the additive is prepared and handled in the same way as a food ingredient.
Substances added to food in accordance with the Code must also meet appropriate specification for identity and purity. Standard 1.3.4 – Purity and Identity – details the specifications for permitted food additives. A substance must comply with a reference in;
(a) Food and Nutrition Paper 52 Compendium of Food Additive Specifications Volumes 1 and 2, including addenda 1 to 9, published by the Food and Agriculture Organisation of the United Nations in Rome (1992); or
(b) the fourth edition of the Food Chemicals Codex published by the National Academy of Sciences and the National Research Council of the United States of America in Washington, D.C. (1996), including supplements published to take effect on 1 December 1997, 31 March 2000 and 31 December 2001; or
(c) the Schedule to this Standard.
If no relevant specifications exists in one of these documents, a secondary tier of reference documents comprising other recognised national standards or pharmacopoeia.
Table 6.15 Technological functions which may be performed by food additives
Functional classsub-classes
Definition
Acidity regulator acid, alkali, base, buffer, buffering agent, pH adjusting agent
alters or controls the acidity or alkalinity of a food
Anti-caking agentanti-caking agent, anti-stick agent, drying agent, dusting powder
reduces the tendency of individual food particles to adhere or improves flow characteristics
Antioxidantantioxidant, antioxidant synergist
retards or prevents the oxidative deterioration of a food
Bulking agentbulking agent, filler
contributes to the volume of a food without contributing significantly to its available energy
Colouring adds or restores colour to foods
188

Functional classsub-classes
Definition
Colour fixativecolour fixative, colour stabiliser
stabilises, retains or intensifies an existing colour of a food
Emulsifieremulsifier, emulsifying salt, plasticiser, dispersing agent, surface active agent, surfactant, wetting agent
facilitates the formation or maintenance of an emulsion between two or more immiscible phases
Firming agent contributes to firmness of food or interact with gelling agents to produce or strengthen a gel
Flavour enhancer flavour enhancer, flavour modifier, tenderiser
enhances the existing taste and/or odour of a food
Flavouring(excluding herbs and spices and intense sweeteners)
intense preparations which are added to foods to impart taste and/or odour, which are used in small amounts and are not intended to be consumed alone, but do not include herbs, spices and substances which have an exclusively sweet, sour or salt taste.
Foaming agentWhipping agent, aerating agent
facilitates the formation of a homogeneous dispersion of a gaseous phase in a liquid or solid food
Gelling agent modifies food texture through gel formation
Glazing agentcoating, sealing agent, polish
imparts a coating to the external surface of a food
Humectant moisture/water retention agent, wetting agent
retards moisture loss from food or promotes the dissolution of a solid in an aqueous medium
Intense sweetener replaces the sweetness normally provided by sugars in foods without contributing significantly to their available energy
Preservativeanti-microbial preservative, anti-mycotic agent, bacteriophage control agent, chemosterilant, disinfection agent
retards or prevents the deterioration of a food by micro organisms
Propellant gas, other than air, which expels a food from a container
Raising agent liberates gas and thereby increase the volume of a food
Sequestrant forms chemical complexes with metallic ions
Stabiliserbinder, firming agent, water binding agent, foam stabiliser
maintains the homogeneous dispersion of two or more immiscible substances in a food
Thickenerthickening agent, texturiser, bodying agent
increases the viscosity of a food
A review of the technological functions regulated in Standard 1.3.1 indicates some functional classes, such as propellants, intense sweeteners and raising agents are unlikely to be relevant to poultry meat products. The Standard, through Schedule 1, have specified permitted uses of food additives by food type for meat and meat type products (Table 6.16). The permissions for meat and meat type products relate mainly to preservative and colouring functions. Permission classes denoted by an asterisk (*) indicate that additives in Schedule 2, 3 and 4 of the Standard are expressly permitted. Specific permission is given for sodium acetate in fresh poultry products.
Table 6.16 Permitted use of food additives by food type
INS Number Additive Name Max
Permitted
Level
Qualifications
8 MEAT AND MEAT PRODUCTS (including poultry and game)
8.1 Raw meat, poultry and game
Additives in Schedules 2,3 & 4 must not be added to raw meat, poultry and game
189

unless expressly permitted below
fresh poultry
262 Sodium acetates 5000 mg/kg
8.2 Processed meat, poultry and game products in whole cuts or pieces*
commercially sterile canned cured meat
249 250 Nitrites (potassium and sodium salts) 50 mg/kg
cured meat total of nitrates and nitrites, calculated as
249 250 Nitrites (potassium and sodium salts) 125 mg/kg sodium nitrite
dried meat
200 201 202 203 Sorbic acid and sodium, potassium and calcium sorbates
1500 mg/kg
249 250 Nitrites (potassium and sodium salts) 125 mg/kg total of nitrates and nitrites, calculated as sodium nitrite
slow dried cured meat
249 250 Nitrites (potassium and sodium salts) 125 mg/kg total of nitrates and nitrites, calculated as
251 252 Nitrates (potassium and sodium salts) 500 mg/kg sodium nitrite
8.3 Processed comminuted meat, poultry and game products*
160b Annatto extracts 100 mg/kg
220 221 222 223 224 225 228
Sulphur dioxide and sodium and potassium sulphites
500 mg/kg
249 250 Nitrites (potassium and sodium salts) 125 mg/kg total of nitrates and nitrites, calculated as sodium nitrite
fermented, uncooked processed comminuted meat products
200 201 202 203 Sorbic acid and sodium, potassium and calcium sorbates
1500 mg/kg
235 Pimaricin (natamycin) 1.2 mg/dm2
when determined in a surface sample taken to a depth of not less than 3 mm and not more than 5 mm including the casing, applied to the surface of food.
251 252 Nitrates (potassium and sodium salts) 500 mg/kg total of nitrates and nitrites, calculated as sodium nitrite
sausage and sausage meat containing raw, unprocessed meat
Additives must not be added to sausage and sausage meat containing raw, unprocessed meat, unless expressly permitted below
- Additives in Schedule 2
220 221 222 223 224 225 228
Sulphur dioxide and sodium and potassium sulphites
500 mg/kg
8.4 Edible casings*
200 201 202 203 Sorbic acid and sodium, potassium and calcium sorbates
100 mg/kg
220 221 222 223 224 225 228
Sulphur dioxide and sodium and potassium sulphites
500 mg/kg
8.5 Animal protein products*
Exposure Assessment
The 21st Australian Total Diet Survey analysed sulphites, nitrites, nitrates, benzoates and sorbates, mainly in processed food. Poultry meat products were not analysed.
190

Risk characterisation
There has been little monitoring of food additives in poultry meat products. There is occasional evidence of non-compliance in the use of food additives such as sulphites in meat and meat products locally. These events usually occur in red meat products, primarily to maintain colour and as such poultry does not typically lend itself to be a vehicle for such abuses.
Experience has demonstrated that although occasional problems may arise through the use of food additives in the manufacture of food, in most cases, the incidents are sporadic and involve the use of non-permitted additives or excessive levels of permitted ones. Exposure mapping in meat and meat products indicates that poultry meat products are unlikely to be a significant risk to the community as a result of the use of food additives.
6.4.2 Processing aids
Substances can be used in the processing of foods to fulfil a technological purpose relating to a treatment or process, but do not perform a technological function in the final food. For the purposes of the Code these substances are known as processing aids. Examples relevant to poultry meat products include the use of chlorine in counter current chillers, waxes used in the de-feathering process associated with waterfowl or enzymes used in the formation of manufactured meat products.
Processing aids are regulated through Standard 1.3.3 – Processing Aids. For the purposes of the Standard a processing aid is a substance used:
in the processing of raw materials, foods or ingredients, to fulfil a technological purpose relating to treatment or processing, but does not perform a technological function in the final food; and
in the course of manufacture of a food at the lowest level necessary to achieve a function in the processing of that food, irrespective of any maximum permitted level specified.
Unless expressly permitted in this Standard, processing aids must not be added to food.
Similarly to food additives, the quality of processing aids is regulated through provisions in Standard 1.3.4 – Purity and Identity. Chemicals used as processing aids listed in the Standard 1.3.3 – Processing Aids - are grouped by functional classes. Permitted usage by functional classes include:
Generally permitted processing aids;
Antifoaming agents;
Catalysts;
Decolourants, clarifying and filtration agents;
Desiccating preparations;
Ion exchange resins;
Lubricants, release and anti-stick agents;
Carriers, solvents and diluents;
Processing aids permitted in packaged water used as an ingredient in other foods;
Bleaching agents, washing and peeling agents;
191

Extraction solvents;
Processing aids with miscellaneous functions;
Enzymes of animal origin;
Enzymes of plant origin;
Enzymes of microbial origin; and,
Microbial nutrients and microbial nutrient adjuncts.
The Processing Aid Standard is currently under review (Proposal P276 Review of Enzyme Processing Aids and Proposal P277 – Review of Processing Aids (other than enzymes). The review will address the following:
safety of currently permitted processing aids;
removing any obsolete processing aids; and
correct errors, remove anomalies and improve consistencies within the Code.
It is not anticipated that the structure of Standard 1.3.3 – Processing Aids - will be changed.
The review of Standard 1.3.3 might result in some changes which could be relevant for the Poultry Meat Standard, but is not expected to have a major impact.
6.4.3 Chemicals derived from Packaging
One of the most important factors contributing to the increased consumption of poultry are the advances that have been made in packaging. Poultry was the first large-scale meat commodity to be pre-packaged. The types and forms of materials used in poultry meat products include fibre-based (paper, paperboard), glass, metal as well as plastic materials used as coatings, linings over-wraps or bags.
The packaging relevant to this report includes the food-contact surface that will carry labelling and any additional consumer information. A common primary packaging material is a polymer (plastic) film wrap.
FSANZ regulates food contact uses of primary packaging materials through Standard 1.4.3 – Articles and Materials in Contact with Food. The Standard regulates food contact materials in general terms. The Standard does not specify individual packaging materials for food contact or how they are produced or used. With respect to plastic packing products, the standard refers to the Australian Standard for Plastic Materials for Food Contact Use, AS 2070-1999. This reference provides a guide to industry about the production of plastic materials for food contact use. AS 2070, in turn, refers to regulations of the United States of America (USA) and European Economic Community (EEC) directives relevant to the manufacture and use of plastics.
Where a public health and safety concern is identified, maximum levels may be established in Standard 1.4.1 – Contaminants and Natural Toxicants. Examples include the maximum levels set for tin (all canned food), acrylonitrile and vinyl chloride (all food) in association with packaging materials.
Internationally a number of issues relating to the safety of packaging materials have been identified;
192

Migration testing for specific chemicals from packaging into food;
Future regulation of active and intelligent packaging;
Concerns over the effects of processing foods in packaging by irradiation and in microwave ovens; and
Use of recycled materials in packaging.
Currently AS 2070 prohibits the use of recycled plastic materials in plastic materials for food contact use.
6.5 Overall conclusions
Regulations that control the use of chemicals in food and protect public health and safety are outlined in the general standards applicable to all food in Chapter 1 of the Australia New Zealand Food Standards Code. As previously discussed, there are six Standards in Chapter 1 of the Code that regulate chemical inputs that are relevant to poultry meat products.
Given the data available for this review of chemical hazards in poultry, the current regulatory measures outlined in the Code adequately protect public health and safety with respect to chemical hazards in poultry meat products in Australia. Data gaps relevant to the review of chemical hazards in poultry are identified below.
Agricultural and veterinary chemicals
Standard 1.4.2 – Maximum Residue Limits of the Code lists the maximum permissible limits for agricultural and pesticide residues present in food. Contemporary survey results from the NRS and ATDS indicate that there is a high level of industry compliance associated with agricultural and veterinary chemical MRLs in poultry meat products. These results indicate that dietary exposure to agricultural and veterinary chemicals through poultry meat products presents a negligible risk to the consumer.
Notwithstanding the results, there are concerns surrounding the adequacy of the agricultural and veterinary chemical testing regime particularly relating to the NRS. In 2002-2003 the NRS tested 165 chickens out of a yearly kill in excess of 400 million. Minor species were not tested. All tests were conducted on liver samples. Only five birds were tested for anticoccidials. Of specific concern was the breach of the MRL associated with the anticoccidial lasalocid. This data indicates either there was a sporadic breach associated with the use of the anticoccidial lasalocid or alternatively high-level breaches of MRLs associated with anticoccidials.
Contaminants
As part of the review of chemical hazards in poultry meat products fifteen contaminants with the potential to contaminate poultry were reviewed. FSANZ regulates the presence of contaminants in food through Standard 1.4.2 – Contaminants and Natural Toxicants. Two of the fifteen contaminants reviewed (lead and polychlorinated biphenyls) have MLs included in the Standard. Overall, none of the contaminants investigated demonstrated an immediate public health and safety concern in relation to poultry meat products, however further investigation may be needed on the following contaminants;
Arsenic – consistent presence of arsenic residues in poultry tissue and the absence of a permission for the anticoccidial roxarsone (4-hydroxy-3-nitrophenyl arsonic acid) in the Code;
Fluoride – reported high levels of fluoride in mechanically separated poultry at levels sufficient to contribute to an increased risk of dental fluorosis when combined with other sources of fluoride;
193

Lead – reported high levels of lead in wildcrafted birds, specifically the Magpie Goose (Anseranas semipalmata) harvested in the Northern Territory by local Aboriginal peoples. The use of lead shot will be phased out by 2005 in Northern Territory wetlands.
Mercury – reported high levels of mercury in piscivorous waterfowl. There is currently an absence of data on mercury levels in mutton birds (Puffinus tenuriostris) to characterise the risk associated with consumption of this species.
The presence of dioxins and dioxin-like polychlorinated biphenyls were reviewed as part of the review of chemical hazards in poultry due to data made available through the National Dioxins Program. The NRS provided data on 15 poultry samples and FSANZ on 11 poultry breasts. The data showed the dioxin dietary contribution from poultry meat to be low.
Certain mycotoxins (aflatoxins, trichothecene toxins, zearalenone, ochratoxin A and fumonisin B1) were reviewed for their potential to contaminate poultry meat products via contaminated feeds. The data though limited consistently demonstrated low-levels of mycotoxin carry-over, insufficient to contribute substantially to total human dietary intake of these chemicals.
Food Additives
FSANZ regulates food additives through Standard 1.3.1 – Food Additives. The Standard, through Schedule 1, have specified permitted uses of food additives by food type for meat and meat type products (including poultry). The permissions for meat and meat type products relate mainly to preservative and colouring functions. There is a lack of data pertaining to the monitoring of food additives in poultry meat products, although there is no reason to suspect that the food additive permissions are being exceeded.
Processing Aids
FSANZ regulates processing aids through Standard 1.3.3 – Processing Aids. The Standard is currently under review (Proposal P276 Review of Enzyme Processing Aids and Proposal P277 – Review of Processing Aids (other than enzymes). The review will address the following:
safety of currently permitted processing aids;
removing any obsolete processing aids; and
correct errors, remove anomalies and improve consistencies within the Code.
It is not anticipated that the structure of Standard 1.3.3 – Processing Aids - will be changed.
The review of Standard 1.3.3 might result in changes which could be relevant for the Poultry Standard, and this need to be taken into consideration when the review has been finalised.
Chemical derived from Packaging
FSANZ regulates food contact uses of primary packaging materials through Standard 1.4.3 – Articles and Materials in Contact with Food. The Standard does not specify individual packaging materials for food contact or how they are produced or used. FSANZ does not directly monitor for the migration of chemicals from packaging materials into food and as such this review is unable to characterise the risk associated with packaging materials in poultry meat products.
Internationally a number of issues relating to the safety of packaging materials have been identified:
Migration testing for specific chemicals from packaging into food;
194

Future regulation of active and intelligent packaging;
Concerns over the effects of processing foods in packaging by irradiation and in microwave ovens; and
Use of recycled materials in packaging.
These issues will be considered by FSANZ in the future and may impact on poultry meat products.
Reference List7 ConclusionsThis assessment attempts to bring together available scientific and technical information on food safety hazards associated with poultry meat and poultry meat products in Australia and describes stages of production and processing that have impacts on these hazards.
Poultry, like all animals, may carry a wide range of microorganisms, some of which are potential human pathogens. The organisms that have gained most interest in relation to the public health and safety of poultry meat consumption, both domestically and internationally are Salmonella spp. and Campylobacter spp. These two organisms are the leading cause of zoonotic intestinal infections in developed countries, including Australia, and have frequently been isolated from raw poultry meat and implicated in food-borne illness (Anon, 2003). There is reasonable evidence to indicate poultry is the vehicle for a proportion of salmonellosis and campylobacter cases in Australia, however, due to a lack of quantitative data it is not possible to estimate the extent to which this is the case.
The scope of the assessment was such that the development of a “paddock to plate” quantitative risk assessment model for Campylobacter and Salmonella in poultry was not possible. In stead, published risk assessments were modified to account, where possible, for Australian practices. Little information is available in Australia on poultry species other than chicken. Total production of poultry (excluding chickens and emus) in 2001-2 was approximately 17 million birds; over the same period 428 million chickens were slaughtered for meat production. The focus of this assessment was therefore on chicken meat.
Due to a lack of quantitative data available for on-farm practices and primary processing, a qualitative assessment of these stages in the food chain was undertaken. A quantitative risk assessment was carried out for chicken meat from the end of processing to consumption, based largely on existing FAO/WHO models.
Contamination of poultry by Campylobacter and Salmonella on-farm can be thought of as a multifactorial process, however, no quantitative data are available on the likelihood of one factor over another. For this reason, it is not possible to estimate the risk associated with various factors, but highlight current knowledge on practices that impact on contamination on-farm, and identify differences between Campylobacter and Salmonella.
Due to the large uncertainty and variability associated with microbiological data across the entire model pathway, it is little value in scientific terms to present final risk estimates in this document. More relevant to this risk assessment, however, is the impact on the estimated number of salmonellosis and campylobacteriosis cases of changing various model inputs.
The most important risk factors on-farm for Salmonella contamination of poultry are: contaminated feed and water; environmental sources; and/or vertical transmission from contaminated eggs. For Campylobacter, age of the birds and environmental contamination are the most important risk factors.
The effect of processing on poultry is variable. Generally levels of Salmonella and Campylobacter decrease during processing, although the number of contaminated birds may increase. The prevalence
195
and levels of both Salmonella and Campylobacter may increase during transportation and evisceration whereas chilling (if operated effectively) usually decreases both the prevalence and levels of these organisms.
Results from the quantitative modelling indicate that for Salmonella, the factors having the greatest impact on the probability of illness are the concentration and prevalence of organisms at processing and growth during distribution and storage. Improper thawing, cross contamination from raw poultry meat to other foods and inadequate cooking also have an impact on the probability of illness.
196

For Campylobacter the factors having the greatest impact on the probability of illness are the concentration and prevalence of the organism at the end of processing and the occurrence of cross-contamination during the preparation of poultry (e.g. not washing hands after handling raw poultry, or using contaminated cutting boards to prepare other foods).
Data gaps were identified in the model for which assumptions were made include: Food handling practices Quantitative data on the numbers of bacteria on product and rate of transfer to other foods during
cross-contamination Australian studies on growth of Salmonella on chicken meat during thawing
Further information on the above would reduce the amount of uncertainty in the model risk estimate.
To enable a quantitative model to be developed from on-farm through to the end of processing, quantitative data on the prevalence and populations of Salmonella and Campylobacter on poultry at each stage of production and processing is required.
The risk of other microbial pathogens such as E. coli, S. aureus, Cl. perfringens and L. monocytogenes is significantly lower in poultry to public health and safety. Although food-borne illness has been documented for poultry contaminated with S. aureus, Cl. perfringens and L. monocytogenes, contamination usually has occurred post-processing and subsequent poor handling (i.e. time and temperature abuse) has enabled these pathogens to grow to levels sufficient to cause illness. The risk factors for these other pathogens occur primarily in the retail, foodservice/catering and home sectors rather than the production and processing environment.
Regulations that control the use of chemicals in poultry meat and protect public health and safety are outlined in the general standards applicable to all food in Chapter 1 of the Australia New Zealand Food Standards Code (the Code). Chemical hazards considered included agricultural and veterinary chemicals, contaminants, food additives, processing aids and packaging.
Given the data available for this review of chemical hazards in poultry, the current regulatory measures outlined in the Code adequately protect public health and safety with respect chemical hazards in poultry meat products in Australia. Data gaps relevant to the review of chemical hazards in poultry have been identified.
Results from the National Residue Survey and Australian Total Diet Survey indicate that there is a high level of industry compliance associated with agricultural and veterinary chemical maximum residue limits (MRLs), suggesting dietary exposure to these hazards via poultry meat products presents a negligible risk to the consumer.
Overall, none of the contaminants investigated demonstrated an immediate public health and safety concern in relation to poultry meat products, however the review identified some contaminants that may require further investigation. Of concern was the reported presence of high levels of fluoride in mechanically separated poultry meat and arsenic residue in poultry tissue and the permission for the anticoccidial roxarsone (4-hydroxy-3-nitrophenyl arsonic acid).
197

8 Glossary
Biosecurity Embodies all the cumulative measures that can or should be taken to keep disease (viruses, bacteria, fungi, protozoa, parasites), (viruses, bacteria, fungi, protozoa, parasites), from a farm and to prevent the transmission from a farm and to prevent the transmission of disease (by humans, insects, rodents, and of disease (by humans, insects, rodents, and wild birds/animals) within an infected farm wild birds/animals) within an infected farm farms to neighbouring farms.
Horizontal transmission
Microorganisms are introduced to eggs or chicks from faecal contamination, feed contamination or environmental sources
Monte Carlo simulation
Monte Carlo simulation uses pre-defined probability distributions of risk variables to perform random modeling over many "simulations".
Non-chicken species Poultry species other than chicken.
Poultry The poultry species examined in this assessment includes chicken, duck, turkey, geese and other farmed avian species used for the production of human foods, including quail, squab (pigeons), pheasants, guinea fowls, etc. Ratites such as emu and ostrich are not included, while wild-caught species such as mutton-birds, and magpie geese, are considered in situations where the carcass is dressed and processed in registered processing facilities
Poultry meat Poultry meat includes all muscular tissues, including adhering fat and skin, from poultry carcasses. Poultry meat products include edible offal and fats.
Probability distribution
A distribution (or curve) that shows all the values that the random variable can take and the likelihood that each will occur.
Vertical transmission
Microorganisms are transmitted to eggs from infected ovaries or oviduct tissues prior to shell formation (also called transovarian transmission)
198

Appendix 1. Chicken products implicated in food-borne outbreaks in Australia (1993-2001)
Year Chicken product Pathogen Cases Reference
1993 Chicken vol au vent or sauces C perfringens 53 Tenkate & Bates, 1994
1993 Cold chicken and rice salad S. aureus 33 NRVP1993 Cold chicken S. aureus 20 Kelk et al., 19941994 Cold chicken C perfringens 230 NRVP1995 Chicken, ham. salami
sandwichesViral 17 NRVP
1995 Roast chicken S. Bredney 3 NRVP1995 BBQ chicken Unknown 19 NRVP1995 Cold chicken, salad, prawn,
custardS. Bredney 14 NRVP
1995 Meat or chicken S. Bredney 157 NRVP1996 Chicken (cooked) L. monocytogenes O1 5 (1
death)Hall et al., 1996
1996 Chicken with gravy C. perfringens 32 NRVP1996 Chicken soup Viral? 67 NRVP1997 Chicken? Thai-style beef salad C. perfringens, Campylobacter 171 NRVP1997 Cold chicken pieces S. Typhimurium PT9 75 NRVP1998 Chicken nuggets S. Typhimurium PT12 18 NRVP1998 Chicken meal S. Typhimurium PT64 32 Kirk et al., 19991998 Cooked chicken S. Typhimurium PT64 46 Kirk et al., 19991998 Chicken soup Viral 13 NRVP1998 Spatchcock S. Typhimurium RDNC AO45 NRVP1999 Chicken birianyi S. aureus 35 Kirk et al., 20001999 Curried chicken C. perfringens 3 NRVP1999 Stir-fry chicken & vegetable C. perfringens 16 Kirk et al., 20001999 Chicken – Vietnamese dish Unknown >14 Anonymous 19991999 Chicken kebab S. Typhimurium 41999 Chicken or beef satay, beef dish S. Virchow PT34 32 Kirk et al., 20001999 Chicken kebabs S. Virchow PT36 var 1 38 NRVP1999 Chicken vol au vent C. perfringens >34 Kirk et al., 20002000 Chicken-a-la-king C. perfringens 56 NRVP2000 Chicken meal S. aureus 3 NRVP2000 Chicken kebabs S. Virchow PT34, Campylobacter, S.
Typhimurium PT643 Anonymous, 2000B
2000 Lemon chicken? Viral 2 NRVP2000 Chicken breasts Unknown 3 NRVP2000 Chicken Unknown 4 NRVP2001 Cajun chicken B. cereus 6 NRVP*2001 Prawn stuffed chicken breast Unknown 9 NRVP2001 Lettuce-chicken salad wrap S. Bovismorbificans 36 NRVP2001 Chicken burger Unknown 3 NRVP2001 Chicken S. Typhimurium PT 126 88 Blumer et al. 20032001 Chicken kebabs C. jejuni 3 NRVP
* NRVP = Final report of National Risk Validation Project, Food Science Australia and Minter Ellison Consuting (2002).
199
ReferencesAnonymous (1999) Outbreaks of gastrointestinal illness. Victorian Infectious Diseases Bulletin 2(2): 41-42
Anonymous (2000) Outbreaks of gastrointestinal illness. Victoria Infectious Diseases Bulletin. 2(4), p76
Blumer, C. et al., (2003) Australian’s notifiable diseases status, 2001 – Annual report of the national notifiable diseases surveillance system. Comm Dis Intell. 27:1-78
Kelk V., Boland, P., Loan, A. and Bates, J. (1994) Investigation of a food poisoning incident involving students at a university in Queensland. Comm. Dis. Intell. 18(11): 252-253
Kirk, M., Carniev J., and Tallis, G. (1999) Surveillance of notifiable infectious diseases in Victoria 1998. Communicable Diseases Section, Public health Division, Victoria Department of Human Services.
Kirk, M., Andrews, R., Carne, J., and Tallis, G. (2000) Surveillance of notifiable infectious disease in Victoria 1999. Communicable Diseases Section, Public Health Division, Victoria Department of Human Services, December
Tenkaet T. and Bates, J. (1994) Clostridium perfringens food poisoning from a wedding reception, Queensland. Communicable diseases Intelligence 18(9): 206-207
Hall, R., Shaw, D., Lim, I., Murphy, F., Davos, D., Lanser, I., Delroy, B. Tribel, I., Holland, R., and Carman, J. (1996) Cluster of listeriosis cases in South Australia. Communicable Disease Intelligence 20(21): 465.
Figure 1. Poultry associated outbreaks: 1995 – 2002 (OzFoodNet).
200
0
2
4
6
8
10
12
1995 1996 1997 1998 1999 2000 2001 2002
Year
Out
brea
ks
0
50
100
150
200
250
300
350
Cases
Outbreaks Cases
Appendix 2. Australian Poultry Industry Association data for Salmonella isolates from chicken carcasses (1994 – 2003)*.
AUSTRALIA- Total 1994 1995 1996 1997 1998
% (all samples)
% (all samples)
% (all samples)
% (all samples)
% (all samples)
Number of Samples 7,750 10,632 9,994 7,565 4,761
% +ve 27.2 22.9 22.5 19.4 24.0
Serotypes: (all – in descending order of incidence)
SofiaOther than SofiaComprising:TyphimuriumInfantisHadarOhioAnatum4,12:d-Bovis morbificansHavanaSingaporeAgonaWorthingtonChesterSeftenbergMuenchenSaint PaulWorthingtonCubanaOrion var 15+ 34+Tennessee
22.25.0
1.61.20.70.60.20.20.20.1<0.08<0.08<0.07<0.04<0.02<0.02<0.02<0.02<0.02<0.02<0.02
SofiaOther than SofiaComprising:TyphimuriumOhioHadarWorthingtonSeftenbergInfantis4,12:d-LilleSingaporeEnteritidisAnatumGroup BMuenchenMbandakaTennesseeHeidelbergBredeneyBovis MorbificansCubanaUntypable
19.03.9
1.50.60.40.40.20.20.1<0.07<0.06<0.06<0.05<0.05<0.05<0.03<0.03<0.02<0.02<0.01<0.01<0.01
SofiaOther than SofiaComprising:TyphimuriumOhioVirchowSeftenberg4,12:d-SingaporeSt PaulInfantisHadarHeidelbergWorthingtonAgonaReadingAnatumMbandakaTennesseeGroup B?MgulaniBovis morbif.MontevideoMuenchenChesterOrion
17.55.0
1.40.60.50.40.30.30.20.20.20.20.20.1<0.1<0.08<0.07<0.06<0.06<0.04<0.03<0.03<0.03<0.03<0.02
SofiaOther than SofiaComprising:TyphimuriumSingaporeSt PaulInfantis4,12:d-AgonaSeftenbergOhioHavanaVirchowReadingOrionKiambuWorthingtonHessarekMuenchenHeidelbergTennessee1 ser 1,4,5:-:-1,4,12,27:bSchwar.AnatumBirkenhead?
15.14.3
1.50.90.30.20.20.20.20.20.10.1<0.07<0.07<0.06<0.04<0.03<0.03<0.03<0.03<0.02<0.02<0.02<0.02<0.02<0.02
SofiaOther than SofiaComprising:TyphimuriumVirchowSingaporeTennesseeKiambuInfantisVirginia4,12:d-OhioMuenchenBovis morbif.AgonaSt PaulSeftenbergMbandakaWorthingtonLivingstone4,5,12:-:1,2OrionLilleHessarekHavana
16.87.2
2.51.10.80.50.40.40.30.20.20.10.1<0.09<0.09<0.07<0.05<0.05<0.05<0.05<0.05<0.03<0.03<0.03
* Data supplied to APIA by the two major poultry processing companies, with 40 carcasses sampled per processing plant per month.
201

AUSTRALIA- Total 1999 2000 2001 2002 2003
% (all samples)
% (all samples)
% (all samples)
% (all samples)
% (all samples)
Number of Samples 4,692 4,769 5,141 5,845 5,521
% +ve 24.6 28.8 29.2 20.1 14.8
Serotypes: (all – in descending order of incidence)
SofiaOther than SofiaComprising:Typhimurium4,12:d-KiambuAgonaVirchowTennesseeAnatumMuenchenZanzibarSt. PaulOhioInfantisHeidelbergSeftenbergSingaporeSubs1 rough:r:1,2LilleOnderstepoortMbandakaWorthingtonOrionCerro?
19.74.9
1.21.00.50.40.40.20.20.10.10.10.1<0.09<0.09<0.07<0.07<0.05<0.03<0.03<0.03<0.03<0.03<0.03
SofiaOther than SofiaComprising:TyphimuriumVirchow?St PaulSeftenbergKiambu4,12:d-AgonaInfantisBovis morbif.MbandakaMuenchenTennesseeWorthingtonSingaporeOhioHavana
23.15.7
2.00.60.60.50.40.30.20.20.20.20.20.2<0.07<0.07<0.03<0.03<0.03
SofiaOther than SofiaComprising:TyphimuriumVirchowBovis morbif.KiambuMbandaka?InfantisSingapore4,12:d-AgonaSt. PaulAnatumOhioSeftenbergTennesseeLilleSubsp1 rough:1,2ZanzibarOnderstepoortOrion var 15+ 34+
20.29.0
5.00.70.70.50.50.40.20.20.20.1<0.1<0.1<0.04<0.04<0.02<0.02<0.02<0.02<0.02<0.02
SofiaOther than SofiaComprising:TyphimuriumChesterSingaporeKiambuAgonaVirchowBovis morbif.MuenchenOhioSt. Paul4,12:d-AnatumInfantisZanzibarLivingstoneSeftenbergKottbusMbandaka16:1,v:MoladeTennesseeHvittingflossOrionOrion var 15+
15.44.7
1.80.50.40.30.20.10.10.10.10.10.10.1<0.09<0.06<0.04<0.04<0.04<0.04<0.04<0.04<0.02<0.02<0.02<0.02
SofiaOther than SofiaComprising:TyphimuriumVirchowKiambuAgonaSingaporeChester4,12:d-OhioInfantisMbandakasubsp1 ser 16:,vZanzibar var 15+KottbusCubanaAnatumBovis morbifTennessee16:1,1,v:MuenchenHavanaHesserekWorthingtonWelteureden
8.26.7
4.10.40.30.30.30.20.20.20.10.1<0.06<0.06<0.06<0.04<0.04<0.04<0.04<0.04<0.02<0.02<0.02<0.02<0.02
202

Appendix 3. Model parameters used for modelling salmonellosis from the consumption of chicken meat in Australia
A B C D E FDescription Variable Unit Value Distribution
End of Processing 3 Prevalence Prev 5.3% RiskBeta(3422,60993)
4 Concentration LogMPN/bird 1.0168 Cumulative distribution based on Canadian data (FAO/WHO risk assessment)
5 6 Positive bird 0 binomial(1,Prev)7 8 Weight of bird g 1600 RiskPert(1100,1500,2500)9 Count per g Conc MPN/g 0 =IF(E6=0,0,(10^E4)/E8)11 Portion frozen Por_freeze % 0.15 15% value assigned12 Is chicken frozen at plant Fresh Logical13 Time frozen Days 0 RiskUniform(2,100)14 Frozen Reduction Log 0 Based on ICMSF data15 Count per g MPN/g 0 =IF(E9=0,0,10^(LOG(E9)-E14))17 Final count Conc MPN/g 0 =IF(E9=0,0,(IF(C24=1,E9,E15)))
MPN/bird 0 =IF(E6=0,0,RiskPoisson(E17*E8))Transport: Plant to Retail
3 Transport temp Tm_pr degree C 2.5 Uniform (0, 5)4 Transport time t_pr Hours 25 Correlated uniform (2, 48, CF-0.75)5 Minimum growth temperature Tmin_pr degree C 7. Constant 76 Salt concentration Slt_pr % 1.9 Constant 1.9
7 Log growth per hour LGR_pr log/hr 0.004EXP(-6.2251-(0.0114*Slt_pr)+(0.3234*Tm_pr)+(0.002*(Slt_pr*Tm_pr))-(0.0085*(Slt_pr*Slt_pr))-(0.0045*Tm_pr*Tm_pr))
8 Total log growth at retail LG_pr log/hr 0.000 IF('End of processing'!E12="Frozen",0,IF(Tm_pr<Tmin_pr,0,t_pr*LGR_pr))
203

A B C D E FDescription Variable Unit Value Distribution
Retail Storage 3 Retail temperature Rtl_Temp degree C 3.48 Australian retail temp data4 Retail time Rtl_Time days 3.54 Correlated uniform (2, 7, CF -2)5 Minimum growth temperature MGT degree C 7 Constant 76 Salt concentration NaCl % 1.9 Constant 1.9
7 Log growth per hour LogSGR_Rtl log/hr 0.0056EXP(-6.2251-(0.0114*NaCl)+(0.3234*Rtl_Temp)+(0.002*(NaCl*Rtl_Temp))-(0.0085*(NaCl*NaCl))-(0.0045*(Rtl_Temp*Rtl_Temp)))
8 Total log growth at retail Rtl_growth log 0IF('End of processing'!E12="Frozen",0,IF(Rtl_Temp<MGT,0,Rtl_Time*24*LogSGR_Rtl))
Transport: Retail to home 3 Ambient temp during transport Trans_Temp degree C 21 RiskDiscrete(21,37.9,0.5,0.5)4 Max change in temp during transport TransMax degree C 17.519 Trans_Temp-Rtl_Temp
5 Potential change in product temp during transport Trans_DTemp1 degree C 1.274
6 Change in temp during transport Trans_DTemp2 degree C 1.274 IF(Trans_Temp-Rtl_Temp<=0,0,Trans_DTemp1)7 Chicken temp after transport Post_Trans_Temp degree C 4.755 Rtl_Temp+Trans_DTemp28 Average transport temp Avg_Trans_Temp degree C 4.118 AVERAGE(Rtl_Temp,Post_Trans_Temp)9 Transport time Trans_Time Minutes 30.143 Cumulative distribution
10 Log growth per hour LogSGR_Trans log/hr 0.007EXP(-6.2251-(0.0114*NaCl)+(0.3234*Avg_Trans_Temp)+(0.002*(NaCl*Avg_Trans_Temp(0.0085*(NaCl*NaCl))-0.0045*Avg_Trans_Temp*Avg_Trans_Temp)))
11 Total log growth during transport Trans_growth log 0.000 IF(Avg_Trans_Temp<MGT,0,Trans_Time/60*LogSGR_Trans))
Storage at home 5 Home storage temp Home_Temp degree C 3.8591 Australian fridge data6 Home storage time Home_Time days 2.16 Correlated Pert (Min 0, ML 2, Max 5, CF -0.75)7 Fresh then frozen at home % 0.699 RiskBeta(100,43)8 Time frozen Days 16 RiskUniform(1,30)9 Reduction due to freezing Log 0.9 Reduction based on ICMFS data 10 Total reduction due to freezing Log 0.91
204

A B C D E FDescription Variable Unit Value Distribution
11 Log growth per hour LogSGR_Home log/hr 0.0062EXP(-6.2251-(0.0114*NaCl)+(0.3234*Home_Temp)+(0.002*(NaCl*Home_Temp))-(0.0085*(NaCl*NaCl))-(0.0045*(Home_Temp*Home_Temp)))
12 Total log growth in home Home_growth log 0 IF(OR(F10=1,F10=2),0,IF(Home_Temp<MGT,0,Home_Time*24*LogSGR_Home))
13 Total log growth in storage, trans and home Growth log -0.91 Rtl_growth+Trans_growth+Home_growth-E1014 Thawing WasThawed Log Yes IF(OR(F10=1,F10=2),"Yes","No")15 Total growth -0.908
Cross-Contamination during Preparation 3 Number of organisms on chicken Num cells 0 RiskDiscrete(J4:J6,K4:K6)4 Chickens – Hands Portion 6 Transfer from chicken to hands? XCH 0 IF(Num=0,0,1)7 Proportion transferred from chicken Prop-CH proportion 0.085 Pert (Min 1%, ML 6%, Max 26%)8 Number on hands Num_H cells 0 IF(XCH=0,0,Num*Prop_CH)9 Number left on chicken Num_C1 cells 0 Num-Num_H10 Hands - Other food 11 Probability that hands are not washed HW_Prob 0.07346939 RiskBeta(36,454)12 Hands not washed? HW 0 binomial(1,HW_Prob)13 Proportion transferred from hands Prop-HF 0.085 Pert (Min 1%, ML 6%, Max 26%)14 Number on other foods via hands Num_OF1 0 IF(HW=0,0,Num_H*Prop_HF)15 Chickens - Board 16 Transfer from chicken to board XCB 0 IF(Num=0,0,1)
17 Proportion transferred from chicken to board Prop_CB proportion 0.090833333 RiskPert(0.055,0.088,0.138)
18 Number on board Num_B cells 0 IF(XCB=0,0,Num*Prop_CB)19 Number left on chicken Num_Chick cells 0 Num_C1-Num_B20 Board - Other food 21 Probability that board is used for other foods Brd_use_Prob 0.11026616 RiskBeta(58,468)22 Boards used for other foods? Brd_use 0 binomial(1,Brd_use_Prob)
23 Proportion transferred from board Prop_BF 0.033333333 RiskPert(0.002,0.027,0.09)
205

A B C D E FDescription Variable Unit Value Distribution
24 Number on other foods from chicken via board Num_OF2 0 IF(Brd_use=0,0,Num_B*Prop_BF)
25 Number ingested via cross-contamination Num_XC cells 0 Num_OF1+Num_OF226 Ingestion via cross-contamination? No IF(Num_XC=0,"No","Yes")
Cooking
3 Probability of inadequate cooking Prob_AC 0.1 IF(OR('Cross-cont Prep'!H4=2,'Cross-cont Prep'!H4=3),0,RiskPert(0.05,0.1,0.15))
4 Adequately cooked? AC 1 binomial(1,1-Prob_AC)
5 Proportion of cells in areas that permit a chance of survival Prop_Prot 0.15666666
7 Pert (min 0.10, ML 0.16, Max 0.20)
6 Log number of cells with chance of survival Num_Prot log cells 0 IF(Conc=0,0,IF(Num_Chick=0,0,LOG10(Num_Chick*Prop_Prot)))
7 Exposure time at exposure temp for cells in 'protected area' Time_Prot minutes 0.1 Pert (min 0.50, ML 1.00, Max 1.50)
8 Exposure temp during cooking in 'protected areas' Temp_Prot degree C 64 Pert (min 60, ML 64, Max 65)
9 D-value (at this temp) D_Prot minutes 0.483058802 =10^(-0.139*Temp_Prot+8.58)
10 Log reduction in 'protected area' Prto_LR log Death =IF(AC=1,"death",Time_Prot/D_Prot)11 Total log number of cells surviving cooking Cell_cook log cells 0
Consumption 3 Weight of broiler carcass Broiler_WT grams 1600 Pert (min 1100, ML 1500, Max 2500)4 Proportion of edible meat Prop_edible 0.7 Constant5 Weight of edible meat Edible_WT grams 1120 Broiler_WT*Prop_edible6 Serving size Serve_size grams 273 RiskTriang(19,250,550)
7 Number of servings per broiler Num_Serve 4 IF(Edible_WT<Serve_size,1,ROUND(Edible_WT/Serve_size,0))
8 Cells per meal Cells_con cells/meal 0 =IF(Cell_cook=0,0,(10^Cell_cook)/Num_Serve)
11 Number of cells ingested from cross contamination cells 0 Num_XC/Num_Serve
16 Total cells consumed 019 Probability of illness Prob_ill 0
IF(E16=0,0,RiskTrigen(M25,N25,O25,2.5,97.5,
206
A B C D E FDescription Variable Unit Value Distribution
RiskTruncate(L25,P25)))*Num_Serve
207

Appendix 4. Model parameters used for modelling campylobacteriosis from the consumption of chicken meat in Australia
B C D E F Description Variable Unit Value Distribution End of processing
3 Prevalence Prev 74% RiskBeta(191,69)4 Concentration MPN/bird 698 Cumulative distribution based on QLD count data56 Positive bird 1 RiskBinomial(1,Prev)78 Weight of bird g 1600 RiskPert(1100,1500,2500)9 Count per g Conc MPN/g 0.44 IF(E6=0,0,(E4)/E8)
10 Portion frozen at Plant Por_freeze % 15% 15% value assigned11 Is chicken frozen at plant Fresh IF(C23=2,"Frozen","Fresh")12 Frozen Reduction Log -1.5 RiskUniform(0.5,2.5)13 Count per g MPN/g 0.014 IF(E9=0,0,10^(LOG(E9)+E12))1415 Final count Conc MPN/g 0.44 IF(E6=0,0,IF(C23=1,E9,E13))
MPN/bird 698 IF(E15=0,0,RiskPoisson(E15*E8))Storage home
5 Home storage temp Home_Temp 0C 3.86 Cumulative distribution based on Australian fridge data
6 Home storage time Home_Time days 2.17 Correlated Pert (Min 0, ML 2, Max 5, CF -0.75)7 Frozen at home % 0.70 RiskBeta(100,43)8 Reduction due to freezing at home -1.5 RiskUniform(0.5,2.5)
13 Total reduction TotalRed log -1.5 Discrete distribution based on percentages frozen at plant and at home
208

B C D E F Description Variable Unit Value Distribution
Cross Contamination during preparation
3 Number of organisms on chicken Num cells 4 Discrete distribution based on production figures (15% whole birds, 65% portions and 20% fully cooked)
4 Chickens - Hands Portion6 Transfer from chicken to hands? XCH7 Proportion transferred from chicken Prop-CH 1 IF(Num=0,0,1)8 Number on hands Num_H proportion 0.085 Pert (Min 1%, ML 6%, Max 26%)9 Number left on chicken Num_C1 cells 0 IF(XCH=0,0,Num*Prop_CH)
10 Hands - Other food cells 4 Num-Num_H11 Probability that hands are not washed HW_Prob12 Hands not washed? HW 0.073 RiskBeta(36,454)13 Proportion transferred from hands Prop-HF 0 RiskBinomial(1,HW_Prob)14 Number on other foods via hands Num_OF1 0.085 Pert (Min 1%, ML 6%, Max 26%)15 Chickens - Board 0 IF(HW=0,0,Num_H*Prop_HF)16 Transfer from chicken to board XCB17 Proportion transferred from chicken to board Prop_CB 1 IF(Num=0,0,1)18 Number on board Num_B proportion 0.091 RiskPert(0.055,0.088,0.138)19 Number left on chicken Num_Chick cells 0 IF(XCB=0,0,Num*Prop_CB)20 Board - Other food cells 4 Num_C1-Num_B21 Probability that board is used for other foods Brd_use_Prob22 Boards used for other foods? Brd_use 0.11 RiskBeta(58,468)23 Proportion transferred from board Prop_BF 0 RiskBinomial(1,Brd_use_Prob)24 Number on other foods from chicken via board Num_OF2 proportion 0.033 RiskPert(0.002,0.027,0.09)25 Number ingested via cross-contamination Num_XC cells 0 IF(Brd_use=0,0,Num_B*Prop_BF)26 Ingestion via cross-contamination? cells 0 Num_OF1+Num_OF2
209

B C D E F Description Variable Unit Value Distribution
Cooking
4 Probability of inadequate cooking Prob_AC 0.099 IF(OR('Cross-cont Prep'!H4=2,'Cross-cont Prep'!H4=3),0,RiskPert(0.05,0.1,0.15))
5 Adequately cooked? AC 1 binomial(1,1-Prob_AC)6 Proportion of cells in areas that permit a chance of survival Prop_Prot 0.156 Pert (min 0.10, ML 0.16, Max 0.20)
7 Log number of cells with chance of survival Num_Prot log cells -0.202 IF(Conc=0,0,IF(Num_Chick=0,0,LOG10
(Num_Chick*Prop_Prot)))8 Exposure time at exposure temp for cells in 'protected area' Time_Prot Minutes 0.1 Pert (min 0.50, ML 1.00, Max 1.50)9 Exposure temp during cooking in 'protected areas' Temp_Prot degree C 64 Pert (min 60, ML 64, Max 65)
10 D-value (at this temp) D_Prot Minutes 0.076 10^(-0.1613*Temp_Prot+9.2036)11 Log reduction in 'protected area' Prto_LR Log10 Death =IF(AC=1,"death",Time_Prot/D_Prot)
12 Total log number of cells surviving cooking Cell_cook log cells 0 ROUND(IF(ConcBird=0,0,(IF(AC=1,0,IF((Num_Prot-Prto_LR)<0,0,(Num_Prot-Prto_LR))))),0)
Consumption 3 Weight of broiler carcass Broiler_WT grams 1600 Pert (min 1100, ML 1500, Max 2500)4 Proportion of edible meat Prop_edible 0.7 Constant5 Weight of edible meat Edible_WT grams 1120 Broiler_WT*Prop_edible6 Serving size Serve_size grams 273 RiskTriang(19,250,550)
7 Number of servings per broiler Num_Serve 1IF(Edible_WT<Serve_size,1,ROUND(Edible_WT/Serve_size,0)))
8 Cells consumed Cells_con cells/meal 0 IF(Cell_cook=0,0,10^(Cell_cook)/Num_Serve)10 Number of cells ingested from cross contamination cells
Number of cells ingested from cooked chicken Cell_cook Cells 0 Num_XC/Num_Serve16 Total cells consumed 0 =E14+E11
19 Probability of infection Prob_inf 0 =(1-(1+(E16/59.95))^-0.21)*Num_Serve20 Probability of illness Prob_ill 0 RiskBeta(30,61)*E19
210

Appendix 5. Chemical Risk Assessment FrameworkEvidence-based risk assessments underpin the development of food standards for chemicals. The risk assessment framework used to develop food standards for Australia and New Zealand are broadly based on the principles and procedures recommended by the international food standards setting body, the Codex Alimentarius Commission (CAC 2001). The steps used by FSANZ to identify and quantify risks associated with chemicals in food are described briefly below:
Hazard identification and characterisation
The first two steps in a risk assessment process are hazard identification and characterisation. Chemical hazards are identified through standard toxicity tests performed according to internationally accepted protocols such as those published by the Organisation for Economic Cooperation and Development (OECD 1993). Hazard characterisation considers the dose-response relationship for particular hazards and, if possible, establishes an intake level considered to be safe.
Chemicals ‘intentionally added’ to food
FSANZ uses a cautious approach when assessing the safety of chemicals ‘intentionally added’ to food. For food additives and agricultural and veterinary chemicals, there is generally sufficient data available to identify and characterise hazards and to establish a safe level of human exposure to these chemicals. Various international bodies, such as the Joint FAO/WHO Expert Committee on Food Additives (JECFA) and the Joint FAO/WHO Meeting on Pesticide Residues (JMPR), have also established safe levels of exposure for these chemicals. The acceptable daily intake (ADI) intake is the amount of the chemical which may be safely consumed by a human over a lifetime without appreciable risk. The ADI is usually derived from experiments in animals in which a no-observed effect level (NOEL) is determined. Generally the NOEL for the most sensitive animal species is then divided by a safety factor, usually 100, to arrive at the ADI.
Chemicals ‘unintentionally present’ in food
For many chemicals ‘unintentionally present’ in food such as contaminants, there is a paucity of reliable data on which to identify and characterise hazards and thus to establish a safe level of human exposure. The reference value used to indicate the safe level of intake of a contaminant is the so-called ‘tolerable intake’, which can be calculated on a daily, weekly or monthly basis. Reference values, which define an acceptable level of exposure to a contaminant, are established internationally by JECFA. The tolerable intake (TI) is generally referred to as ‘provisional’ since there is often a lack of data on the consequences of human exposure at low levels, and new data may result in a change to the tolerable level. For contaminants that may accumulate in the body over time such as lead, cadmium and mercury, the provisional tolerable weekly intake (PTWI) or monthly intake (PTMI) is used as a reference value in order to minimise the significance of daily variations in intake. For contaminants that do not accumulate in the body, such as arsenic, the provisional tolerable daily intake (PTDI) can be used.
Exposure assessment
Estimation of exposure to chemicals in food depends on the knowledge of the level of the substance in food, coupled with knowledge of the amount of each food consumed, though there is a degree of uncertainty associated with both of these parameters. With respect to food contaminants the level of contamination of food is influenced by a variety of factors such as geographic and climatic conditions, agricultural practices, local industrial activity and food preparation and storage conditions.
211

The level of exposure to a substance in food, as consumed, can be determined from food surveillance data when available. Different methods of dietary modelling combine data on the levels of substances in food with food consumption data in different ways to provide estimates of the daily or weekly dietary exposure to a particular substance from food commodities for all sections of the population for which food consumption data are available.
Risk characterisation
Risk characterisation brings together information on the hazard characterisation and on level of exposure to the substance in food for various population groups in order to characterise the risk for various population groups. This might be expressed in terms of a margin-of-safety between an ADI or TI level and the known level of human exposure via the whole diet.
212

Appendix 6. Assessing agricultural and veterinary chemicals
The Australian Pesticide and Veterinary Medicines Authority (APVMA) registers pesticide and veterinary chemical products supplied or sold for use in Australia. Before registering such a product, the APVMA must be satisfied that when a product is used according to its label instructions, it will not result in any appreciable risk to consumers, other persons handling, applying or administering the chemical, the environment, target crops or animals and trade in agricultural commodities. Information that may be required to assess the safety of an agricultural or veterinary chemical can be found in the Guidelines for Registering Agricultural and Veterinary Chemicals, the Ag and Vet Requirements Series, 1997.
Registration of pesticide and veterinary chemicals is conditional upon the establishment of risk management measures that usually involve label instructions, the label itself being a legal document. Departure from label instructions, unless authorised, for an example by a permit, constitutes illegal use, and is an offence under State law.
Where applicable, the APVMA will set a maximum residue limit (MRL). The MRL is the highest concentration of the residue of a pesticide or veterinary drug that is legally permitted or accepted in a food or animal feed. The MRL is determined by residue trials. After registration, the APVMA may make an application to FSANZ to have a particular agricultural and veterinary chemical listed in the Code.
Hazard identification and characterisation
In Australia, toxicological evaluations on the safety of agricultural or veterinary chemical is undertaken by the Office of Chemical Safety (OCS) of the Therapeutic Goods Administration (TGA). The Joint FAO/WHO Expert Committee on Food Additives (JECFA), and the Joint Meeting on Pesticide Residues (JMPR) also evaluates the toxicological data at the international level. Where the agricultural chemical has antimicrobial properties, the Government through the National Health and Medical Research Council has also established the Expert Advisory Group on Antimicrobial Resistance (EAGAR) to provide advice to government and regulatory agencies on antibiotic resistance and measures to reduce the risks of antibiotic resistance.
Exposure evaluation and monitoring
FSANZ reviews the information provided by the APVMA and validates whether the dietary exposure is within agreed safety limits. If satisfied that the residues do not represent an unacceptable risk to public health and safety and subject to adequate resolution of any issues raised during public consultation, FSANZ will then agree to adopt the proposed MRL into Standard 1.4.2 – Maximum Residue Limits of the Code.
To ensure confidence in the regulatory system that approves agricultural and veterinary chemicals, the Government conducts three survey programs that collect information on the levels of agricultural and veterinary chemicals residues, contaminants and other substances in foods:
1. Australian Total Diet Survey (ATDS, previously known as the Market Basket Survey);
2. National Residue Survey (NRS); and
3. Imported Food Program (IFP), conducted by the Australian Quarantine and Inspection Service (AQIS).
213
The main aim of these programs is to monitor agricultural and veterinary chemical residues, contaminants and other substances in food commodities in export and import trade (NRS and IFP) as well as to estimate the level of dietary exposure to substances in the overall Australian diet in a ‘table ready form’ (ATDS).
214

Appendix 7. Current use of antimicrobial agents in poultry meat products
Antimicrobial agents are a subset of agricultural and veterinary chemicals approved for use in poultry for which an MRL has been set in the Code. The emergence of antimicrobial resistant bacteria associated with the use of antimicrobial agents in poultry is perceived as a health issue by some sectors of the public. Internationally there is some evidence of the emergence of antimicrobial resistant bacteria in animals which may be transferred to humans.
There is debate regarding the significance of these finding particularly from the perspective of human health outcomes such as an increase in morbidity and mortality and an increase in the costs associated with treatment of specific bacterial diseases. The emergence of antimicrobial resistant bacteria is not restricted to the poultry industry and is associated with the use of antimicrobial agents in food-producing animals.
Current use of antimicrobial agents in the poultry industry
There are four situations for which antimicrobial agents may be used in the poultry industry: therapeutic use; prophylactic use; growth promotion and coccidiosis control. These are briefly discussed in the following sections.
Therapeutic use
Antimicrobial agents are administered to treat disease when alternative disease control methods do not work or when no other alternative disease control method exists. In these cases, antimicrobial agents are prescribed by a veterinarian and are administered under veterinary supervision to poultry in drinking water. Birds that have been given antimicrobial agents in this way can only be slaughtered for human consumption after a ‘withholding period’, which is in place to prevent residues in meat products and is set out in the regulations depending on the antimicrobial agent used.
Prophylactic use
Antimicrobial agents are administered as a prophylaxis through feed. The prophylactic use of antimicrobial agents is more common than the therapeutic use of antimicrobial agents. Antimicrobial agents are given prophylactically when there is a high probability of most or all birds in a particular flock becoming infected with a particular pathogen. Prophylactic agents are administered at sub-therapeutic levels.
Growth promotion
Antimicrobial agents may be administered to poultry to increase feed conversion or growth rate of the bird. Antimicrobial Growth promotants are incorporated into feed and are available without a veterinary prescription. Although not fully understood, antimicrobial growth promotants act by suppressing sensitive intestinal bacteria that would otherwise divert nutrition away from the bird, and by enhancing food digestion, increasing the rate of weight gain and improving overall bird health. Growth promotants are not absorbed from the birds gut, hence they do not leave residues in poultry meat products. Only antimicrobial agents not used in human medicine are used as growth promotants in poultry.
Coccidiosis control
Antimicrobial agents are used to control protozoal disease. In this situation, they are administered as a feed additive. Coccidiosis control in poultry is standard practice due to the probability of clinical outbreaks or production loses due to sub-clinical diseases. Some antimicrobial agents used in coccidiosis control also have antibacterial activity.
215

Development of Antimicrobial Resistance
Antibiotics kill most, if not all, of the susceptible bacteria that are causing an infection, but leave behind – or select, in biological terms – the bacteria that have developed resistance, which can then multiply and thrive. Infection causing bacteria that were formerly susceptible to an antibiotic can develop resistance through changes in their genetic material. These changes can include the transfer of DNA from resistant bacteria, as well as spontaneous changes, or mutations, in a bacterium’s own DNA. The DNA coding for antibiotic resistance is located on the chromosome or plasmid of a bacterium. Plasmid-based resistance is transferred more readily than chromosomal-based resistance.
Once acquired, genetically determined antibiotic resistance is passed on to future generation and sometimes to other bacterial species. The dose of antibiotic and length of time bacteria are exposed to the antibiotic are major factors affecting whether the resistant bacteria population will dominate. Low doses of antibiotics administered over long periods of time to large groups of animals, such as doses used for growth promotion in animals, favour the emergence of resistant bacteria.
Significance of transfer of Antimicrobial Resistance from Animals to Humans
The extent of harm to human health from the transference of antibiotic resistant bacteria from animals is uncertain. Many studies have found that the use of antibiotics in animals poses significant risks for human health, and some researchers contend that the potential risk of the transference is great for vulnerable populations. However, a small number of studies contend that the health risks of the transference are minimal.
A recent FAO/OIE and WHO workshop sought to determine the human health impacts of the transference of antibiotic resistance from animal to humans (OIE 2003). The workshop states that the use of antibiotics in humans and animals alters the composition of microorganism populations in the intestinal tract, thereby placing individuals at increased risk for infections that would otherwise not have occurred. The report also states that use of antibiotics in humans and animals can also lead to increases in treatment failures and in the severity of infection.
Review of Antimicrobial Resistance in Australia
To address issues surrounding with antimicrobial resistance, the Government established the Joint Expert Advisory Committee on Antibiotic Resistance (JETACAR) in 1999. This group prepared a report giving independent expert advice on the threat posed by antimicrobial resistance (JETACAR 1999). An outcome of the JETACAR process was the formation of the Commonwealth Interdepartmental JETACAR Implementation Group (CIJIG) comprising technical experts and senior representatives from government agencies. CIJIG is responsible for implementing the recommendations of the JETACAR report.
In addition, there are two other taskforces established to ensure effective implementation and to provide policy advice to CIJIG. These are the Australian Health Ministers Conference (AHMC) JETACAR taskforce and the Primary Industries Standing Committee (PISC) JETACAR taskforce. FSANZ is represented on CIJIG and the AHMC JETACAR taskforce by the Chief Scientist.
Expert Advisory Group on Antimicrobial Resistance
The Government through the National Health and Medical Research Council has also established the Expert Advisory Group on Antimicrobial Resistance (EAGAR) to provide advice to government and regulatory agencies on antibiotic resistance and especially measures to reduce the risks of antibiotic resistance.
216

As part of any Application on antimicrobial agents used for veterinary purposes, EAGAR undertakes a risk assessment on the antimicrobial agent. This includes evaluation of the mode of action, use of related antimicrobial agents (both human and animal), proposed usage pattern, potential for cross-resistance to other animal and human agents, potential for co-selection for unrelated resistance in animal bacteria, importance of disease if transmitted to humans, the benefit of the agent to animal health and the impact of failure of antibiotic treatment in humans. Based on this process EAGAR informs the APVMA whether an antimicrobial agent represents an unacceptable risk to public health and safety when used for veterinary purposes.
217

Appendix 8. Maximum Residue LimitsResidue limits for agricultural and veterinary chemicals approved for use in poultry meat products used in food as of August 2004.
Chemical Residue description Poultry MRL (mg/kg)
Schedule 1 – Maximum Residue Limits
Acetamiprid Sum of acetamiprid and N-dimethyl acetamiprid ((E)-N1-[(6-chloro-3-pyridyl)methyl]-N2-cyanoacetamidine), expressed as acetamiprid
Edible offal of T*0.05
Meat T*0.01
Acifluorfen Acifluorfen Edible offal of 0.1Meat T*0.01
Aldoxycarb Sum of aldoxycarb and its sulfone, expressed as aldoxycarb Edible offal of 0.2Meat *0.02
Amoxycillin Inhibitory substance, identified as amoxycillin Edible offal of *0.01Meat *0.01
Amprolium Amprolium Edible offal of 1Meat 0.5
Apramycin Apramycin Edible offal of 1Meat *0.05
Avilamycin Inhibitory substance, identified as avilamycin Edible offal of *0.05Meat *0.05
Avoparcin Avoparcin Edible offal of *0.1Meat *0.1
Azamethiphos Azamethiphos Edible offal of *0.05Meat *0.05
Bacitracin Inhibitory substance, identified as bacitracin Chicken, edible offal of *0.5Chicken fat *0.5Chicken meat *0.5
Bendiocarb Sum of conjugated and unconjugated bendiocarb, 2,2-dimethyl-1,3-benzodioxol-4-ol and N-hydroxymethylbendiocarb, expressed as bendiocarb
Edible offal of 0.1
Meat 0.05
Bentazone Bentazone Edible offal of *0.05Meat *0.05
Bifenthrin Bifenthrin Edible offal of *0.05Meat (in the fat) *0.05
Bioresmethrin Bioresmethrin Edible offal of T*0.01Meat (in the fat) T0.5
Bitertanol Bitertanol Edible offal of *0.01Meat *0.01Meat (in the fat) 1
Bromoxynil Bromoxynil Edible offal of *0.02Meat *0.02
Butafenacil Butafenacil Edible offal of *0.02Meat *0.01
Butroxydim Butroxydim Edible offal of 0.01Meat 0.01
Captan Captan Edible offal of *0.02Meat *0.02
218

Chemical Residue description Poultry MRL (mg/kg)
Carbaryl Carbaryl Edible offal of T5Meat T0.5
Carbendazim Sum of carbendazim and 2-aminobenzimidazole, expressed as carbendazim
Edible offal of *0.1
Meat *0.1
Carbetamide Carbetamide Edible offal of *0.1Meat *0.1
Carbofuran Sum of carbofuran and 3-hydroxycarbofuran, expressed as carbofuran Edible offal of *0.05Meat *0.05
Carfentrazone-ethyl Carfentrazone-ethyl Edible offal of *0.05Meat *0.05
Chlorfenapyr Chlorfenapyr Edible offal of *0.01Meat (in the fat) *0.01
Chlorfluazuron Chlorfluazuron Edible offal of 0.1Meat (in the fat) 1
Chlorpyrifos Chlorpyrifos Edible offal of T0.1Meat (in the fat) T0.1
Chlorpyrifos-methyl Chlorpyrifos-methyl Edible offal of *0.05Meat (in the fat) *0.05
Chlortetracycline Inhibitory substance, identified as chlortetracycline Edible offal of 0.6Meat 0.1
Chlorthal-dimethyl Chlorthal-dimethyl Edible offal of *0.05Meat *0.05
Clodinafop-propargyl
Clodinafop-propargyl Edible offal of *0.05
Meat *0.05
Clodinafop acid (R)-2-[4-(5-chloro-3-fluoro-2-pyridinyloxy) phenoxy] propanoic acid Edible offal of *0.1Meat *0.1
Cloquintocet-mexyl Cloquintocet-mexyl Edible offal of *0.05Meat *0.05
Cloquintocet acid 5-chloro-8-quinolinoxyacetic acid Edible offal of *0.1Meat *0.1
Coumaphos Sum of coumaphos and its oxygen analogue, expressed as coumaphos Edible offal of 1Meat (in the fat) 1
Cyclanilide Sum of cyclanilide and its methyl ester, expressed as cyclanilide Edible offal of *0.01Meat *0.01
Cyfluthrin Cyfluthrin, sum of isomers Edible offal of *0.01Meat (in the fat) *0.01
Cyhalothrin Cyhalothrin, sum of isomers Edible offal of *0.02Meat *0.02
Cypermethrin Cypermethrin, sum of isomers Edible offal of *0.05Meat (in the fat) *0.05
Cyromazine Cyromazine Edible offal of 0.1Meat 0.05
2,4-D 2,4-D Edible offal of *0.05Meat *0.05
Daminozide Daminozide Edible offal of 0.2Meat 0.2
2,4-DB 2,4-DB Edible offal of *0.05Meat *0.05
219

Chemical Residue description Poultry MRL (mg/kg)
Deltamethrin Deltamethrin Edible offal of *0.01Meat *0.01
Diazinon Diazinon Edible offal of *0.05Meat *0.05
Dicamba Dicamba Edible offal of *0.05Meat *0.05
Dichlorvos Dichlorvos Edible offal of 0.05Meat 0.05
Diclazuril Diclazuril Chicken, edible offal of 1Chicken meat 0.2
Diclofop-methyl Diclofop-methyl Edible offal of *0.05Meat *0.05
Difenoconazole Difenoconazole Edible offal of *0.05Meat *0.05
Diflufenican Diflufenican Edible offal of *0.02Meat *0.02
Dimethipin Dimethipin Edible offal of *0.01Meat *0.01
Dimethoate Sum of dimethoate and omethoate, expressed as dimethoatesee also Omethoate
Edible offal of *0.05
Meat *0.05
Dimetridazole Dimetridazole Edible offal of *0.005Meat *0.005
Dinitolmide Dinitolmide Edible offal of 6Fats 2Meat 3
Diquat Diquat cation Edible offal of *0.05Meat *0.05
Disulfoton Sum of disulfoton and demeton-S and their sulfoxides and sulfones, expressed as disulfoton
Edible offal of *0.02
Meat *0.02
Dithiocarbamates Total dithiocarbamates, determined as carbon disulphide evolved during acid digestion and expressed as milligrams of carbon disulphide per kilogram of food
Edible offal of *0.5
Meat *0.5
Endosulfan Sum of - and - endosulfan and endosulfan sulphate Edible offal of 0.2Meat (in the fat) 0.2
EPTC EPTC Edible offal of *0.05Meat *0.05
Erythromycin Inhibitory substance, identified as erythromycin Edible offal of *0.3Meat *0.3
Ethametsulfuron methyl
Ethametsulfuron methyl Edible offal of *0.02
Meat *0.02
Ethephon Ethephon Edible offal of *0.2Meat *0.1
Ethopabate Ethopabate Edible offal of 15Meat 5
Fenamiphos Sum of fenamiphos, its sulfoxide and sulfone, expressed as fenamiphos Edible offal of *0.05Meat *0.05
220

Chemical Residue description Poultry MRL (mg/kg)
Fenchlorphos Fenchlorphos Edible offal of 7Meat (in the fat) 7
Fenitrothion Fenitrothion Edible offal of *0.05Meat *0.05
Fenoprop Fenoprop Edible offal of *0.02Meat *0.02
Fenoxaprop-ethyl Sum of fenoxaprop-ethyl (all isomers) and 2-(4-(6-chloro-2-benzoxazolyloxy)phenoxy)-propanoate and 6-chloro-2,3-dihydrobenzoxazol-2-one, expressed as fenoxaprop-ethyl
Edible offal of *0.1
Meat *0.01
Fenthion Sum of fenthion, its oxygen analogue, and their sulfoxides and sulfones, expressed as fenthion
Edible offal of *0.05
Meat *0.05
Fipronil Sum of fipronil, the sulphenyl metabolite (5-amino-1-[2,6-dichloro-4-(trifluoromethyl)phenyl]-4-[(trifluoromethyl) sulphenyl]-1H-pyrazole-3-carbonitrile),the sulphonyl metabolite (5-amino-1-[2,6-dichloro-4-(trifluoromethyl)phenyl]-4-[(trifluoromethyl)sulphonyl]-1H-pyrazole-3-carbonitrile), and the trifluoromethylmetabolite (5-amino-4-trifluoromethyl-1-[2,6-dichloro-4-(trifluoromethyl)phenyl]-1H-pyrazole-3-carbonitrile)
Edible offal of *0.01
Meat (in the fat) 0.02
Fluazifop-butyl Fluazifop-butyl Edible offal of *0.05Meat *0.05
Flucythrinate Flucythrinate Edible offal of *0.05Meat *0.05
Flumetsulam Flumetsulam Edible offal of *0.1Meat *0.1
Fluquinconazole Fluquinconazole Edible offal of *0.02Meat (in the fat) *0.02
Fluroxypyr Fluroxypyr Edible offal of *0.05Meat *0.05
Flutolanil Flutolanil and metabolites hydrolysed to 2-trifluoromethyl-benzoic acid and expressed as flutolanil
Edible offal of *0.05
Meat (in the fat) *0.05
Flutriafol Flutriafol Edible offal of *0.05Meat *0.05
Glufosinate and Glufosinate-ammonium
Sum of glufosinate-ammonium, N-acetyl glufosinate and 3-[hydroxy(methyl)-phosphinol] propionic acid, expressed as glufosinate (free acid)
Edible offal of *0.1
Meat *0.05
Glyphosate Glyphosate Edible offal of 1Meat *0.1
Halofuginone Halofuginone Edible offal of 1Meat *0.05
Halosulfuron-methyl
Halosulfuron-methyl Edible offal of *0.01
Meat *0.01
Haloxyfop Sum of haloxyfop, its esters and conjugates, expressed as haloxyfop Edible offal of 0.05Meat (in the fat) *0.01
Hexazinone Hexazinone Edible offal of *0.05Meat *0.05
Imazalil Imazalil Chicken, edible offal of *0.01Chicken meat *0.01
221
Chemical Residue description Poultry MRL (mg/kg)
Imazapic Sum of imazapic and its hydroxymethyl derivative Edible offal of T*0.01Meat T*0.01
Imazethapyr Imazethapyr Edible offal of *0.1Meat *0.1
Imidacloprid Sum of imidacloprid and metabolites containing the 6-chloropyridinymethylenemoiety, expressed as imidacloprid
Edible offal of *0.02
Meat *0.02
Indoxacarb Indoxacarb Edible offal of *0.01Meat (in the fat) *0.01
Iodosulfuron methyl Iodosulfuron methyl Edible offal of *0.01Meat (in the fat) *0.01
Kitasamycin Inhibitory substance, identified as kitasamycin Edible offal of *0.2Meat *0.2
Lasalocid Lasalocid Edible offal of *0.05Meat *0.05
Levamisole Levamisole Edible offal of 0.1Meat 0.1
Lincomycin Inhibitory substance, identified as lincomycin Edible offal of 0.1Meat 0.1
Lufenuron Lufenuron Edible offal of T*0.01Meat (in the fat) T1
Maduramicin Maduramicin Edible offal of 1Meat 0.1
Maldison Maldison Edible offal of 1Meat (in the fat) 1
MCPA MCPA Edible offal of *0.05Meat *0.05
MCPB MCPB Edible offal of *0.05Meat *0.05
Mecoprop Mecoprop Edible offal of *0.05Meat *0.05
Mefenpyr-diethyl Mefenpyr-diethyl Edible offal of *0.05Meat *0.05
Mepiquat Mepiquat Edible offal of 0.1Meat 0.1
Mesosulfuron-methyl
Mesosulfuron-methyl Edible offal of T*0.01
Meat T*0.01
Methidathion Methidathion Edible offal of *0.05Meat *0.05
Methomyl Sum of methomyl and methyl hydroxythioacetimidate (‘methomyl oxime’), expressed as methomylsee also Thiodicarb
Edible offal of *0.02
Meat *0.02
Methyl benzoquate Methyl benzoquate Edible offal of 0.1Meat 0.1
Metolachlor Metolachlor Edible offal of *0.01Meat *0.01
Metosulam Metosulam Edible offal of *0.01Meat *0.01
222

Chemical Residue description Poultry MRL (mg/kg)
Metribuzin Metribuzin Edible offal of *0.05Meat *0.05
Monensin Monensin Edible offal of 0.5Meat (in the fat) 0.5
Narasin Narasin Edible offal of 0.1Meat 0.1
Neomycin Inhibitory substance, identified as neomycin Kidney T10Liver T0.5Meat T0.5
Nicarbazin Nicarbazin Edible offal of 20Meat 5
Olaquindox Sum of olaquindox and all metabolites which reduce to 2-(N-2-hydroxyethylcarbamoyl)-3-methyl quinoxalone, expressed as olaquindox
Edible offal of 0.3
Meat 0.3
Omethoate Omethoatesee also Dimethoate
Edible offal of *0.05
Meat *0.05
Oxabetrinil Oxabetrinil Edible offal of *0.1Meat *0.1
Oxamyl Sum of oxamyl and 2-hydroxyimino-N,N-dimethyl-2-(methylthio)-acetamide, expressed as oxamyl
Edible offal of *0.02
Fats *0.02Meat *0.02
Oxydemeton-methyl Sum of oxydemeton-methyl and demeton-S-methyl sulphone, expressed as oxydemeton-methyl
Edible offal of *0.01
Meat *0.01
Oxyfluorfen Oxyfluorfen Edible offal of *0.01Meat (in the fat) 0.2
Oxytetracycline Inhibitory substance, identified as oxytetracycline Edible offal of 0.6Meat 0.1
Paraquat Paraquat cation Edible offal of *0.05Meat *0.05
Pendimethalin Pendimethalin Edible offal of *0.01Meat *0.01
Permethrin Permethrin, sum of isomers Edible offal of 0.1Meat (in the fat) 0.1
Phorate Sum of phorate, its oxygen analogue, and their sulfoxides and sulfones, expressed as phorate
Edible offal of *0.05
Meat *0.05
Chemical Residue description Poultry MRL (mg/kg)
Piperonyl butoxide Piperonyl butoxide Edible offal of *0.5Meat *0.5
Pirimicarb Sum of pirimicarb, dimethyl-pirimicarb and N-formyl-(methylamino) analogue and dimethylformamido-pirimicarb, expressed as pirimicarb
Edible offal of *0.1
Meat *0.1
Pirimiphos-methyl Pirimiphos-methyl Edible offal of *0.05Meat *0.05
Procymidone Procymidone Edible offal of *0.01Meat (in the fat) *0.01
223

Chemical Residue description Poultry MRL (mg/kg)
Profenofos Profenofos Edible offal of *0.05Meat *0.05
Propanil Propanil Edible offal of 3Meat *0.1
Propargite Propargite Edible offal of *0.1Meat (in the fat) *0.1
Propiconazole Propiconazole Edible offal of 0.1Meat 0.1
Propyzamide Propyzamide Edible offal of *0.05Meat *0.05
Pymetrozine Pymetrozine Edible offal of *0.01Meat *0.01
Pyridate Sum of pyridate and metabolites containing 6 chloro-4-hydorxyl-3-phenyl pyridazine, expressed as pyridate
Edible offal of *0.2
Meat *0.2
Pyrithiobac sodium Pyrithiobac sodium Edible offal of *0.02Meat *0.02
Quinzalofop-ethyl Sum of quizalofop-ethyl and quizalofop id acid and other esters, expressed as quizalofop-ethyl
Edible offal of *0.05
Meat *0.05
Quizalofop-p-tefuryl
Sum of quizalofop-p-tefuryl and quizalofop acid, expressed as quizalofop-p-tefuryl
Edible offal of *0.05
Meat *0.05
Salinomycin Salinomycin Edible offal of 0.5Meat 0.1
Semduramicin Semduramicin Chicken fat/skin 0.5Chicken kidney 0.2Chicken liver 0.5Chicken meat *0.05
Sethoxydim Sum of sethoxydim and metabolites containing the 5-(2-ethylthiopropyl)cyclohexene-3-one and 5-hydroxycyclohexene-3-one moieties and their sulfoxides and sulfoxides and sulfones, expressed as sethoxydim
Edible offal of *0.05
Meat *0.05
Simazine Simazine Edible offal of *0.01Meat *0.01
Spectinomycin Inhibitory substance, identified as spectinomycin Edible offal of *1Meat *1
Spinosad Sum of spinosyn and spinosyn Edible offal of T0.05Fat/skin T0.2Meat *0.01
Spiramycin Inhibitory substance, identified as spiramycin Edible offal of *1Meat *0.1
Sulphadiazine Sulphadiazine Edible offal of 0.1Meat 0.1
Sulphadimidine Sulphadimidine Edible offal of [except turkey]
0.1
Meat 0.1
Sulphaquinoxaline Sulphaquinoxaline Edible offal of T0.1Meat T0.1
Sulphosulfuron Sum of sulfosulfuron and its metabolites which can be hydrolysed to 2-(ethylsulfonyl)imidazo[1,2-A]pyridine, expressed as sulfosulfuron
Edible offal of 0.005
Meat 0.005
224

Chemical Residue description Poultry MRL (mg/kg)
Tebuconazole Tebuconazole Edible offal of 0.5Meat 0.1
Terbufos Sum of terbufos, its oxygen analogue and their sulfoxides and sulfones, expressed as terbufos
Edible offal of *0.05
Meat *0.05
Terbutryn Terbutryn Edible offal of *0.05Meat (in the fat) 0.1
Thifensulfuron Thifensulfuron Edible offal of *0.01Meat *0.01
Thiodicarb Sum of thiodicarb, methomyl and methomyloxime, expressed as thiodicarb see also methomyl
Edible offal of *0.5
Meat *0.5
Thiometon Sum of thiometon, its sulfoxide and sulfone, expressed as thiometon Edible offal of *0.05Meat *0.05
Tiamulin Tiamulin Edible offal of *0.1Meat *0.1
Toltrazuril Sum of toltrazuril, its sulfoxide and sulfone, expressed as toltrazuril Chicken, edible offal of 5Chicken meat 2
Triadimefon Sum of triadimefon and triadimenol, expressed as triadimefon see also Triadimenol
Edible offal of *0.05
Meat *0.05
Triadimenol Triadimenol see also Triadimefon
Edible offal of *0.01
Meat *0.01
Triallate Triallate Edible offal of 0.2Fats 0.2Meat *0.1
Trichlorfon Trichlorfon Edible offal of *0.05Meat *0.05
Triclopyr Triclopyr Edible offal of 0.05Meat (in the fat) 0.05
Trifloxysulfuron sodium
Trifloxysulfuron Edible offal of *0.01
Meat *0.01
Triflumuron Triflumuron Edible offal of 0.01Meat (in the fat) 0.1
Trifluralin Trifluralin Edible offal of *0.05Meat *0.05
Triticonazole Triticonazole Edible offal of *0.05Meat *0.05
Chemical Residue description Poultry MRL (mg/kg)
Trimethoprim Trimethoprim Edible offal of 0.05Meat 0.05
Tylosin Tylosin Edible offal of *0.2Fats *0.1Meat *0.2
Virginiamycin Inhibitory substance, identified as virginiamycin Edible offal of 0.2Fats 0.2Meat 0.1
225

Note:
An asterix ‘*’ appearing in Schedules 1 denotes the maximum residue limit is set at or about the limit of determination.
A ‘T’ appearing in Schedule 1 denotes that the maximum residue limit is a temporary maximum residue limit.
Chemical Residue description Poultry MRL (mg/kg)
Schedule 2 – Extraneous Residue Limits
Aldrin and Dieldrin
Sum of HHDN and HEOD Edible offal of E0.2
Meat (in the fat)
E0.2
BHC(other than the gamma isomer, Lindane)
Sum of isomers of 1,2,3,4,5,6-hexachlorocyclohexane, other than lindane
Edible offal of E0.3
Meat (in the fat)
E0.3
DDT Sum of p,p '-DDT; o,p '-DDT; p,p '-DDE and p,p '-TDE (DDD)
Edible offal of E5
Meat (in the fat)
E5
HCB Hexachlorobenzene Edible offal of E1Meat (in the fat)
E1
Heptachlor Sum of heptachlor and heptachlor epoxide Edible offal of E0.2Meat (in the fat)
E0.2
Lindane Lindane Edible offal of E0.7Meat (in the fat)
E0.7
Note:
An ‘E’ appearing in Schedule 2 denotes an extraneous residue limit.
226

Appendix 9 – Registered Antimicrobial AgentsRegistered antimicrobial agents and antimicrobial growth promotants for use in the Australian poultry industry (http://www.apvma.gov.au). The shaded rows in the table indicate the groups of antimicrobial agents that belong to families used in human medicine.
Antimicrobial Agent (group)
Treatment Prophylaxis Growth Promotant
Amoxycillin (penicillins) in feed/water
E. coli, Staphylococcus aureus, Cholera, necrotic enteritis
Erythromycin, tylosin, spiramycin (macrolides)
in feed/water
Coryza, respiratory disease, Mycoplasma
in feed/water
Mycoplasma (tylosin)
Lincomycin (lincosamide) in feed/water
Mycoplasma, E. coli, Salmonella
Oxytetracycline, chlortetracycline (tetracyclines)
in feed/water
Coryza, Cholera, Staphylococcus aureus, Mycoplasma
Neomycin, apramycin (aminoglycosides)
in feed/water
necrotic enteritis
Zn bacitracin (polypeptides) in feed/water
necrotic enteritis
in feed/water
growth promotant
Avilamycin (orthosomycin) in feed/water
necrotic enteritis
in feed/water
growth promotant
Many agents (sulphonamides)
in feed/water
E. coli, Salmonella, Cholera
Virginiamycin (streptogramins)
in feed/water
growth promotant
Metronidazole (nitroimidazole)
in feed/water
coccidiosis control
Flavophospholipol in feed/water
growth promotant
Tiamulin (diterpene)
in feed/water
respiratory disease
in feed/water
respiratory disease
4-hydroxy-3-nitrophenyl arsonic acid
in feed/water
growth promotant
Semduramicin, lasalocid, maduramicin, monensin (ionophore)
in feed/water
coccidiosis control
Note:
Poultry are generally given antimicrobial agents in feed and/or water since the treatment of individual birds is impractical and not economical. Although administering antimicrobial agents in feed and water is an effective means to expose all the animals to antimicrobial agents, the dose to individual birds is unknown and would be inconsistent between birds.
227

Appendix 10 – Foods containing Mechanically Separated ChickenList of NNS Foods considered to contain MSC
NNS Food NamePASTA, CHICKEN-FILLED, COOKED, NO SAUCE PIE, CHICKEN & VEGETABLE, TWO CRUSTS, INDIVIDUAL SIZE PASTRY ROLL, CHICKEN, CHEESE & VEGETABLE, INDIVIDUAL SIZE PIZZA, MEAT (INCLUDE CHICKEN) & VEGETABLE, THICK CRUST PIZZA, MEAT (INCLUDE CHICKEN) & FRUIT, THIN CRUST PIZZA, MEAT (INCLUDE CHICKEN) & FRUIT, THICK CRUST PIZZA, MEAT (INCLUDE CHICKEN) & PINEAPPLE, FROM FROZEN PIZZA, MEAT (INCLUDE CHICKEN) & VEGETABLE, FROM FROZEN CHICKENBURGER, CHAIN, WITH CHICKEN FILLET, MAYONNAISE & LETTUCE ON FORTIFIED BUN CHICKENBURGER, CHAIN, WITH REGULAR CHICKEN PATTY, MAYONNAISE AND LETTUCE ON FORTIFIED BUNSPRING ROLL, CHICKEN-FILLED, FRIED SAUSAGE, CHICKEN, GRILLED OR BBQ CHICKEN ROLL CHICKEN LOAF, SEASONED CHICKEN, BREAST, DELI-SLICED CHICKEN, DEVILLED, SPREAD OR PASTE CHICKEN STICK, COMMERCIALLY CRUMBED, FRIED OR BAKEDCHICKEN PATTY, HOMEMADE CHICKEN NUGGET, COOKED CHICKEN BURGER PATTY, COMMERCIAL, COOKED CHICKEN & CORN FORMED MEAT PRODUCT, CRUMBED, COOKED SOUP, CHICKEN, BROTH, NFS SOUP, CHICKEN & VEG, FROM CANNED CONDENSED, WITH ADDED WATER SOUP, CHICKEN & VEGETABLE, CANNED, READY TO SERVE SOUP, CHICKEN & VEGETABLE, NFS SOUP, CHICKEN AND NOODLE OR RICE, FROM INSTANT DRY MIX, RECONST WITH WATER SOUP, CHICKEN AND NOODLE OR RICE, REDUCED SALT, FROM INSTANT DRY MIX, RECONSTITUTED WITH WATER SOUP, CREAMED, CHICKEN, FROM INSTANT DRY MIX, RECONSTITUTED WITH WATER SOUP, CREAMED, CHICKEN, FROM CANNED CONDENSED, WITH ADDED WATER SOUP, WON TON SOUP MIX, CHICKEN AND NOODLE OR RICE, INSTANT DRY MIX SOUP MIX, CREAMED, CHICKEN, INSTANT DRY MIX INFANT DINNER, CHICKEN & VEGETABLE, STRAINED OR JUNIOR
228