gcseprep.com€¦ · web viewcreated by the \'abhtml to rtf .net\'bb 5.8.2.9. 5.6...
TRANSCRIPT

5.6 Forces and braking - Low Demand – Questions
Q1.Figure 1 shows the forces acting on a car while it is moving.
Figure 1
(a) What is the resultant force acting on the car when it is travelling at constant velocity?
Resultant force = ____________________ N(1)
(b) The car accelerates at 0.8 m/s2
The mass of the car is 850 kg
Calculate the resultant force acting on the car while it is accelerating.
Use the equation:
resultant force = mass × acceleration
___________________________________________________________________
___________________________________________________________________
___________________________________________________________________
___________________________________________________________________
Resultant force = ____________________ N(2)
(c) The driver notices a hazard and applies the brakes.
The car is travelling at 12 m/s
The driver’s reaction time is 0.180 s
Calculate the distance travelled during the driver’s reaction time.
Use the equation:
distance travelled = speed × time
___________________________________________________________________
Page 1 of 24

___________________________________________________________________
___________________________________________________________________
___________________________________________________________________
Distance travelled = ____________________ m(2)
(d) Figure 2 shows how the thinking distance, braking distance and stopping distance of a car change with speed.
Figure 2
Describe the trends in the data in Figure 2.
___________________________________________________________________
___________________________________________________________________
___________________________________________________________________
___________________________________________________________________
___________________________________________________________________
___________________________________________________________________(3)
(Total 8 marks)
Page 2 of 24

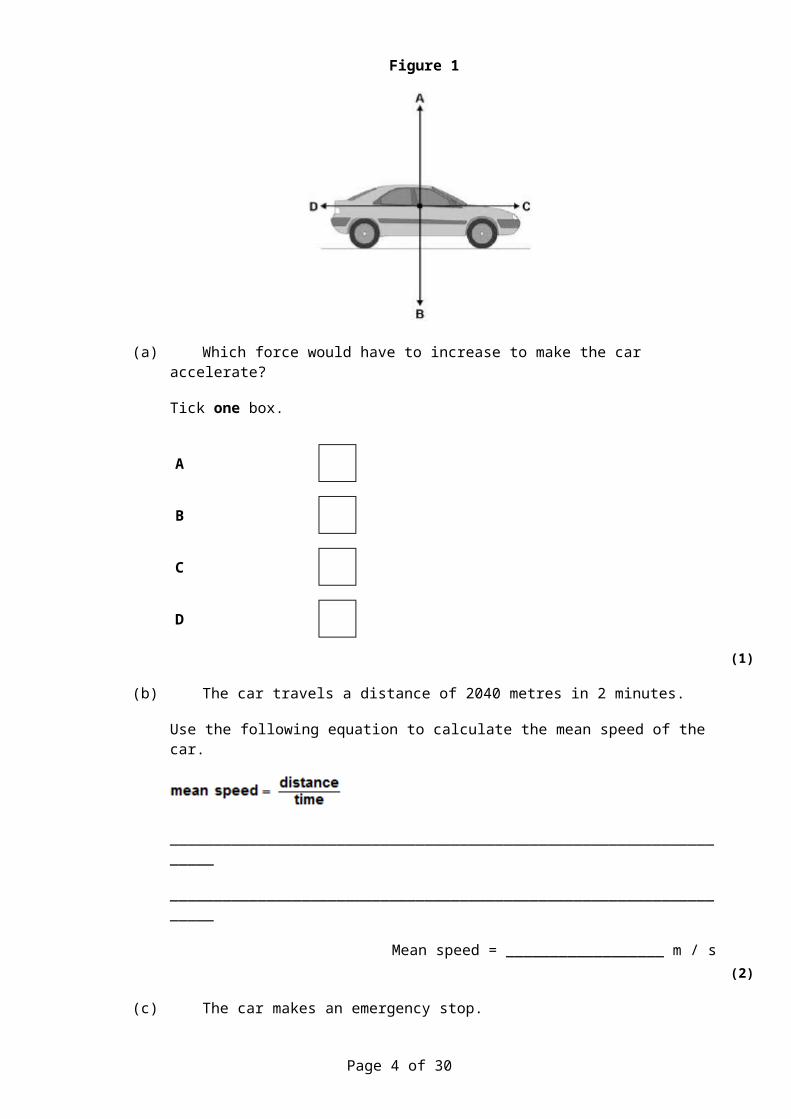
Q2.Figure 1 shows the forces acting on a car moving at a constant speed.
Figure 1
(a) Which force would have to increase to make the car accelerate?
Tick one box.
A
B
C
D
(1)
(b) The car travels a distance of 2040 metres in 2 minutes.
Use the following equation to calculate the mean speed of the car.
___________________________________________________________________
___________________________________________________________________
Mean speed = __________________ m / s(2)
(c) The car makes an emergency stop.
Figure 2 shows the thinking distance and braking distance of the car.
Figure 2
Page 3 of 24
What is the stopping distance?
___________________________________________________________________(1)
(d) The person driving the car is tired.
What effect will this have on the thinking distance and braking distance?
Tick one box for thinking distance.
Tick one box for braking distance.
decreases increases stays the same
thinking distance
braking distance
(2)(Total 6 marks)
Q3.A number of different forces act on a moving vehicle.
(a) A car moving at a steady speed has a driving force of 3000 N.
(i) What is the value of the resistive force acting on the car?
Tick ( ) one box.
Tick ( )
2000 N
3000 N
4000 N
(1)
(ii) What causes most of the resistive force?
Tick ( ) one box.
Tick ( )
Page 4 of 24

Air resistance
Faulty brakes
Poor condition of tyres
(1)
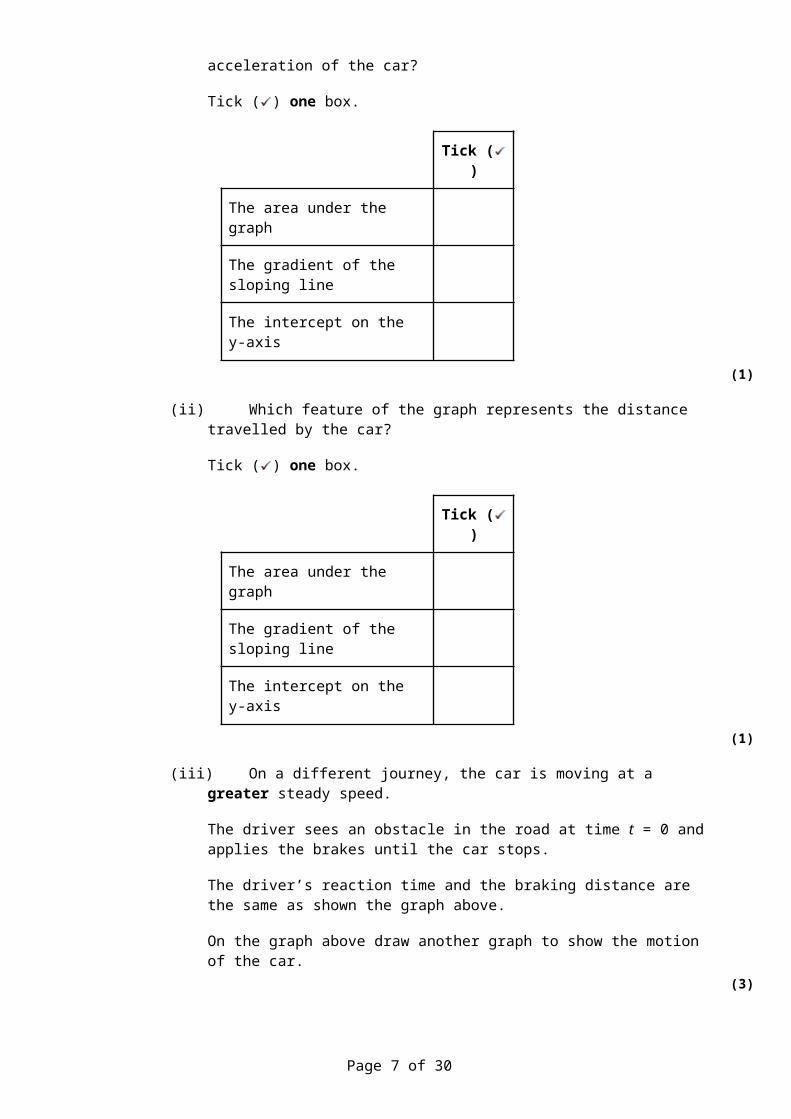
(b) A car is moving along a road. The driver sees an obstacle in the road at time t = 0 and applies the brakes until the car stops.
The graph shows how the velocity of the car changes with time.
(i) Which feature of the graph represents the negative acceleration of the car?
Tick ( ) one box.
Tick ( )
The area under the graph
The gradient of the sloping line
The intercept on the y-axis
(1)
(ii) Which feature of the graph represents the distance travelled by the car?
Tick ( ) one box.
Tick ( )
The area under the graph
The gradient of the sloping line
Page 5 of 24

The intercept on the y-axis
(1)
(iii) On a different journey, the car is moving at a greater steady speed.
The driver sees an obstacle in the road at time t = 0 and applies the brakes until the car stops.
The driver’s reaction time and the braking distance are the same as shown the graph above.
On the graph above draw another graph to show the motion of the car.(3)
(c) In this question you will be assessed on using good English, organising information clearly and using specialist terms where appropriate.
Thinking distance and braking distance affect stopping distance.
Explain how the factors that affect thinking distance and braking distance affect stopping distance.
___________________________________________________________________
___________________________________________________________________
___________________________________________________________________
___________________________________________________________________
___________________________________________________________________
___________________________________________________________________
___________________________________________________________________
___________________________________________________________________
___________________________________________________________________
___________________________________________________________________(6)
(Total 13 marks)
Q4.The diagram shows how the thinking distance and braking distance of a car add together to give the stopping distance of the car.
(a) Use words from the box to complete the sentence.
Page 6 of 24
distance energy force time
The stopping distance is found by adding the distance the car travels during the
driver’s reaction ____________________ and the distance the car travels under the
braking ____________________ .(2)
(b) Which one of the following would not increase the thinking distance?
Tick ( ) one box.
The car driver being tired.
The car tyres being badly worn.
The car being driven faster.
(1)
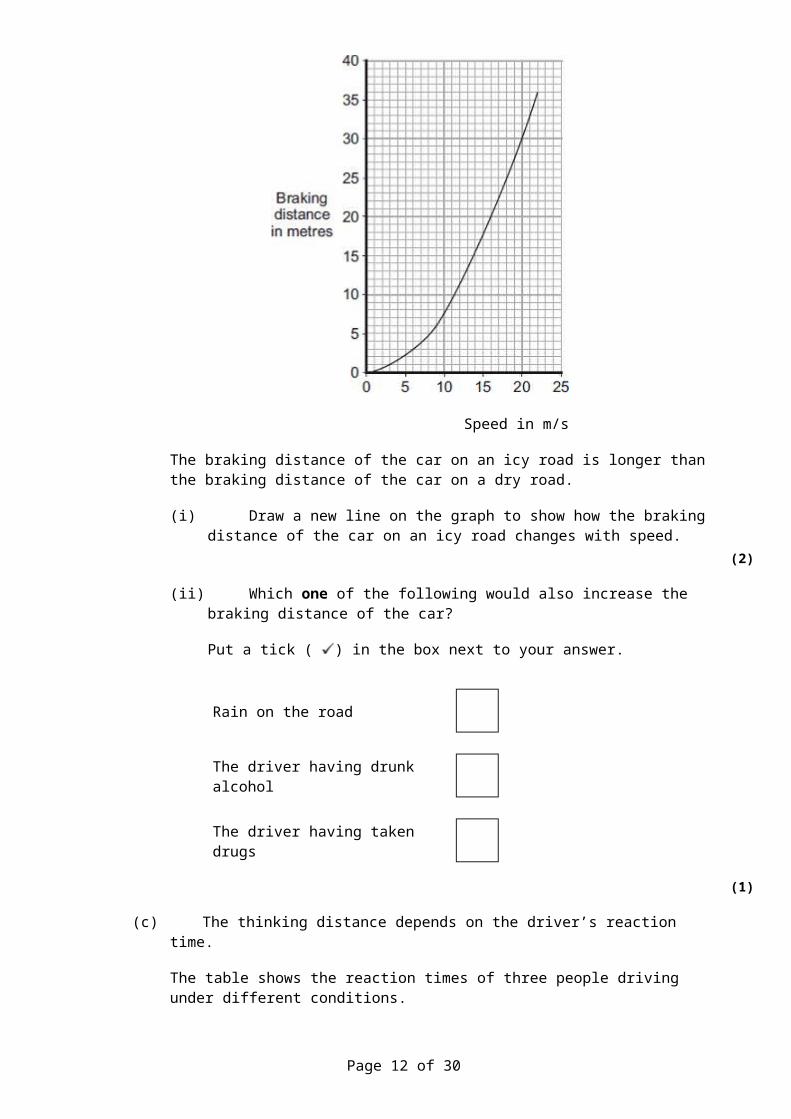
(c) The graph shows how the braking distance of a car changes with the speed of the car.The force applied to the car brakes does not change.
Speed in metres/second
(i) What conclusion about braking distance can be made from the graph?
______________________________________________________________
______________________________________________________________
Page 7 of 24

______________________________________________________________
______________________________________________________________(2)
(ii) The graph is for a car driven on a dry road.
Draw a line on the graph to show what is likely to happen to the braking distance at different speeds if the same car was driven on an icy road.
(1)
(d) A local council has reduced the speed limit from 30 miles per hour to 20 miles per hour on a few roads. The reason for reducing the speed limit was to reduce the number of accidents.
(i) A local newspaper reported that a councillor said:
“It will be much safer because drivers can react much faster when driving at 20 miles per hour than when driving at 30 miles per hour.”
This statement is wrong. Why?
______________________________________________________________
______________________________________________________________(1)
(ii) The local council must decide whether to introduce the lower speed limit on a lot more roads.
What evidence should the local council collect to help make this decision?
______________________________________________________________
______________________________________________________________
______________________________________________________________
______________________________________________________________(2)
(Total 9 marks)
Q5.(a) A car driver makes an emergency stop.
The chart shows the ‘thinking distance’ and the ‘braking distance’ needed to stop the car.
Calculate the total stopping distance of the car.
___________________________________________________________________
Page 8 of 24

Stopping distance = _________________________ m(1)
(b) The graph shows how the braking distance of a car driven on a dry road changes with the car’s speed.
Speed in m/s
The braking distance of the car on an icy road is longer than the braking distance of the car on a dry road.
(i) Draw a new line on the graph to show how the braking distance of the car on an icy road changes with speed.
(2)
(ii) Which one of the following would also increase the braking distance of the car?
Put a tick ( ) in the box next to your answer.
Rain on the road
The driver having drunk alcohol
The driver having taken drugs
(1)
(c) The thinking distance depends on the driver’s reaction time.
Page 9 of 24

The table shows the reaction times of three people driving under different conditions.
Car driver Condition
Reaction time in second
A Wide awake with no distractions 0.7
B Using a hands-free mobile phone 0.9
C Very tired and listening to music 1.2
The graph lines show how the thinking distance for the three drivers, A, B, and C, depends on how fast they are driving the car.
Speed in m/s
(i) Match each graph line to the correct driver by writing A, B, or C in the box next to the correct line.
(2)
(ii) The information in the table cannot be used to tell if driver C’s reaction time is increased by being tired or by listening to music.Explain why.
______________________________________________________________
______________________________________________________________
______________________________________________________________
______________________________________________________________(2)
(Total 8 marks)
Q6.
Page 10 of 24

(a) A driver may have to make an emergency stop.
Stopping distance = thinking distance + braking distance.
Give three different factors which affect the thinking distance or the braking distance. In your answer you should explain what effect each factor has on the stopping distance.
1. _________________________________________________________________
___________________________________________________________________
___________________________________________________________________
___________________________________________________________________
2. _________________________________________________________________
___________________________________________________________________
___________________________________________________________________
___________________________________________________________________
3. _________________________________________________________________
___________________________________________________________________
___________________________________________________________________
___________________________________________________________________(6)
(b) Complete the following sentences by writing in the two missing words.
Acceleration is the rate of change of _______________________________ .
The acceleration of a car depends on the force applied by the engine and the
______________________ of the car.(2)
(c) A car moves because of the force applied by the engine.
Page 11 of 24
Name two other forces which act on the car when it is moving. Give the direction in which each of these factors acts.
1. _________________________________________________________________
Direction of this force _________________________________________________
2. _________________________________________________________________
Direction of this force _________________________________________________ (4)
(d) Complete the following sentence by writing in the missing word.
The velocity of a car is its speed in a particular _________________________(1)
(Total 13 marks)
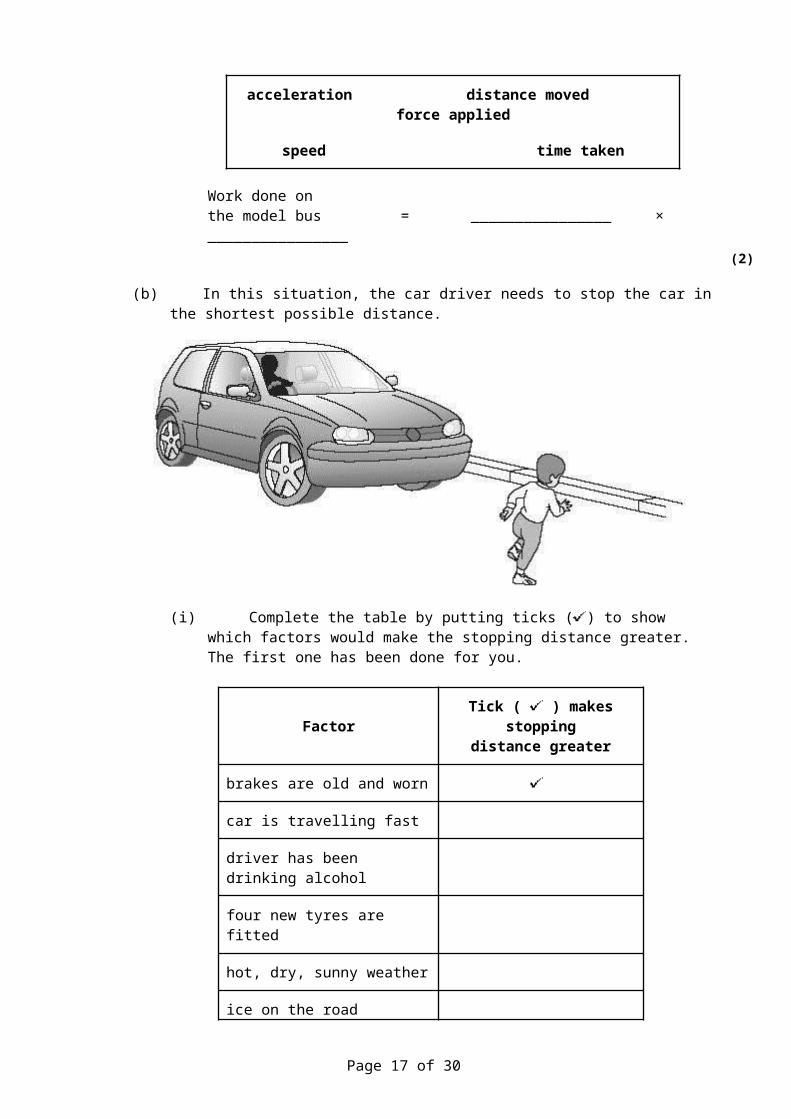
Q7.(a) The model bus is being pushed on a table.
(i) At first the pushing force does not make the model bus move. Explain why.
______________________________________________________________
______________________________________________________________(1)
(ii) Write down two things that happen as the pushing force increases.
1. ____________________________________________________________
______________________________________________________________
2. ____________________________________________________________
______________________________________________________________(2)
(iii) Complete the formula by choosing the correct words from the box.
acceleration distance moved force applied
speed time taken
Work done on
Page 12 of 24

the model bus = ________________ × ________________(2)
(b) In this situation, the car driver needs to stop the car in the shortest possible distance.
(i) Complete the table by putting ticks ( ) to show which factors would make the stopping distance greater. The first one has been done for you.
Factor Tick ( ) makes stoppingdistance greater
brakes are old and worn
car is travelling fast
driver has been drinking alcohol
four new tyres are fitted
hot, dry, sunny weather
ice on the road
(3)
(ii) Complete the sentence by writing the correct words in the spaces.
The car will skid if the braking force is too big compared with the friction
between the car’s __________________ and the __________________ .(1)
(Total 9 marks)
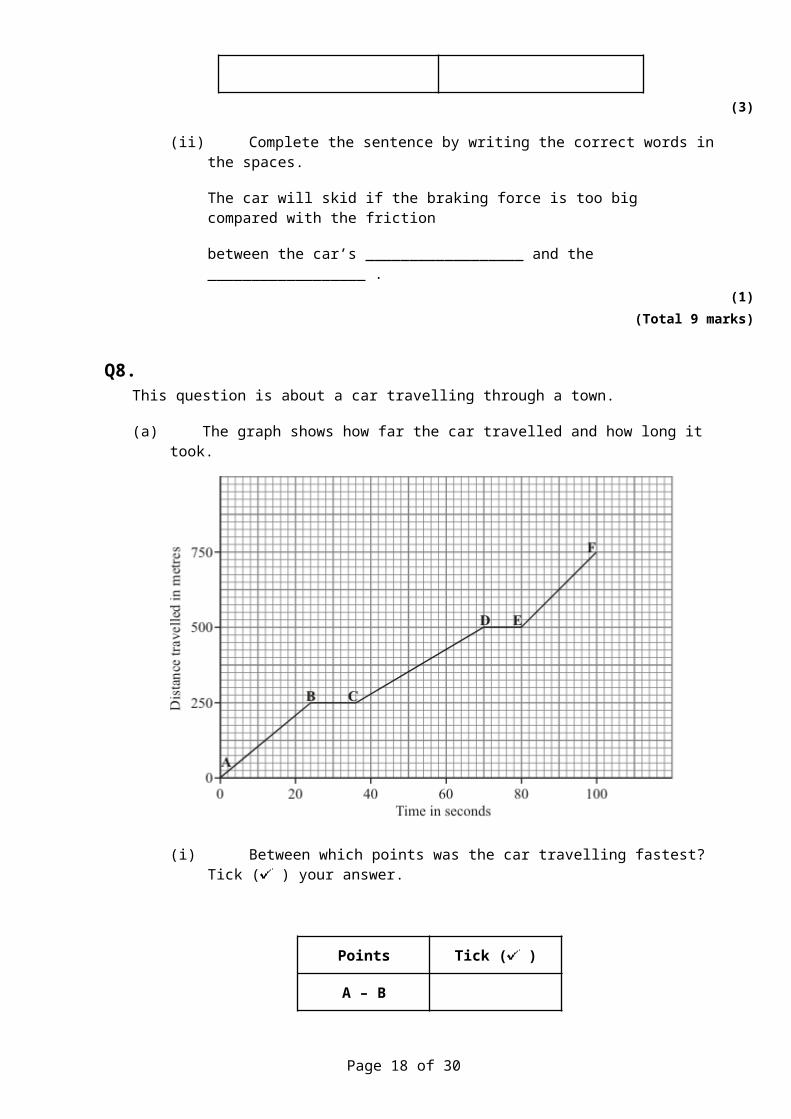
Q8.This question is about a car travelling through a town.
(a) The graph shows how far the car travelled and how long it took.
Page 13 of 24

(i) Between which points was the car travelling fastest? Tick ( ) your answer.
Points Tick ( )
A – B
B – C
C – D
D – E
E – F
(1)
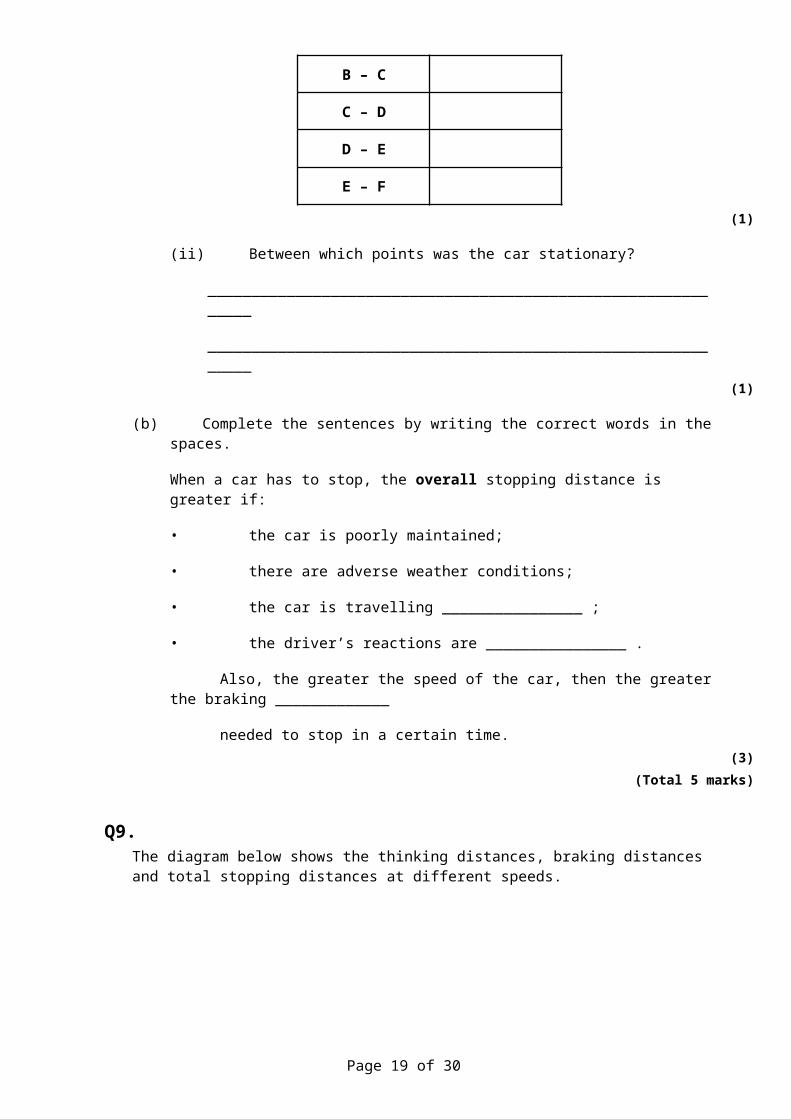
(ii) Between which points was the car stationary?
______________________________________________________________
______________________________________________________________(1)
(b) Complete the sentences by writing the correct words in the spaces.
When a car has to stop, the overall stopping distance is greater if:
• the car is poorly maintained;
• there are adverse weather conditions;
• the car is travelling ________________ ;
Page 14 of 24

• the driver’s reactions are ________________ .
Also, the greater the speed of the car, then the greater the braking _____________
needed to stop in a certain time.(3)
(Total 5 marks)
Q9.The diagram below shows the thinking distances, braking distances and total stopping distances at different speeds.
(a) Look at the total stopping distances at each speed.
Complete the sentence by choosing the correct words from the box.
distance force mass time
The total stopping distance depends on the distance the car travels during the
driver’s reaction _______________ and under the braking ________________ .(2)
(b) Give three other factors that could cause the total stopping distance of a car to be greater. Do not give the factors in Figure 1.
1. _________________________________________________________________
___________________________________________________________________
2. _________________________________________________________________
___________________________________________________________________
3. _________________________________________________________________
Page 15 of 24

___________________________________________________________________(3)
(Total 5 marks)
Q10.A car and a bicycle are travelling along a straight road. They have stopped at road works.
The graph shows how the velocity of the car changes after the sign is changed to GO.
(a) Between which two points on the graph is the car moving at constant velocity?
___________________________________________________________________(1)
(b) Between which two points on the graph is the car accelerating?
___________________________________________________________________(1)
(c) Between the sign changing to GO and the car starting to move, there is a time delay. This is called the reaction time.
(i) What is the reaction time of the car driver?
Reaction time = _________________ seconds(1)
(ii) Which one of the following could increase the reaction time of a car driver? Tick the box next to your choice.
Page 16 of 24
Drinking alcohol
Wet roads
Worn car brakes (1)
(d) The cyclist starts to move at the same time as the car. For the first 2 seconds the cyclist’s acceleration is constant and is greater than that of the car.
Draw a line on the graph to show how the velocity of the cyclist might change during the first 2 seconds of its motion.
(2)(Total 6 marks)
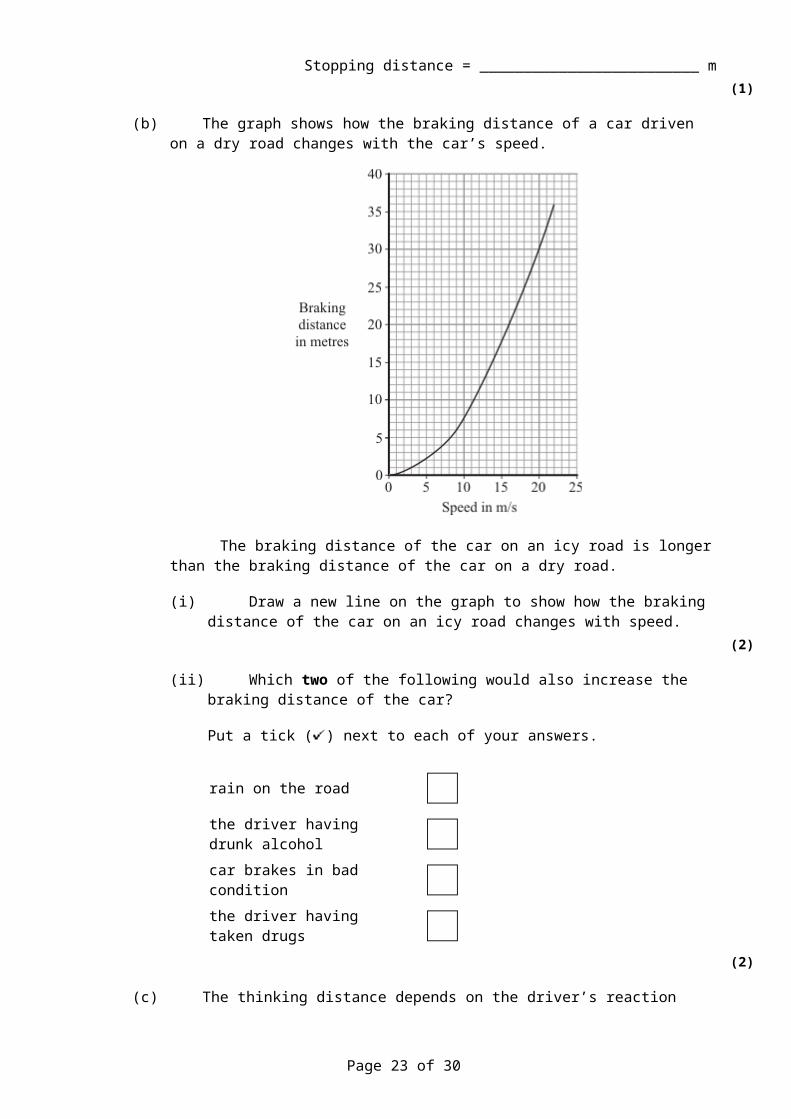
Q11.(a) A car driver makes an emergency stop.
The chart shows the ‘thinking distance’ and the ‘braking distance’ needed to stop the car.
Calculate the total stopping distance of the car.
___________________________________________________________________
Stopping distance = _________________________ m(1)
(b) The graph shows how the braking distance of a car driven on a dry road changes with the car’s speed.
Page 17 of 24
The braking distance of the car on an icy road is longer than the braking distance of the car on a dry road.
(i) Draw a new line on the graph to show how the braking distance of the car on an icy road changes with speed.
(2)
(ii) Which two of the following would also increase the braking distance of the car?
Put a tick ( ) next to each of your answers.
rain on the road
the driver having drunk alcohol
car brakes in bad condition
the driver having taken drugs
(2)
(c) The thinking distance depends on the driver’s reaction time.
The table shows the reaction times of three people driving under different conditions.
Car driver Condition Reaction timein seconds
A Wide awake with no distractions 0.7
Page 18 of 24
B Using a hands-free mobile phone 0.9
C Very tired and listening to music 1.2
The graph lines show how the thinking distance for the three drivers, A, B and C, depends on how fast they are driving the car.
(i) Match each graph line to the correct driver by writing A, B or C in the box next to the correct line.
(2)
(ii) The information in the table cannot be used to tell if driver C’s reaction time is increased by being tired or by listening to music.
Explain why.
______________________________________________________________
______________________________________________________________
______________________________________________________________
______________________________________________________________(2)
(Total 9 marks)
Q12.(a) The total stopping distance of a car has two parts. One part is the distance the car
travels during the driver’s reaction time. This distance is often called the ‘thinking distance’.
What distance is added to the ‘thinking distance’ to give the total stopping distance?
___________________________________________________________________
___________________________________________________________________
Page 19 of 24

(1)
(b) The graph shows the relationship between the speed of a car and the thinking distance.
Describe the relationship between speed and thinking distance.
___________________________________________________________________
___________________________________________________________________(2)
(c) The diagram shows two students investigating reaction time.
Page 20 of 24

One student holds a 30 cm ruler, then lets go. As soon as the second student sees the ruler fall, she closes her hand, stopping the ruler. The further the ruler falls before being stopped, the slower her reaction time.
(i) One student always holds the ruler the same distance above the other student’s hand.In this experiment, what type of variable is this?
Put a tick ( ) in the box next to your answer.
independent variable
dependent variable
control variable
(1)
(ii) Describe how this experiment could be used to find out whether listening to music affects reaction time.
______________________________________________________________
______________________________________________________________
______________________________________________________________
______________________________________________________________(2)
(d) The following information is written on the label of some cough medicine.
WARNING: Causes drowsiness.Do not drive or operate machinery.
How is feeling drowsy (sleepy) likely to affect a driver’s reaction time?
___________________________________________________________________
___________________________________________________________________(1)
(e) Three cars, X, Y and Z , are being driven along a straight road towards a set of traffic lights.The graphs show how the velocity of each car changes once the driver sees that the traffic light has turned to red.
Page 21 of 24
Which one of the cars, X, Y or Z , stops in the shortest distance?
___________________(1)
(Total 8 marks)
Q13.Motorway accidents have many causes.
(a) Which one of the following is most likely to increase the chance of a car being in an accident?
Tick ( ) the box next to your answer.
The car has just had new tyres fitted.
The driver has been drinking alcohol.
Page 22 of 24
A road surface in dry conditions
Give a reason for your answer.
___________________________________________________________________
___________________________________________________________________(2)
(b) The diagram shows three designs of motorway crash barriers.
Steel sheets Steel ‘ropes’ Solid concrete
Before a new design of barrier is used, it must be tested.A car of mass 1500 kg is driven at 30 m/s to hit the barrier at an angle of 20 degrees.This barrier must slow the car down and must not break.
Explain why the mass of the car, the speed of the car and the angle at which the car hits the barrier must be the same in every test.
___________________________________________________________________
___________________________________________________________________
___________________________________________________________________
___________________________________________________________________
___________________________________________________________________(2)
(c) A group of scientists has suggested that new designs of crash barriers should be first tested using computer simulations.
Which two statements give sensible reasons for testing new barrier designs using a computer simulation?
Put a tick ( ) in the box next to each of your answers.
The design of the barrier can be changed easily.
Page 23 of 24

Data for different conditions can be obtained quickly.
Simulations are more realistic than using cars and barriers.
(1)(Total 5 marks)
Page 24 of 24