testbanku.eu€¦ · web view · 2017-12-0484. laura naples, manager of heritage inn,...
TRANSCRIPT
Full file at https://testbanku.eu/Test Bank for Essentials of Modern Business Statistics with Microsoft Excel 7th Edition by AndersonComplete downloadable file at:https://testbanku.eu/Test-Bank-for-Essentials-of-Modern-Business-Statistics-with-Microsoft-Excel-7th-Edition-by-Anderson
a. the player’s number on a baseball uniform
b. the serial number on a one-dollar bill c. the part number of an inventory item d. the number of people in a waiting lineANSWER: dPOINTS: 1DIFFICULTY: EasyREFERENCES: DataLEARNING OBJECTIVES: MBST.ASWC.18.01.02 - 1.2NATIONAL STANDARDS: United States - Business Program.1: - Reflective
ThinkingKEYWORDS: Bloom's: Knowledge
2. Which of the following is NOT an example of descriptive statistics? a. a histogram depicting the age distribution for 30 randomly selected
students b. an estimate of the number of Alaska residents who have visited Canada c. a table summarizing the data collected in a sample of new-car buyers d. the proportion of mailed-out questionnaires that were returnedANSWER: bPOINTS: 1DIFFICULTY: EasyREFERENCES: Descriptive StatisticsLEARNING OBJECTIVES: MBST.ASWC.18.01.04 - 1.4NATIONAL STANDARDS: United States - Business Program.1: - Reflective
ThinkingKEYWORDS: Bloom's: Knowledge
Copyright Cengage Learning. Powered by Cognero. Page 1
Full file at https://testbanku.eu/3. Which of the following is an example of categorical data? a. social security number b. score on a multiple-choice exam c. height, in meters, of a diving board d. number of square feet of carpetANSWER: aPOINTS: 1DIFFICULTY: EasyREFERENCES: DataLEARNING OBJECTIVES: MBST.ASWC.18.01.02 - 1.2NATIONAL STANDARDS: United States - Business Program.1: - Reflective
ThinkingKEYWORDS: Bloom's: Knowledge
4. The number of observations in a complete data set having 10 elements and 5 variables is _____. a. 5 b. 10 c. 25 d. 50ANSWER: bPOINTS: 1DIFFICULTY: EasyREFERENCES: DataLEARNING OBJECTIVES: MBST.ASWC.18.01.02 - 1.2NATIONAL STANDARDS: United States - Business Program.1: - Reflective
ThinkingKEYWORDS: Bloom's: Knowledge
5. Facts and figures collected, analyzed, and summarized for presentation and interpretation are called _____. a. data b. variables c. elements d. variables and elementsANSWER: aPOINTS: 1DIFFICULTY: EasyREFERENCES: DataLEARNING OBJECTIVES: MBST.ASWC.18.01.02 - 1.2NATIONAL STANDARDS: United States - Business Program.1: - Reflective
ThinkingKEYWORDS: Bloom's: Knowledge
Copyright Cengage Learning. Powered by Cognero. Page 2
Full file at https://testbanku.eu/6. The entities on which data are collected are _____. a. elements b. populations c. sets d. samplesANSWER: aPOINTS: 1DIFFICULTY: EasyREFERENCES: DataLEARNING OBJECTIVES: MBST.ASWC.18.01.02 - 1.2NATIONAL STANDARDS: United States - Business Program.1: - Reflective
ThinkingKEYWORDS: Bloom's: Knowledge
7. The set of measurements collected for an element is called a(n) _____. a. census b. variable c. observation d. sampleANSWER: cPOINTS: 1DIFFICULTY: EasyREFERENCES: DataLEARNING OBJECTIVES: MBST.ASWC.18.01.02 - 1.2NATIONAL STANDARDS: United States - Business Program.1: - Reflective
ThinkingKEYWORDS: Bloom's: Knowledge
8. A characteristic of interest for the elements is called a(n) _____. a. sample b. data set c. variable d. observationANSWER: cPOINTS: 1DIFFICULTY: EasyREFERENCES: DataLEARNING OBJECTIVES: MBST.ASWC.18.01.02 - 1.2NATIONAL STANDARDS: United States - Business Program.1: - Reflective
ThinkingKEYWORDS: Bloom's: Knowledge
Copyright Cengage Learning. Powered by Cognero. Page 3
Full file at https://testbanku.eu/9. All data collected in a study are referred to as the _____. a. census b. inference c. variable d. data setANSWER: dPOINTS: 1DIFFICULTY: EasyREFERENCES: DataLEARNING OBJECTIVES: MBST.ASWC.18.01.02 - 1.2NATIONAL STANDARDS: United States - Business Program.1: - Reflective
ThinkingKEYWORDS: Bloom's: Knowledge
10. In a data set, the number of observations will always be the same as the number of _____. a. variables b. elements c. data sets d. dataANSWER: bPOINTS: 1DIFFICULTY: EasyREFERENCES: DataLEARNING OBJECTIVES: MBST.ASWC.18.01.02 - 1.2NATIONAL STANDARDS: United States - Business Program.1: - Reflective
ThinkingKEYWORDS: Bloom's: Knowledge
11. Which of the following is NOT a scale of measurement? a. nominal b. ordinal c. interval d. categoricalANSWER: dPOINTS: 1DIFFICULTY: EasyREFERENCES: DataLEARNING OBJECTIVES: MBST.ASWC.18.01.02 - 1.2NATIONAL STANDARDS: United States - Business Program.1: - Reflective
ThinkingKEYWORDS: Bloom's: Knowledge
Copyright Cengage Learning. Powered by Cognero. Page 4
Full file at https://testbanku.eu/12. When the data are labels or names used to identify an attribute of the elements, the variable has which scale of measurement? a. nominal b. ordinal c. interval d. ratioANSWER: aPOINTS: 1DIFFICULTY: EasyREFERENCES: DataLEARNING OBJECTIVES: MBST.ASWC.18.01.02 - 1.2NATIONAL STANDARDS: United States - Business Program.1: - Reflective
ThinkingKEYWORDS: Bloom's: Knowledge
13. When the data are labels or names used to identify an attribute of the elements and the rank of the data is meaningful, the variable has which scale of measurement? a. nominal b. ordinal c. interval d. ratioANSWER: bPOINTS: 1DIFFICULTY: EasyREFERENCES: DataLEARNING OBJECTIVES: MBST.ASWC.18.01.02 - 1.2NATIONAL STANDARDS: United States - Business Program.1: - Reflective
ThinkingKEYWORDS: Bloom's: Knowledge
14. When the data have the properties of ordinal data and the interval between observations is expressed in terms of a fixed unit of measure, the variable has which scale of measurement? a. nominal b. ordinal c. interval d. ratioANSWER: cPOINTS: 1DIFFICULTY: EasyREFERENCES: DataLEARNING OBJECTIVES: MBST.ASWC.18.01.02 - 1.2NATIONAL STANDARDS: United States - Business Program.1: - Reflective
ThinkingKEYWORDS: Bloom's: Knowledge
Copyright Cengage Learning. Powered by Cognero. Page 5
Full file at https://testbanku.eu/15. When the data have the properties of interval data and the multiplication or division of two values is meaningful, the variable has which scale of measurement? a. nominal b. ordinal c. interval d. ratioANSWER: dPOINTS: 1DIFFICULTY: EasyREFERENCES: DataLEARNING OBJECTIVES: MBST.ASWC.18.01.02 - 1.2NATIONAL STANDARDS: United States - Business Program.1: - Reflective
ThinkingKEYWORDS: Bloom's: Knowledge
16. Which two scales of measurement can be either numeric or nonnumeric? a. nominal and ratio b. ordinal and interval c. interval and ordinal d. nominal and
ordinalANSWER: dPOINTS: 1DIFFICULTY: EasyREFERENCES: DataLEARNING OBJECTIVES: MBST.ASWC.18.01.02 - 1.2NATIONAL STANDARDS: United States - Business Program.1: - Reflective
ThinkingKEYWORDS: Bloom's: Knowledge
17. Which of the following variables uses the interval scale of measurement? a. name of stock exchange b. time c. SAT scores d. social security numberANSWER: cPOINTS: 1DIFFICULTY: EasyREFERENCES: DataLEARNING OBJECTIVES: MBST.ASWC.18.01.02 - 1.2NATIONAL STANDARDS: United States - Business Program.1: - Reflective
ThinkingKEYWORDS: Bloom's: Knowledge
Copyright Cengage Learning. Powered by Cognero. Page 6
Full file at https://testbanku.eu/18. Which of the following variables uses the ratio scale of measurement? a. name of stock exchange b. time c. SAT scores d. social security numberANSWER: bPOINTS: 1DIFFICULTY: EasyREFERENCES: DataLEARNING OBJECTIVES: MBST.ASWC.18.01.02 - 1.2NATIONAL STANDARDS: United States - Business Program.1: - Reflective
ThinkingKEYWORDS: Bloom's: Knowledge
19. Quantitative data _____. a. are always nonnumeric b. may be either numeric or nonnumeric c. are always numeric d. are always labelsANSWER: cPOINTS: 1DIFFICULTY: EasyREFERENCES: DataLEARNING OBJECTIVES: MBST.ASWC.18.01.02 - 1.2NATIONAL STANDARDS: United States - Business Program.1: - Reflective
ThinkingKEYWORDS: Bloom's: Knowledge
20. Categorical data _____. a. are always nonnumeric b. may be either numeric or nonnumeric c. are always numeric d. indicate either how much or how manyANSWER: bPOINTS: 1DIFFICULTY: EasyREFERENCES: DataLEARNING OBJECTIVES: MBST.ASWC.18.01.02 - 1.2NATIONAL STANDARDS: United States - Business Program.1: - Reflective
ThinkingKEYWORDS: Bloom's: Knowledge
Copyright Cengage Learning. Powered by Cognero. Page 7
Full file at https://testbanku.eu/21. _____ analytics is the set of analytical techniques that yield a course of action. a. Descriptive b. Predictive c. Prescriptive d. DataANSWER: cPOINTS: 1DIFFICULTY: EasyREFERENCES: AnalyticsLEARNING OBJECTIVES: MBST.ASWC.18.01.07 - 1.7NATIONAL STANDARDS: United States - Business Program.1: - Reflective
ThinkingKEYWORDS: Bloom's: Knowledge
22. What organization developed the report, “Ethical Guidelines for Statistical Practice”? a. Ethics Committee for Statistical Practices b. American Statistical Association c. International Statistical Organization d. Federal Bureau for Ethical Practices in StatisticsANSWER: bPOINTS: 1DIFFICULTY: EasyREFERENCES: Ethical Guidelines for Statistical PracticeLEARNING OBJECTIVES: MBST.ASWC.18.01.09 - 1.9NATIONAL STANDARDS: United States - Business Program.1: - Reflective
ThinkingKEYWORDS: Bloom's: Knowledge
23. Arithmetic operations are inappropriate for _____. a. categorical data b. quantitative data c. both categorical and quantitative
data d. large data setsANSWER: aPOINTS: 1DIFFICULTY: EasyREFERENCES: DataLEARNING OBJECTIVES: MBST.ASWC.18.01.02 - 1.2NATIONAL STANDARDS: United States - Business Program.1: - Reflective
ThinkingKEYWORDS: Bloom's: Knowledge
Copyright Cengage Learning. Powered by Cognero. Page 8
Full file at https://testbanku.eu/24. In a questionnaire, respondents are asked to mark their gender as Male, Female, Transgender MtoF, Transgender FtoM, Non-binary, or Intersex. Gender is an example of a(n) _____ variable. a. categorical b. quantitative c. interval d. ratioANSWER: aPOINTS: 1DIFFICULTY: EasyREFERENCES: DataLEARNING OBJECTIVES: MBST.ASWC.18.01.02 - 1.2NATIONAL STANDARDS: United States - Business Program.1: - Reflective
ThinkingKEYWORDS: Bloom's: Knowledge
25. In a questionnaire, respondents are asked to record their age in years. Age is an example of a _____. a. categorical variable b. quantitative variable c. categorical or quantitative variable, depending on how the respondents answered the
question d. ratio variableANSWER: bPOINTS: 1DIFFICULTY: EasyREFERENCES: DataLEARNING OBJECTIVES: MBST.ASWC.18.01.02 - 1.2NATIONAL STANDARDS: United States - Business Program.1: - Reflective
ThinkingKEYWORDS: Bloom's: Knowledge
26. In an application for a credit card, potential customers are asked for their social security numbers. A social security number is an example of a _____. a. categorical variable b. quantitative variable c. categorical or quantitative variable, depending on how the respondents answered the
question d. ratio variableANSWER: aPOINTS: 1DIFFICULTY: EasyREFERENCES: DataLEARNING OBJECTIVES: MBST.ASWC.18.01.02 - 1.2NATIONAL STANDARDS: United States - Business Program.1: - Reflective
ThinkingKEYWORDS: Bloom's: Knowledge
Copyright Cengage Learning. Powered by Cognero. Page 9
Full file at https://testbanku.eu/27. Temperature is an example of which scale of measurement? a. nominal b. ordinal c. interva
l d. ratioANSWER: cPOINTS: 1DIFFICULTY: EasyREFERENCES: DataLEARNING OBJECTIVES: MBST.ASWC.18.01.02 - 1.2NATIONAL STANDARDS: United States - Business Program.1: - Reflective
ThinkingKEYWORDS: Bloom's: Knowledge
28. For ease of data entry into a university database, 1 denotes the student is enrolled in an undergraduate degree program, 2 indicates the student is enrolled in a master’s degree program, and 3 indicates the student is enrolled in a doctoral degree program. In this case, the data are which scale of measurement? a. nominal b. ordinal c. interval d. ratioANSWER: bPOINTS: 1DIFFICULTY: EasyREFERENCES: DataLEARNING OBJECTIVES: MBST.ASWC.18.01.02 - 1.2NATIONAL STANDARDS: United States - Business Program.1: - Reflective
ThinkingKEYWORDS: Bloom's: Knowledge
29. Income is an example of _____. a. categorical data b. either categorical or quantitative
data c. currency data d. quantitative dataANSWER: dPOINTS: 1DIFFICULTY: EasyREFERENCES: DataLEARNING OBJECTIVES: MBST.ASWC.18.01.02 - 1.2NATIONAL STANDARDS: United States - Business Program.1: - Reflective
ThinkingKEYWORDS: Bloom's: Knowledge
Copyright Cengage Learning. Powered by Cognero. Page 10
Full file at https://testbanku.eu/30. The birth weight of newborns, measured in grams, is an example of _____. a. categorical data b. either categorical or quantitative data c. neither categorical nor quantitative
data d. quantitative dataANSWER: dPOINTS: 1DIFFICULTY: EasyREFERENCES: DataLEARNING OBJECTIVES: MBST.ASWC.18.01.02 - 1.2NATIONAL STANDARDS: United States - Business Program.1: - Reflective
ThinkingKEYWORDS: Bloom's: Knowledge
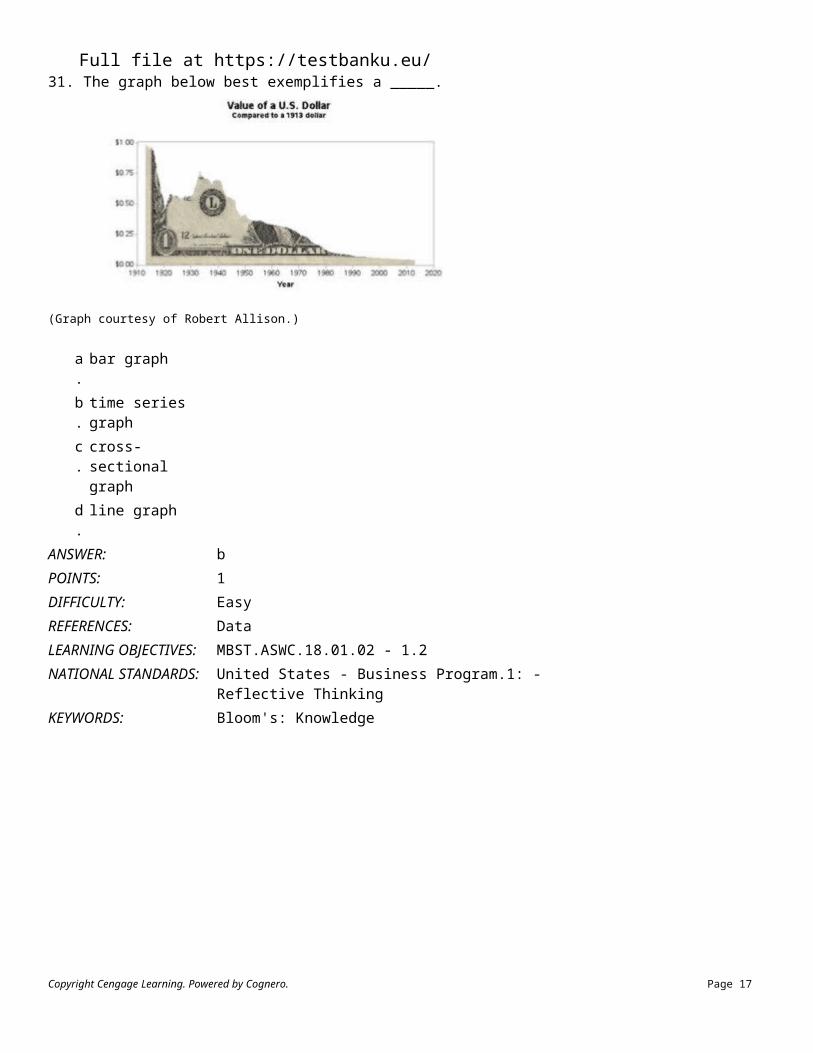
31. The graph below best exemplifies a _____.
(Graph courtesy of Robert Allison.)
a. bar graph b. time series graph c. cross-sectional graph d. line graphANSWER: bPOINTS: 1DIFFICULTY: EasyREFERENCES: DataLEARNING OBJECTIVES: MBST.ASWC.18.01.02 - 1.2NATIONAL STANDARDS: United States - Business Program.1: - Reflective
ThinkingKEYWORDS: Bloom's: Knowledge
Copyright Cengage Learning. Powered by Cognero. Page 11
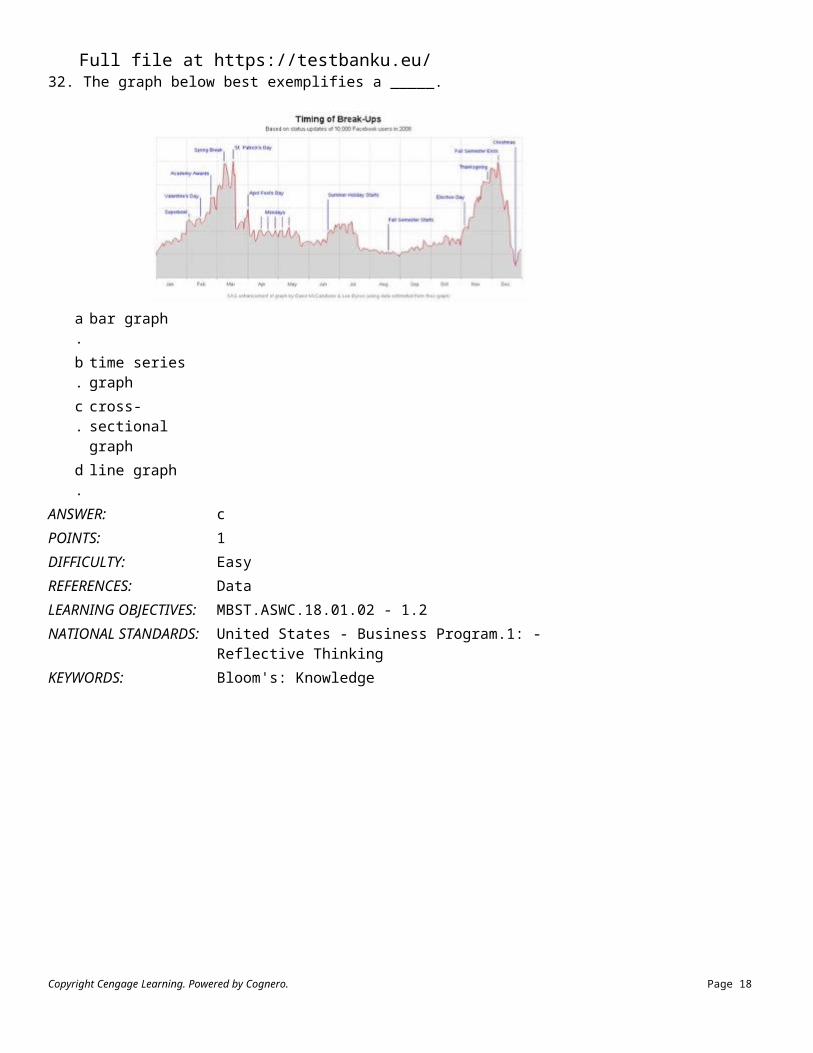
Full file at https://testbanku.eu/32. The graph below best exemplifies a _____.
a. bar graph b. time series graph c. cross-sectional graph d. line graphANSWER: cPOINTS: 1DIFFICULTY: EasyREFERENCES: DataLEARNING OBJECTIVES: MBST.ASWC.18.01.02 - 1.2NATIONAL STANDARDS: United States - Business Program.1: - Reflective
ThinkingKEYWORDS: Bloom's: Knowledge
33. Data collected at the same, or approximately the same, point in time are _____ data. a. time series b. static c. cross-sectional d. one-dimensionalANSWER: cPOINTS: 1DIFFICULTY: EasyREFERENCES: DataLEARNING OBJECTIVES: MBST.ASWC.18.01.02 - 1.2NATIONAL STANDARDS: United States - Business Program.1: - Reflective
ThinkingKEYWORDS: Bloom's: Knowledge
Copyright Cengage Learning. Powered by Cognero. Page 12
Full file at https://testbanku.eu/34. Data collected over several time periods are _____ data. a. time series b. time-controlled c. cross-sectional d. time dependentANSWER: aPOINTS: 1DIFFICULTY: EasyREFERENCES: DataLEARNING OBJECTIVES: MBST.ASWC.18.01.02 - 1.2NATIONAL STANDARDS: United States - Business Program.1: - Reflective
ThinkingKEYWORDS: Bloom's: Knowledge
35. Statistical studies in which researchers do not control variables of interest are _____. a. experimental studies b. uncontrolled experimental studies c. not of any value d. observational studiesANSWER: dPOINTS: 1DIFFICULTY: EasyREFERENCES: Data SourcesLEARNING OBJECTIVES: MBST.ASWC.18.01.03 - 1.3NATIONAL STANDARDS: United States - Business Program.1: - Reflective
ThinkingKEYWORDS: Bloom's: Knowledge
36. Statistical studies in which researchers control variables of interest are _____ studies. a. experimental b. control observational c. non-experimental d. observationalANSWER: aPOINTS: 1DIFFICULTY: EasyREFERENCES: Data SourcesLEARNING OBJECTIVES: MBST.ASWC.18.01.03 - 1.3NATIONAL STANDARDS: United States - Business Program.1: - Reflective
ThinkingKEYWORDS: Bloom's: Knowledge
Copyright Cengage Learning. Powered by Cognero. Page 13

Full file at https://testbanku.eu/37. _____ analytics encompasses the set of analytical techniques that describe what has happened in the past. a. Descriptive b. Predictive c. Prescriptive d. DataANSWER: aPOINTS: 1DIFFICULTY: EasyREFERENCES: AnalyticsLEARNING OBJECTIVES: MBST.ASWC.18.01.07 - 1.7NATIONAL STANDARDS: United States - Business Program.1: - Reflective
ThinkingKEYWORDS: Bloom's: Knowledge
38. Which of the following is NOT an example of an existing source of data? a. the Internet b. internal company records c. U.S. Census Bureau d. All of these are examples of existing sources of data.ANSWER: dPOINTS: 1DIFFICULTY: EasyREFERENCES: Data SourcesLEARNING OBJECTIVES: MBST.ASWC.18.01.03 - 1.3NATIONAL STANDARDS: United States - Business Program.1: - Reflective
ThinkingKEYWORDS: Bloom's: Knowledge
39. Which of the following is NOT an example of a firm that sells or leases business database services to clients? a. Dun & Bradstreet b. Bloomberg c. U.S. Census Bureau d. Dow Jones and CompanyANSWER: cPOINTS: 1DIFFICULTY: EasyREFERENCES: Data SourcesLEARNING OBJECTIVES: MBST.ASWC.18.01.03 - 1.3NATIONAL STANDARDS: United States - Business Program.1: - Reflective
ThinkingKEYWORDS: Bloom's: Knowledge
Copyright Cengage Learning. Powered by Cognero. Page 14
Full file at https://testbanku.eu/40. The most common type of observational study is a(n) _____. a. experiment b. survey c. debate d. statistical inferenceANSWER: bPOINTS: 1DIFFICULTY: EasyREFERENCES: Data SourcesLEARNING OBJECTIVES: MBST.ASWC.18.01.03 - 1.3NATIONAL STANDARDS: United States - Business Program.1: - Reflective
ThinkingKEYWORDS: Bloom's: Knowledge
41. The summaries of data, which may be tabular, graphical, or numerical, are referred to as _____. a. inferential statistics b. descriptive
statistics c. statistical inference d. report generationANSWER: bPOINTS: 1DIFFICULTY: EasyREFERENCES: Descriptive StatisticsLEARNING OBJECTIVES: MBST.ASWC.18.01.04 - 1.4NATIONAL STANDARDS: United States - Business Program.1: - Reflective
ThinkingKEYWORDS: Bloom's: Knowledge
42. A Scanner Data User Survey of 50 companies found that the average amount spent on scanner data per category of consumer goods was $387,325 (Mercer Management Consulting, Inc., April 24, 1997). The $387,325 is an example of _____. a. categorical data b. quantitative data c. a descriptive statistic d. Both quantitative data and a descriptive statistic are correct.ANSWER: dPOINTS: 1DIFFICULTY: EasyREFERENCES: Descriptive StatisticsLEARNING OBJECTIVES: MBST.ASWC.18.01.04 - 1.4NATIONAL STANDARDS: United States - Business Program.1: - Reflective
ThinkingKEYWORDS: Bloom's: Knowledge
Copyright Cengage Learning. Powered by Cognero. Page 15
Full file at https://testbanku.eu/43. Statistical inference _____. a. refers to the process of drawing inferences about the sample based on the characteristics of the
population b. is the same as descriptive statistics c. is the process of drawing inferences about the population based on the information taken from the sample d. is the same as a censusANSWER: cPOINTS: 1DIFFICULTY: EasyREFERENCES: Statistical InferenceLEARNING OBJECTIVES: MBST.ASWC.18.01.05 - 1.5NATIONAL STANDARDS: United States - Business Program.1: - Reflective
ThinkingKEYWORDS: Bloom's: Knowledge
44. The collection of all elements of interest in a study is _____. a. the population b. the sampling c. statistical inference d. descriptive
statisticsANSWER: aPOINTS: 1DIFFICULTY: EasyREFERENCES: Statistical InferenceLEARNING OBJECTIVES: MBST.ASWC.18.01.05 - 1.5NATIONAL STANDARDS: United States - Business Program.1: - Reflective
ThinkingKEYWORDS: Bloom's: Knowledge
45. A portion of the population selected to represent the population is called _____. a. statistical inference b. descriptive
statistics c. a census d. a sampleANSWER: dPOINTS: 1DIFFICULTY: EasyREFERENCES: Statistical InferenceLEARNING OBJECTIVES: MBST.ASWC.18.01.05 - 1.5NATIONAL STANDARDS: United States - Business Program.1: - Reflective
ThinkingKEYWORDS: Bloom's: Knowledge
Copyright Cengage Learning. Powered by Cognero. Page 16
Full file at https://testbanku.eu/46. Of 800 students in a university, 360, or 45%, live in the dormitories. The 800 is an example of _____. a. a sample b. a population c. statistical inference d. descriptive
statisticsANSWER: bPOINTS: 1DIFFICULTY: EasyREFERENCES: Statistical InferenceLEARNING OBJECTIVES: MBST.ASWC.18.01.05 - 1.5NATIONAL STANDARDS: United States - Business Program.1: - Reflective
ThinkingKEYWORDS: Bloom's: Knowledge
47. In a sample of 800 students in a university, 160, or 20%, are Business majors. Based on the above information, the school's paper reported, "20% of all students at the university are Business majors." This report is an example of _____. a. a sample b. a population c. statistical inference d. descriptive
statisticsANSWER: cPOINTS: 1DIFFICULTY: EasyREFERENCES: Statistical InferenceLEARNING OBJECTIVES: MBST.ASWC.18.01.05 - 1.5NATIONAL STANDARDS: United States - Business Program.1: - Reflective
ThinkingKEYWORDS: Bloom's: Knowledge
48. Six hundred residents of a city are polled to obtain information on voting intentions in an upcoming city election. The 600 residents in this study is an example of a(n) _____. a. census b. sample c. observation d. populationANSWER: bPOINTS: 1DIFFICULTY: EasyREFERENCES: Statistical InferenceLEARNING OBJECTIVES: MBST.ASWC.18.01.05 - 1.5NATIONAL STANDARDS: United States - Business Program.1: - Reflective
ThinkingKEYWORDS: Bloom's: Knowledge
Copyright Cengage Learning. Powered by Cognero. Page 17
Full file at https://testbanku.eu/49. A statistics professor asked students in a class their ages. Based on this information, the professor states that the average age of students in the university is 21 years. This is an example of _____. a. a census b. descriptive
statistics c. an experiment d. statistical inferenceANSWER: dPOINTS: 1DIFFICULTY: EasyREFERENCES: Statistical InferenceLEARNING OBJECTIVES: MBST.ASWC.18.01.05 - 1.5NATIONAL STANDARDS: United States - Business Program.1: - Reflective
ThinkingKEYWORDS: Bloom's: Knowledge
50. The owner of a factory regularly requests a graphical summary of all employees' salaries. The graphical summary of salaries is an example of _____. a. a sample b. descriptive
statistics c. statistical inference d. an experimentANSWER: bPOINTS: 1DIFFICULTY: EasyREFERENCES: Descriptive StatisticsLEARNING OBJECTIVES: MBST.ASWC.18.01.04 - 1.4NATIONAL STANDARDS: United States - Business Program.1: - Reflective
ThinkingKEYWORDS: Bloom's: Knowledge
Copyright Cengage Learning. Powered by Cognero. Page 18
Full file at https://testbanku.eu/51. The Department of Transportation of a city has noted that on the average there are 14 accidents per day. The average number of accidents is an example of _____. a. descriptive
statistics b. statistical inference c. a sample d. a populationANSWER: aPOINTS: 1DIFFICULTY: EasyREFERENCES: Descriptive StatisticsLEARNING OBJECTIVES: MBST.ASWC.18.01.04 - 1.4NATIONAL STANDARDS: United States - Business Program.1: - Reflective
ThinkingKEYWORDS: Bloom's: Knowledge
Exhibit 1-1In a recent study based upon an inspection of 200 homes in Daisy City, 120 were found to violate one or more city codes.
52. Refer to Exhibit 1-1. The city manager released a statement that 60% of Daisy City's 3,000 homes are in violation of city codes. The manager's statement is an example of _____. a. a census b. an experiment c. descriptive
statistics d. statistical inferenceANSWER: dPOINTS: 1DIFFICULTY: EasyREFERENCES: Statistical InferenceLEARNING OBJECTIVES: MBST.ASWC.18.01.05 - 1.5NATIONAL STANDARDS: United States - Business Program.1: - Reflective
ThinkingKEYWORDS: Bloom's: Knowledge
Copyright Cengage Learning. Powered by Cognero. Page 19

Full file at https://testbanku.eu/53. Refer to Exhibit 1-1. The Daisy City study is an example of the use of a _____. a. census b. sample c. probability d. populationANSWER: bPOINTS: 1DIFFICULTY: EasyREFERENCES: Statistical InferenceLEARNING OBJECTIVES: MBST.ASWC.18.01.05 - 1.5NATIONAL STANDARDS: United States - Business Program.1: - Reflective
ThinkingKEYWORDS: Bloom's: Knowledge
54. Refer to Exhibit 1-1. The manager's statement that 60% of Daisy City's 3,000 homes are in violation of city codes is _____. a. an accurate statement b. only an approximation, since it is based upon sample information c. obviously wrong, since it is based upon a study of only 200 homes d. None of the other answers is correct.ANSWER: bPOINTS: 1DIFFICULTY: EasyREFERENCES: Statistical InferenceLEARNING OBJECTIVES: MBST.ASWC.18.01.05 - 1.5NATIONAL STANDARDS: United States - Business Program.1: - Reflective
ThinkingKEYWORDS: Bloom's: Knowledge
Exhibit 1-2In a sample of 3,200 registered voters, 1,440, or 45%, approve of the way the president is doing his job.
55. Refer to Exhibit 1-2. The 45% approval is an example of _____. a. a sample b. descriptive
statistics c. statistical inference d. a populationANSWER: bPOINTS: 1DIFFICULTY: EasyREFERENCES: Descriptive StatisticsLEARNING OBJECTIVES: MBST.ASWC.18.01.04 - 1.4NATIONAL STANDARDS: United States - Business Program.1: - Reflective
ThinkingKEYWORDS: Bloom's: Knowledge
Copyright Cengage Learning. Powered by Cognero. Page 20

Full file at https://testbanku.eu/
56. Refer to Exhibit 1-2. A political pollster states, "Forty five percent of all voters approve of the president." This statement is an example of _____. a. a sample b. descriptive
statistics c. statistical inference d. a populationANSWER: cPOINTS: 1DIFFICULTY: EasyREFERENCES: Statistical InferenceLEARNING OBJECTIVES: MBST.ASWC.18.01.05 - 1.5NATIONAL STANDARDS: United States - Business Program.1: - Reflective
ThinkingKEYWORDS: Bloom's: Knowledge
57. The process of analyzing sample data to draw conclusions about the characteristics of a population is called _____. a. descriptive
statistics b. statistical inference c. data analysis d. data summarizationANSWER: bPOINTS: 1DIFFICULTY: EasyREFERENCES: Statistical InferenceLEARNING OBJECTIVES: MBST.ASWC.18.01.05 - 1.5NATIONAL STANDARDS: United States - Business Program.1: - Reflective
ThinkingKEYWORDS: Bloom's: Knowledge
58. In a post office, the mailboxes are numbered from 1 to 5,000. These numbers represent _____. a. categorical data b. time series data c. cross-sectional data d. quantitative dataANSWER: aPOINTS: 1DIFFICULTY: EasyREFERENCES: DataLEARNING OBJECTIVES: MBST.ASWC.18.01.02 - 1.2NATIONAL STANDARDS: United States - Business Program.1: - Reflective
ThinkingKEYWORDS: Bloom's: Knowledge
Copyright Cengage Learning. Powered by Cognero. Page 21

Full file at https://testbanku.eu/59. The average age in a sample of 90 students at City College is 20. From this sample, it can be concluded that the average age of all the students at City College _____. a. must be more than 20, since the population is always larger than the sample b. must be less than 20, since the sample is only a part of the population c. could not be 20 d. could be larger, smaller, or equal to 20ANSWER: dPOINTS: 1DIFFICULTY: EasyREFERENCES: Statistical InferenceLEARNING OBJECTIVES: MBST.ASWC.18.01.05 - 1.5NATIONAL STANDARDS: United States - Business Program.1: - Reflective
ThinkingKEYWORDS: Bloom's: Knowledge
60. _____ analytics consists of analytical techniques that use models constructed from past data to predict the future or to assess the impact of one variable on another. a. Descriptive b. Predictive c. Prescriptive d. DataANSWER: bPOINTS: 1DIFFICULTY: EasyREFERENCES: AnalyticsLEARNING OBJECTIVES: MBST.ASWC.18.01.07 - 1.7NATIONAL STANDARDS: United States - Business Program.1: - Reflective
ThinkingKEYWORDS: Bloom's: Knowledge
61. The term _____ is used to refer to the process of capturing, storing, and maintaining data. a. data warehousing b. data mining c. data analysis d. data collectionANSWER: aPOINTS: 1DIFFICULTY: EasyREFERENCES: Big Data and Data MiningLEARNING OBJECTIVES: MBST.ASWC.18.01.08 - 1.8NATIONAL STANDARDS: United States - Business Program.1: - Reflective
ThinkingKEYWORDS: Bloom's: Knowledge
Copyright Cengage Learning. Powered by Cognero. Page 22
Full file at https://testbanku.eu/62. A sample of five Fortune 500 companies showed the following revenues ($ millions): 7505.0, 2904.7, 7208.4, 6819.0, and 19500.0. Based on this information, which of the following statements is correct? a. An estimate of the average revenue for all Fortune 500 companies is 8787.42 ($ millions). b. The average revenue for all Fortune 500 companies is 8787.42 ($ millions). c. Over half of all Fortune 500 companies earn at least 7208.4 ($ millions) in revenues. d. If five other Fortune 500 companies were chosen, the average revenue would be 8787.42 ($
millions).ANSWER: aPOINTS: 1DIFFICULTY: EasyREFERENCES: Statistical InferenceLEARNING OBJECTIVES: MBST.ASWC.18.01.05 - 1.5NATIONAL STANDARDS: United States - Business Program.1: - Reflective
ThinkingKEYWORDS: Bloom's: Knowledge
63. A sample of five Fortune 500 companies possessed the following industry codes: banking, banking, finance, retail, and banking. Based on this information, which of the following statements is correct? a. Sixty percent of the sample of five companies are banking industries. b. Sixty percent of all Fortune 500 companies are banking industries. c. Banking is the most common type of industry among all Fortune 500 companies. d. If five other Fortune 500 companies were chosen, 60% of them would be banking
industries.ANSWER: aPOINTS: 1DIFFICULTY: EasyREFERENCES: Statistical InferenceLEARNING OBJECTIVES: MBST.ASWC.18.01.05 - 1.5NATIONAL STANDARDS: United States - Business Program.1: - Reflective
ThinkingKEYWORDS: Bloom's: Knowledge
64. The Microsoft Office package used to perform statistical analysis is _____. a. SPSS b. Word c. SAS d. ExcelANSWER: dPOINTS: 1DIFFICULTY: EasyREFERENCES: Statistical Analysis Using Microsoft ExcelLEARNING OBJECTIVES: MBST.ASWC.18.01.06 - 1.6NATIONAL STANDARDS: United States - Business Program.1: - Reflective
ThinkingKEYWORDS: Bloom's: Knowledge
Copyright Cengage Learning. Powered by Cognero. Page 23

Full file at https://testbanku.eu/65. Dr. Kurt Thearling, a leading practitioner in the field, defines data mining as “the _____ extraction of _____ information from databases." a. thorough, insightful b. timely, accurate c. automated,
predictive d. intentional, usefulANSWER: cPOINTS: 1DIFFICULTY: EasyREFERENCES: Big Data and Data MiningLEARNING OBJECTIVES: MBST.ASWC.18.01.08 - 1.8NATIONAL STANDARDS: United States - Business Program.1: - Reflective
ThinkingKEYWORDS: Bloom's: Knowledge
66. The major applications of data mining have been made by companies with a strong _____ focus. a. consumer b. manufacturing c. exporting d. research and developmentANSWER: aPOINTS: 1DIFFICULTY: EasyREFERENCES: Big Data and Data MiningLEARNING OBJECTIVES: MBST.ASWC.18.01.08 - 1.8NATIONAL STANDARDS: United States - Business Program.1: - Reflective
ThinkingKEYWORDS: Bloom's: Knowledge
67. Quantitative data that measure "how many" are ________; quantitative data that measure "how much" are ________. a. interval; ratio b. ratio; interval c. continuous; discrete d. discrete; continuousANSWER: dPOINTS: 1DIFFICULTY: EasyREFERENCES: DataLEARNING OBJECTIVES: MBST.ASWC.18.01.02 - 1.2NATIONAL STANDARDS: United States - Business Program.1: - Reflective
ThinkingKEYWORDS: Bloom's: Knowledge
Copyright Cengage Learning. Powered by Cognero. Page 24

Full file at https://testbanku.eu/68. Flight time from Cincinnati to Atlanta is an example of a _____ variable and _____ measurement. a. discrete; interval b. discrete; ratio c. continuous; interval d. continuous; ratioANSWER: dPOINTS: 1DIFFICULTY: EasyREFERENCES: DataLEARNING OBJECTIVES: MBST.ASWC.18.01.02 - 1.2NATIONAL STANDARDS: United States - Business Program.1: - Reflective
ThinkingKEYWORDS: Bloom's: Knowledge
69. Which of the following is NOT a categorical variable? a. your age on your last birthday b. your cell phone area code c. your accounting class start time d. your high school graduation yearANSWER: aPOINTS: 1DIFFICULTY: EasyREFERENCES: DataLEARNING OBJECTIVES: MBST.ASWC.18.01.02 - 1.2NATIONAL STANDARDS: United States - Business Program.1: - Reflective
ThinkingKEYWORDS: Bloom's: Knowledge
70. Categorical data use either the ______ or ______ scale of measurement. a. nominal; ordinal b. nominal; interval c. ordinal; interval d. interval; ratioANSWER: aPOINTS: 1DIFFICULTY: EasyREFERENCES: DataLEARNING OBJECTIVES: MBST.ASWC.18.01.02 - 1.2NATIONAL STANDARDS: United States - Business Program.1: - Reflective
ThinkingKEYWORDS: Bloom's: Knowledge
Copyright Cengage Learning. Powered by Cognero. Page 25
Full file at https://testbanku.eu/71. The term data warehousing is used to refer to the process of doing all of the following, except _____ the data. a. capturing b. storing c. maintaining d. miningANSWER: dPOINTS: 1DIFFICULTY: EasyREFERENCES: Big Data and Data MiningLEARNING OBJECTIVES: MBST.ASWC.18.01.08 - 1.8NATIONAL STANDARDS: United States - Business Program.1: - Reflective
ThinkingKEYWORDS: Bloom's: Knowledge
72. _____ is the process of using procedures from statistics and computer science to extract useful information from extremely large databases. a. Big data b. Analytics c. Data warehousing d. Data miningANSWER: dPOINTS: 1DIFFICULTY: EasyREFERENCES: Big Data and Data MiningLEARNING OBJECTIVES: MBST.ASWC.18.01.08 - 1.8NATIONAL STANDARDS: United States - Business Program.1: - Reflective
ThinkingKEYWORDS: Bloom's: Knowledge
Copyright Cengage Learning. Powered by Cognero. Page 26
Full file at https://testbanku.eu/73. After the graduation ceremonies at a university, six graduates were asked whether they were in favor of (identified by 1) or against (identified by 0) abortion. Some characteristics of these graduates are shown below.
Graduate Sex Age Abortion Issue Class Rank 1 F 22 1 3 2 M 21 1 2 3 F 33 0 1 4 M 38 0 20 5 F 25 1 4 6 M 19 0 8
a. How many elements are in the data set?b. How many variables are in the data set?c. How many observations are in the data set?
d. Identify the scale of measurement for each of the above (Sex, Age, Abortion Issue, Class Rank).
e. Which of the above (Sex, Age, Abortion Issue, Class Rank) are categorical, and which are quantitative variables?
f. Are arithmetic operations appropriate for the variable "abortion issue"?
ANSWER: a. 6b. 4c. 6d. Sex: nominal Age: ratio Abortion Issue: nominal Class Rank: ordinale. Sex: categorical Age: quantitative Abortion Issue: categorical Class Rank: categoricalf. No
POINTS: 1DIFFICULTY: EasyREFERENCES: DataLEARNING OBJECTIVES:
MBST.ASWC.18.01.02 - 1.2
NATIONAL STANDARDS: United States - Business Program.1: - Reflective ThinkingKEYWORDS: Bloom's: Knowledge
Copyright Cengage Learning. Powered by Cognero. Page 27
Full file at https://testbanku.eu/74. An issue of Fortune Magazine reported the following companies had the lowest sales per employee among the Fortune 500 companies.
Company Sales per Employee ($ thousands) Sales Rank Seagate Technology 42.20 285 SSMC 42.19 414 Russell 41.99 480 Maxxam 40.88 485 Dibrell Brothers 22.56 470
a. How many elements are in the above data set?b. How many variables are in the above data set?c. How many observations are in the above data set?d. Name the scale of measurement for each of the variables.e. Name the variables and indicate whether they are categorical or quantitative.
ANSWER: a. 5b. 2c. 5d. Sales per Employee: ratio; Sales Rank: ordinale. Sales per Employee: quantitative; Sales Rank: categorical
POINTS: 1DIFFICULTY: EasyREFERENCES: DataLEARNING OBJECTIVES:
MBST.ASWC.18.01.02 - 1.2
NATIONAL STANDARDS:
United States - Business Program.1: - Reflective Thinking
KEYWORDS: Bloom's: Knowledge
Copyright Cengage Learning. Powered by Cognero. Page 28

Full file at https://testbanku.eu/75. The following shows the temperatures (high, low) and weather conditions on a given Sunday for seven world cities. For the weather conditions, the following notations are used: c = clear; cl = cloudy; sh = showers; pc = partly cloudy.
City Hi Lo Condition Acapulco 99 77 pc Bangkok 92 78 pc Mexico City 77 57 sh Montreal 72 56 pc Paris 77 58 c Rome 88 68 cl Toronto 78 61 c
a. How many elements are in this data set?b. How many variables are in this data set?c. How many observations are in this data set?d. Name the scale of measurement for each of the variables.e. Name the variables and indicate whether they are categorical or quantitative.f. For which variables are arithmetic operations appropriate, and for which are they not
appropriate?
ANSWER: a. 7b. 3c. 7d. Hi: interval, Lo: interval, Condition: nominale. Hi: quantitative, Lo: quantitative, Condition: categoricalf. Hi: appropriate, Lo: appropriate, Condition: not appropriate
POINTS: 1DIFFICULTY: EasyREFERENCES: DataLEARNING OBJECTIVES:
MBST.ASWC.18.01.02 - 1.2
NATIONAL STANDARDS:
United States - Business Program.1: - Reflective Thinking
KEYWORDS: Bloom's: Knowledge
Copyright Cengage Learning. Powered by Cognero. Page 29

Full file at https://testbanku.eu/76. A magazine surveyed a sample of its subscribers. Some of the responses from the survey are shown below.
Annual Household Subscriber ID Sex Age Income ($1000s) 0006 F 22 45 4798 M 21 53 2291 F 33 82 4988 M 38 30
a. How many elements are in the data set?b. How many variables are in the data set?c. How many observations are in the data set?d. Name the scale of measurement for each of the variables.e. Which of the above (Sex, Age, Annual Household Income) are categorical, and which
are quantitative? f. Are the data time series or cross-sectional?
ANSWER: a. 4b. 3c. 4d. Sex: nominal, Age: ratio, Annual Household Income: ratioe. Sex: categorical, Age: quantitative, Annual Household Income: quantitativef. cross-sectional
POINTS: 1DIFFICULTY: EasyREFERENCES: DataLEARNING OBJECTIVES:
MBST.ASWC.18.01.02 - 1.2
NATIONAL STANDARDS:
United States - Business Program.1: - Reflective Thinking
KEYWORDS: Bloom's: Knowledge
Copyright Cengage Learning. Powered by Cognero. Page 30

Full file at https://testbanku.eu/77. A magazine surveys a sample of its subscribers every year. Some of the responses are shown below.
Percent Average Average Annual Year Female Age Household Income ($1000s) 1996 5.8 35.2 40 1997 8.6 35.8 42 1998 7.3 33.9 41 1999 9.2 35.3 43 2000 9.8 36.6 46
a. How many variables are in the data set?b. Name the scale of measurement for each variable.c. Which of the above (Year, Percent Female, Average Age, Average Annual Household
Income) are categorical, and which are quantitative? d. Are the data time series or cross-sectional?
ANSWER: a. 4b. Year: interval, Percent Female: ratio, Average Age: ratio, Average Annual Household
Income: ratio c. all are quantitatived. time series
POINTS: 1DIFFICULTY: EasyREFERENCES: Big Data and Data MiningLEARNING OBJECTIVES:
MBST.ASWC.18.01.02 - 1.2
NATIONAL STANDARDS:
United States - Business Program.1: - Reflective Thinking
KEYWORDS: Bloom's: Knowledge
Copyright Cengage Learning. Powered by Cognero. Page 31
Full file at https://testbanku.eu/78. The following data show the yearly income distribution of a sample of 200 employees at MNM, Inc.
Yearly Income ($1000s) Number of Employees 20 − 24 2 25 − 29 48 30 − 34 60 35 − 39 80 40 − 44 10
a. What percentage of employees have a yearly incomes of at least $35,000?b. Is the figure (percentage) that you computed in Part a. an example of statistical inference? If
not, what kind of statistics does it represent? c. Based on this sample, the president of the company said that "45% of all our employees'
yearly incomes are at least $35,000." The president's statement represents what kind of statistics?
d. With the statement made in Part c., can we be assured that more than 45% of all employees' yearly incomes are at least $35,000? Explain.
e. What percentage of employees of the sample have a yearly income of less than $30,000?f. How many variables are presented in the above data set?g. The above data set represents the results of how many observations?
ANSWER: a. 45%b. No, it is descriptive statistics.c. statistical inferenced. No, this is simply an inference and approximation based on the sample information.e. 25%f. 2g. 200
POINTS: 1DIFFICULTY: EasyREFERENCES: DataLEARNING OBJECTIVES:
MBST.ASWC.18.01.02 - 1.2
NATIONAL STANDARDS:
United States - Business Program.1: - Reflective Thinking
KEYWORDS: Bloom's: Knowledge
Copyright Cengage Learning. Powered by Cognero. Page 32

Full file at https://testbanku.eu/79. A recent issue of a national magazine reported that in a national public opinion survey conducted among 2,000 individuals, 56% were in favor of gun control, 40% opposed gun control, and 4% had no opinion on the subject.a. What is the sample in this survey?b. Based on the sample, what percentage of the population would you think is in favor of gun
control? c. Based on the sample, what percentage of the population would you think have no opinion on
the subject?
ANSWER: a. the 2,000 individuals who were approachedb. 56%c. 4%
POINTS: 1DIFFICULTY: EasyREFERENCES: Statistical InferenceLEARNING OBJECTIVES:
MBST.ASWC.18.01.05 - 1.5
NATIONAL STANDARDS:
United States - Business Program.1: - Reflective Thinking
KEYWORDS: Bloom's: Knowledge
80. A pharmaceutical company is performing clinical trials on a new drug that is intended to relieve symptoms for allergy sufferers. Twelve percent of the 300 clinical trial participants experienced dry mouth as a side effect.a. What is the population being studied?b. What is the sample being studied?
c. Based on the sample, what percentage of the population do you think would suffer from dry mouth?
ANSWER: a. all allergy sufferersb. the 300 participantsc. 12%
POINTS: 1DIFFICULTY: EasyREFERENCES: Statistical InferenceLEARNING OBJECTIVES:
MBST.ASWC.18.01.05 - 1.5
NATIONAL STANDARDS:
United States - Business Program.1: - Reflective Thinking
KEYWORDS: Bloom's: Knowledge
Copyright Cengage Learning. Powered by Cognero. Page 33
Full file at https://testbanku.eu/81. A polling organization conducts a telephone poll of 850 registered voters and asks which candidate they will vote for in the upcoming presidential election. Forty-three percent of the respondents prefer candidate A and 45% prefer candidate B.a. What is the population being studied?b. What is the sample being studied?c. Based on the sample, what percentage of the population do you think would vote for candidate
B?
ANSWER: a. all registered votersb. the 850 registered voters who were polledc. 45%
POINTS: 1DIFFICULTY: EasyREFERENCES: Statistical InferenceLEARNING OBJECTIVES:
MBST.ASWC.18.01.05 - 1.5
NATIONAL STANDARDS:
United States - Business Program.1: - Reflective Thinking
KEYWORDS: Bloom's: Knowledge
82. The following table shows the starting salaries of a sample of recent business graduates.
Income ($1000s) Number of Graduates 15 − 19 40 20 − 24 60 25 − 29 80 30 − 34 18 35 − 39 2
a. What percentage of graduates in the sample had starting salaries of at least $30,000?b. Of the graduates in the sample, what percentage had starting salaries of less than $25,000?
c. Based on this sample, what percentage of all business graduates do you estimate to have starting salaries of at least $20,000?
ANSWER: a. 10%b. 50%c. 80%
POINTS: 1DIFFICULTY: EasyREFERENCES: Statistical InferenceLEARNING OBJECTIVES:
MBST.ASWC.18.01.05 - 1.5
NATIONAL STANDARDS:
United States - Business Program.1: - Reflective Thinking
KEYWORDS: Bloom's: Knowledge
Copyright Cengage Learning. Powered by Cognero. Page 34

Full file at https://testbanku.eu/83. Michael, Inc., a manufacturer of electric guitars, is a small firm with 50 employees. The table below shows the hourly wage distribution of the employees.
Hourly Wages (In Dollars) Number of Employees 10 − 13.99 8 14 − 17.99 12 18 − 21.99 20 22 − 25.99 10
a. How many employees receive hourly wages of at least $18?b. What percentage of the employees has hourly wages of at least $18?c. What percentage of the employees has hourly wages of less than $14?
ANSWER: a. 30b. 60%c. 16%
POINTS: 1DIFFICULTY: EasyREFERENCES: DataLEARNING OBJECTIVES:
MBST.ASWC.18.01.02 - 1.2
NATIONAL STANDARDS:
United States - Business Program.1: - Reflective Thinking
KEYWORDS: Bloom's: Knowledge
Copyright Cengage Learning. Powered by Cognero. Page 35
Full file at https://testbanku.eu/84. Laura Naples, manager of Heritage Inn, periodically collects and tabulates information about a sample of the hotel’s overnight guests. This information aids her in planning and scheduling decisions she must make. The table below lists data on 10 randomly selected hotel registrants, collected as the registrants checked out. The data listed for each registrant are: number of people in the group; birth date of person registering; shuttle service used, yes or no; total telephone charges incurred; and reason for stay, business or personal.
ID ofRegistrant
Number ofPeople
in Group
BirthDate
(mm/dd/yy)
ShuttleUsed
TelephoneCharges
Reasonfor Stay
01 1 05/07/59 yes $ 0.00 personal02 4 11/23/48 no 12.46 business03 2 04/30/73 no 1.20 business04 2 12/16/71 no 2.90 business05 1 05/09/39 yes 0.00 personal06 3 09/14/69 yes 4.65 business07 2 04/22/66 no 9.35 personal08 5 10/28/54 yes 2.10 personal09 1 11/12/49 no 1.85 business10 2 01/30/62 no 5.80 business
a. How many elements are there in the data set?b. How many variables are there in the data set?c. How many observations are there in the data set?d. What are the observations for the second element listed?e. What is the total number of measurements in the data set?f. Which variables are quantitative?g. Which variables are qualitative?h. What is the scale of measurement for each of the variables?i. Does the data set represent cross-sectional or times series data?j. Does the data set represent an experimental or an observational study?
ANSWER: a. 10 elementsb. 5 variablesc. 10 observationsd. 4, 11/23/48, no, 12.46, businesse. 50f. people in group, telephone chargesg. birth date, shuttle used, reason for stayh. people in group – ratio scale, birth date – ordinal scale, shuttle use – nominal, telephone charge – ratio scale, reason for stay – nominal scalei. cross-sectionalj. observational
POINTS: 1DIFFICULTY: EasyREFERENCES: DataLEARNING OBJECTIVES:
MBST.ASWC.18.01.02 - 1.2
NATIONAL STANDARDS:
United States - Business Program.1: - Reflective Thinking
KEYWORDS: Bloom's: Knowledge
Copyright Cengage Learning. Powered by Cognero. Page 36
Full file at https://testbanku.eu/85. Molly Porter owns and operates two convenience stores, one on the East side of the city and the other on the South side. She has workforce-planning decisions to make and has collected some recent sales data that are relevant to her decisions. Listed below are the monthly sales ($1000s) at her two stores for the past six months.
Store March April May June July AugustEast 102 100 103 105 109 106
South 72 74 81 86 92 93
a. Is the data set cross-sectional or time series data? Explain.b. Comment on any apparent patterns you see in the data.
ANSWER:
a. Time series data for two variables: monthly sales for East store and monthly sales for South store.b. Both stores have been experiencing an overall rise in sales during the past six months. The South store’s increase in sales (as a percentage of sales) has been greater than the East store’s increase. The increases might be temporary, due to the seasonal nature of demand. It is also possible that the increases will continue.
POINTS: 1DIFFICULTY:
Easy
REFERENCES:
Data
LEARNING OBJECTIVES:
MBST.ASWC.18.01.02 - 1.2
NATIONAL STANDARDS:
United States - Business Program.1: - Reflective Thinking
KEYWORDS:
Bloom's: Knowledge
Copyright Cengage Learning. Powered by Cognero. Page 37
Full file at https://testbanku.eu/86. The following table shows the starting salaries of a sample of recent VoTech graduates.
Income (Rounded to $1000s) Number of Graduates25 29 4030 34 6035 39 8040 44 1845 49 2
a. What percentage of graduates in the sample had starting salaries of at least $40,000?b. Of the graduates in the sample, what percentage had starting salaries of less than $35,000?c. Based on this sample, what percentage of all VoTech graduates do you estimate to have starting salaries of at least $30,000?
ANSWER: a. 10%b. 50%c. 80%
POINTS: 1DIFFICULTY: EasyREFERENCES: DataLEARNING OBJECTIVES: MBST.ASWC.18.01.02 - 1.2NATIONAL STANDARDS: United States - Business Program.1: - Reflective
ThinkingKEYWORDS: Bloom's: Knowledge
87. Suppose the current weather report for your area contains the following information. Specify the measurement scale for each of the variables.
a. Temperature 84o
b. Wind Speed 10 mph c. Wind Direction (from the) South d. Sky Description Sunny e. Molds Level High
ANSWER: a. Temperature – intervalb. Wind Speed – ratioc. Wind Direction – nominald. Sky Description – nominale. Molds Level – ordinal
POINTS: 1DIFFICULTY: EasyREFERENCES: DataLEARNING OBJECTIVES: MBST.ASWC.18.01.02 - 1.2NATIONAL STANDARDS: United States - Business Program.1: - Reflective
ThinkingKEYWORDS: Bloom's: Knowledge
Copyright Cengage Learning. Powered by Cognero. Page 38