agriculture.vic.gov.auagriculture.vic.gov.au/.../word_doc/0019/292213/...2014-… · web...
TRANSCRIPT
Victoria's Grape Industry
December 2014 Update
Key points This Grape Industry Profile provides an overview of the location, structure, production and performance of
Victoria's grape industry.
Victoria's grape growing industry supplies three distinct markets – wine, dried and table (i.e. 'ready to eat' fruit).
In 2012-13, there were 2,048 grape growing businesses operating in Victoria, which represents approximately 31 per cent of all grape growing businesses in Australia.
In 2012-13, 358,719 tonnes (or 82 per cent) of Victoria's grapes were produced for wine making and 76,972 (18 per cent) tonnes have been produced for all other uses including dry and table grapes.
In 2012-13, the gross value of grape production in Victoria was $323 million (28 per cent of the national value of grape production). Wine grape production in Victoria had a gross value of $149 million in 2012-13, while table and dried grape production had a combined gross value of $174 million.
With approximately 24 per cent of Australia's wine grape plantings area in 2012-13, Victoria is the third largest wine grape producing state, behind South Australia and New South Wales. In 2012-13, Victoria was the largest table and dried grape producing state, with 64 per cent of Australian production of dry and fresh grapes combined.
In 2012-13, the estimated Victorian wine grape production of 358,719 tonnes represented a 29 per cent increase from 2011-12, primarily due to improved match between the supply and demand for grapes and wine in Australia.
Table grape exports continued to improve. In 2013-14, table grapes exports were valued at $227 million which is 16 per cent higher than the previous year.
Structure of Victoria's wine grape industryIn 2012-13, there were 1,573 wine grape production businesses. The estimated total area of wine grape production (bearing and non-bearing) in Victoria was 29,221 ha.
These businesses include both independent growers who sell grapes to wineries and wineries that grow their own grapes. In general, grape growing businesses are small, with around 80 per cent of those in Australia being 49 hectares or less in area. In 2010-11, 2,015 persons were estimated to be employed growing grapes in Victoriai.
While many small winery operations produce and sell wine, the industry is dominated by five large companies which accounted for more than 53 per cent of the national wine grape intake in 2013 (see Table 1) ii. All five have a presence in Victoria.
Table 1 – Australia's largest wine companies by intake
Wine Company Rank
Accolade Wines 1
Treasury Wine Estates 2
Casella Wines 3
Australian Vintage 4
Pernod Ricard Winemakers 5
Location of Victoria’s wine grape industryThe grapes growing regions of Victoria are Central Victoria, North East Victoria, North West Victoria, Western Victoria, Port Phillip and Gippsland (see Figure 1). Victoria's wine grape production occurs mainly in north-west Victoria (74 per cent of 2012-13 production), with production also occurring in the north-east (8 per cent), Port Phillip and Western Port (7 per cent) and a very small proportion in other parts of Victoriaiii.
1
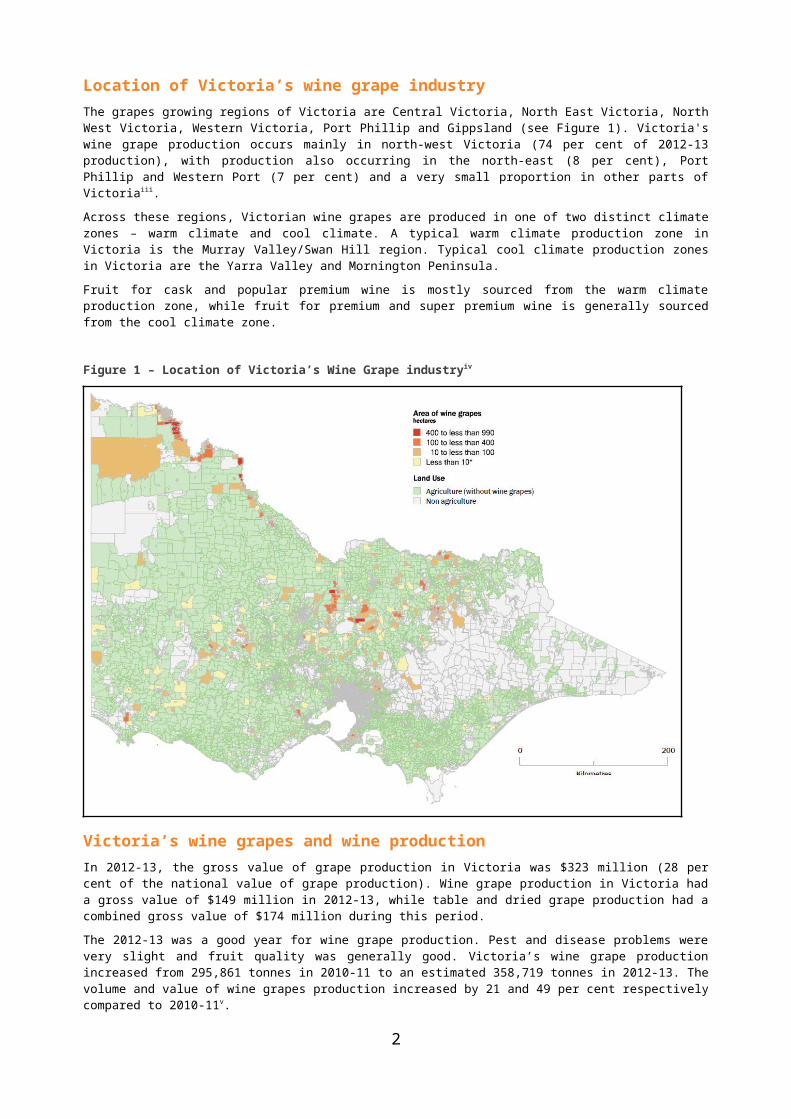
Across these regions, Victorian wine grapes are produced in one of two distinct climate zones – warm climate and cool climate. A typical warm climate production zone in Victoria is the Murray Valley/Swan Hill region. Typical cool climate production zones in Victoria are the Yarra Valley and Mornington Peninsula.
Fruit for cask and popular premium wine is mostly sourced from the warm climate production zone, while fruit for premium and super premium wine is generally sourced from the cool climate zone.
Figure 1 – Location of Victoria’s Wine Grape industryiv
Victoria’s wine grapes and wine productionIn 2012-13, the gross value of grape production in Victoria was $323 million (28 per cent of the national value of grape production). Wine grape production in Victoria had a gross value of $149 million in 2012-13, while table and dried grape production had a combined gross value of $174 million during this period.
The 2012-13 was a good year for wine grape production. Pest and disease problems were very slight and fruit quality was generally good. Victoria’s wine grape production increased from 295,861 tonnes in 2010-11 to an estimated 358,719 tonnes in 2012-13. The volume and value of wine grapes production increased by 21 and 49 per cent respectively compared to 2010-11v.
In 2012-13, a total of 344,740 tonnes of wine grapes were crushed in Victoria. Approximately 48 per cent (or 163,437 tonnes) of the crush was red wine grape varieties, and approximately 52 per cent (or 181,303 tonnes) of the crush was white wine grape varietiesvi.
Victoria’s exports and imports of wineIn 2013-14, Victoria exported 55 million litres of wine, worth around $182 million. These exports included $121 million of red wine, $38 million of white wine and $19 million of sparkling wine. The key export markets in 2013-14 were China, the United Kingdom, and the United States of America.
2

Figure 4 – Value of wine imports and exports from Victoria vii
2009-10 2010-11 2011-12 2012-13 2013-140
50
100
150
200
250Import Export
Historically the value of Victorian exports has been greater than imports despite a declining trend between 2009-10 and 2013-14 (Figure 4). However, since 2012-13, the value of exports was less than that of imports. This is due to a combination of factors. The high exchange rate has been a major contributor to the decline in the international competitiveness of the Victorian wine industry. Australia has had the largest appreciation of all wine-exporting countries; its winemakers are estimated to have suffered the largest reduction in value of exports. The value of Victorian exports declined by 20 per cent between 2010-11 and 2013-14.
Victorian wine imports increased steadily from 13 million litres worth $65 million in 2009-10, to 25 million litres worth $222 million in 2013-14 (see Figure 5). In 2013-14, imports consisted of 13 million litres of white wine, 7 million litres of red wine and 5.4 million litres of sparkling wine. The white wine was imported from New Zealand, France, Italy and United States of America. Red wine imports came from France, Italy, Spain and New Zealand.
Figure 5 – Volume of wine imports and exports from Victoria viii
2009-10 2010-11 2011-12 2012-13 2013-140
20
40
60
80
100
120Import Export
Victoria’s table and dried grape productionIn 2012-13, 744 tables and other grape growers were operating in Victoria, representing around 67 per cent of all dried and table grape growers in Australia. In 2012-13, Victoria produced an estimated 76,972 tonnes of table and dried grapes combined, equivalent to 64 per cent of Australia’s production.
3
$ million
million litres
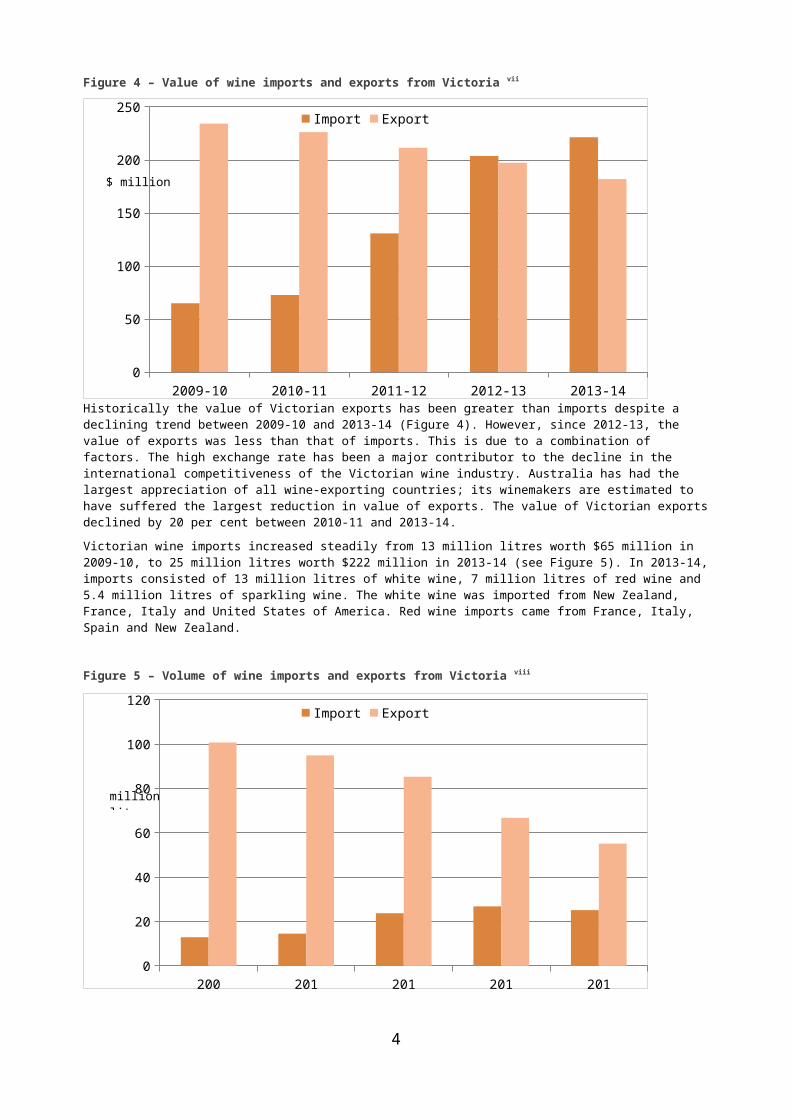
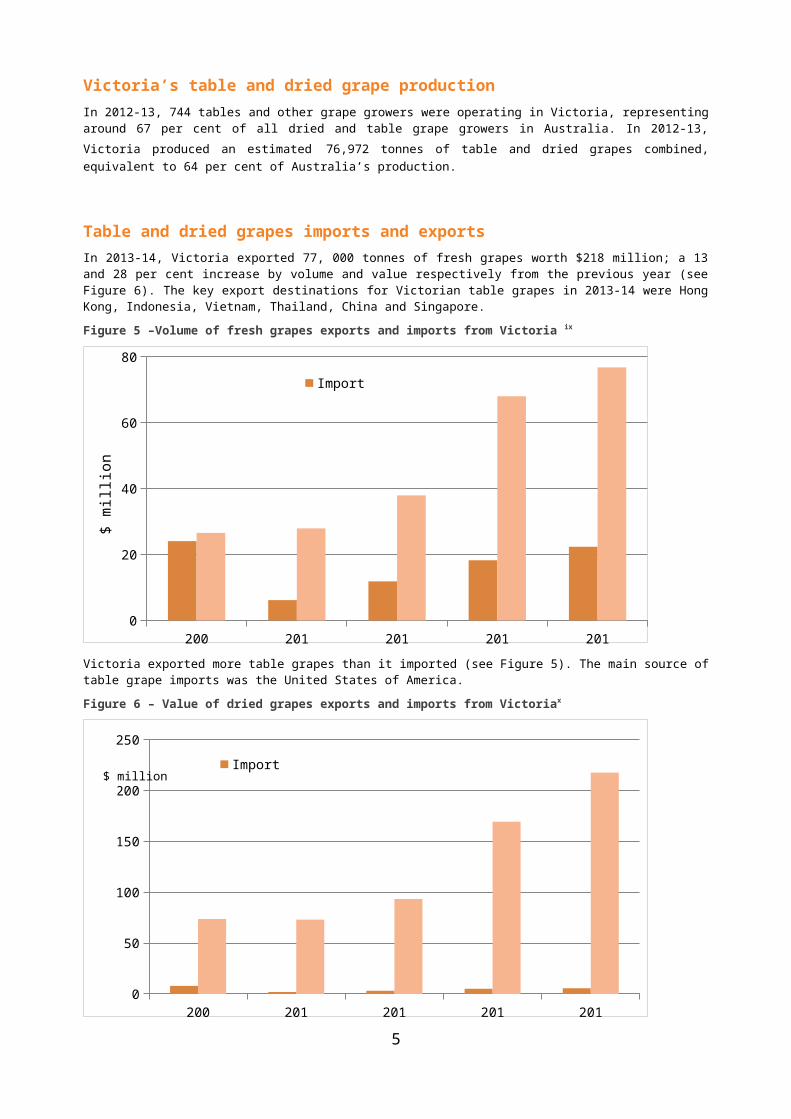
Table and dried grapes imports and exports In 2013-14, Victoria exported 77, 000 tonnes of fresh grapes worth $218 million; a 13 and 28 per cent increase by volume and value respectively from the previous year (see Figure 6). The key export destinations for Victorian table grapes in 2013-14 were Hong Kong, Indonesia, Vietnam, Thailand, China and Singapore.
Figure 5 –Volume of fresh grapes exports and imports from Victoria ix
2009-10 2010-11 2011-12 2012-13 2013-140
20
40
60
80
Import Export
$ m
illio
n
Victoria exported more table grapes than it imported (see Figure 5). The main source of table grape imports was the United States of America.
Figure 6 – Value of dried grapes exports and imports from Victoriax
2009-10 2010-11 2011-12 2012-13 2013-140
50
100
150
200
250
Import Export
In 2013-14, Victoria exported 2,666 tonnes of dried grapes worth $9 million, a 139, and 90, per cent increase by volume, and value, respectively, from the previous year. Key markets for dried grapes included Germany, Italy and Canada. In 2013-14, Victoria’s imports of dried grapes exceeded exports. The main sources of dried grape imports were Turkey, the United States of America, China and Chile.
4
$ million
Challenges and opportunities The Victorian wine grapes and table grapes industry, like many agricultural industries, faces many challenges and opportunities.
Challenges for wine grapes
The Australian wine grapes industry has been challenged by an oversupply of both grapes and wine making capacity which has driven prices down, and made it difficult for many producers to meet their cost of production.
The highly fragmented nature of the industry which is made up of a number of small producers who do not benefit from the economies of scale.
The high Australian dollar has caused difficulties for Australian producers competing in the export market where relative buying power has moved unfavourably for Australian wines.
Variable weather conditions High cost of production relative to their competitors.
Opportunities for wine grapes
The main opportunities for future growth are seen to come from export markets but are dependent primarily on an improvement in the exchange rate.
Long established expertise in growing both dryland and irrigated grapes.
Challenges to tables grapes
Increasing international competition to already established markets. Other producers from the Southern Hemisphere have already established market access to China.
Maintaining market access and managing fruit fly concerns with trading partners.
Opportunities for table grapes
The table grapes industry already has legal market access into China and the quality of grapes from Australia is rated highly by Chinese consumers.
Strong export focus by businesses and corporates.
Government policy/regulation influencesGrape growers in north-west Victoria must comply with control measures specified by the Victorian government under its Queensland fruit fly control program. These measures are designed to control seasonal outbreaks of this pest species. The presence of Queensland fruit fly has an adverse impact on the ‘pest free’ status of the horticulture industry within the region, which in turn affects the industry’s access to export markets.
Grape Phylloxera is an aphid that feeds on the roots of susceptible grape vine types, reducing the vigour of the vines and consequently the yield of grapes. There is no effective control method for this pest once it becomes established in an area, other than to remove and replant the vines using Phylloxera resistant root stock. Under the Plant Health and Plant Products Act 1995, the Victorian government has declared specific areas in Victoria to be Phylloxera Infested Zones where the aphid has been found to be present, and Phylloxera Exclusion Zones where it has not. This regulation imposes strict conditions on the movement of host materials into, within or between the respective zones, in order to safeguard the productivity of vineyards which do not utilise Phylloxera resistant root stocks.
The Victorian government has provided funding of $4 million over four years commencing in 2011-12 to establish a ‘centre of expertise’ for investigating smoke taint of wine grapes in Victoria. This program builds on existing research aimed at identifying the mechanisms and potential mitigation measures for avoiding smoke taint in Victoria. Smoke may become widespread in some of Victoria’s wine grape growing areas at certain times of the year due to wildfire, planned burning on public land and burning of agricultural crop residues.
5

i ABS, 2011 Census of population and Housing ii GTIS, (ABS, Australian Customs data) 2014iii ABS, Agricultural Commodities Australia, 7121.0, 2012-13iv Australian Bureau of Statistics (ABS). Based on AGS2011 Mesh Block Boundaries. Area of wine grapes sourced from the 2010-11 Agricultural Census. Land use based on ASGS2011 Mesh Block Use Categories. This map was produced using coordinate system: Lat/Long GDA94 © Commonwealth of Australia, 2014v ABS Value of Agricultural Commodities produced, 7503, 2012-13. vi ABS - Australian Wine and Grape Industry, 1329.0, 2012-13vii GTIS, (ABS, Australian Customs data) 2014viii GTIS, (ABS, Australian Customs data) 2014ix GTIS, (ABS, Australian Customs data) 2014x GTIS, (ABS, Australian Customs data) 2014