web viewthe world bank database also includes an annual country measure of bond market ... fairfield...
TRANSCRIPT
FIN around the world: the contribution of financing activity to profitability
Russell [email protected]
George [email protected]
Gwen [email protected]
May 2013
Abstract
We study how the availability of domestic credit influences the contribution that financing activities make to a firm’s return on equity (ROE). Using a sample of 51,866 firms from 69 countries, we find that financing activities contribute more to a firm’s ROE in countries with higher domestic credit. However, the path from available credit to firm profitability varies significantly between small firms and large firms. More domestic credit allows small firms to increase their leverage ratio but has no effect on the leverage ratio of large firms, presumably because the smaller firms are the marginal borrowers. However, large firms still benefit more from domestic credit because they have higher leverage ratios to begin with, and countries with more available domestic credit have lower borrowing costs. We also show that the use of trade credit complements the use of financial credit, but that the availability of domestic credit only strengthens this relation for the largest firms in the economy. Finally, we show that large increases in domestic credit are followed by significant increases in the financing contribution to ROE in the subsequent year.
Keywords: Domestic Credit, Financial Statement Analysis, Return on Equity, Corporate Performance
We would like to thank Bill Beaver, Kimball Chapman, Ivan Marinovic, Mohan Venkatachalam (discussant), and workshop participants at the 2013 FARS Midyear Meeting, McGill University, Pennsylvania State University, Stanford University, University of Calgary, and UNC Chapel Hill for comments on an earlier draft of this manuscript. George Serafeim and Gwen Yu acknowledge financial support from the Division of Research at the Harvard Business School. All errors are our own.

1. Introduction
The main objective of financial statement analysis is to understand the different sources
of a firm’s profitability, typically measured as the return on equity. Further, a basic premise of
financial economics is that financial markets aid the flow of capital to its best use. In a
frictionless world every firm’s return on equity would equal the firm’s cost of equity capital.
However, numerous frictions at the firm and country level cause return on equity to vary
considerably within and across countries. We study one prominent friction, the availability of
domestic credit from banks, and ask how this friction influences the contribution that financing
activities make to the firm’s return on equity.1
There is ample evidence that financial development in a country eases firms’ financing
constraints and consequently has a positive influence on the country’s growth (see Levine 2005
for a review). But these findings do not imply that the growth is profitable to the corporate
sector. In fact, if there are diminishing marginal returns to investment then more growth may
result in less profitability (see, for example, Fairfield et al. 2003). Further, previous research has
argued that the benefits of better financial market development should accrue primarily to
smaller firms in a country because they are the marginal borrowers (Love 2003 and Beck et al.
2005). Because small firms are relatively less profitable than large firms (e.g., Hall and Weiss
1967, Fama and French 1995, or Li et al. 2012), it is not clear how more rapid growth funded by
easier access to debt capital will influence their return on equity.2
To better understand the source of a firm’s performance, it is common to decompose a
1 Li et al. (2012) tackle the operating contribution to ROE by modeling how a firm’s international segment mix can be combined with country-level profitability forecasts to yield predictions of firm-level return on assets. 2 Jeremy Grantham, Chief Strategist of GMO Capital, remarked in an interview with Pat Dorsey of Morningstar on May 28, 2009 that “in the end, returns to the stock market are overwhelming to do with return on capital. It isn’t about top-line growth….growth countries have no history of reliably beating slower growth countries, although everyone thinks it is the case.”
1

firm’s return on equity into the amount earned from the net operating assets and the incremental
contribution created by financing activities. Because equity owners claim all the residual profit
after satisfying the debt payments, financial leverage increases the return on equity when the net
operating assets are more profitable than the cost of borrowing. The financing contribution to
return on equity is thus the product of financial leverage and the spread between the return on net
operating assets and the net borrowing cost. We investigate how differences in the availability of
domestic credit across countries influence the resulting leverage, spread, and the net financing
contribution to firms’ return on equity.
We hypothesize that net borrowing costs are lower in countries with more domestic credit.
All else equal, lower net borrowing costs means that the spread between the return on net assets
and the net borrowing cost is higher. Further, lowering the cost of borrowing should increase the
amount that firms borrow, thus raising the leverage ratio. Consequently, both components of the
financing contribution to return on equity, leverage and spread, are hypothesized to increase with
available domestic credit. There are two forces working against this simple logic.
First, firms in low domestic credit countries may have adapted such that they can
effectively gain financial leverage through their operating decisions. For instance, if suppliers
grant firms in these countries longer trade terms, and charge slightly higher prices, then the
suppliers are effectively lending the firm money and charging interest. In this case, firms
substitute operating leverage for financial leverage, where the counterparty plays both an
operating and a financing role in the economy. Alternatively, trade credit can serve as a signal
about financial credit worthiness, making the two sources of credit to be complementary. Finally,
trade credit serves many purposes beyond financing downstream customers, and so it is unclear
how strong any relation may be between trade credit and financial credit (see Fisman and Love
2
2003 for a theory of trade credit).
The second force working against a simple relation between domestic credit and the
financing contribution to profitability is an empirical regularity that is not fully understood. One
would think that firms with better operating performance would employ greater levels of
financial leverage and thus enjoy even higher returns on equity. A long-standing puzzle in the
finance and accounting literature is that this is not the case – firms that earn more tend to borrow
less (see, for example, Rajan and Zingales 1995 or Nissim and Penman 2001). We observe this
relation in our data as well, but find that this behavior does not determine the contribution of
financing to the return on equity. By studying only one part of the financial contribution –
leverage – this literature misses the other important piece of the puzzle – the spread. We show
that both components of the financing contribution are increasing with domestic credit,
especially for the smallest firms in the economy. However, because firms with the highest
spreads tend to have the lowest leverage, the net effect on the financing contribution is more
muted than what a simple analysis would suggest.
A common theme running through all our results is that the influence of domestic credit in
a country depends critically on the relative size of the firm in its home economy. This may be
because small firms present greater information asymmetries to credit providers, or because
small firms are fundamentally less credit worthy. The simple observation that small firms are
fundamentally different than large firms in terms of financing options is echoed in Beck et al.
(2008) who find in survey data that small firms claim that they receive relatively less bank
financing and cannot compensate for this lack of financial credit with trade credit.
To examine these questions we collect 31 years of financial data for firms in 69 different
countries. After controlling for a firm’s operating performance, as well as for year and industry
3
fixed effects, we find that the financing contribution to return on equity increases with available
domestic credit in the country. A unit increase in domestic credit as a percent of gross domestic
product (roughly the difference between Ireland and the United States) corresponds to a 1.3
percent increase in the financing contribution for the largest tercile of firms in their respective
economies, but only a 1.0 percent increase for the smallest tercile of companies. Interestingly,
the smallest firms enjoy the largest increases in spread and the largest increases in leverage, and
yet have smaller increases in the financing contribution relative to the largest firms. This
surprising combination occurs because the financing contribution is the product of spread and
leverage, and so the marginal effect of each is increasing in the level of the other. So while the
spread and leverage of the smallest firms in the economy respond the most to the level of
domestic credit, the largest firms in the economy have the highest levels of spread and leverage,
with the net effect that the largest firms enjoy slightly more benefits from domestic credit than
the smallest firms.
We also find that trade credit and financial credit are complements. After controlling for
operating performance, a one percent increase in the contribution from trade credit is associated
with a 0.712 percent increase in the financing contribution. More importantly, we find that the
complementarity between trade credit and financial credit is higher in countries with more
available domestic credit, but only for the largest tercile of firms in the country. This is
consistent with the view that, for small and medium sized firms in any country, trade credit
serves purposes beyond financing operations, so more domestic credit has no effect on their
behavior. For these firms trade credit helps resolve the information asymmetry and agency
problems between the firm and its upstream supplier, and these forces don’t vary with available
domestic credit. Large firms, on the other hand, have solved their information asymmetry and
4

agency problems in different ways, so their use of trade credit responses to the available
domestic credit in the country.
Because our dataset covers 31 years, 69 countries, and 51,866 firms, we can control for
substantial cross-sectional correlation between firm-year residuals. Our results are based on
regressions with standard errors clustered at the year and country level, allowing for a general
pattern of within-country and within-year residual correlation. We also corroborate our cross-
sectional results with an analysis of large changes in available domestic credit. We find that
increases in domestic credit are positively associated with future increases in the financial
contribution to ROE, and that changes in operating performance and trade performance are
positively associated with changes in the financing contribution, all consistent with our larger
cross-sectional model.
The rest of the paper proceeds as follows. In the next section we decompose the return on
equity into an operating component, a trade credit component, and a financing component. In
section three we summarize the relevant literature and develop hypotheses for how the
availability of domestic credit influences the financing component, and map out a path the
influence might take. In section four we describe our data and empirical measures, and present
some summary statistics. We present our main results in section five and conclude in section six.
2. Return on Equity Decomposition
The study of firm performance in accounting has used the Dupont decomposition as a
means of identifying the relative contribution of different firm activities. Nissim and Penman
(2001) originally documented a number of summary statistics about margins, turnover ratios, and
leverage for a large panel of US firms from 1963 to 1999. Nissim and Penman (2003) further
5

distinguished between operating and financial leverage and showed that this distinction aids in
the prediction of future return on equity. We closely follow the decomposition proposed in
Nissim and Penman (2003) and divide the return on equity into three different components as
described below. The Datastream variable definitions are given in the footnotes.
Consider two decompositions of return on equity. The first is found in most financial
statement analysis textbooks (see Lundholm and Sloan 2007, Penman 2010, or Palepu et al.
2004):
ROE = Net Income/Common Equity
= RNOA + LEV * (RNOA – NBC), where
RNOA is Return on Net Operating Assets, computed as
Net Operating Income3, 4/Net Operating Assets5,
LEV is Financial Leverage, computed as Net Financial Obligations/Common Equity, and
NBC is net borrowing cost, computed as Net Interest Expense/Net Financial Obligations,
and SPREAD is RNOA – NBC.
The spread determines when financial leverage (LEV) contributes to firms’ profit beyond the
return on net operating assets (RNOA). If the spread is positive, taking on financial leverage will
allow profits to increase beyond the existing RNOA. If the spread is negative however, LEV
will reduce profitability below the existing RNOA level. The key observation from the first
3 Net Operating Income = Net income (WC01706) + Interest Expense, where Interest Expense is interest expense*(1-effective tax rate). 4 Interest expense (WC01075) for non-financial firms is often missing in Datastream. For firm-observations with missing interest information, we impute the interest expense as the difference between EBT (earnings before tax, WC01401) and EBIT (earnings before interest and tax, WC18191). Effective tax rate is computed as the tax expense (WC01451) divided by net income before tax. If net income before tax is negative, we set the effective tax rate to be zero.5 Net Operating Assets = Common equity (WC03501)+ Net Financial Obligations, where Net Financial Obligations equals total debt (WC03255).
6
model is that LEV amplifies the spread between operating performance (as given by RNOA) and
the cost of borrowing (as given by NBC).6
In addition to debt financing (as given by LEV), firms can also take on leverage through
various operating decisions. For instance, firms can effectively borrow from suppliers by
extending the time they take to pay their accounts payable. Also, firms can advance cash from
customers with the obligation to service customers in the future, incurring deferred revenues.
Using such operating leverage may not come for free and is often at a higher cost than financial
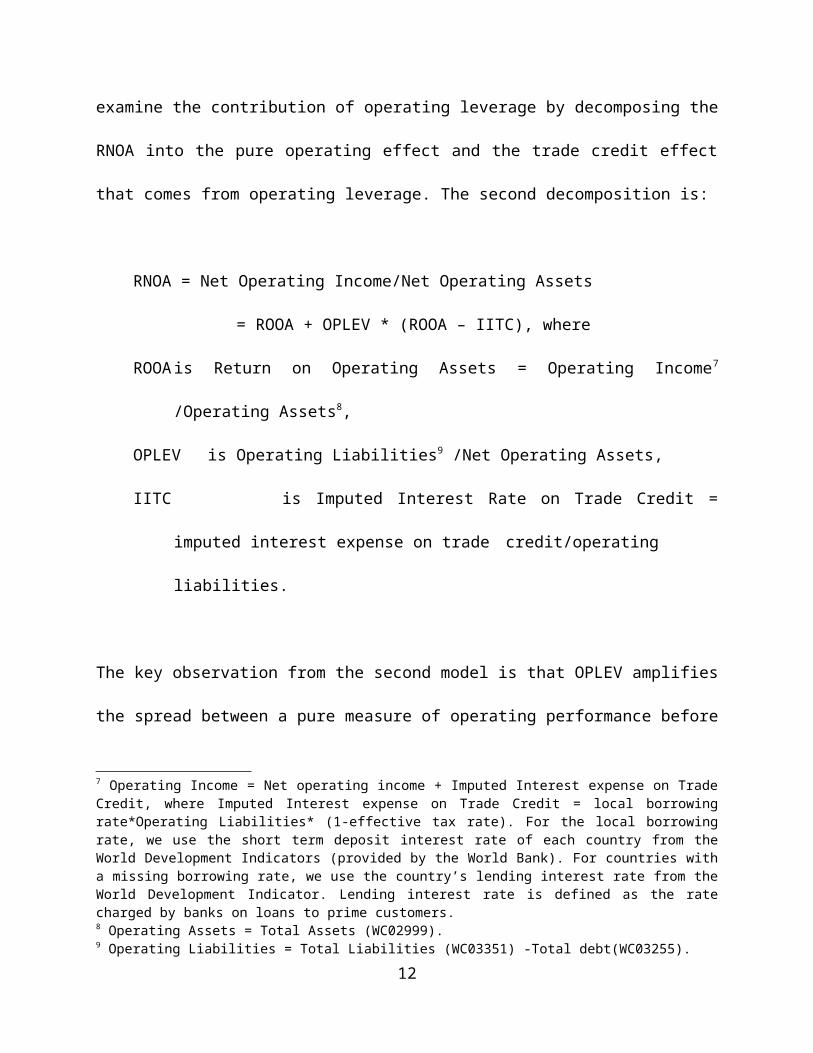
leverage (Wilner 2000). We examine the contribution of operating leverage by decomposing the
RNOA into the pure operating effect and the trade credit effect that comes from operating
leverage. The second decomposition is:
RNOA = Net Operating Income/Net Operating Assets
= ROOA + OPLEV * (ROOA – IITC), where
ROOA is Return on Operating Assets = Operating Income7 /Operating Assets8,
OPLEV is Operating Liabilities9 /Net Operating Assets,
IITC is Imputed Interest Rate on Trade Credit = imputed interest expense on trade
credit/operating liabilities.
6 Our decomposition classifies Cash and Cash Equivalents as operating assets. Another option would be to classify cash as negative net financial obligations. Doing so results in negative leverage for roughly one third of the observations, which makes the interpretation of the Dupont decomposition more difficult. In addition, this alternative requires classifying interest revenue as negative interest expense, and it is difficult to identify the interest revenue in the Worldscope data.7 Operating Income = Net operating income + Imputed Interest expense on Trade Credit, where Imputed Interest expense on Trade Credit = local borrowing rate*Operating Liabilities* (1-effective tax rate). For the local borrowing rate, we use the short term deposit interest rate of each country from the World Development Indicators (provided by the World Bank). For countries with a missing borrowing rate, we use the country’s lending interest rate from the World Development Indicator. Lending interest rate is defined as the rate charged by banks on loans to prime customers.8 Operating Assets = Total Assets (WC02999).9 Operating Liabilities = Total Liabilities (WC03351) -Total debt(WC03255).
7
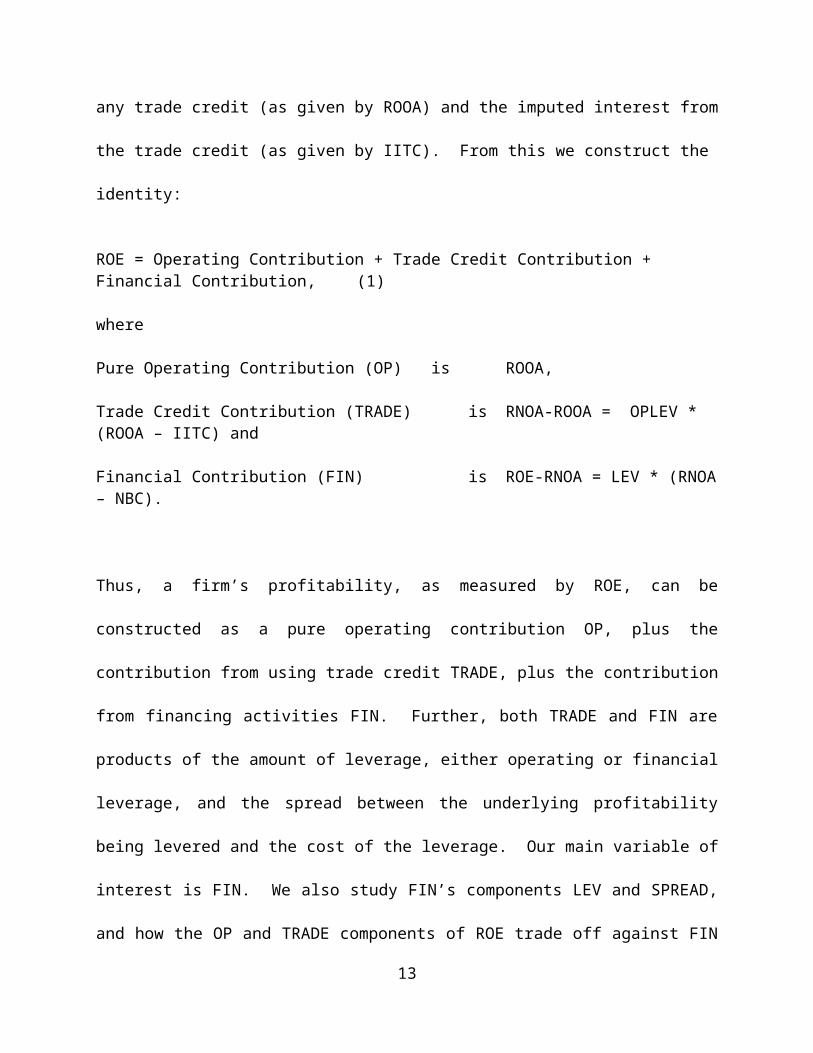
The key observation from the second model is that OPLEV amplifies the spread between a pure
measure of operating performance before any trade credit (as given by ROOA) and the imputed
interest from the trade credit (as given by IITC). From this we construct the identity:
ROE = Operating Contribution + Trade Credit Contribution + Financial Contribution, (1)
where
Pure Operating Contribution (OP) is ROOA,
Trade Credit Contribution (TRADE) is RNOA-ROOA = OPLEV * (ROOA – IITC) and
Financial Contribution (FIN) is ROE-RNOA = LEV * (RNOA – NBC).
Thus, a firm’s profitability, as measured by ROE, can be constructed as a pure operating
contribution OP, plus the contribution from using trade credit TRADE, plus the contribution
from financing activities FIN. Further, both TRADE and FIN are products of the amount of
leverage, either operating or financial leverage, and the spread between the underlying
profitability being levered and the cost of the leverage. Our main variable of interest is FIN. We
also study FIN’s components LEV and SPREAD, and how the OP and TRADE components of
ROE trade off against FIN as a function of a country’s domestic credit provided by the banking
sector.
3. Related Literature and Hypotheses
We investigate how a firm’s home country level of domestic credit influences the financing
contribution to ROE, and what path the influence takes in terms of the Dupont components.
There has been considerable work in international finance and economics studying how available
domestic credit influences a country’s growth, but much less study of its influence on
8
profitability.
3.1 Prior Literature
3.1.1 What is Domestic Credit?
Our main interest is whether the financing contribution to return on equity increases with
financial development in the country. While the financing activities of firms typically include
both debt and equity-based financing, only non-equity financing creates the leverage that
increases ROE. We therefore use a proxy of financial development that focuses on the
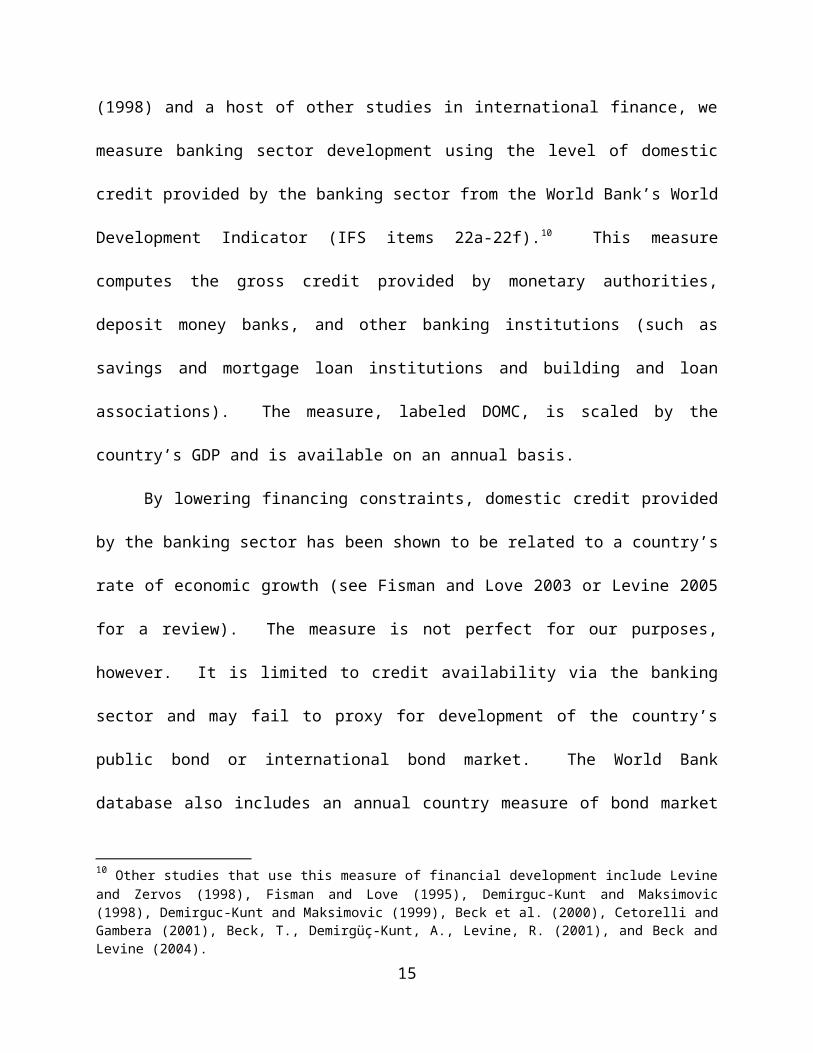
development of the banking sector. Following Rajan and Zingales (1998) and a host of other
studies in international finance, we measure banking sector development using the level of
domestic credit provided by the banking sector from the World Bank’s World Development
Indicator (IFS items 22a-22f).10 This measure computes the gross credit provided by monetary
authorities, deposit money banks, and other banking institutions (such as savings and mortgage
loan institutions and building and loan associations). The measure, labeled DOMC, is scaled by
the country’s GDP and is available on an annual basis.
By lowering financing constraints, domestic credit provided by the banking sector has
been shown to be related to a country’s rate of economic growth (see Fisman and Love 2003 or
Levine 2005 for a review). The measure is not perfect for our purposes, however. It is limited to
credit availability via the banking sector and may fail to proxy for development of the country’s
public bond or international bond market. The World Bank database also includes an annual
country measure of bond market borrowing, but this variable is not available for as many years
or as many countries, and consists mostly of bonds issued by financial institutions, which are not
relevant to our study. As a practical matter, the domestic credit market is three times as large as
10 Other studies that use this measure of financial development include Levine and Zervos (1998), Fisman and Love (1995), Demirguc-Kunt and Maksimovic (1998), Demirguc-Kunt and Maksimovic (1999), Beck et al. (2000), Cetorelli and Gambera (2001), Beck, T., Demirgüç-Kunt, A., Levine, R. (2001), and Beck and Levine (2004).
9
the bond market for the average country in the average year, and is by far the most commonly
used measure of financial market development in the international finance literature. We later
test the robustness of our analysis using an alternative measure that adds the size of the bond
market to the numerator of our domestic credit measure and find similar results, likely because
this alternative measure has a 0.77 Spearman correlation with our measure.11
3.1.2 The Relation between Domestic Credit and Capital Structure
In a study of 19 developed and 11 developing countries, Demirguc-Kunt and Maksimovic
(1999) find no evidence that the availability of domestic credit influences the capital structure for
the largest firms in a country. For the smallest firms in a country the evidence is mixed, with
some specifications suggesting the relation between domestic credit and leverage to be positive
but other specifications suggesting it to be negative. The authors reason that the smallest firms
in a country are marginal borrowers and consequently their leverage depends on the development
of the banking sector, whereas the largest firms are infra-marginal and consequently have their
needs met even in a country with an underdeveloped banking system.
De Jong et al. (2008) sample a large panel of firms from 42 countries and find that the
association between leverage and firm-specific variables often changes across countries. Two
variables, size and profitability, behave consistently, with leverage increasing with size and
decreasing with profitability in 38 of 42 countries. They also find that, after controlling for these
firm-specific factors, a country’s average leverage increases with the development of the
country’s bond market. These results suggest two firm-specific factors, size and profitability, and
one country-level factor, the development of the country’s ability to provide debt financing, will
be related to leverage. Although leverage is only one part of the financial contribution to ROE,
11 A country’s financial development can also be measured by the development of its equity market (see Levine and Zervos 1998). However, as the Dupont model shows, equity does not create financial leverage and so is not relevant to our study.
10
these results suggest a starting point for our model.
3.1.3 The Relation between Trade Credit and Financial Credit and their Contribution to
ROE
Nilsen (2002) reports that for U.S. manufacturing firms, accounts payable averages 13
percent of total liabilities, so trade credit is an important source of funds for many firms. As
derived above, the trade credit contribution to ROE is the product of how much operating
leverage the firm employs and the spread between the pure return on operating assets and the
implied interest rate on the trade credit. Choi and Kim (2005) and Klapper et al. (2011) describe
a number of theories of trade credit that address the level of operating leverage but not the spread
between the pure operating return and the implied interest rate on the trade credit.
The financing view of trade credit posits that firms with better access to capital will
redistribute the credit they receive to less advantaged firms via trade credit. These firms can
sometimes play the role of lender better than a bank because they have superior information or
better contracting opportunities with the trade partner. Compared to banks, suppliers know the
quality of goods provided and the likelihood of downstream sales, and are in a better position to
reclaim and resell the inventory in the event of a default. The impact of a country’s level of
domestic credit on the level and implied interest on trade credit thus depends on when other
constraints bind on this process. One possibility is that more domestic credit flows down
through all levels of creditworthiness and increases the use of both financial credit and trade
credit; in this case the two types of financing would appear complementary. Alternatively,
because the implied interest on trade credit is typically higher than on similar bank financing
(Wilner 2000), more domestic credit could lower the cost of bank financing relative to trade
credit and cause firms to substitute financial credit for trade credit. Further, assuming that larger
11
firms are generally more creditworthy, they are more likely to be the firms redistributing
financial credit downward through trade credit while smaller firms are more likely to be the
recipients.
Trade credit also serves non-financial purposes. Petersen and Rajan (1997) argue that trade
credit can be used as a mechanism for price discrimination without running afoul of anti-trust
laws. Long et al. (1993) posit that trade credit allows the buyer to verify the quality of goods
before paying for them, thus resolving some information asymmetry between trade partners.
These motives for trade credit are unlikely to be influenced by the availability of domestic credit,
and consequently buffer any substitutability or complementarity between financial credit and
trade credit caused by the level of available domestic credit. It is likely that these motives for
trade credit also differ between large firms and small firms, insofar as small firms may be subject
to greater information asymmetry and contracting problems than large firms.
Empirically, the prior results are mixed. For a sample of US firms, Petersen and Rajan
(1997) find that trade credit and bank credit are substitutes. However, in a sample covering 39
countries, Demirguc-Kunt and Maksimovic (2001) find that the use of trade credit increases with
the country’s availability of domestic credit, concluding that these two sources of financing are
complementary.12 Further, in a unique database of 30,000 actual trade contracts from the US and
Europe, Klapper et al. (2011) find that non-financial motives for trade credit appear to be the
most relevant.
The results above speak to the relative levels of financial and trade credit, but not to the
effective spread on trade credit. Consequently, it is unclear how the financing contribution and
12 There is a large literature on how financial crises impact the relative use of financial or trade credit, which also produces mixed results. Several studies find that during market downturns, trade credit flows from firms with better access to bank financing to firms with less access (Choi and Kim 2005 and Nilsen 2002). However, other studies find no such redistribution for financially constrained firms (Love and Zaidi 2010).
12
the trade credit contribution to ROE will be related. In addition, how this relation varies across
countries with differing levels of domestic credit will reveal how important the redistributive role
of trade credit is in the economy relative to the non-financial motives for trade credit.
3.2 Hypotheses development
We are interested in mapping out how the level of domestic credit in a country flows
through to the financing contribution for firms in that country. Consequently, our main
dependent variable is FIN, and our main independent variable is DOMC. We use other variables
as controls, or as a means of studying the intermediate steps between DOMC and FIN.
We assume that firms are price-takers when it comes to the cost of borrowing in their
domestic economies. Consequently, a greater supply of credit at the country level is
hypothesized to be associated with a lower cost of borrowing, and firms treat this as an
exogenous variable in their decision-making. As discussed earlier, a country’s domestic credit
can have other influences on firms’ profitability, but an impact on the cost of borrowing
produces a series of predictable outcomes. Our hypotheses map out the implications of a lower
net borrowing cost for the financing contribution to return on equity.
Referring back to (1), holding other effects constant, the direct effect of a lower net
borrowing cost is a higher spread between RNOA and NBC. The rate at which the higher spread
flows through to the financing contribution depends on the firm’s leverage. Thus, higher
financing contributions occur for firms in high domestic credit countries because their net
borrowing costs are lower and so their spread is higher, all else equal. Of course, other effects
may not remain constant, and the level of domestic credit is only one force affecting net
borrowing costs, so it is not by construction that this relation will hold. Stated in terms of our
13
variables, our first hypothesis is:
H1: FIN is increasing in DOMC because SPREAD is increasing in DOMC.
A lower net borrowing cost will have a number of indirect effects as well. Holding other effects
constant, a lower borrowing cost should correspond with more borrowing and thus higher
leverage. The rate at which higher leverage translates into the financial contribution depends on
the spread. If the spread is positive, the effect will be to further enhance the financing
contribution that follows from a lower borrowing cost. Thus, assuming the spread is positive,
high financing contributions also occur for firms in high domestic credit countries because these
firms employ more leverage. Stated in terms of our variables, our second hypothesis is:
H2: FIN is increasing in DOMC because LEV is increasing in DOMC.
Note that H1 and H2 say that both parts of the financing contribution, leverage and spread, are
decreasing in NBC, and hence increasing in DOMC. Further, the effect is multiplicative, so that
the marginal impact of increasing LEV depends on the level of SPREAD, and the marginal
impact of increasing SPREAD depends on the level of LEV.13
The prediction that leverage increases when borrowing costs decrease would follow from
any model of supply and demand for credit. However, even with no influence on the cost of
borrowing, a country’s level of domestic credit can proxy for other country-level forces that can
facilitate borrowing by the corporate sector. Things like strong enforcement of contracts,
13 Mathematically, writing FIN = LEV * SPREAD and taking the derivative of FIN with respect to the exogenous parameter DOMC yields dFIN/dDOMC = dLEV/dDOMC * SPREAD + dSPREAD/dDOMC * LEV.
14
bankruptcy laws, and effective corporate governance regulations may all serve to increase the
domestic credit available in the country and the use of credit by corporations. In addition, if the
demand for credit is sufficiently elastic, then an increase in the supply of credit may have a small
impact on the cost of borrowing, and yet still have a large impact on the amount of credit used.
The next indirect effect of a lower net borrowing cost is the subtlest. If borrowing costs are
lower, and firms consequently borrow more, then they may use the funds to undertake more
projects. This will serve to increase both the operating income and the operating assets, with the
net impact on the return on operating assets dependent on whether the firm has increasing,
constant, or decreasing returns on new investment. Note that this impact on the financing
contribution to profitability is both indirect and of second order – if the firm has constant returns
on new investments then the effect is zero. We do not attempt to directly measure this marginal
effect, but note it because operating performance is included as a control in the model, as
discussed next.
Besides the subtle impact of domestic credit on operating performance, there is an obvious
direct relation between the financing contribution and operating performance that has nothing to
do with the cost of borrowing. A higher RNOA produces a higher spread, and hence a higher
financing contribution. To keep other variables from proxying for this obvious effect, we
include RNOA in the model as a control variable. In addition, RNOA needs to be included in
our model simply because, empirically, it is positively correlated with the level of domestic
credit, and we want to isolate the direct effect of domestic credit on the financing contribution to
profitability.
Lowering the cost of financial credit will also have an indirect effect on the use of trade
credit. The nature of the effect depends on the degree to which the two sources of credit are
15
complements or substitutes. They may be substitutes if both sources of credit are essentially the
same, so firms simply look for the cheapest form of credit. They may be complementary if more
creditworthy firms enjoy more of both types of credit. They may also be complementary if the
firm’s production function is such that lowering the cost of one input increases the use of all
inputs (as in a Cobb-Douglas model, for example). Recall that trade credit serves purposes
beyond providing financing to a trade partner, and these forces will work to limit any relation
between financial and trade credit. Further, the rate of substitution or complementarity between
financial credit and trade credit can potentially depend on the level of domestic credit. As
discussed, the contributions of both trade credit and financial credit may be influenced by the
degree to which contracts are enforced in the country, and the country-wide level of available
domestic credit is likely to be higher in countries with better contract enforcement. Thus, the
two sources of credit may become more complementary as DOMC increases. This leads to our
next hypothesis:
H3: FIN and TRADE are positively related if the two are complements, and negatively related if the two are substitutes. The relation between the two sources of credit is conditioned by the country’s level of DOMC.
To summarize, DOMC is related to FIN directly through its influence on NBC, and at a
rate that depends on the level of LEV. DOMC is also related to FIN indirectly through NBC’s
influence on LEV, and at a rate that depends on the level of SPREAD. More indirectly,
DOMC’s influence on NBC, and thus borrowing, may affect the level of investment in operating
assets, which in turn may affect RNOA. Finally, DOMC may affect the rate at which trade credit
and financial credit substitute or complement each other, thus affecting the relation between
TRADE and FIN.
16
Our second set of hypotheses conditions H1-H3 by the size of the firm. The previous
theoretical and empirical work suggests that the relation between the financing contribution and
other variables may be conditioned on the relative size of the firm in its home economy.14 We
hypothesize that the size of the firm to proxy for frictions that limit small firms’ use of trade
credit and financial credit. These frictions might arise because small firms present greater
information asymmetries, greater agency problems, or simply because small firms have lower
quality credit. How these frictions will impact the relation between domestic credit and the
financing contribution to ROE depends on what the binding constraints are along the pathway
from DOMC to FIN outlined above. For instance, if the binding constraint for large firms is the
cost of borrowing, but the binding constraint for small firms is a lack of collateral, then a lower
cost of borrowing associated with an increase in domestic credit will have a greater effect on
large firms than small firms. Alternatively, if the binding constraint for large firms is a lack of
positive NPV projects and the binding constraint for small firms is the cost of borrowing, then
small firms may benefit more from an increase in domestic credit. Just as in the association
between domestic credit and growth (as studied in the international finance literature), the
association between domestic credit and profitability may depend crucially on the size of the
firm.
From an empirical perspective, large firms have both higher leverage and higher spreads
than small firms (to be documented later). This means that the incremental impact of an increase
in spread or an increase in leverage will be greater for larger firms (see footnote 15).
14 Beck et al. (2005), based on a survey of 3,000 firms in 48 countries, find that small and medium-sized firms report that financing is an obstacle to growth in countries with lower levels of domestic credit. These firms report obstacles due to high interest rates, collateral requirements, bank bureaucracy, or lack of available funds for lending; the largest firms in the country report no such obstacles. Using the same survey data, Beck et al. (2008) find that the smallest firms use less bank financing in general, and especially in countries with low levels of domestic credit, and that they are not able to adequately substitute leasing or trade credit relative to the largest firms in the economy.
17
H4-H6: the relations given in H1-H3 are conditioned on the size of the firm.
4. The Sample and Descriptive Statistics
We construct our sample from Thomson Datastream and collect financial data for firms
in 69 different countries from year 1980 to 2010. We require firms to have positive total assets,
net assets (=total assets-total liabilities), and market capitalization of more than USD 1 million.
We eliminate countries that are missing the domestic credit measure, or have less than 50 firm-
years throughout the sample period. We also eliminate firms with missing interest expense or
tax expense. Finally, consistent with prior financial statement analysis studies, we eliminate
firms from the financial industry because the separation of financing and operating activities is
artificial for such firms (e.g., Nissim and Penman 2001, Fairfield and Yohn 2001, Fairfield et al.
2003, Soliman 2008, Richardson et al. 2005, or Li et al. 2012). 15 Also consistent with prior
studies we eliminate observations with extreme financial ratios. Specifically, we eliminate firms
with net borrowing costs, return on equity, return on net operating assets, or return on operating
assets greater than 100% or less than -100%. Because there is no obvious absolute threshold for
deletion for leverage, spread or net borrowing costs, we instead truncate extreme values at the
1% and 99% level. The final sample is 51,866 firms (330,411 firm-years) from 69 countries.
Table 1 shows a summary of the firm-years used in our analysis.
As discussed, we measure the level of domestic credit (DOMC) provided by the banking
sector from the World Bank’s World Development Indicator (IFS items 22a-22f). For our cross-
sectional tests we average DOMC over the three years centered on the current year to minimize
the effects of temporary changes in the country’s credit availability or temporary changes in the
15 Financial industries include all sectors with Industry Classification Benchmark (ICB) codes 8300(banks), 8500 (insurance companies), 8700 (financial services), and 8900 (equity instruments).
18
country’s GDP. For our analysis of large changes in domestic credit in table 7, we use the
change in the annual values of DOMC.
Table 2 shows the level of domestic credit (DOMC) for all 69 countries in our sample.
The mean domestic credit is 0.92 of the country’s GDP. The measure varies significantly across
countries ranging from 0.099 of GDP for the lowest country (Saudi Arabia) to 2.952 for the
highest country (Japan). This variation can be seen in Figure 1 where we plot the mean domestic
credit ordered from smallest to largest. Figure 1 shows that special attention needs to be paid to
Japan. Japan makes up 17 percent of the observations, and its domestic credit level is 3.2 times
higher than the average country and 20 percent higher than the next highest country. Our tests
partly control for this by constructing firm size portfolios within country, and then pooling across
countries. In additional analysis we also show that our results are very similar when we eliminate
Japan from the sample.
Recalling the decomposition of ROE from the previous section, Table 3 Panel A shows the
distribution of each component of ROE using all firm-years. The median ROE is 7.9 percent and
the largest component of ROE is OP, followed by TRADE, and then FIN. The median TRADE
and median FIN are slightly positive. The median LEV is 0.499 and the median SPREAD is 1.7
percent. This might suggest a larger median FIN than what we observe, but LEV and SPREAD
are negatively correlated, as seen in the next table (and documented in prior literature).
4.1 The Contributions to ROE within and across Countries
We are interested in how the contribution of financing decisions to a firm’s ROE varies by
the development of the home country’s banking system. To begin, consider the averages of OP,
TRADE, and FIN for each country, sorted on the country mean domestic credit (DOMC) over
19
the sample period. The results are shown in Figure 2. Two observations are immediate. First, not
surprisingly, across all levels of DOMC, the largest component of ROE is OP, and it appears to
be slightly decreasing in DOMC. The TRADE and FIN components are smaller, with no strong
pattern shown across DOMC, although the correlations in the table 4 show that TRADE and FIN
are both statistically increasing in DOMC.
The low level of the country mean FIN seen in Figure 2 hides the large within-country
variation. The standard deviation of the average FIN across countries is only 0.017 (Table 2), but
the average standard deviation of FIN within country is 0.093 (untabulated). There is far greater
variation in FIN across firms within a country than there is variation in the average FIN across
countries. This is true for the OP and TRADE components as well – there is more within
country variation than across country variation (untabulated). Our regression analysis shows that
the impact of DOMC on individual firms inside a country depends of firm-specific factors such
as size and the other components of profitability.
The second observation from Figure 2 is that the average OP varies across countries
considerably more than average FIN and TRADE. The average level of OP across countries is
7.7 percent with a standard deviation across the country averages of 0.026, much larger than the
variation in FIN and TRADE, as seen at the bottom of Table 2. Because the success or failure of
a firm’s operations has a direct effect on its ability to successfully employ leverage to increase its
ROE, we control for either OP or RNOA (which equal OP plus TRADE) in all our regressions.
In addition, different countries may have a different mix of industries, and Soliman (2004) shows
that the Dupont decomposition varies systematically with industries, so we include industry fixed
20
effects in all our regressions.16 Similarly, some years are simply more profitable for all the
world’s economies than others, so we also include year fixed effects in all our regressions.
4.2 Descriptive statistics by the relative size of the firm
Prior literature has emphasized the importance of DOMC to a country’s ability to use
leverage. But given our observation that FIN is small on average, and most of the variation is
within country, the real question is, does DOMC help some firms in a country more than others?
To test this, we estimate the relation between DOMC and FIN for sub-samples that include large,
medium, and small firms.
Many of the relations we document vary significantly with the relative size of the firm
within its country. In the results that follow we report the pooled estimates and then the estimates
for the smallest, middle, and largest terciles of size, where size is measured as the total assets at
the end of the fiscal year. For our primary tests we sort firms into terciles within country-year
and then combine terciles. This procedure groups together similarly ranked firms relative to the
other firms in their country. So, for instance, the largest firms in Italy are grouped with the
largest firms in Japan. This method of matching the relative size of firm within its country is
consistent with Demirguc-Kunt and Maksimovic (1999). It is motivated by the idea that the
largest firms in a country have the greatest access to financial markets and institutions in their
respective countries, regardless of their absolute size, while the smallest firms in the country may
have limited access.
Table 3 presents summary statistics by size terciles. Panel A shows summary statistics for
the pooled sample while Panels B and C shows summary statistics for smallest and largest firms,
16 In contrast to Soliman, (2004), Fairfield et al. (2009) find that industry membership is not a useful guide for mean reversion in ROE or RNOA in a sample of US data. We still include industry fixed effects because we are examining finer components of ROE, and because we are examining global data.
21
respectively (we omit the middle tercile in the summary statistics for brevity). Comparing panels
B and C, large firms have higher ROE, OP, FIN, SPREAD, and LEV compared to small firms.
In our main empirical tests, we examine whether the country’s financial development has a
differential effect on FIN and the other ROE components across different firm sizes.
Table 4 shows the correlation matrix of the Dupont components for the full sample, the
smallest tercile, and the largest tercile, in Panels A, B, and C, respectively. As seen in Panel A,
domestic credit is negatively related to OP and positively related to FIN and TRADE. The
positive correlations with FIN and TRADE are suggestive that the financing components of a
firm, either through financial credit or trade credit, are related to the development of the
country’s banking sector. Comparing the correlations for the smallest tercile (panel B) and the
largest tercile (panel C), one noticeable difference is that net borrowing costs are positively
correlated with leverage for the smallest firms and negatively correlated with leverage for the
largest firms. The positive correlation for the smallest firms is difficult to understand, and
suggests the need to control for other factors, such as operating performance, in our regressions.
There are several other reasons why one needs to control for operating performance in the
context of our study. First is the empirical observation widely documented in prior literature that
firms OP and LEV are strongly correlated. Table 4 shows a strong negative relation between OP
and LEV for our sample firms and also within each size terciles (Panel B and C). Although one
might expect that more profitable firms would lever their operating success, the empirical result
is that they do the opposite. This seemingly anomalous result has been documented repeatedly,
and we find it in our data as well.17 The most satisfactory explanation for this result is that firms
17 The original study is Rajan and Zingales (1995) who find that the determinants of leverage for firms in the G7 countries are basically the same as the determinants found in the US-based literature; leverage generally increases with firm size, asset tangibility, and decreases with the market-to-book ratio and firm profitability. Booth et al. (2001) undertake a similar study in 10 developing countries and find some support for the same variables used in Rajan and Zingales (1995), but also find that the only consistent result across all countries is that leverage decreases with profitability. Booth et al. (2001) also find that country fixed effects add significant explanatory power beyond
22
follow the pecking-order theory of capital structure and prefer to fund capital investment first
with internally-generated funds, and then with debt, and finally with equity. The pecking order
follows the degree of information asymmetry between the capital provider and the firm. 18
Consequently, more profitable firms have more internally-generated funds, and therefore need
less external funding, and this causes a negative relation between profitability and leverage (see
Myers 2001 for a review of theories of capital structure).
Recall that the financial contribution to ROE is the product of the LEV and spread
between the return on net operating assets and the net borrowing cost. It is unclear how the
strong negative relation between OP and LEV will flow through to the financing contribution;
spread should increase with OP and, based on the prior empirical findings, LEV is expected to
decrease. We include OP as a control variable throughout our analyses.
5. Regression analysis
Our main regression results are organized as follows. First, we study how domestic
credit (DOMC) directly influences the financing contribution to ROE (FIN) and how firm size
plays a central role in understanding the contribution of DOMC. Second, we examine the
relation between domestic credit and the components of FIN, leverage (LEV) and the spread
between the return on net operating assets (RNOA) and the net borrowing costs (NBC). Finally,
we examine whether the financing contribution and the trade credit contribution to profitability
are complements or substitutes, and whether the relation depends on DOMC.
the firm-specific variables, suggesting that country characteristics play an important role in understanding leverage ratios around the world. 18 Recent support for the pecking order theory is in Naranjo et al. (2012) who show that firms increased debt financing a little, and equity financing a lot, following the adoption of IFRS, presumably because IFRS lowered the information asymmetry between capital providers and firms, especially for equity providers.
23

5.1 The direct impact of domestic credit on financial performance
We examine whether the availability of credit in a country allows some firms to benefit
from FIN more than others. To test this, we estimate the following regression with firms indexed
as i, country as c, and year as t:
FINi,t = b1*DOMCc,t + b2*RNOAi,t + Industry Fixed Effects + Year Fixed Effects + ei,t. (2)
Standard errors are clustered at the country and year level.19 The results are in Table 5 Panel A.
Column 1 gives the results for the pooled regression. We find that, controlling for operating
performance as measured by RNOA, and industry and year fixed effects, financial performance
(FIN) increases with the country’s domestic credit. And as expected, FIN also increases with
RNOA. All results are highly significant. Dividing the sample by the relative firm size, the
coefficient on DOMC ranges from 0.010 for the smallest firms in the county to 0.013 for the
largest firms in the country, as seen in columns 2-4. To get a sense for the economic magnitude,
increasing DOMC by one (the approximate difference between the United States and Ireland)
has an estimated impact of increasing FIN by 1.0 percent for the smallest tercile of firms in the
country, and by 1.3 percent for the largest firms in the economy. While previous literature has
shown how improvements in a country’s banking system benefit the growth rates of small firms
more than large firms, we find the opposite result for the profitability of those firms.
Does more domestic credit increase FIN because firms have a larger positive spread or
because firms take on more leverage? To understand why firms in countries with more domestic
credit enjoy greater financing contributions, we replace FIN with LEV and SPREAD in Panels B
and C of Table 5, respectively.
Panel B of Table 5 shows no significant relation between DOMC and LEV for the pooled
sample (column 1), and only the smallest firms have a significant positive relation (column 2).
19 Firm-level clustering yields the same coefficient estimates and uniformly more significant results.
24
And as documented in prior literature, LEV is decreasing in RNOA, and at a rate that becomes
more negative as the firms get larger. So domestic credit translate into more leverage only for
the smallest tercile of firms in the country.
In contrast to the results in Panel B, Panel C of Table 5 shows a significant relation
between DOMC and SPREAD. Comparing across columns 2-4, a one unit increase in DOMC is
associated with a 2.6 percent increase in SPREAD for the smallest firms, a 2.2 percent increase
for the middle-sized firms, and a 1.6 percent increase for the largest firms in the country. And
note that this is after controlling for RNOA, which has an obvious positive relation with
SPREAD, so that the improvement in SPREAD must be due to a decrease in net borrowing costs
(NBC). In sum, after controlling for operating performance, firms in countries with higher
DOMC enjoy higher a SPREAD, with the biggest effect accruing to the smallest firms in the
country.
Comparing the three panels of Table 5, it may seem anomalous that, for the smallest
firms, DOMC has the biggest impact on SPREAD (panel C) and the biggest impact on LEV
(panel B), and yet have the smallest overall effect on FIN (panel A). To reconcile these
observations, recall that FIN is the product of SPREAD and LEV, so the contribution of a change
in each also depends on the level of the other (see footnote 16). And referring back to Table 3
panels B and C, small firms have lower levels of both SPREAD and LEV than large firms. So,
while the domestic credit has a bigger association with SPREAD and LEV for small firms, large
firms have greater levels of SPREAD and FIN and therefore enjoy the largest incremental
contribution from DOMC. To make these relations clear, figure 3 presents a 3D plot of FIN on
LEV and SPREAD. To interpret the figure, recall that large firms have higher levels of LEV and
SPREAD than small firms, so that large firms are located in the higher, steeper region of the
25
figure while small firms are located in the lower, flatter region of figure. Thus, even though a
unit increment in DOMC produces larger changes in LEV and SPREAD for small firms than
large firms, the smaller change produces bigger results for large firms.
5.2 The relation between the financing contribution and the trade credit contribution to ROE
Figure 2 shows that the contribution to ROE from trade credit (TRADE) is generally
positive. It is possible that by considering only debt financing (FIN) and not TRADE, we are
underestimating the contribution of all financing activities to ROE. Firms could engage in
financing activities that contribute to performance through trade credit, and perhaps increasingly
so when firms are in countries with a more developed banking sector (DOMC). We ask whether
FIN and TRADE are complements or substitutes, and how the availability of domestic credit
moderates the relation within a country.
Table 6 gives the results from the following regression with firms indexed as i, country as
c, and year as t:
FINi,t = b0 + b1*DOMCc,t + b2*DOMCc,t *TRADEi,t + b3*TRADEi,t + b4*OPi,t
+ Industry Fixed Effects + Year Fixed Effects + e i,t. (3)
Note that the control for operating performance has switched from RNOA in the equation (2)
regressions to OP in the equation (3) regression. This is so we can separate out the effect of
TRADE, recalling that RNOA = TRADE + OP. Further, we include DOMC in the regression as
a main effect to be sure that our term of interest, the interaction between DOMC and TRADE, is
not proxying for the main effect of DOMC.
Panel A of Table 6 shows the results for the pooled sample. Note first that the coefficient
on TRADE is positive and significant. A one percent increase in the contribution from TRADE
26
is associated with a 0.712 percent increase in the contribution from FIN. Thus, the two sources
of credit are definitely complementary. Firms that enjoy greater contributions for trade credit
also enjoy more contributions from financing credit. Comparing across columns 2-4, we see that
this complementary relation has no clear pattern across the three pools of firm sizes. The second
point of interest in Table 6 is the interaction between TRADE and DOMC. Here we see that the
level of domestic credit in the country only moderates the complementary relation between
TRADE and FIN for the largest firms in the country. A one unit increase in DOMC increases
the coefficient on TRADE from 0.590 to 0.705 (0.590 + 0.115) for the largest firms in the
economy (column 4).
As discussed in the hypothesis section, there are a number of reasons that trade credit and
financial credit may be complementary. A theory that fits our evidence well is in Biais and
Gollier (1997) who argue that the extension of trade credit reveals favorable information to other
lenders, thereby increasing their willingness to lend. Thus, the more trade credit, the more
financial credit. Further, our evidence says that the informativeness of this signal increases in
countries with more available domestic credit, but only for the largest firms in the country.
5.3 Large changes in domestic credit
So far all our results have been in the cross-section. We used industry and year fixed
effects and so the results should be interpreted as being relative to other firms in the same
industry and year. We also clustered standard errors at the country and year level to account for
within country and within year residual correlation. Nonetheless, any cross-sectional analysis is
subject to the criticism that the independent variables are only proxies for other persistent
omitted variables that drive the true relations. To address this concern, we examine the relation
27

between annual changes in FIN and changes in the independent variables. Any persistent
omitted variable should be cancelled out in this design. Because our main variable of interest,
DOMC is itself relatively persistent, we focus on the country-years in the top or bottom 10
percent of annual changes in DOMC. For the top decile this corresponds to a 17 percent average
increase in DOMC involving 216 country-years and for the bottom decile this corresponds to a
10 percent average decrease in DOMC involving 209 country-years.20
Because changes in the availability of domestic credit will take time to flow through to
firms’ financing decisions and the financing contribution to performance, we associate the
change in DOMC in year t with the change in FIN in year t+1. This also strengthens our claim
of causality. However, we still need to control for the concurrent operating performance and so
we include in the regressions the changes in RNOA in year t+1. As before, we cluster the
regression standard errors by country and year.
As a starting point, Panel A of Table 7 shows that the Spearman correlation between the
change in DOMC in year t and the change in FIN in year t+1 are positively correlated. The
change in DOMC is also negatively correlated with the future change in RNOA, but because
changes in future RNOA and future FIN are also negatively correlated, it is hard to identify the
marginal relation. Panels B and C present the main regression results. Because the underlying
economic factors that precipitate large increases in domestic credit are likely to be different from
the factors that precipitate large decreases, we estimate separate regressions for each.
The results in Column 1 of Table 7, Panel B, are remarkably consistent with the cross-
sectional results in Tables 5 and 6. For DOMC increases, the pooled results in Column 1 show
20 Country-years included in the bottom decile often represent periods of financial crises. For example, Argentina and Brazil experienced a large drop in DOMC (-59% and -58% respectively) in 1990. Both countries suffered a sovereign debt crisis in 1990. Brazil in 1994 and Mexico in 1996 are included in the bottom decile sample and coincide with the banking crisis years (Kaminsky and Reinhart 1999). Country-years in the top decile often represent credit expansion years immediately following a crisis. For example, South Korea in 1998 (immediately after the Asian crisis) is included in the top decile sample.
28
that the future change in FIN is positively associated with the current change in DOMC. The
estimated size of the effect is small, although highly significant. When countries experience
large increases in available domestic credit, the firms in the economy respond with different
financing decisions and experience the associated increases in the financing contribution to ROE
from those financing decisions in the following year. The results in columns 2-4 show that the
relation is slightly weaker for the smallest firms each country, but still significant. This too
echoes our previous findings. In contrast, we do not find significant evidence in the sample of
large DOMC decreases, as seen in Panel C.
The results for the other change variables also echo the cross-sectional conclusions. For
both subsamples, the future change in FIN is positively related to the concurrent future change in
RNOA, as seen in Panels B and C. The relation between RNOA and FIN, now measured in
concurrent annual changes in the year following a large change in DOMC, is noticeably larger
for the biggest tercile of firms in the economy than for the smallest firms. For the large increase
subsample in Panel B, the coefficient of 0.6798 on the change in future RNOA shown in Column
4 implies that, for the largest firms in the economy, 68 percent of the change in RNOA spills
over to a change in FIN. This figure is reduced to 42 percent for the smallest firms in the
economy. There is a similar pattern in the subsample of large DOMC decreases, although the
coefficient estimates are smaller.
In sum, large increases in available domestic credit are followed by increases in the
financing contribution to ROE. And for large changes in either direction, the concurrent future
changes in operating performance are significantly associated with future changes in the
financing contribution.
29

5.4 Sensitivity analysis
5.4.1 Excluding Japan
As previously discussed, companies from Japan constitute a large portion of our sample
and, at the same time, Japan has the highest level of available domestic credit. To ensure that our
results are not unduly influenced by Japanese firms, in Table 8, Panel A we exclude all firms
from Japan and re-estimate our regressions. The results are very similar to those reported in
Table 5. The coefficient on DOMC increases monotonically from Column 2 to Column 4.
Domestic credit availability has no effect on the financial contribution for the smallest firms in
the economy, but for largest firms a one unit increase in DOMC generates a 1.2 percent increase
in the financing contribution to ROE. Also consistent with our prior results, Table 8 Panel A
shows that higher RNOA is associated with higher FIN.
5.4.2 Including Bond Market Data
Our DOMC measure captures the depth of credit availability in the banking sector and is
the most common measure of a country’s financial development used in the prior literature.
However, the measure does not include financial credit from publicly issued corporate bonds.
The two measures of financial credit are highly correlated (0.77), but to the extent that firms gain
debt financing from corporate bond markets, and this is not perfectly correlated with the amount
of bank credit in country, DOMC has measurement error. As discussed earlier, there is no good
solution to this problem. The only country-level measure of bond issuances mixes together bonds
issued by financial and non-financial firms, but our study excludes financial firms because the
distinction between operating and financing activities does not apply to financial firms.
Nonetheless, we repeat the analysis after adding the bond market data to the domestic credit data
and then scaling by GDP. In Table 8, Panel B we report the results after replacing DOMC with
30
our alternative measure. Again, the results are very similar to the previous results. The
coefficient on DOMC increases monotonically across the three size pools of firms, although
compared to Table 5 the economic size of the effect is slightly reduced.
5.4.3 Accounting Comparability
Throughout our analysis, we have decomposed ROE into its operating, financing and
trade components assuming that the underlying accounting items are comparable across
countries. This is a simplification because different countries have different accounting regimes
and so the RNOA and FIN ratios do not measure precisely the same thing in each country. To
see if this is a significant source of noise in our model, in Table 8 Panel C we restrict our
analysis to country-years that report under either IFRS or US GAAP.21 As seen in the table, the
results are similar, but weaker, to those reported in Table 5, suggesting that a lack of accounting
comparability does not influence our inferences significantly. As before, the coefficient on
DOMC is significant for the pooled regression, and increases monotonically across the size
pools, although is only significant for the largest tercile of firms. For the largest firms, a one unit
increase in DOMC is associated with a 1.0 percent increase in the financing contribution to ROE.
6. Conclusion
In this study, we examine whether availability of domestic credit in the country increases
the contribution of financing activities to a firm’s ROE. More importantly, we show that the
firm’s relative size has a major impact on how the firm’s profitability is affected by its financing
activities. Large firms in countries with well-developed banking systems enjoy the largest
21 Even though the US has not adopted IFRS, after 2005 US GAAP converged significantly with IFRS (Hail et al. 2010).
31
financing contributions to ROE. More generally, the financing contribution increases with
available domestic credit. And, while the spread and leverage of small firms respond the most to
the availability of domestic credit, the combined effect on large firms is still the greatest because
they enjoy higher levels of spread and leverage to begin with. Finally, trade credit is not a
substitute for financial credit; in fact, the two are robust complements in terms of their
contribution to ROE. The degree of complementarity is enhanced by domestic credit, but only
for the largest firms in the country.
32
References
Beck, T., Demirgüç-Kunt, A., Levine, R. 2001. The financial structure database. In: Demirgüç-Kunt, A., Levine, R. (Eds.), Financial Structure and Economic Growth: A Cross-Country Comparison of Banks, Markets, and Development. MIT Press, Cambridge, MA: pp. 17–80.
Beck, T., Demirguc-Kunt, A. and V. Maksimovic. 2005. Financial and Legal Constraints to Growth: Does Firm Size Matter? Journal of Finance 60(1): pp 137-177.
Beck, T., Demirguc-Kunt, A. and V. Maksimovic. 2008. Financing patterns around the world: Are small firms different? Journal of Financial Economics 89 (3): pp, 467-487.
Beck, T. and Demirgüç-Kunt, Asli, 2009, Financial Institutions and Markets Across Countries and over Time: Data and Analysis, World Bank Policy Research Working Paper No. 4943.
Beck, T., and R. Levine, 2004, Stock Markets, Banks, and Growth: Panel Evidence, Journal of Banking and Finance, 28(3):423–42.
Beck, T., R. Levine, and N. Loayza, 2000, Finance and the Sources of Growth, Journal of Financial Economics 58: 261–300.
Biais, Bruno, and Christian Gollier. 1997. Trade Credit and Credit Rationing. The Review of Financial Studies 10 (4): 903–37.
Booth, L, Aivazian, V., Demirguc-Kunt, A., and Maksimovic, V. 2001. Capital structures in developing countries, Journal of Finance 56: 87-130.
Cetorelli, N., and M. Gambera, 2001, Banking Market Structure, Financial Dependence and Growth: International Evidence from Industry Data, Journal of Finance 56(2):617–648.
Choi, W. G., and Y. Kim 2005. Trade Credit and the Effect of Macro-Financial Shocks: Evidence from U.S. Panel Data. Journal of Financial and Quantitative Analysis, 40:4.
De Jong, A.; R. Kabir; and T. Nguyen.2008. Capital Structure around the World: The Roles of Firm- and Country-Specific Determinants. Journal of Banking and Finance, 32: 1954-1969.
Demirguc-Kunt, A. & Maksimovic, V. 1998. Law, finance and firm growth, Journal of Finance 53: 2107-2137.
Demirguc-Kunt, A. & Maksimovic, V. 1999. Institutions, financial markets and firm debtmaturity, Journal of Financial Economics 54: 295-336.
Demirguc-Kunt, A., and V. Maksimovic. 2001. Firms as Financial Intermediaries: Evidence from Trade Credit Data. World Bank Policy Research Working Paper No.2696.
33
Fairfield, P., S. Ramnath, and T. Yohn. 2009. Do Industry-Level Analyses Improve Forecasts of Financial Performance? Journal of Accounting Research 47(1):147-178.
Fairfield, P., S. Whisenant, and T. Yohn. 2003. Accrued earnings and growth: Implications for future profitability and market mispricing. The Accounting Review 78(1):353-371.
Fairfield, P., and T.L. Yohn. 2001. Using asset turnover and profit margin to forecast changes in profitability. Review of Accounting Studies 6: 371-385.
Fama, E. and K. French. 1995. Size and book-to-market factors in earnings and returns. Journal of Finance 50: 131-155.
Fisman, R. and I. Love. 2003. Trade Credit, Financial Intermediary Development and Industry Growth. The Journal of Finance 58(1):353 – 374.
Hail, L., C. Leuz, and P. Wysocki. 2010. Global Accounting Convergence and the Potential Adoption of IFRS by the U.S. (Part 1): Conceptual Underpinnings and Economic Analysis. Accounting Horizons 24: 355-394.
Hall, M and L. Weiss. 1967. Firm Size and Profitability. The Review of Economics and Statistics 49(3): 319-331.
Kaminsky, G., C. Reinhart. 1999. The Twin Crises: The Causes of Banking and Balance-of-Payment Problems. American Economic Review 89: 473-500.
Klapper, L., L. Laeven, and R. Rajan. 2011. Trade Credit Contracts. NBER Working Paper No. 17146.
Levine 2005. Finance and Growth: Theory and Evidence. Chapter 12 in Handbook of Economic Growth, Volume 1A. Elsevier B.V.
Levine, R., and S. Zervos. (1998). Stock markets, banks, and economic growth. American Economic Review 88: 537–558.
Li, F., R. Lundholm and M. Minnis. 2012. A new measure of competition based on 10-K filings: Derivations and implications for financial statement analysis. University of Michigan working paper.
Li, N., S. Richardson and I. Tuna. “Macro to Micro: Country exposures, firm fundamentals, and stock returns.” London Business School working paper, 2012.
Long, M. S.; I. B. Malitz; and S. A. Ravid. 1993. Trade Credit, Quality Guarantees, and Product Marketability. Financial Management 22: 117–127.
Love, I. 2003. Financial development and financing constraint: International evidence from the structural investment model. Review of Financial Studies 16:765–791.
34

Love, I., and R. Zaidi. 2010. Trade Credit, Bank Credit and Financial Crisis. International Review of Finance 10 (1): 125–47.
Lundholm R., and R., Sloan. 2007. Equity Valuation and Analysis with eVal. McGraw Hill Higher Education. 2nd Edition.
Myers, S. Capital Structure. 2001. Journal of Economic Perspectives 15 (2): 81-102.
Naranjo, P., D. Saavedra, and R. Verdi. IFRS adoption and financing decisions. Massachusetts Institute of Technology working paper, 2012.
Nilsen, J. H. 2002. Trade Credit and the Bank Lending Channel. Journal of Money, Credit, and Banking 34: 226–253.
Nissim, D. and S. Penman. 2001. Ratio analysis and equity valuation: from research to practice. Review of Accounting Studies 6(1): 109-154.
Nissim, D. and S. Penman, 2003. Financial statement analysis of leverage and how it informs about profitability and price-to-book ratios. Review of Accounting Studies 8(4): 531-560.
Palepu, K.G., P.M. Healy, and V.L. Bernard. 2004. Business Analysis and Valuation. South Western College Publishing.
Penman, S.H. 2010. Financial Statement Analysis and Security Valuation. McGraw Hill Company. New York. 4th Edition.
Petersen, M., and R. Rajan, 1997. Trade credit : Some Theories and Evidence. Review of Financial Studies 10(3): 661-691.
Rajan, R. and L. Zingales. 1995. What Do We Know About Capital Structure: Some evidence from International Data. Journal of Finance 50(5): 1421-60.
Rajan, R. and L. Zingales. 1998. Financial Dependence and Growth. The American Economic Review 88(3): 559-586.
Richardson, S., R. Sloan, M. Soliman, and I. Tuna. 2005. Accrual reliability, earnings persistence, and stock prices. Journal of Accounting and Economics 39: 437-485.
Soliman, M. 2004. Using industry-adjusted Dupont analysis to predict future profitability and returns. Ph.D. dissertation, University of Michigan.
Soliman, M. 2008. The use of Dupont analysis by market participants. The Accounting Review 83(3): 823-853.
Wilner, B. S. 2000. The Exploitation of Relationships in Financial Distress: The Case of Trade Credit. Journal of Finance 55:153–178.
35
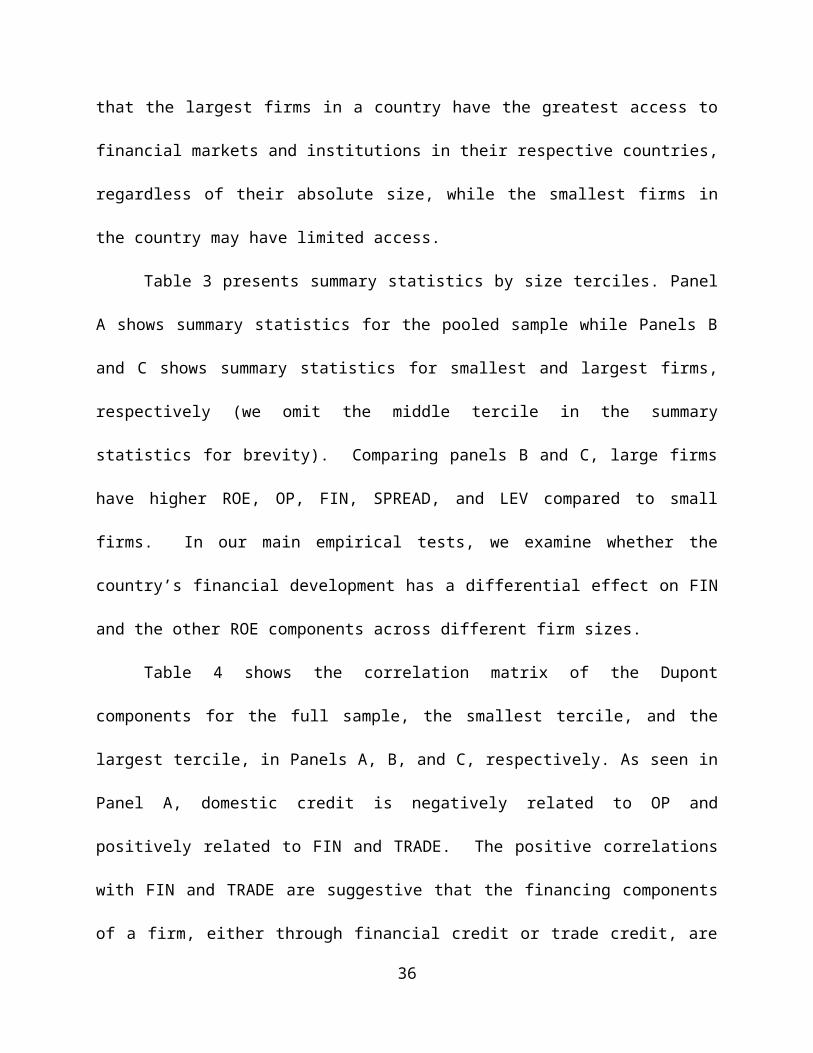
Figure 1 Domestic credit by country
0.0
0.5
1.0
1.5
2.0
2.5
3.0
3.5
Domestic credit / GDP for each country
Domcredit
Japan
Figure 1 shows the time-series mean domestic credit of each country listed in the order of domestic credit. Domestic credit is the level of credit provided by the banking sector in each country-year scaled by GDP from the World Development Indicators. The underlying country for each data point is shown in Table 2 column (2).
36
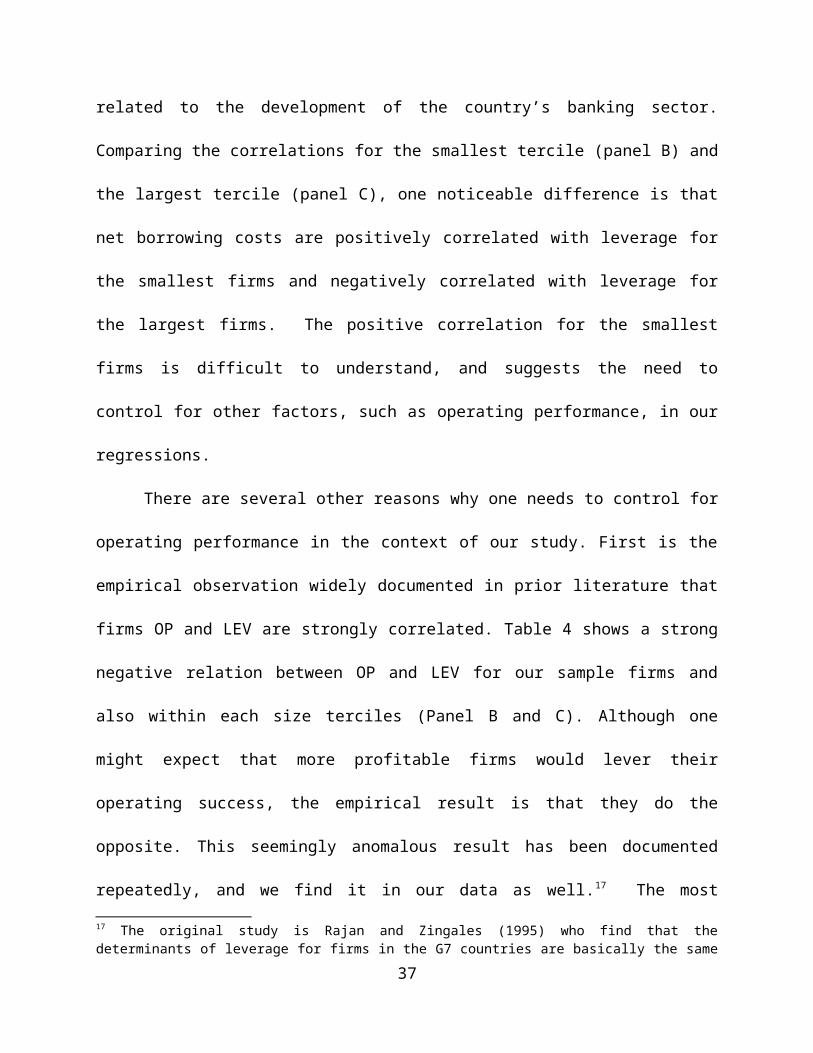
Figure 2 Decomposition of ROE by level of domestic credit
(0.100)
(0.050)
-
0.050
0.100
0.150
0.200
Operating performance Financing performance Trade performance
Domestic credit provided the banking sector /GDP
Perf
orm
ance
Figure 2 shows the country mean of each ROE component using all firm-year observations. The horizontal axis is the ranking of the country’s average domestic credit. Domestic credit is the level of credit provided by the banking sector in each country-year scaled by GDP from the World Development Indicators. The three components are ROE are defined in Section 2.2.
37

Figure 3 Financing contribution as a function of leverage and spread
FIN
large firms
small firms
LEV
SPREAD
38
Table 1 Sample selection
# of firm-years
527,912 (38,526) (12,670) (31,485) (66,989) (6,744)
(30,438) (10,649)
Total 330,411
Less: Financial industries
Less: Country with less than 50 firm-years
Less: Truncate observations with extreme 1% leverage and borrowing costLess: ROE > 100%, ROE < -100%, ROA>100%, ROA< -100%Less: Opearting performance >100%, Operating performance< -100%, NBC >100%
Number of firm-years from 1990-2010 with positive total assets, total net assets, and market cap > USD 1 millionLess: Countries with missing domestic credit measures
Less: Missing interest and/or tax expense
39
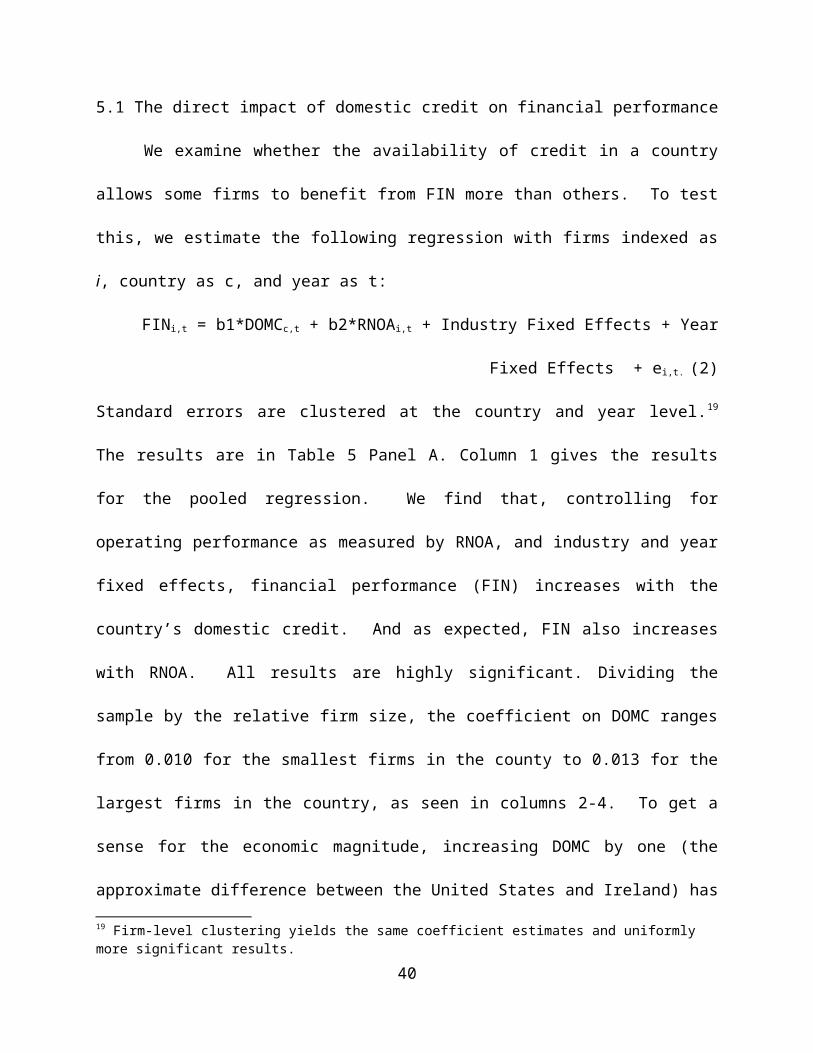
Table 2 Distribution of mean performance by level of country domestic credit
# of firmyears
Domestic credit
Operating performance
Financing performance
Trade performance
SAUDI ARABIA 331 0.099 0.095 0.012 0.017 PERU 915 0.193 0.092 0.003 0.013 VENEZUELA 219 0.199 0.105 (0.038) (0.044) NIGERIA 133 0.209 0.113 0.022 0.040 RUSSIAN FED. 1,083 0.271 0.091 0.002 0.005 OMAN 250 0.333 0.100 0.031 0.029 ARGENTINA 903 0.347 0.088 (0.017) (0.001) MEXICO 1,800 0.382 0.088 (0.018) (0.000) ROMANIA 335 0.394 0.071 (0.010) (0.009) KENYA 101 0.421 0.125 0.033 0.018 SRI LANKA 685 0.425 0.096 (0.000) 0.002 COLOMBIA 248 0.443 0.094 (0.026) (0.016) PAKISTAN 1,281 0.474 0.110 0.014 0.016 INDONESIA 3,301 0.474 0.080 (0.009) 0.003 TURKEY 1,938 0.477 0.154 (0.045) (0.041) POLAND 1,745 0.491 0.065 (0.001) 0.011 SLOVAKIA 68 0.531 0.052 (0.047) (0.004) PHILIPPINES 1,807 0.535 0.058 (0.013) (0.000) CZECH REP. 395 0.548 0.060 (0.015) 0.008 QATAR 84 0.563 0.099 0.033 0.011 LITHUANIA 144 0.578 0.038 (0.021) 0.003 BULGARIA 337 0.603 0.046 (0.024) 0.010 BAHRAIN 70 0.607 0.131 0.003 0.019 INDIA 11,374 0.617 0.091 0.014 0.019 SLOVENIA 150 0.648 0.060 (0.008) (0.008) HUNGARY 422 0.650 0.084 (0.008) (0.005) TUNISIA 69 0.709 0.108 (0.007) 0.001 NORWAY 1,677 0.719 0.057 (0.007) 0.005 KUWAIT 412 0.719 0.074 (0.002) 0.007 FINLAND 1,928 0.736 0.081 0.008 0.002 CROATIA 245 0.739 0.058 (0.020) 0.001 SINGAPORE 6,317 0.757 0.052 0.003 0.013 CHILE 1,844 0.818 0.082 0.006 0.010 BRAZIL 4,350 0.819 0.109 (0.032) 0.002 ISRAEL 1,548 0.819 0.056 0.003 0.008 EGYPT 524 0.849 0.131 0.024 0.026
(Continued)
40
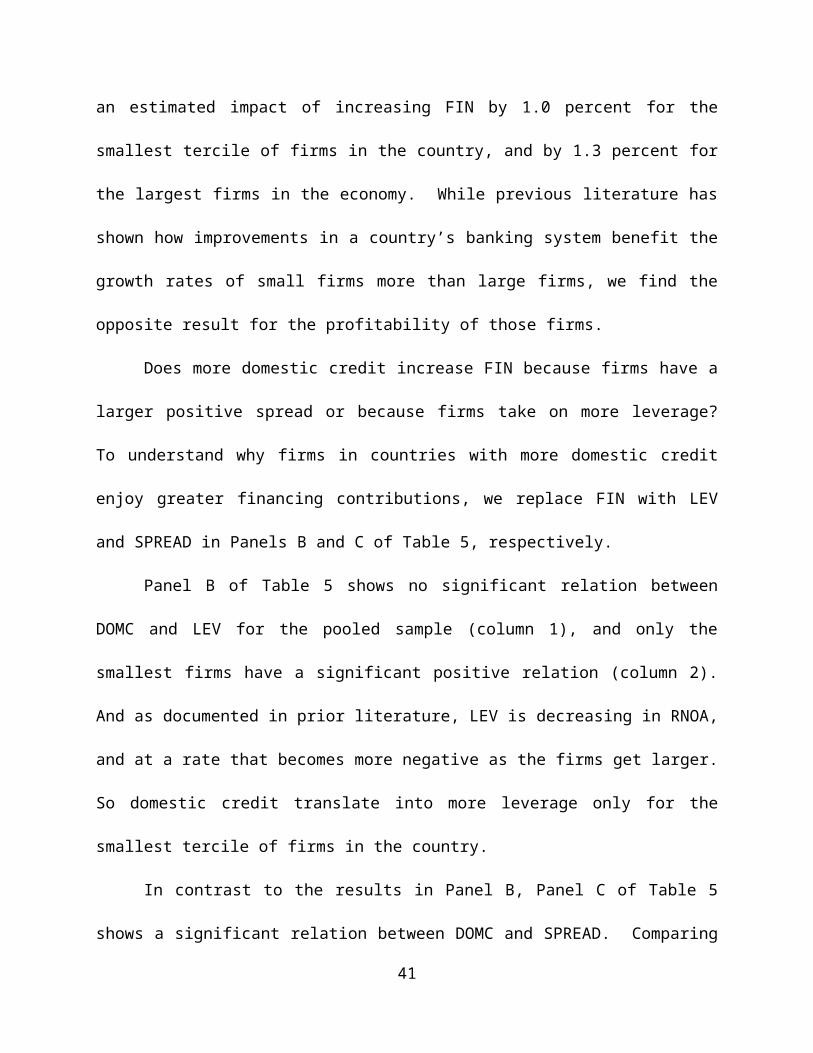
Table 2 (Continued)
# of firmyears
Domestic credit
Operating performance
Financing performance
Trade performance
LATVIA 111 0.866 0.050 (0.006) 0.004 MOROCCO 250 0.885 0.101 0.019 0.042 SOUTH KOREA 11,487 0.894 0.044 (0.020) 0.010 ESTONIA 67 0.907 0.096 0.001 (0.003) IRELAND 1,117 0.965 0.077 0.013 0.004 GREECE 3,269 1.005 0.071 (0.009) (0.007) ITALY 4,722 1.032 0.060 (0.016) (0.005) JORDAN 437 1.032 0.058 (0.009) 0.002 AUSTRALIA 7,977 1.064 0.043 (0.004) 0.006 FRANCE 9,721 1.086 0.080 0.001 (0.008) BELGIUM 1,865 1.124 0.076 0.005 0.000 DENMARK 2,525 1.138 0.063 (0.003) 0.015 PORTUGAL 971 1.156 0.074 (0.004) (0.005) VIETNAM 1,138 1.167 0.112 0.032 0.017 SWEDEN 4,302 1.184 0.051 0.003 0.017 LUXEMBOURG 263 1.196 0.083 0.009 (0.006) NEW ZEALAND 1,217 1.214 0.072 0.010 0.008 AUSTRIA 1,209 1.251 0.067 (0.003) 0.003 GERMANY 9,171 1.275 0.062 (0.009) 0.005 MALAYSIA 9,882 1.301 0.054 (0.011) (0.001) THAILAND 7,195 1.330 0.076 0.006 0.008 CHINA 14,559 1.346 0.049 (0.000) 0.008 UK 23,011 1.371 0.065 0.004 0.017 SPAIN 2,099 1.374 0.080 0.002 (0.000) NETHERLANDS 3,105 1.385 0.091 0.017 0.012 HONG KONG 8,597 1.478 0.049 (0.004) 0.006 CANADA 11,928 1.517 0.045 (0.007) 0.005 SOUTH AFRICA 3,607 1.531 0.120 0.007 0.022 SWITZERLAND 3,778 1.748 0.056 0.007 0.018 US 76,370 1.899 0.057 (0.002) 0.011 ICELAND 60 2.148 0.078 (0.015) (0.011) CYPRUS 245 2.455 0.038 (0.026) (0.011) JAPAN 55,123 2.952 0.024 0.000 0.011 Mean 0.920 0.077 (0.002) 0.011 STDev 0.533 0.026 0.017 0.018
Notes: This table shows the time-series mean domestic credit of each country and the country mean of each ROE component using all firm-year observations. Countries are listed in the order of the level of domestic credit. Domestic credit is the level of credit provided by the banking sector in each country-year scaled by GDP from the World Development Indicators.
41

Table 3 Descriptive statisticsPanel A All firmsVariable N mean sd min p25 p50 p75 maxROE 330,411 0.064 0.174 (1.000) 0.021 0.079 0.145 0.999 Operating performance 330,411 0.057 0.079 (0.759) 0.025 0.059 0.096 0.903 Financial performance 330,411 (0.002) 0.096 (1.364) (0.006) 0.003 0.026 0.837 = Leverage 330,411 0.812 1.027 0.000 0.153 0.499 1.064 54.839 X Spread 330,411 0.001 0.144 (2.401) (0.022) 0.017 0.061 0.897 Trade performance 330,411 0.009 0.037 (0.665) (0.002) 0.007 0.020 0.655
Panel B Firms in small size tercileVariable N mean sd min p25 p50 p75 maxROE 110,043 0.034 0.201 (1.000) (0.004) 0.062 0.135 0.999 Operating performance 110,043 0.046 0.101 (0.759) 0.012 0.053 0.098 0.903 Financial performance 110,043 (0.016) 0.102 (1.215) (0.012) 0.000 0.013 0.810 = Leverage 110,043 0.593 0.885 0.000 0.051 0.297 0.763 54.839 X Spread 110,043 (0.024) 0.178 (2.267) (0.066) 0.008 0.061 0.897 Trade performance 110,043 0.004 0.043 (0.665) (0.006) 0.004 0.018 0.655
Panel C Firms in large size tercileVariable N mean sd min p25 p50 p75 maxROE 110,325 0.091 0.147 (0.998) 0.04 0.093 0.155 0.998 Operating performance 110,325 0.065 0.057 (0.648) 0.03 0.063 0.094 0.555 Financial performance 110,325 0.013 0.090 (1.364) (0.00) 0.013 0.040 0.837 = Leverage 110,325 1.057 1.139 0.000 0.34 0.727 1.348 30.687 X Spread 110,325 0.021 0.106 (2.401) (0.00) 0.023 0.061 0.779 Trade performance 110,325 0.013 0.031 (0.463) 0.00 0.009 0.023 0.514
Notes: This table shows the descriptive of each ROE component. Panel A includes all firms in the sample and panel B(C) includes only firms in the highest (lowest) size tercile within each country-year. We sort firms into size terciles within each country-year. Size is defined as the year-end total assets. See section 3.2 for the definition of each ROE component.
42
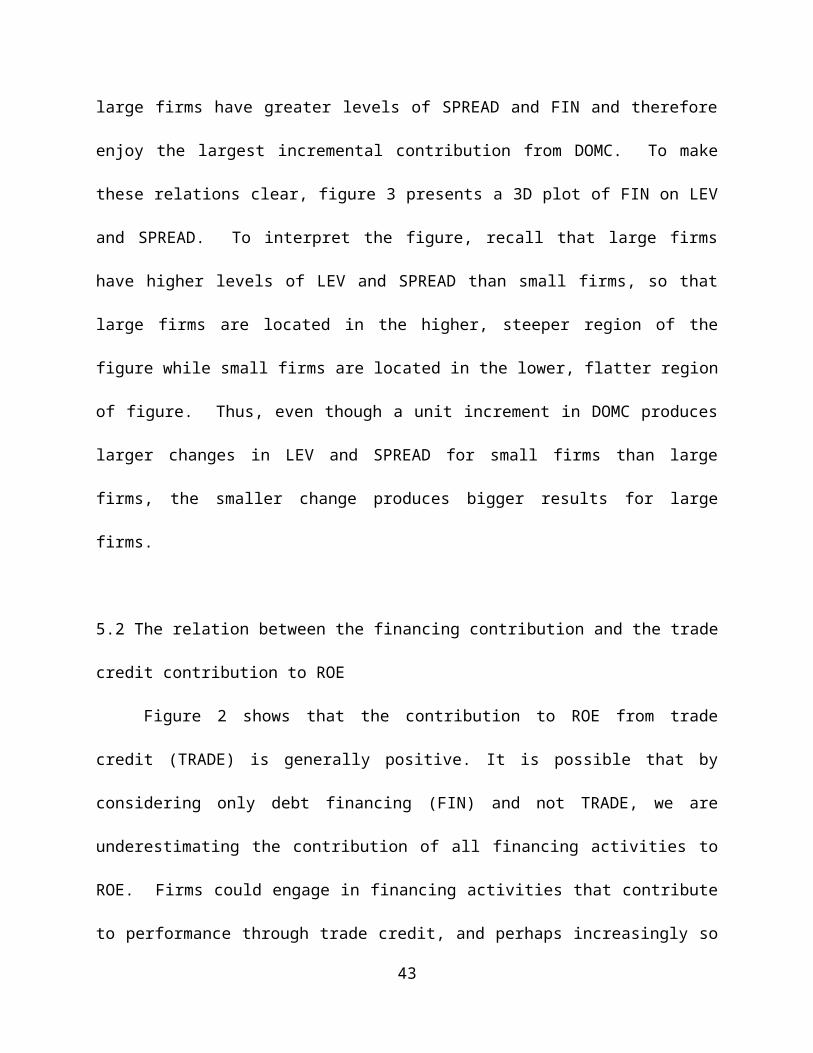
Table 4 Spearman correlations by size tercilesPanel A All firms
(N=330,411) ROEOperating
performanceFinancing
performance Leverage SpreadTrade
performanceDomestic
creditROEOperating performance 0.895 1.000Financing performance 0.756 0.504 1.000Leverage (0.070) (0.152) 0.198 1.000Spread 0.811 0.678 0.766 (0.133) 1.000Trade performance 0.789 0.643 0.540 (0.158) 0.666 1.000Domestic credit (0.157) (0.314) 0.019 (0.015) (0.002) 0.074 1.000NBC 0.059 0.234 (0.227) 0.113 (0.388) 0.040 (0.312)Panel B Firms in smallest size tercile
(N=110,043) ROEOperating
performanceFinancing
performance Leverage SpreadTrade
performanceDomestic
creditROE 1.000Operating performance 0.923 1.000Financing performance 0.737 0.533 1.000Leverage (0.098) (0.118) 0.067 1.000Spread 0.817 0.718 0.757 (0.143) 1.000Trade performance 0.846 0.732 0.595 (0.115) 0.712 1.000Domestic credit (0.140) (0.272) 0.035 0.000 (0.002) 0.040 1.000NBC 0.002 0.138 (0.252) 0.262 (0.437) (0.014) (0.267)Panel C Firms in largest size tercile
(N=110,325) ROEOperating
performanceFinancing
performance Leverage SpreadTrade
performanceDomestic
creditROEOperating performance 0.863 1.000Financing performance 0.787 0.496 1.000Leverage (0.116) (0.239) 0.200 1.000Spread 0.821 0.650 0.792 (0.205) 1.000Trade performance 0.725 0.539 0.483 (0.256) 0.624 1.000Domestic credit (0.164) (0.353) 0.006 0.012 (0.006) 0.115 1.000NBC 0.122 0.350 (0.220) (0.014) (0.305) 0.109 (0.344)
Notes: This table shows the spearman correlation of each ROE component and domestic credit. Panel A includes all firms in the sample and Panel B(C) includes only firms in the highest (lowest) size tercile within each country-year. Size is defined as the year-end total assets. We sort firms into size terciles within each country-year. This procedure groups together similarly ranked firms relative to the other firms in their country. Domestic credit is the level of credit provided by the banking sector in each country-year scaled by GDP from the World Development Indicators. See section 3.2 for definitions of each ROE component.
43
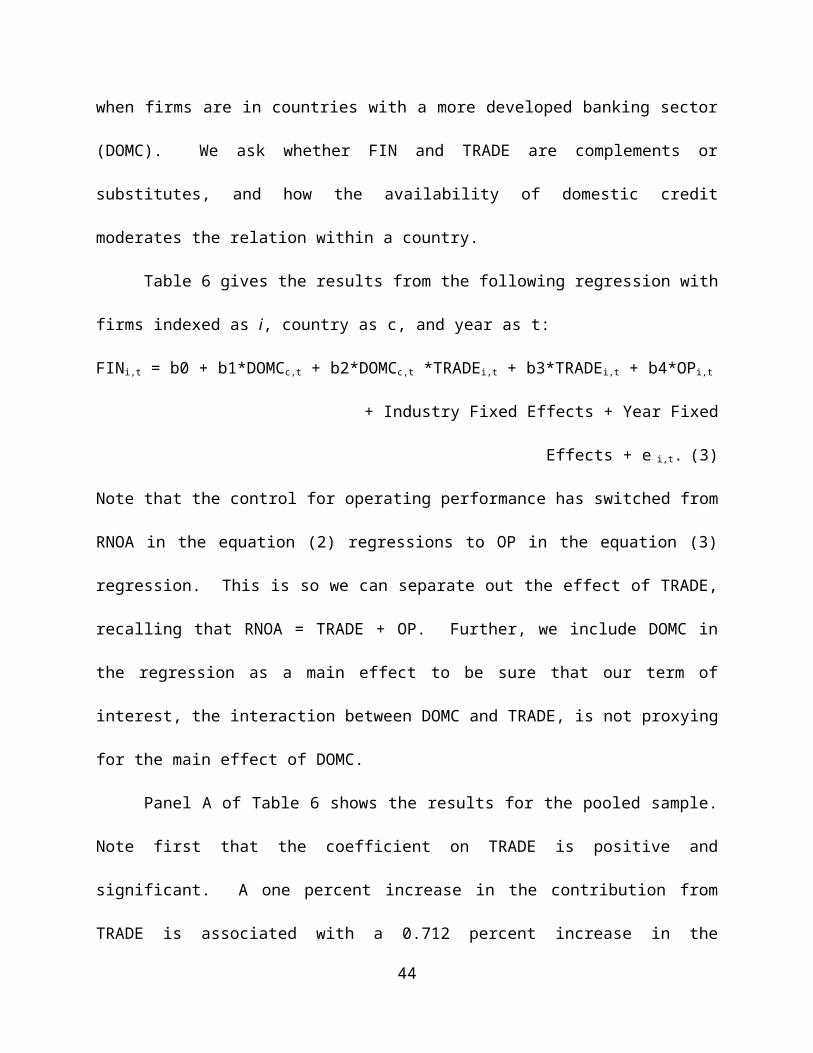
Table 5 Effect of domestic credit on financial performance by size terciles
Panel A: Financial performance by size terciles
VARIABLES
(1)Financial
Performance
(2)Financial
Performance
(3)Financial
Performance
(4)Financial
PerformanceDomestic credit 0.011*** 0.010*** 0.013*** 0.013***
[<0.001] [<0.001] [<0.001] [<0.001]RNOA 0.455*** 0.367*** 0.505*** 0.617***
[<0.001] [<0.001] [<0.001] [<0.001]
Observations 330,389 110,028 110,036 110,325Adjusted R-squared 0.248 0.224 0.257 0.288Size rank all small mid largeYear FE YES YES YES YESIndustry FE YES YES YES YESSE cluster country
& yearcountry & year
country & year
country & year
Panel B: Leverage by size terciles(1) (2) (3) (4)
VARIABLES Leverage Leverage Leverage LeverageDomestic credit 0.061 0.079** -0.008 0.057
[0.112] [0.041] [0.818] [0.227]RNOA -1.064*** -0.508*** -1.658*** -2.777***
[<0.001] [<0.001] [<0.001] [<0.001]
Observations 330,389 110,028 110,036 110,325Adjusted R-squared 0.061 0.047 0.062 0.085Size rank all small mid largeYear FE YES YES YES YESindustry FE YES YES YES YESSE cluster country
& yearcountry & year
country & year
country & year
44
Table 5 (Continued)
Panel C: Spread by size tercile
VARIABLES(1)
Spread(2)
Spread(3)
Spread(4)
SpreadDomestic credit 0.022*** 0.026*** 0.022*** 0.016***
[<0.001] [<0.001] [<0.001] [<0.001]RNOA 0.943*** 0.984*** 0.905*** 0.837***
[<0.001] [<0.001] [<0.001] [<0.001]
Observations 330,389 110,028 110,036 110,325Adjusted R-squared 0.468 0.528 0.401 0.378Size rank all small mid largeYear FE YES YES YES YESIndustry FE YES YES YES YESSE cluster country
& yearcountry & year
country & year
country & year
Notes: Panel A reports the estimation from an OLS regression of equation (2) where the dependent variable is financial performance. Panel B uses leverage and Panel C uses spread as the dependent variable. We sort firms into size terciles within each country-year. Size is defined as the year-end total assets. Domestic credit is the level of credit provided by the banking sector in each country-year scaled by GDP from the World Development Indicators. All other variables are defined in section 3.2. Standard errors are clustered on year and country. Significance is denoted by ***, **, and * for 1%, 5%, and 10% respectively, using a two-tailed test.
45

Table 6 Effect of domestic credit on the trade-off between debt financing and trade credit
Dependent variable: Financial performance
VARIABLES(1)
All firms(2)
smallest size tercile(3)
middle size tercile(4)
largest size tercileDomestic credit 0.007*** 0.006*** 0.011*** 0.010***
[<0.001] [0.002] [<0.001] [<0.001]Domestic credit *Trade performance 0.049 0.066 -0.032 0.115***
[0.482] [0.561] [0.702] [0.009]Trade performance 0.712*** 0.646*** 0.812*** 0.590***
[<0.001] [<0.001] [<0.001] [<0.001]Operating performance 0.319*** 0.227*** 0.391*** 0.545***
[<0.001] [<0.001] [<0.001] [<0.001]
Observations 330,389 110,028 110,036 110,325Adjusted R-squared 0.259 0.240 0.263 0.290Size rank all small mid largeYear FE YES YES YES YESindustry FE YES YES YES YEScluster country & year country & year country & year country & yearr2_a 0.259 0.240 0.263 0.290Notes: This table reports the estimation from an OLS regression where the dependent variable is financial performance. Domestic credit is the level of credit provided by the banking sector in each country-year scaled by GDP from the World Development Indicators. All other variables are defined in section 2. Standard errors are clustered on year and country. Significance is denoted by ***, **, and * for 1%, 5%, and 10% respectively, using a two-tailed test.
46
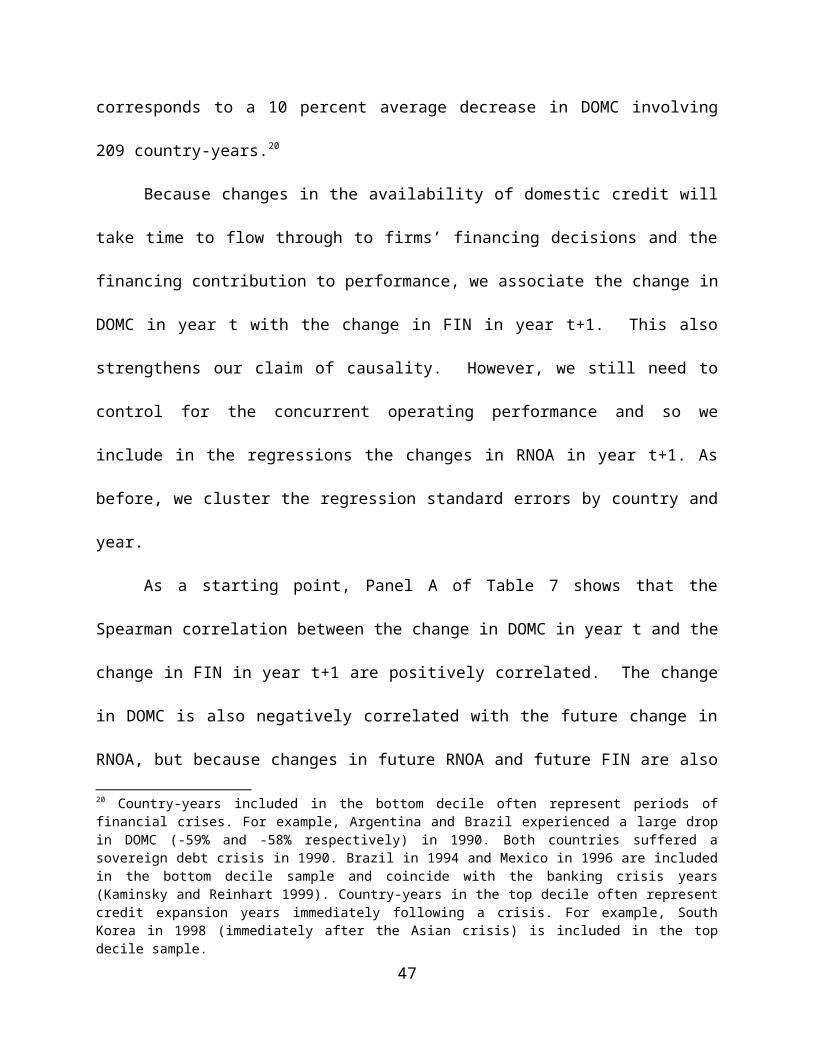
Table 7 Effect of large shocks in domestic credit on financial performance
Panel A: Spearman correlations, periods of shocks in domestic creditChanges in domestic credit
Changes in Financial performance (t+1)
Changes in RNOA (t+1)
Changes in domestic credit 1.000Changes in Financial performance (t+1) 0.062 1.000Changes in RNOA (t+1) -0.063 -0.089 1.000
Panel B: Future changes in financial performance, periods with large increase in domestic credit(1) (2) (3) (4)
All firms smallest size tercile middle size tercile largest size tercileChanges in domestic credit 0.0004*** 0.0003** 0.0004** 0.0004***
[<0.001] [0.020] [0.011] [<0.001]Changes in RNOA 0.5118*** 0.4198*** 0.5297*** 0.6798***
[<0.001] [<0.001] [<0.001] [<0.001]
Observations 26,469 8,545 8,921 9,003Adjusted R-squared 0.228 0.212 0.232 0.267Industry FE YES YES YES YEScluster country & year country & year country & year country & year
VARIABLES
Panel C: Future changes in financial performance, periods with large decrease in domestic credit
(1) (2) (3) (4)
All firms smallest size tercile middle size tercile largest size tercile
Changes in domestic credit 0.0002 0.0004 0.0001 0.0001[0.145] [0.149] [0.447] [0.684]
Changes in RNOA 0.4822*** 0.3763*** 0.5445*** 0.6377***[<0.001] [<0.001] [<0.001] [<0.001]
Observations 26,387 8,566 8,922 8,899Adjusted R-squared 0.225 0.203 0.231 0.278Industry FE YES YES YES YEScluster country & year country & year country & year country & year
VARIABLES
Notes: This table reports the estimation from an OLS regression where the dependent variable is changes in financial performance using only a subsample with large shocks in domestic credit. Shocks in domestic credit is defined as periods where the % changes in domestic credit is in the extreme 10% of the sample distribution. This corresponds to a 17% average increase in domestic credit (as a % of GDP) for the sample of periods with large increases (Panel B) and a -10% average drop for the sample of large decrease (Panel C). All other variables are defined in section 2 Standard errors are clustered on year and country. Significance is denoted by ***, **, and * for 1%, 5%, and 10% respectively, using a two-tailed test.
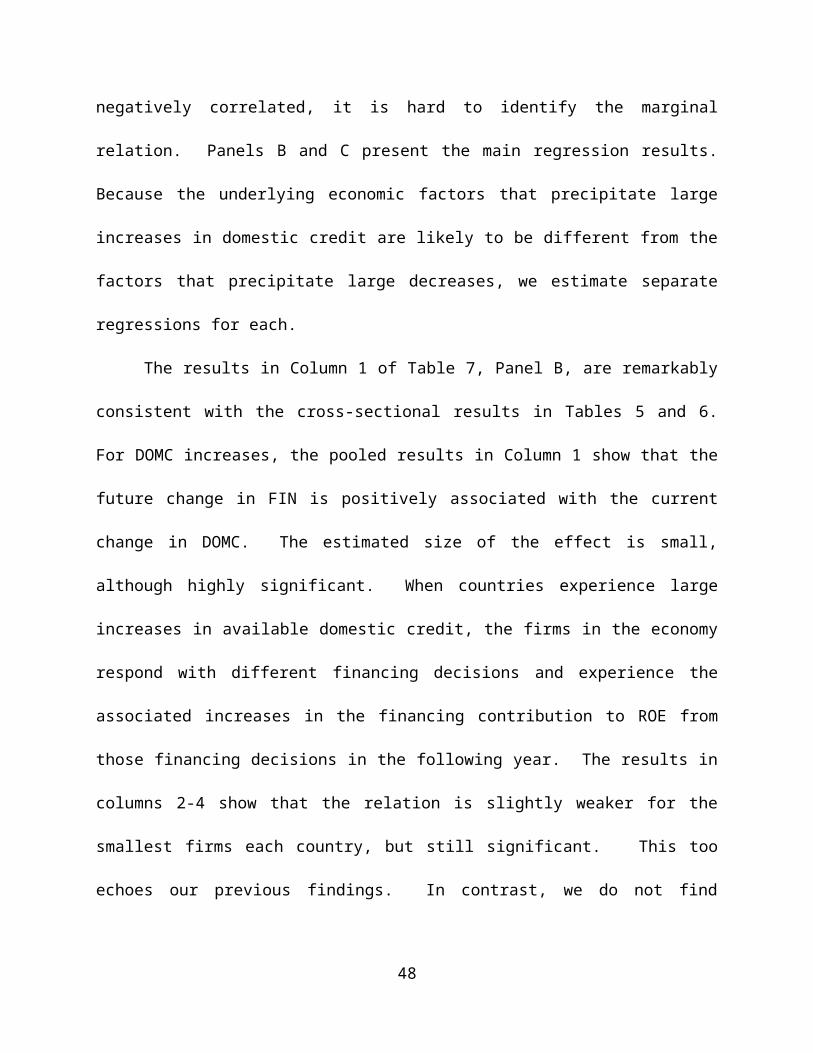
Table 8 Sensitivity analysis
Panel A Financial performance by size tercile, excluding Japan
VARIABLES(1)
All firms(2)
smallest size tercile(3)
middle size tercile(4)
largest size tercileDomestic credit 0.009*** 0.005 0.008*** 0.012***
[0.002] [0.248] [0.004] [<0.001]RNOA 0.443*** 0.350*** 0.495*** 0.608***
[<0.001] [<0.001] [<0.001] [<0.001]
Observations 275,266 91,662 91,662 91,942Adjusted R-squared 0.247 0.221 0.257 0.288Size rank all small mid largeYear FE YES YES YES YESIndustry FE YES YES YES YESSE cluster country & year country & year country & year country & year
Panel B: Financial performance by size tercile, using a measure of financial development including the public debt market
VARIABLES(1)
All firms(2)
smallest size tercile(3)
middle size tercile(4)
largest size tercileDomestic credit 0.007*** 0.006*** 0.008*** 0.009***
+ Public debt market [<0.001] [<0.001] [<0.001] [<0.001]RNOA 0.462*** 0.371*** 0.512*** 0.631***
[<0.001] [<0.001] [<0.001] [<0.001]
Observations 305,774 101,778 101,864 102,132Adjusted R-squared 0.251 0.225 0.260 0.296Size rank all small mid largeYear FE YES YES YES YESIndustry FE YES YES YES YEScluster country & year country & year country & year country & year
48
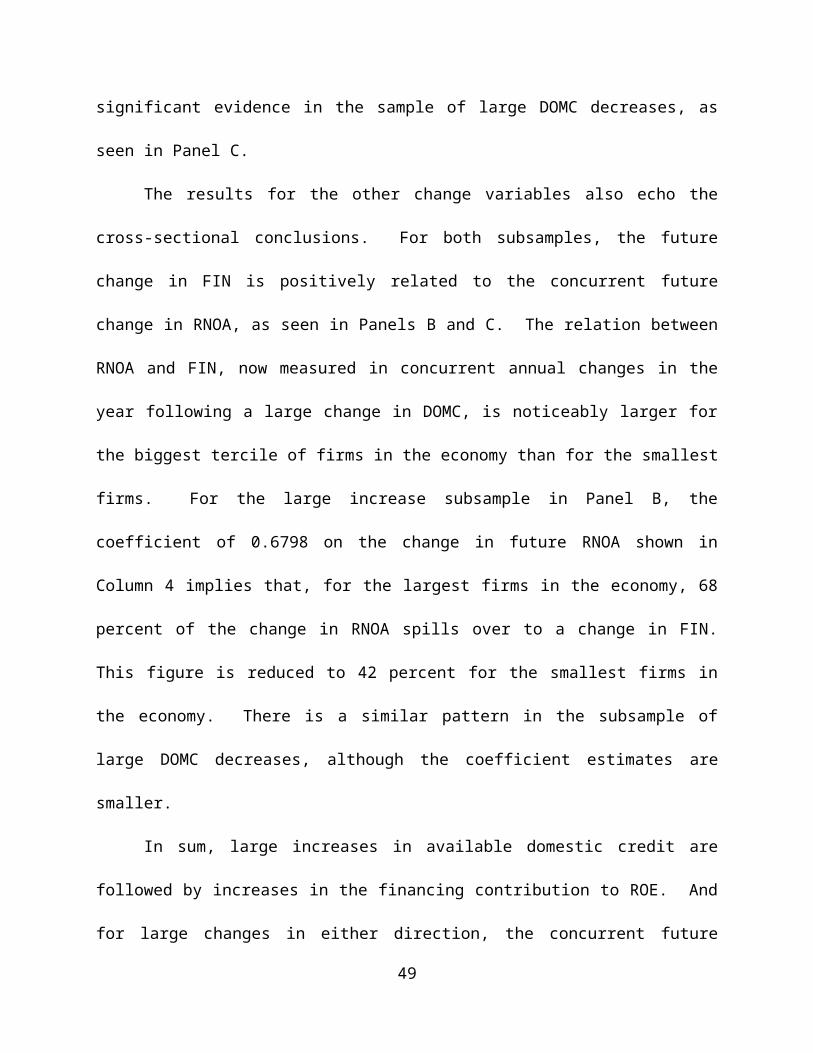
Table 8 (Continued)
Panel C Financial performance by size tercile, holdings accounting standards constant
VARIABLES(1)
All firms(2)
smallest size tercile(3)
middle size tercile(4)
largest size tercileDomestic credit 0.005* -0.002 0.003 0.010***
[0.051] [0.521] [0.147] [<0.001]RNOA 0.445*** 0.339*** 0.500*** 0.630***
[<0.001] [<0.001] [<0.001] [<0.001]
Observations 119,318 36,820 39,401 43,097Adjusted R-squared 0.256 0.217 0.265 0.313Size rank all small mid largeYear FE YES YES YES YESIndustry FE YES YES YES YEScluster country & year country & year country & year country & yearNotes: Panel A reports the estimation from an OLS regression of equation (2) after excluding Japan from the analysis. Panel B reports the estimation of equation (2) using an alternative measure of domestic credit. The measure of financial market development aggregates the domestic credit measure with the size of the public debt issued by financial institutions and corporations as a share of GDP (as a share of GDP). The public debt market data is from the Bank of International Settlements and used in prior studies such as Beck et al. (2009). Panel C reports the estimation of equation (2) after restricting the sample to firm-years use an international accounting standard, e.g., IFRS or U.S GAAP. Domestic credit is the level of credit provided by the banking sector in each country-year scaled by GDP from the World Development Indicators. The public debt variable is the private domestic debt securities issued by financial institutions and corporations as a share of GDP from the Bank of International Settlements (Beck et al. 2009). We sort firms into size terciles within each country-year. Size is defined as the year-end total assets. All other variables are defined in section 2. Standard errors are clustered on year and country. Significance is denoted by ***, **, and * for 1%, 5%, and 10% respectively, using a two-tailed test.
49