web volume report cmeg
TRANSCRIPT
8/6/2019 Web Volume Report CMEG
http://slidepdf.com/reader/full/web-volume-report-cmeg 1/20
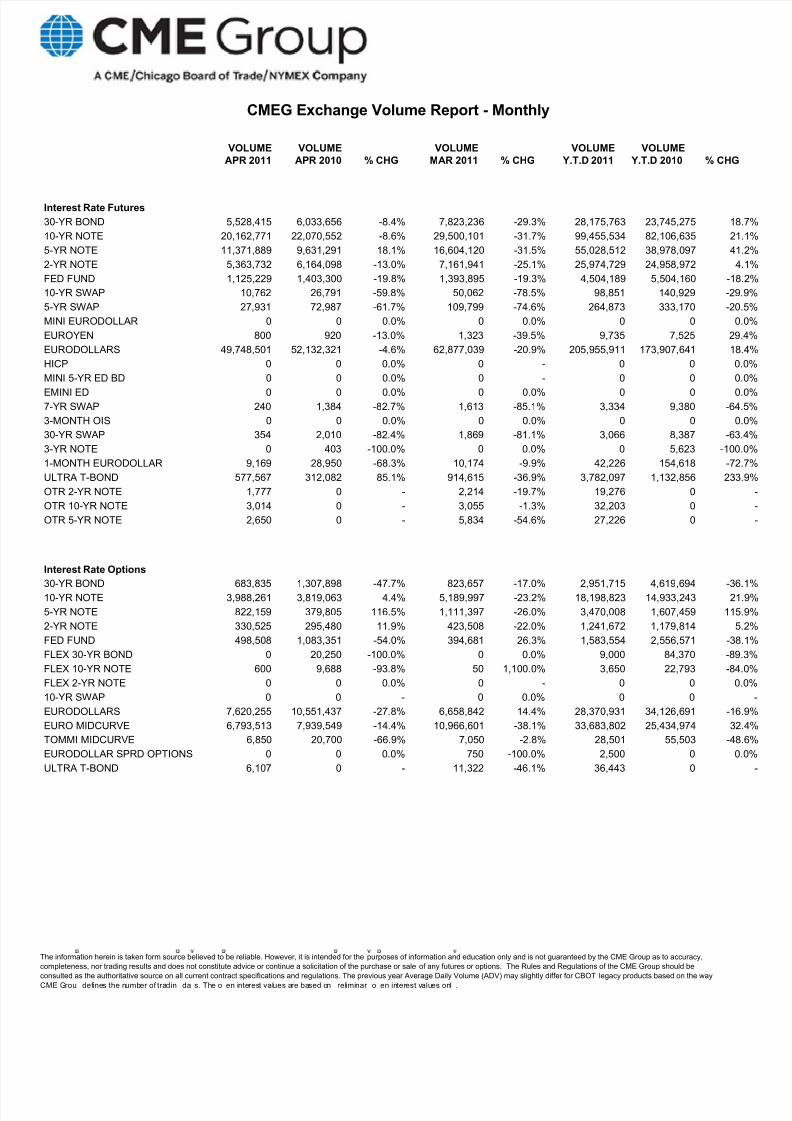
CMEG Exchange Volume Report - Monthly
Interest Rate Futures
30-YR BOND 5,528,415 6,033,656 -8.4% 7,823,236 -29.3% 28,175,763 23,745,275 1
10-YR NOTE 20,162,771 22,070,552 -8.6% 29,500,101 -31.7% 99,455,534 82,106,635 2
5-YR NOTE 11,371,889 9,631,291 18.1% 16,604,120 -31.5% 55,028,512 38,978,097 4
2-YR NOTE 5,363,732 6,164,098 -13.0% 7,161,941 -25.1% 25,974,729 24,958,972
FED FUND 1,125,229 1,403,300 -19.8% 1,393,895 -19.3% 4,504,189 5,504,160 -1
10-YR SWAP 10,762 26,791 -59.8% 50,062 -78.5% 98,851 140,929 -2
5-YR SWAP 27,931 72,987 -61.7% 109,799 -74.6% 264,873 333,170 -2
MINI EURODOLLAR 0 0 0.0% 0 0.0% 0 0
EUROYEN 800 920 -13.0% 1,323 -39.5% 9,735 7,525 2
EURODOLLARS 49,748,501 52,132,321 -4.6% 62,877,039 -20.9% 205,955,911 173,907,641 1
HICP 0 0 0.0% 0 - 0 0
MINI 5-YR ED BD 0 0 0.0% 0 - 0 0
EMINI ED 0 0 0.0% 0 0.0% 0 0
7-YR SWAP 240 1,384 -82.7% 1,613 -85.1% 3,334 9,380 -6
3-MONTH OIS 0 0 0.0% 0 0.0% 0 0
30-YR SWAP 354 2,010 -82.4% 1,869 -81.1% 3,066 8,387 -6
3-YR NOTE 0 403 -100.0% 0 0.0% 0 5,623 -10
1-MONTH EURODOLLAR 9,169 28,950 -68.3% 10,174 -9.9% 42,226 154,618 -7
ULTRA T-BOND 577,567 312,082 85.1% 914,615 -36.9% 3,782,097 1,132,856 23
OTR 2-YR NOTE 1,777 0 - 2,214 -19.7% 19,276 0
OTR 10-YR NOTE 3,014 0 - 3,055 -1.3% 32,203 0
OTR 5-YR NOTE 2,650 0 - 5,834 -54.6% 27,226 0
Interest Rate Options
30-YR BOND 683,835 1,307,898 -47.7% 823,657 -17.0% 2,951,715 4,619,694 -3
10-YR NOTE 3,988,261 3,819,063 4.4% 5,189,997 -23.2% 18,198,823 14,933,243 2
5-YR NOTE 822,159 379,805 116.5% 1,111,397 -26.0% 3,470,008 1,607,459 11
2-YR NOTE 330,525 295,480 11.9% 423,508 -22.0% 1,241,672 1,179,814
FED FUND 498,508 1,083,351 -54.0% 394,681 26.3% 1,583,554 2,556,571 -3
FLEX 30-YR BOND 0 20,250 -100.0% 0 0.0% 9,000 84,370 -8
FLEX 10-YR NOTE 600 9,688 -93.8% 50 1,100.0% 3,650 22,793 -8
FLEX 2-YR NOTE 0 0 0.0% 0 - 0 0
10-YR SWAP 0 0 - 0 0.0% 0 0
EURODOLLARS 7,620,255 10,551,437 -27.8% 6,658,842 14.4% 28,370,931 34,126,691 -1
EURO MIDCURVE 6,793,513 7,939,549 -14.4% 10,966,601 -38.1% 33,683,802 25,434,974 3
TOMMI MIDCURVE 6,850 20,700 -66.9% 7,050 -2.8% 28,501 55,503 -4
EURODOLLAR SPRD OPTIONS 0 0 0.0% 750 -100.0% 2,500 0
ULTRA T-BOND 6,107 0 - 11,322 -46.1% 36,443 0
VOLUME
APR 2011
VOLUME
APR 2010 % CHG
VOLUME
MAR 2011 % CHG
VOLUME
Y.T.D 2011
VOLUME
Y.T.D 2010 % CHG
The information herein is taken form source believed to be reliable. However, it is intended for the purposes of information and education only and is not guaranteed by the CME Group as to accuracy,
completeness, nor trading results and does not constitute advice or continue a solicitation of the purchase or sale of any futures or options. The Rules and Regulations of the CME Group should beconsulted as the authoritative source on all current contract specifications and regulations. The previous year Average Daily Volume (ADV) may slightly differ for CBOT legacy products based on the way
CME Grou defines the number of tradin da s. The o en interest values are based on reliminar o en interest values onl .

8/6/2019 Web Volume Report CMEG
http://slidepdf.com/reader/full/web-volume-report-cmeg 2/20
CMEG Exchange Volume Report - Monthly
Equity Index Futures
$25 DJ 20 105 -81.0% 23 -13.0% 104 1,172 -9
DJIA 22,807 14,352 58.9% 30,645 -25.6% 79,978 62,394 2
MINI $5 DOW 1,830,753 2,684,336 -31.8% 3,177,578 -42.4% 9,115,103 10,523,790 -1
E-MINI S&P500 32,705,072 43,563,248 -24.9% 60,446,072 -45.9% 168,161,194 173,957,970 -
S&P 500 306,622 363,465 -15.6% 1,161,950 -73.6% 2,120,595 2,283,581 -
S&P 600 SMALLCAP EMINI 907 2,835 -68.0% 1,600 -43.3% 4,704 10,700 -5
E-MINI MSCI EAFE FUT 42,525 46,994 -9.5% 145,606 -70.8% 281,289 230,659 2
E-MINI MSCI 55,645 27,129 105.1% 171,141 -67.5% 365,825 160,071 12
SPDR-S&P 500 0 228 -100.0% 0 0.0% 101 556 -8
TRAKRS ROGERS 0 213,774 -100.0% 0 0.0% 0 928,757 -10
TRAKRS BXY 0 0 0.0% 1,100 -100.0% 1,100 0
TRAKRS PIMCO 17,253 24,191 -28.7% 55,986 -69.2% 181,237 98,417 8
TRAKRS PIMCO SPTR 2,575 27,630 -90.7% 25,790 -90.0% 38,260 52,510 -2E-MINI MIDCAP 427,817 556,649 -23.1% 797,744 -46.4% 2,009,332 2,410,792 -1
S&P 400 MIDCAP 2,098 1,019 105.9% 4,887 -57.1% 10,691 11,326 -
S&P 500 GROWTH 6 5 20.0% 109 -94.5% 128 447 -7
S&P 500/VALUE 4 77 -94.8% 129 -96.9% 153 1,597 -9
IWM-RUSSELL 0 13 -100.0% 0 0.0% 16 30 -4
E-MINI NASDAQ 100 4,912,730 5,937,949 -17.3% 8,138,466 -39.6% 22,801,325 25,277,044 -
NASDAQ 35,746 34,026 5.1% 58,401 -38.8% 152,060 177,108 -1
QQQ-NASDAQ 0 89 -100.0% 0 0.0% 10 240 -9
NIKKEI 225 ($) STOCK 168,314 234,861 -28.3% 561,675 -70.0% 1,101,201 901,707 2
NIKKEI 225 (YEN) STOCK 356,889 403,506 -11.6% 1,000,535 -64.3% 2,178,041 1,454,060 4
S&P FIN SECT INDEX 0 10 -100.0% 0 0.0% 60 260 -7
TECH SPECTOR 0 0 0.0% 0 - 0 0
E-MINI S&P500 EURO DENOM 0 470 -100.0% 0 0.0% 0 2,252 -10
DOW-UBS COMMOD INDEX 5,311 2,348 126.2% 24,136 -78.0% 31,491 30,692
E-MICRO NIFTY 3,058 0 - 3,445 -11.2% 19,997 0
E-MINI NIFTY 179 0 - 181 -1.1% 768 0
S&P HEALTH CARE SECTOR 0 0 - 3 -100.0% 3 0
S&P INDUSTRIAL SECTOR 4 0 - 0 - 4 0
S&P CONSUMER STAPLES SECT 2 0 - 0 - 2 0
S&P FINANCIAL SECTOR 32 0 - 5 540.0% 37 0
S&P CONSUMER DSCRTNRY SE 0 0 - 2 -100.0% 2 0
VOLUME
APR 2011
VOLUME
APR 2010 % CHG
VOLUME
MAR 2011 % CHG
VOLUME
Y.T.D 2011
VOLUME
Y.T.D 2010 % CHG
The information herein is taken form source believed to be reliable. However, it is intended for the purposes of information and education only and is not guaranteed by the CME Group as to accuracy,
completeness, nor trading results and does not constitute advice or continue a solicitation of the purchase or sale of any futures or options. The Rules and Regulations of the CME Group should beconsulted as the authoritative source on all current contract specifications and regulations. The previous year Average Daily Volume (ADV) may slightly differ for CBOT legacy products based on the way
CME Grou defines the number of tradin da s. The o en interest values are based on reliminar o en interest values onl .

8/6/2019 Web Volume Report CMEG
http://slidepdf.com/reader/full/web-volume-report-cmeg 3/20
CMEG Exchange Volume Report - Monthly
Equity Index Options
DJIA 82 517 -84.1% 138 -40.6% 417 1,198 -6
MINI $5 DOW 6,993 5,510 26.9% 11,940 -41.4% 38,829 25,680 5
E-MINI S&P500 1,974,653 1,865,488 5.9% 2,781,960 -29.0% 9,133,507 6,355,293 4
S&P 500 945,529 799,203 18.3% 1,083,182 -12.7% 3,833,044 3,179,193 2
E-MINI MIDCAP 21 468 -95.5% 46 -54.3% 115 2,213 -9
S&P 400 MIDCAP 0 0 0.0% 0 - 0 0
E-MINI NASDAQ 100 88,436 43,512 103.2% 95,899 -7.8% 336,940 176,912 9
NASDAQ 986 82 1,102.4% 1,919 -48.6% 7,730 224 3,35
NIKKEI 225 ($) STOCK 0 300 -100.0% 0 0.0% 0 1,200 -10
EOM S&P 500 106,459 184,444 -42.3% 160,395 -33.6% 440,551 565,307 -2
EOM EMINI S&P 240,019 140,518 70.8% 253,803 -5.4% 891,896 517,262 7
EOW1 S&P 500 8,980 2,516 256.9% 23,197 -61.3% 54,929 54,907
EOW1 EMINI S&P 500 55,595 22,776 144.1% 159,508 -65.1% 463,870 123,663 27EOW2 S&P 500 27,707 11,896 132.9% 39,268 -29.4% 121,279 77,596 5
EOW2 EMINI S&P 500 63,366 22,990 175.6% 161,624 -60.8% 438,014 152,232 18
EOW4 EMINI S&P 500 94,146 0 - 87,089 8.1% 448,041 0
Metals Futures
COMEX GOLD 3,145,214 2,932,328 7.3% 4,512,310 -30.3% 15,122,557 15,508,262 -
E-MINI SILVER 3 105 -97.1% 3 0.0% 12 513 -9
E-MINI GOLD 0 495 -100.0% 0 0.0% 963 2,437 -6
COMEX MINY GOLD 8,909 3,467 157.0% 11,865 -24.9% 48,064 34,440 3
COMEX MINY COPPER 1,633 651 150.8% 2,134 -23.5% 8,208 2,992 17
COMEX MINY SILVER 20,983 702 2,889.0% 9,158 129.1% 41,525 3,692 1,02COMEX SILVER 3,014,624 994,814 203.0% 1,685,667 78.8% 7,804,718 3,566,015 11
COMEX COPPER 1,079,426 1,049,049 2.9% 931,882 15.8% 3,868,592 3,463,478 1
NYMEX HOT ROLLED STEEL 684 2,136 -68.0% 1,549 -55.8% 4,996 6,270 -2
NYMEX PLATINUM 105,524 91,365 15.5% 235,375 -55.2% 561,061 437,035 2
PALLADIUM 85,897 58,104 47.8% 94,402 -9.0% 373,691 245,224 5
OTC LND GOLD 0 0 0.0% 0 - 0 0
VOLATILITY GOLD 0 0 - 0 0.0% 4 0
E-MICRO GOLD 22,211 0 - 28,421 -21.9% 93,934 0
Metals Options
COMEX GOLD 700,811 508,105 37.9% 713,126 -1.7% 3,068,503 2,028,770 5
COMEX SILVER 291,003 78,096 272.6% 187,233 55.4% 802,226 385,389 10COMEX COPPER 308 2,820 -89.1% 555 -44.5% 1,783 7,347 -7
NYMEX PLATINUM 7,682 0 0.0% 4,499 70.7% 14,589 1,145 1,17
PALLADIUM 1,236 0 - 790 56.5% 7,341 0
IRON ORE CHINA 0 0 - 330 -100.0% 330 0
Energy Futures
ETHANOL FWD 50,952 38,177 33.5% 66,940 -23.9% 210,110 209,888
ETHANOL LAB 0 0 0.0% 0 0.0% 0 0
ETHANOL GCB 0 0 0.0% 0 - 0 0
VOLUME
APR 2011
VOLUME
APR 2010 % CHG
VOLUME
MAR 2011 % CHG
VOLUME
Y.T.D 2011
VOLUME
Y.T.D 2010 % CHG
The information herein is taken form source believed to be reliable. However, it is intended for the purposes of information and education only and is not guaranteed by the CME Group as to accuracy,
completeness, nor trading results and does not constitute advice or continue a solicitation of the purchase or sale of any futures or options. The Rules and Regulations of the CME Group should beconsulted as the authoritative source on all current contract specifications and regulations. The previous year Average Daily Volume (ADV) may slightly differ for CBOT legacy products based on the way
CME Grou defines the number of tradin da s. The o en interest values are based on reliminar o en interest values onl .
8/6/2019 Web Volume Report CMEG
http://slidepdf.com/reader/full/web-volume-report-cmeg 4/20
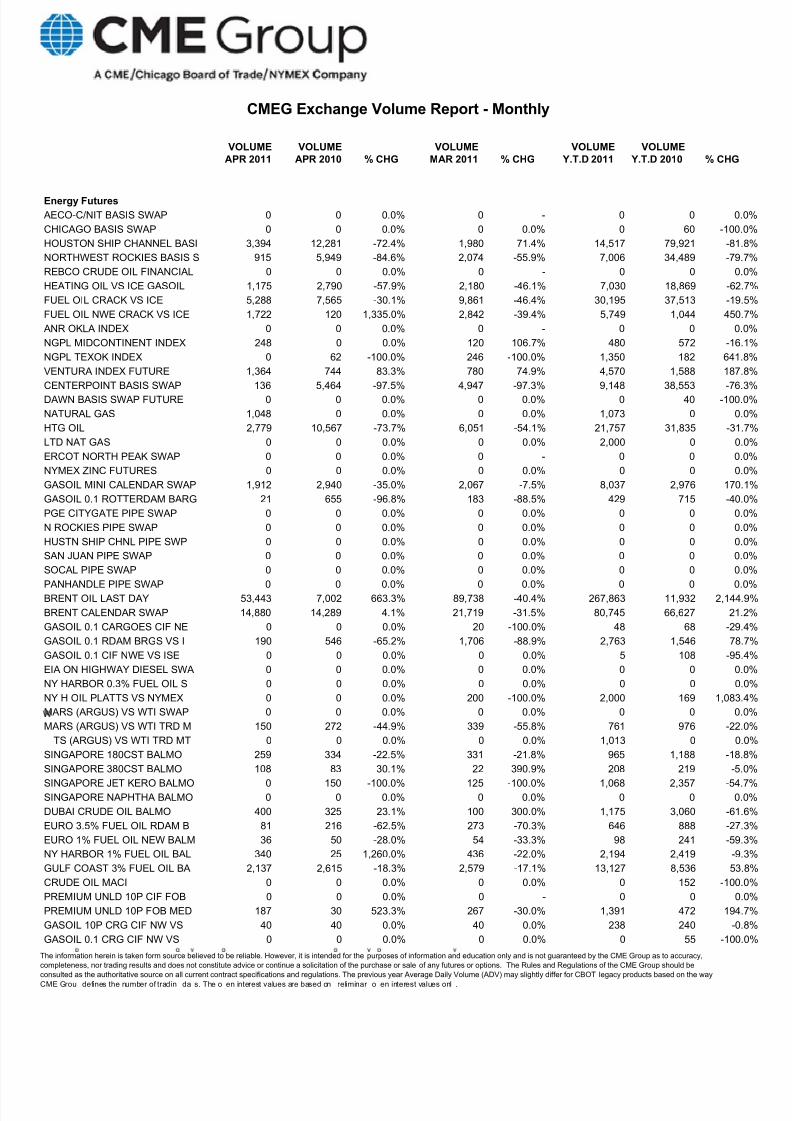
CMEG Exchange Volume Report - Monthly
Energy Futures
AECO-C/NIT BASIS SWAP 0 0 0.0% 0 - 0 0
CHICAGO BASIS SWAP 0 0 0.0% 0 0.0% 0 60 -10
HOUSTON SHIP CHANNEL BASI 3,394 12,281 -72.4% 1,980 71.4% 14,517 79,921 -8
NORTHWEST ROCKIES BASIS S 915 5,949 -84.6% 2,074 -55.9% 7,006 34,489 -7
REBCO CRUDE OIL FINANCIAL 0 0 0.0% 0 - 0 0
HEATING OIL VS ICE GASOIL 1,175 2,790 -57.9% 2,180 -46.1% 7,030 18,869 -6
FUEL OIL CRACK VS ICE 5,288 7,565 -30.1% 9,861 -46.4% 30,195 37,513 -1
FUEL OIL NWE CRACK VS ICE 1,722 120 1,335.0% 2,842 -39.4% 5,749 1,044 45
ANR OKLA INDEX 0 0 0.0% 0 - 0 0
NGPL MIDCONTINENT INDEX 248 0 0.0% 120 106.7% 480 572 -1
NGPL TEXOK INDEX 0 62 -100.0% 246 -100.0% 1,350 182 64
VENTURA INDEX FUTURE 1,364 744 83.3% 780 74.9% 4,570 1,588 18
CENTERPOINT BASIS SWAP 136 5,464 -97.5% 4,947 -97.3% 9,148 38,553 -7DAWN BASIS SWAP FUTURE 0 0 0.0% 0 0.0% 0 40 -10
NATURAL GAS 1,048 0 0.0% 0 0.0% 1,073 0
HTG OIL 2,779 10,567 -73.7% 6,051 -54.1% 21,757 31,835 -3
LTD NAT GAS 0 0 0.0% 0 0.0% 2,000 0
ERCOT NORTH PEAK SWAP 0 0 0.0% 0 - 0 0
NYMEX ZINC FUTURES 0 0 0.0% 0 0.0% 0 0
GASOIL MINI CALENDAR SWAP 1,912 2,940 -35.0% 2,067 -7.5% 8,037 2,976 17
GASOIL 0.1 ROTTERDAM BARG 21 655 -96.8% 183 -88.5% 429 715 -4
PGE CITYGATE PIPE SWAP 0 0 0.0% 0 0.0% 0 0
N ROCKIES PIPE SWAP 0 0 0.0% 0 0.0% 0 0
HUSTN SHIP CHNL PIPE SWP 0 0 0.0% 0 0.0% 0 0
SAN JUAN PIPE SWAP 0 0 0.0% 0 0.0% 0 0
SOCAL PIPE SWAP 0 0 0.0% 0 0.0% 0 0
PANHANDLE PIPE SWAP 0 0 0.0% 0 0.0% 0 0
BRENT OIL LAST DAY 53,443 7,002 663.3% 89,738 -40.4% 267,863 11,932 2,14
BRENT CALENDAR SWAP 14,880 14,289 4.1% 21,719 -31.5% 80,745 66,627 2
GASOIL 0.1 CARGOES CIF NE 0 0 0.0% 20 -100.0% 48 68 -2
GASOIL 0.1 RDAM BRGS VS I 190 546 -65.2% 1,706 -88.9% 2,763 1,546 7
GASOIL 0.1 CIF NWE VS ISE 0 0 0.0% 0 0.0% 5 108 -9
EIA ON HIGHWAY DIESEL SWA 0 0 0.0% 0 0.0% 0 0
NY HARBOR 0.3% FUEL OIL S 0 0 0.0% 0 0.0% 0 0
NY H OIL PLATTS VS NYMEX 0 0 0.0% 200 -100.0% 2,000 169 1,08
MARS (ARGUS) VS WTI SWAP 0 0 0.0% 0 0.0% 0 0
MARS (ARGUS) VS WTI TRD M 150 272 -44.9% 339 -55.8% 761 976 -2
TS (ARGUS) VS WTI TRD MT 0 0 0.0% 0 0.0% 1,013 0
SINGAPORE 180CST BALMO 259 334 -22.5% 331 -21.8% 965 1,188 -1
SINGAPORE 380CST BALMO 108 83 30.1% 22 390.9% 208 219 -SINGAPORE JET KERO BALMO 0 150 -100.0% 125 -100.0% 1,068 2,357 -5
SINGAPORE NAPHTHA BALMO 0 0 0.0% 0 0.0% 0 0
DUBAI CRUDE OIL BALMO 400 325 23.1% 100 300.0% 1,175 3,060 -6
EURO 3.5% FUEL OIL RDAM B 81 216 -62.5% 273 -70.3% 646 888 -2
EURO 1% FUEL OIL NEW BALM 36 50 -28.0% 54 -33.3% 98 241 -5
NY HARBOR 1% FUEL OIL BAL 340 25 1,260.0% 436 -22.0% 2,194 2,419 -
GULF COAST 3% FUEL OIL BA 2,137 2,615 -18.3% 2,579 -17.1% 13,127 8,536 5
CRUDE OIL MACI 0 0 0.0% 0 0.0% 0 152 -10
PREMIUM UNLD 10P CIF FOB 0 0 0.0% 0 - 0 0
PREMIUM UNLD 10P FOB MED 187 30 523.3% 267 -30.0% 1,391 472 19
GASOIL 10P CRG CIF NW VS 40 40 0.0% 40 0.0% 238 240 -
GASOIL 0.1 CRG CIF NW VS 0 0 0.0% 0 0.0% 0 55 -10
VOLUME
APR 2011
VOLUME
APR 2010 % CHG
VOLUME
MAR 2011 % CHG
VOLUME
Y.T.D 2011
VOLUME
Y.T.D 2010 % CHG
The information herein is taken form source believed to be reliable. However, it is intended for the purposes of information and education only and is not guaranteed by the CME Group as to accuracy,
completeness, nor trading results and does not constitute advice or continue a solicitation of the purchase or sale of any futures or options. The Rules and Regulations of the CME Group should beconsulted as the authoritative source on all current contract specifications and regulations. The previous year Average Daily Volume (ADV) may slightly differ for CBOT legacy products based on the way
CME Grou defines the number of tradin da s. The o en interest values are based on reliminar o en interest values onl .

8/6/2019 Web Volume Report CMEG
http://slidepdf.com/reader/full/web-volume-report-cmeg 5/20
CMEG Exchange Volume Report - Monthly
Energy Futures
BRENT CFD SWAP 500 440 13.6% 200 150.0% 3,154 14,485 -7
JET FUEL CRG CIF NEW VS I 45 40 12.5% 35 28.6% 176 128 3
3.5% FUEL OIL CID MED SWA 20 0 0.0% 9 122.2% 29 0
ARGUS PROPAN FAR EST INDE 375 679 -44.8% 630 -40.5% 1,748 2,290 -2
ULSD 10PPM CIF VS ICE GAS 40 30 33.3% 10 300.0% 119 98 2
NEW YORK 0.3% FUEL OIL HI 0 0 0.0% 0 0.0% 1,175 520 12
GASOIL 0.1 CIF VS ICE GAS 10 20 -50.0% 5 100.0% 32 63 -4
JET FUEL BRG FOB RDM VS I 0 0 0.0% 0 0.0% 2 0
PJM NILL DA OFF-PEAK 27,319 83,773 -67.4% 87,216 -68.7% 264,174 215,019 2
PJM AECO DA OFF-PEAK 0 7,760 -100.0% 0 0.0% 0 7,760 -10
PJM DAYTON DA PEAK 1,910 0 0.0% 1,000 91.0% 5,863 1,880 21
PJM BGE DA PEAK 3,835 0 0.0% 2,921 31.3% 6,756 650 93
PJM BGE DA OFF-PEAK 46,880 3,680 1,173.9% 121,888 -61.5% 168,768 5,555 2,93PJM DPL DA PEAK 0 0 0.0% 42 -100.0% 272 2,828 -9
PJM DPL DA OFF-PEAK 0 0 0.0% 768 -100.0% 768 60,784 -9
PJM EASTERNH DA PEAK 1,380 2,570 -46.3% 965 43.0% 2,690 7,599 -6
PJM EASTERNH DA OFF-PEAK 0 54,960 -100.0% 0 0.0% 0 105,680 -10
PJM JCPL DA PEAK 466 2,570 -81.9% 0 0.0% 6,405 18,985 -6
PJM JCPL DA OFF-PEAK 4,688 48,080 -90.2% 0 0.0% 86,678 325,176 -7
PJM PEPCO DA PEAK 2,560 1,285 99.2% 2,060 24.3% 5,240 10,089 -4
PJM PEPCO DA OFF-PEAK 46,880 0 0.0% 102,280 -54.2% 164,840 194,349 -1
PJM PPL DA PEAK 3,337 2,665 25.2% 0 0.0% 3,337 22,152 -8
PJM PPL DA OFF-PEAK 59,956 47,130 27.2% 3,840 1,461.4% 65,204 366,720 -8
PJM PSEG DA PEAK 5,602 4,367 28.3% 3,012 86.0% 36,673 43,614 -1
PJM PSEG DA OFF-PEAK 93,760 51,128 83.4% 46,800 100.3% 562,280 665,315 -1
PJM WESTHDA PEAK 13,655 13,676 -0.2% 9,314 46.6% 64,737 98,863 -3
PJM WESTH DA OFF-PEAK 183,884 200,346 -8.2% 136,968 34.3% 936,924 1,502,451 -3
PJM WESTH RT PEAK 105 1,450 -92.8% 3,270 -96.8% 12,238 19,305 -3
PJM WESTH RT OFF-PEAK 209,221 151,238 38.3% 104,885 99.5% 575,285 460,660 2
ALGONQUIN CITYGATES BASIS 0 0 0.0% 272 -100.0% 6,279 604 93
TCO NG INDEX SWAP 0 0 0.0% 0 0.0% 0 5,436 -10
TETCO STX NG INDEX SWAP 310 736 -57.9% 548 -43.4% 1,570 1,980 -2
TENNESSEE ZONE 0 NG INDE 4,460 1,712 160.5% 240 1,758.3% 4,700 8,920 -4
TRANSCO ZONE 3 NG INDEX S 0 248 -100.0% 0 0.0% 560 3,612 -8
TENNESSEE 500 LEG NG INDE 7,320 6,008 21.8% 0 0.0% 7,320 6,428 1
MICHCON NG INDEX SWAP 124 0 0.0% 300 -58.7% 1,342 124 98
CIG ROCKIES NG INDEX SWA 0 186 -100.0% 0 0.0% 877 1,592 -4
TCO NG SWING 0 0 0.0% 0 0.0% 81 0
TETCO NG STX SWING 0 0 0.0% 0 - 0 0
TENNESSEE ZONE 0 NG SWIN 0 0 0.0% 0 0.0% 0 0MALIN NG SWING 0 0 0.0% 0 - 0 0
TENNESSEE 500 LEG NG SWIN 0 0 0.0% 0 - 0 0
MICHCON NG SWING 0 0 0.0% 120 -100.0% 120 0
CIG ROCKIES NG SWING 0 0 0.0% 0 0.0% 448 56 70
1.5% FUEL OIL ROTTERDAM B 0 0 0.0% 0 - 0 0
GASOIL 0.1 CIF MED SWAP 33 7 371.4% 0 0.0% 58 101 -4
GASOIL 0.1CIF MED VS ICE 42 125 -66.4% 67 -37.3% 462 583 -2
ULSD 10PPM CIF MED SWAP 34 57 -40.4% 125 -72.8% 179 194 -
ULSD 10PPM CIF MED VS ICE 536 208 157.7% 521 2.9% 1,849 2,439 -2
BRENT BALMO SWAP 50 1,280 -96.1% 0 0.0% 349 2,523 -8
ICE GASOIL BALMO SWAP 0 8 -100.0% 0 0.0% 54 41 3
JET FUEL CARGOES CIF NEW 0 0 0.0% 0 0.0% 0 2 -10
VOLUME
APR 2011
VOLUME
APR 2010 % CHG
VOLUME
MAR 2011 % CHG
VOLUME
Y.T.D 2011
VOLUME
Y.T.D 2010 % CHG
The information herein is taken form source believed to be reliable. However, it is intended for the purposes of information and education only and is not guaranteed by the CME Group as to accuracy,
completeness, nor trading results and does not constitute advice or continue a solicitation of the purchase or sale of any futures or options. The Rules and Regulations of the CME Group should beconsulted as the authoritative source on all current contract specifications and regulations. The previous year Average Daily Volume (ADV) may slightly differ for CBOT legacy products based on the way
CME Grou defines the number of tradin da s. The o en interest values are based on reliminar o en interest values onl .
8/6/2019 Web Volume Report CMEG
http://slidepdf.com/reader/full/web-volume-report-cmeg 6/20

8/6/2019 Web Volume Report CMEG
http://slidepdf.com/reader/full/web-volume-report-cmeg 7/20
CMEG Exchange Volume Report - Monthly
Energy Futures
NGPL STX BASIS 0 3,462 -100.0% 304 -100.0% 912 17,012 -9
EIA FLAT TAX ONHWAY DIESE 20 287 -93.0% 73 -72.6% 726 1,978 -6
ARGUS LLS VS. WTI (ARG) T 1,693 514 229.4% 1,773 -4.5% 8,568 1,358 53
JAPAN NAPHTHA BALMO SWAP 27 15 80.0% 19 42.1% 116 76 5
NY 3.0% FUEL OIL (PLATTS 475 0 0.0% 255 86.3% 1,376 160 76
MT. BELVIEU ETHANE (OPIS) 0 0 0.0% 0 0.0% 0 0
MT. BELVIEU NAT GAS (OPIS 0 0 0.0% 0 - 0 0
MT. BELVIEU PROPANE (OPIS 0 0 0.0% 0 - 0 0
NY 2.2% FUEL OIL (PLATTS 144 0 0.0% 160 -10.0% 784 10 7,74
NY 0.7% FUEL OIL (PLATTS 0 125 -100.0% 0 0.0% 100 125 -2
MT. BELVIEU NRM BTN (OPIS 0 0 0.0% 0 - 0 0
CAISO SP15 EZGNHUB5 MW P 0 0 0.0% 0 - 0 0
ARGUS BIODIESEL RME FOB R 433 1,360 -68.2% 535 -19.1% 3,058 5,955 -4BRENT CFD(PLATTS) VS FRNT 0 220 -100.0% 250 -100.0% 730 2,740 -7
RBOB GASOLINE BALMO CLNDR 780 616 26.6% 369 111.4% 1,696 1,715 -
GASOLINE UP-DOWN BALMO S 350 0 0.0% 10 3,400.0% 1,586 675 13
TRANSCO ZONE 4 NAT GAS IN 2,940 1,108 165.3% 1,712 71.7% 5,000 8,002 -3
TEXAS EAST WLA NAT GAS IN 18,360 372 4,835.5% 856 2,044.9% 39,886 2,084 1,81
ONEOK OKLAHOMA NAT GAS IN 0 0 0.0% 0 0.0% 372 112 23
TEXAS GAS ZONE SL NAT GAS 0 0 0.0% 0 0.0% 0 0
TEXAS EASTERN ELA NAT GAS 0 0 0.0% 0 0.0% 0 0
COLUMBIA GULF MAIN NAT G 372 0 0.0% 240 55.0% 1,332 10,272 -8
TRANSCO ZONE 2 NAT GAS IN 0 62 -100.0% 0 0.0% 0 1,774 -10
SOUTHERN NAT LA NAT GAS 124 2,208 -94.4% 3,424 -96.4% 3,548 3,312
TEXAS GAS ZONE 1 NAT GAS 0 0 0.0% 0 0.0% 0 112 -10
NGPL STX NAT GAS INDEX SW 434 240 80.8% 420 3.3% 2,301 976 13
NGPL STX NAT GAS SWING SW 0 0 0.0% 0 - 0 0
FL GAS ZONE 3 NAT GAS IND 1,290 0 0.0% 4,160 -69.0% 9,804 180 5,34
TX GAS ZONE SL NAT GAS 0 1,104 -100.0% 0 0.0% 0 1,104 -10
COLUMB GULF MAINLINE NG B 459 6,334 -92.8% 484 -5.2% 2,454 33,828 -9
TENNESSEE 800 LEG NG BASI 10,725 124 8,549.2% 12,286 -12.7% 23,011 1,644 1,29
TEXAS EAST W LOUISANA NG 18,728 2,580 625.9% 3,732 401.8% 45,270 8,612 42
TRANSCO ZONE 1 NG BASIS 0 0 0.0% 0 0.0% 0 856 -10
TRANSCO ZONE 2 NG BASIS 0 62 -100.0% 0 0.0% 0 1,774 -10
ONEOK OKLAHOMA NG BASIS 361 1,338 -73.0% 452 -20.1% 3,900 1,888 10
SOUTH STAR TEX OKLHM KNS 3,590 458 683.8% 1,776 102.1% 5,989 2,728 11
TEXAS GAS ZONE1 NG BASIS 0 0 0.0% 0 0.0% 0 1,183 -10
NYISO ZONE C 5MW D AH O P 23,520 0 0.0% 47,040 -50.0% 79,360 4,680 1,59
PJM NI HUB 5MW REAL TIME 12,520 54,285 -76.9% 503,750 -97.5% 800,229 105,655 65
NYISO ZONE G 5MW D AH O P 36,044 0 0.0% 736 4,797.3% 41,959 4,311 87NYISO ZONE J 5MW D AH PK 636 812 -21.7% 1,591 -60.0% 3,210 1,473 11
NYISO ZONE J 5MW D AH O P 2,402 10,122 -76.3% 8,150 -70.5% 14,910 10,122 4
PJM COMED 5MW D AH PK 0 257 -100.0% 0 0.0% 0 515 -10
PJM COMED 5MW D AH O PK 0 4,648 -100.0% 0 0.0% 0 4,648 -10
NEPOOL INTR HUB 5MW D AH 147,240 48,655 202.6% 47,844 207.8% 291,809 264,203 1
CIN HUB 5MW REAL TIME PK 0 60 -100.0% 3,823 -100.0% 6,649 10,924 -3
CIN HUB 5MW D AH PK 21 0 0.0% 5,351 -99.6% 11,682 34,252 -6
NYISO ZONE A 5MW D AH PK 1,275 1,020 25.0% 2,571 -50.4% 5,790 1,966 19
NYISO ZONE A 5MW D AH O P 25,445 14,040 81.2% 49,080 -48.2% 114,421 24,642 36
NEPOOL W CNT MASS 5MW D A 0 15,725 -100.0% 50,653 -100.0% 50,653 63,685 -2
NEPOOL CONECTIC 5MW D AH 4,352 172 2,430.2% 0 0.0% 5,010 8,362 -4
NEPOOL CNCTCT 5MW D AH O 74,232 0 0.0% 0 0.0% 74,232 148,608 -5
VOLUME
APR 2011
VOLUME
APR 2010 % CHG
VOLUME
MAR 2011 % CHG
VOLUME
Y.T.D 2011
VOLUME
Y.T.D 2010 % CHG
The information herein is taken form source believed to be reliable. However, it is intended for the purposes of information and education only and is not guaranteed by the CME Group as to accuracy,
completeness, nor trading results and does not constitute advice or continue a solicitation of the purchase or sale of any futures or options. The Rules and Regulations of the CME Group should beconsulted as the authoritative source on all current contract specifications and regulations. The previous year Average Daily Volume (ADV) may slightly differ for CBOT legacy products based on the way
CME Grou defines the number of tradin da s. The o en interest values are based on reliminar o en interest values onl .
8/6/2019 Web Volume Report CMEG
http://slidepdf.com/reader/full/web-volume-report-cmeg 8/20
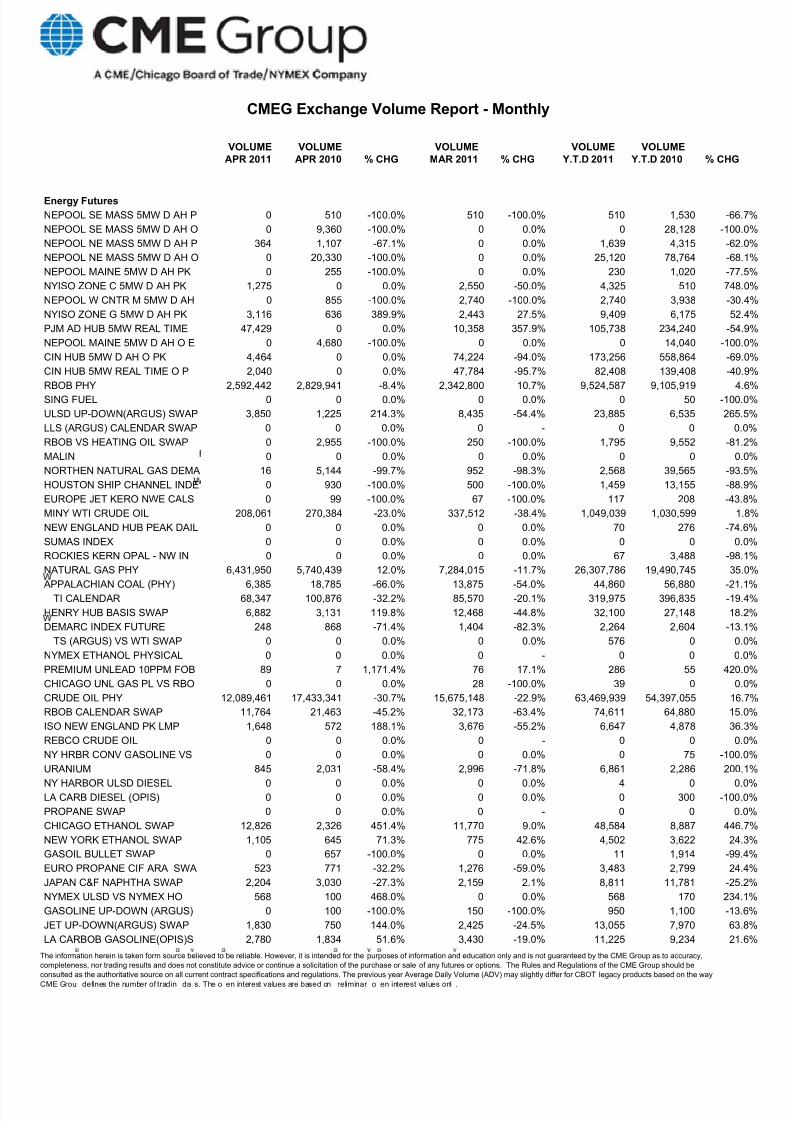
CMEG Exchange Volume Report - Monthly
Energy Futures
NEPOOL SE MASS 5MW D AH P 0 510 -100.0% 510 -100.0% 510 1,530 -6
NEPOOL SE MASS 5MW D AH O 0 9,360 -100.0% 0 0.0% 0 28,128 -10
NEPOOL NE MASS 5MW D AH P 364 1,107 -67.1% 0 0.0% 1,639 4,315 -6
NEPOOL NE MASS 5MW D AH O 0 20,330 -100.0% 0 0.0% 25,120 78,764 -6
NEPOOL MAINE 5MW D AH PK 0 255 -100.0% 0 0.0% 230 1,020 -7
NYISO ZONE C 5MW D AH PK 1,275 0 0.0% 2,550 -50.0% 4,325 510 74
NEPOOL W CNTR M 5MW D AH 0 855 -100.0% 2,740 -100.0% 2,740 3,938 -3
NYISO ZONE G 5MW D AH PK 3,116 636 389.9% 2,443 27.5% 9,409 6,175 5
PJM AD HUB 5MW REAL TIME 47,429 0 0.0% 10,358 357.9% 105,738 234,240 -5
NEPOOL MAINE 5MW D AH O E 0 4,680 -100.0% 0 0.0% 0 14,040 -10
CIN HUB 5MW D AH O PK 4,464 0 0.0% 74,224 -94.0% 173,256 558,864 -6
CIN HUB 5MW REAL TIME O P 2,040 0 0.0% 47,784 -95.7% 82,408 139,408 -4
RBOB PHY 2,592,442 2,829,941 -8.4% 2,342,800 10.7% 9,524,587 9,105,919SING FUEL 0 0 0.0% 0 0.0% 0 50 -10
ULSD UP-DOWN(ARGUS) SWAP 3,850 1,225 214.3% 8,435 -54.4% 23,885 6,535 26
LLS (ARGUS) CALENDAR SWAP 0 0 0.0% 0 - 0 0
RBOB VS HEATING OIL SWAP 0 2,955 -100.0% 250 -100.0% 1,795 9,552 -8
MALIN 0 0 0.0% 0 0.0% 0 0
NORTHEN NATURAL GAS DEMA 16 5,144 -99.7% 952 -98.3% 2,568 39,565 -9
HOUSTON SHIP CHANNEL INDE 0 930 -100.0% 500 -100.0% 1,459 13,155 -8
EUROPE JET KERO NWE CALS 0 99 -100.0% 67 -100.0% 117 208 -4
MINY WTI CRUDE OIL 208,061 270,384 -23.0% 337,512 -38.4% 1,049,039 1,030,599
NEW ENGLAND HUB PEAK DAIL 0 0 0.0% 0 0.0% 70 276 -7
SUMAS INDEX 0 0 0.0% 0 0.0% 0 0
ROCKIES KERN OPAL - NW IN 0 0 0.0% 0 0.0% 67 3,488 -9
NATURAL GAS PHY 6,431,950 5,740,439 12.0% 7,284,015 -11.7% 26,307,786 19,490,745 3
APPALACHIAN COAL (PHY) 6,385 18,785 -66.0% 13,875 -54.0% 44,860 56,880 -2
TI CALENDAR 68,347 100,876 -32.2% 85,570 -20.1% 319,975 396,835 -1
HENRY HUB BASIS SWAP 6,882 3,131 119.8% 12,468 -44.8% 32,100 27,148 1
DEMARC INDEX FUTURE 248 868 -71.4% 1,404 -82.3% 2,264 2,604 -1
TS (ARGUS) VS WTI SWAP 0 0 0.0% 0 0.0% 576 0
NYMEX ETHANOL PHYSICAL 0 0 0.0% 0 - 0 0
PREMIUM UNLEAD 10PPM FOB 89 7 1,171.4% 76 17.1% 286 55 42
CHICAGO UNL GAS PL VS RBO 0 0 0.0% 28 -100.0% 39 0
CRUDE OIL PHY 12,089,461 17,433,341 -30.7% 15,675,148 -22.9% 63,469,939 54,397,055 1
RBOB CALENDAR SWAP 11,764 21,463 -45.2% 32,173 -63.4% 74,611 64,880 1
ISO NEW ENGLAND PK LMP 1,648 572 188.1% 3,676 -55.2% 6,647 4,878 3
REBCO CRUDE OIL 0 0 0.0% 0 - 0 0
NY HRBR CONV GASOLINE VS 0 0 0.0% 0 0.0% 0 75 -10
URANIUM 845 2,031 -58.4% 2,996 -71.8% 6,861 2,286 20NY HARBOR ULSD DIESEL 0 0 0.0% 0 0.0% 4 0
LA CARB DIESEL (OPIS) 0 0 0.0% 0 0.0% 0 300 -10
PROPANE SWAP 0 0 0.0% 0 - 0 0
CHICAGO ETHANOL SWAP 12,826 2,326 451.4% 11,770 9.0% 48,584 8,887 44
NEW YORK ETHANOL SWAP 1,105 645 71.3% 775 42.6% 4,502 3,622 2
GASOIL BULLET SWAP 0 657 -100.0% 0 0.0% 11 1,914 -9
EURO PROPANE CIF ARA SWA 523 771 -32.2% 1,276 -59.0% 3,483 2,799 2
JAPAN C&F NAPHTHA SWAP 2,204 3,030 -27.3% 2,159 2.1% 8,811 11,781 -2
NYMEX ULSD VS NYMEX HO 568 100 468.0% 0 0.0% 568 170 23
GASOLINE UP-DOWN (ARGUS) 0 100 -100.0% 150 -100.0% 950 1,100 -1
JET UP-DOWN(ARGUS) SWAP 1,830 750 144.0% 2,425 -24.5% 13,055 7,970 6
LA CARBOB GASOLINE(OPIS)S 2,780 1,834 51.6% 3,430 -19.0% 11,225 9,234 2
VOLUME
APR 2011
VOLUME
APR 2010 % CHG
VOLUME
MAR 2011 % CHG
VOLUME
Y.T.D 2011
VOLUME
Y.T.D 2010 % CHG
The information herein is taken form source believed to be reliable. However, it is intended for the purposes of information and education only and is not guaranteed by the CME Group as to accuracy,
completeness, nor trading results and does not constitute advice or continue a solicitation of the purchase or sale of any futures or options. The Rules and Regulations of the CME Group should beconsulted as the authoritative source on all current contract specifications and regulations. The previous year Average Daily Volume (ADV) may slightly differ for CBOT legacy products based on the way
CME Grou defines the number of tradin da s. The o en interest values are based on reliminar o en interest values onl .

8/6/2019 Web Volume Report CMEG
http://slidepdf.com/reader/full/web-volume-report-cmeg 9/20
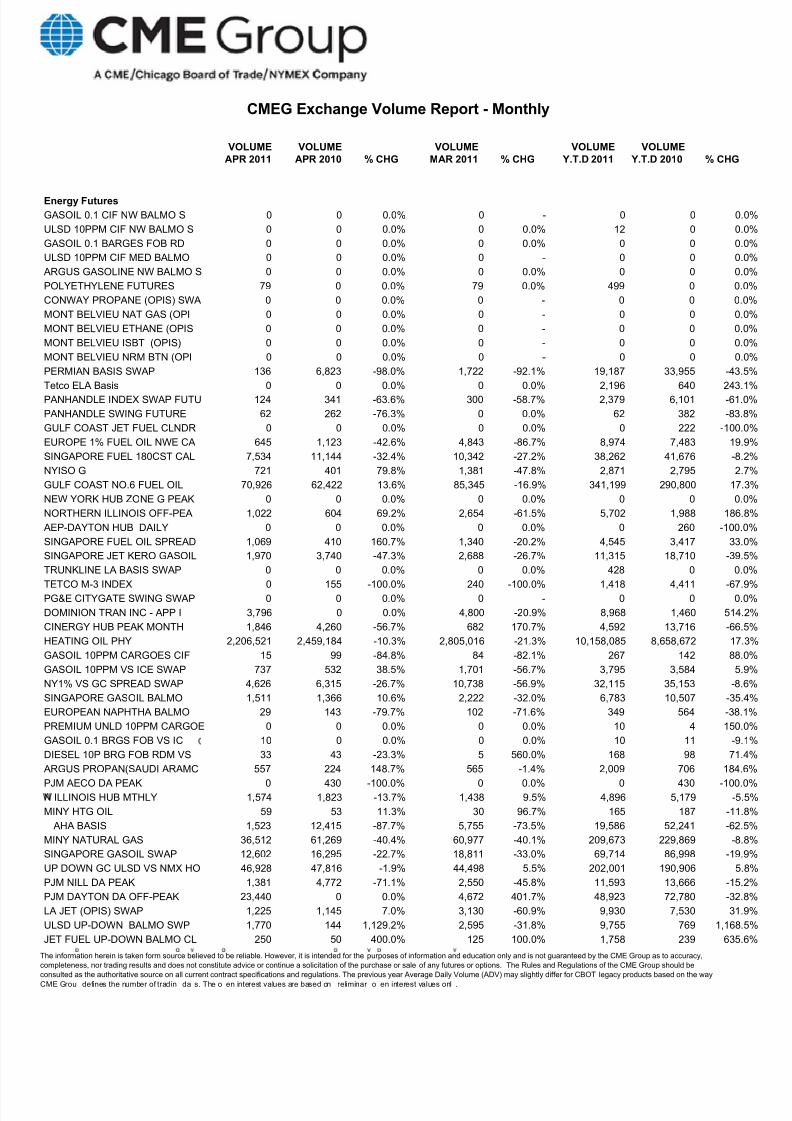
CMEG Exchange Volume Report - Monthly
Energy Futures
LA CARB DIESEL (OPIS) SWA 2,025 650 211.5% 3,275 -38.2% 9,455 6,336 4
GC GASOLINE CRK SPR (ARGU 0 0 0.0% 0 0.0% 0 0
JAPAN C&F NAPHTHA CRACK S 0 0 0.0% 0 0.0% 0 0
LLS (ARGUS) TRADE MONTH S 0 0 0.0% 0 - 0 0
LLS (ARGUS) VS WTI SWAP 600 0 0.0% 1,146 -47.6% 2,196 0
LLS (ARGUS) VS WTI TRD MT 0 0 0.0% 0 0.0% 0 0
MINY RBOB GAS 2 40 -95.0% 6 -66.7% 20 135 -8
RBOB GAS 6,617 8,486 -22.0% 5,950 11.2% 21,745 29,774 -2
RBOB CRACK SPREAD 1,975 13,031 -84.8% 1,424 38.7% 18,472 39,320 -5
RBOB UP-DOWN CALENDAR SW 11,352 11,489 -1.2% 8,433 34.6% 34,550 32,289
NY HARBOR RESIDUAL FUEL 1 9,248 10,087 -8.3% 10,829 -14.6% 46,853 61,921 -2
NY HARBOR HEAT OIL SWP 5,468 10,165 -46.2% 14,285 -61.7% 30,410 51,418 -4
LA JET FUEL VS NYM NO 2 H 0 75 -100.0% 200 -100.0% 425 375 1ANR OKLAHOMA 0 670 -100.0% 548 -100.0% 10,615 12,837 -1
MICHIGAN BASIS 738 4,644 -84.1% 1,742 -57.6% 4,916 44,461 -8
Sumas Basis Swap 92 549 -83.2% 1,227 -92.5% 3,787 1,801 11
NGPL MID-CONTINENT 848 15,230 -94.4% 4,558 -81.4% 7,966 59,716 -8
TEXAS EASTERN ZONE M-3 BA 2,104 2,592 -18.8% 2,680 -21.5% 14,400 29,859 -5
NGPL LA 0 0 0.0% 0 - 0 0
PGE&E CITYGATE 0 0 0.0% 0 0.0% 1,488 48 3,00
PJM MONTHLY 12,150 9,473 28.3% 17,439 -30.3% 56,590 43,205 3
NORTHEN NATURAL GAS VENT 4,948 5,040 -1.8% 5,644 -12.3% 21,447 34,555 -3
DOMINION TRANSMISSION INC 2,341 2,359 -0.8% 7,624 -69.3% 13,302 14,399 -
TCO BASIS SWAP 2,688 338 695.3% 1,736 54.8% 9,659 16,328 -4
CIG BASIS 644 3,828 -83.2% 3,126 -79.4% 8,952 9,805 -
PJM DAILY 0 0 0.0% 0 0.0% 120 700 -8
COLUMBIA GULF ONSHORE 744 3,183 -76.6% 180 313.3% 1,048 11,207 -9
Tetco STX Basis 164 0 0.0% 216 -24.1% 1,184 772 5
Transco Zone 3 Basis 0 1,900 -100.0% 642 -100.0% 1,190 18,612 -9
HENRY HUB SWING FUTURE 62 0 0.0% 2,010 -96.9% 3,882 1,727 12
DOW JONES MID-COLUMBIA FU 0 0 0.0% 0 0.0% 0 0
EL PASO PERMIAN INDEX SWA 0 248 -100.0% 1,284 -100.0% 1,284 6,099 -7
HENRY HUB INDEX SWAP FUTU 6,572 2,666 146.5% 5,148 27.7% 22,544 13,280 6
CHICAGO INDEX SWAP 0 0 0.0% 0 0.0% 0 0
AHA INDEX SWAP FUTURE 124 744 -83.3% 1,108 -88.8% 1,232 8,985 -8
EL PASO PERMIAN SWING FUT 0 0 0.0% 0 0.0% 0 0
HOUSTON SHIP CHANNEL SWIN 0 0 0.0% 0 0.0% 0 25 -10
CHICAGO SWING FUTURE 0 0 0.0% 0 - 0 0
AHA SWING FUTURE 0 0 0.0% 0 0.0% 0 0
GULF COAST GASOLINE CLNDR 0 1,173 -100.0% 75 -100.0% 165 3,991 -9GULF COAST HEATING OIL CL 0 0 0.0% 0 0.0% 0 0
EUROPE NAPHTHA CALSWAP 1,773 2,771 -36.0% 2,720 -34.8% 9,028 11,237 -1
EUROPE JET KERO RDAM CALS 0 0 0.0% 0 0.0% 5 0
EUROPE 1% FUEL OIL RDAM C 193 303 -36.3% 744 -74.1% 1,587 1,887 -1
EUROPE 3.5% FUEL OIL RDAM 4,959 5,677 -12.6% 11,038 -55.1% 34,703 31,830
EUROPE 3.5% FUEL OIL MED 20 10 100.0% 19 5.3% 84 271 -6
PANHANDLE BASIS SWAP FUTU 14,652 35,521 -58.8% 12,933 13.3% 68,673 188,706 -6
SAN JUAN BASIS SWAP 1,915 4,041 -52.6% 220 770.5% 5,517 12,056 -5
SOCAL BASIS SWAP 0 3,099 -100.0% 0 0.0% 374 10,160 -9
TRANSCO ZONE 6 BASIS SWAP 1,044 2,835 -63.2% 1,077 -3.1% 3,825 8,095 -5
NYISO A 403 248 62.5% 872 -53.8% 2,596 1,599 6
NYISO J 233 378 -38.4% 636 -63.4% 1,673 1,795 -
VOLUME
APR 2011
VOLUME
APR 2010 % CHG
VOLUME
MAR 2011 % CHG
VOLUME
Y.T.D 2011
VOLUME
Y.T.D 2010 % CHG
The information herein is taken form source believed to be reliable. However, it is intended for the purposes of information and education only and is not guaranteed by the CME Group as to accuracy,
completeness, nor trading results and does not constitute advice or continue a solicitation of the purchase or sale of any futures or options. The Rules and Regulations of the CME Group should beconsulted as the authoritative source on all current contract specifications and regulations. The previous year Average Daily Volume (ADV) may slightly differ for CBOT legacy products based on the way
CME Grou defines the number of tradin da s. The o en interest values are based on reliminar o en interest values onl .

8/6/2019 Web Volume Report CMEG
http://slidepdf.com/reader/full/web-volume-report-cmeg 10/20
CMEG Exchange Volume Report - Monthly
Energy Futures
GULF COAST JET VS NYM 2 H 6,545 9,441 -30.7% 8,724 -25.0% 36,880 33,999
LOS ANGELES CARB GASOLINE 0 0 0.0% 0 0.0% 0 0
NY HARBOR RESIDUAL FUEL C 135 305 -55.7% 0 0.0% 285 1,694 -8
MICHIGAN HUB PEAK MONTH S 0 0 0.0% 0 0.0% 48 20 14
MICHIGAN HUB OFF-PEAK MON 0 0 0.0% 0 0.0% 48 0
ILLINOIS HUB PEAK MONTH S 0 0 0.0% 0 0.0% 0 0
ILLINOIS OFF-PEAK MONTH S 0 0 0.0% 0 - 0 0
EURO 3.5% FUEL OIL SPREAD 54 102 -47.1% 265 -79.6% 676 623
GASOIL CALENDAR SWAP 992 1,493 -33.6% 1,301 -23.8% 3,767 5,982 -3
EURO GASOIL 10 CAL SWAP 0 0 0.0% 76 -100.0% 103 0
NGPL MIDCONTINENT SWING S 0 124 -100.0% 0 0.0% 0 248 -10
NGPL TEXOK SWING SWAP 0 0 0.0% 0 - 0 0
DEMARC SWING SWAP 62 0 0.0% 0 0.0% 286 168 7VENTURA SWING SWAP 0 0 0.0% 0 0.0% 0 0
CENTERPOINT EAST INDEX 0 372 -100.0% 240 -100.0% 1,220 6,772 -8
CRUDE OIL 27,210 41,385 -34.3% 27,006 0.8% 121,754 155,597 -2
BRENT FINANCIAL FUTURES 13,814 15,735 -12.2% 28,937 -52.3% 97,175 70,695 3
TI-BRENT BULLET SWAP 0 0 0.0% 500 -100.0% 800 0
TI-BRENT CALENDAR SWAP 4,268 5,256 -18.8% 4,516 -5.5% 15,648 15,361
DATED TO FRONTLINE BRENT 1,245 1,400 -11.1% 3,706 -66.4% 16,138 12,980 2
ICE BRENT DUBAI SWAP 3,750 4,300 -12.8% 3,700 1.4% 23,590 30,920 -2
GASOIL CRACK SPREAD CALEN 3,866 4,657 -17.0% 6,815 -43.3% 21,375 36,676 -4
ARGUS CASOLINE CRACK SPRE 0 0 0.0% 0 0.0% 0 332 -10
EUROPEAN NAPTHA CRACK SP 4,178 9,359 -55.4% 9,223 -54.7% 30,247 45,910 -3
EURO GASOIL 10PPM VS ICE 220 638 -65.5% 319 -31.0% 1,209 2,780 -5
JET CIF NWE VS ICE 204 941 -78.3% 628 -67.5% 1,443 3,585 -5
JET BARGES VS ICE GASOIL 0 40 -100.0% 0 0.0% 30 212 -8
SINGAPORE GASOIL VS ICE 435 6,983 -93.8% 3,105 -86.0% 10,960 20,930 -4
NATURAL GAS PEN SWP 538,544 652,973 -17.5% 743,334 -27.6% 2,556,755 3,026,169 -1
ESTERN RAIL DELIVERY PRB 1,095 840 30.4% 4,605 -76.2% 9,930 9,105
EASTERN RAIL DELIVERY CSX 6,180 3,700 67.0% 3,251 90.1% 17,343 9,850 7
EUROPE DATED BRENT SWAP 1,734 5,516 -68.6% 3,774 -54.1% 19,466 50,682 -6
TC5 RAS TANURA TO YOKOHAM 320 295 8.5% 145 120.7% 1,080 1,290 -1
TC4 SINGAPORE TO JAPAN 30 0 40 -100.0% 10 -100.0% 55 409 -8
TD5 WEST AFRICA TO USAC 1 15 0 0.0% 0 0.0% 125 0
TD7 NORTH SEA TO CONTINEN 0 0 0.0% 0 0.0% 0 0
TD3 MEG TO JAPAN 250K MT 85 10 750.0% 20 325.0% 470 50 84
TC2 ROTTERDAM TO USAC 37K 20 0 0.0% 30 -33.3% 140 50 18
PJM OFF-PEAK LMP SWAP FUT 2,050 2,394 -14.4% 2,631 -22.1% 10,898 10,824
NYISO A OFF-PEAK 182 152 19.7% 232 -21.6% 754 832 -NYISO G OFF-PEAK 364 140 160.0% 124 193.5% 766 1,364 -4
NYISO J OFF-PEAK 240 230 4.3% 244 -1.6% 716 708
ISO NEW ENGLAND OFF-PEAK 1,730 470 268.1% 778 122.4% 3,153 5,834 -4
AEP-DAYTON HUB OFF-PEAK M 1,706 538 217.1% 1,874 -9.0% 6,190 1,418 33
N ILLINOIS HUB DAILY 0 0 0.0% 0 0.0% 0 260 -10
AEP-DAYTON HUB MTHLY 1,228 230 433.9% 3,514 -65.1% 7,083 766 82
NWE GASOLINE SWAP-ARGUS P 0 0 0.0% 0 0.0% 0 6 -10
FUELOIL SWAP:CARGOES VS.B 1,100 278 295.7% 3,527 -68.8% 7,589 2,677 18
EAST/WEST FUEL OIL SPREAD 955 1,037 -7.9% 1,841 -48.1% 6,987 7,368 -
SINGAPORE 380CST FUEL OIL 1,340 1,074 24.8% 1,074 24.8% 6,440 4,645 3
SINGAPORE JET KEROSENE SW 1,313 7,968 -83.5% 2,669 -50.8% 13,424 25,888 -4
SINGAPORE NAPHTHA SWAP 200 1,155 -82.7% 350 -42.9% 1,222 4,390 -7
VOLUME
APR 2011
VOLUME
APR 2010 % CHG
VOLUME
MAR 2011 % CHG
VOLUME
Y.T.D 2011
VOLUME
Y.T.D 2010 % CHG
The information herein is taken form source believed to be reliable. However, it is intended for the purposes of information and education only and is not guaranteed by the CME Group as to accuracy,
completeness, nor trading results and does not constitute advice or continue a solicitation of the purchase or sale of any futures or options. The Rules and Regulations of the CME Group should beconsulted as the authoritative source on all current contract specifications and regulations. The previous year Average Daily Volume (ADV) may slightly differ for CBOT legacy products based on the way
CME Grou defines the number of tradin da s. The o en interest values are based on reliminar o en interest values onl .

8/6/2019 Web Volume Report CMEG
http://slidepdf.com/reader/full/web-volume-report-cmeg 11/20
CMEG Exchange Volume Report - Monthly
Energy Futures
SONAT BASIS SWAP FUTURE 1,264 822 53.8% 934 35.3% 2,372 6,011 -6
FLORIDA GAS ZONE3 BASIS S 888 1,377 -35.5% 540 64.4% 1,428 6,009 -7
TRANSCO ZONE4 BASIS SWAP 36 3,010 -98.8% 892 -96.0% 3,696 20,040 -8
ANR LOUISIANA BASIS SWAP 856 279 206.8% 976 -12.3% 2,248 1,917 1
TENNESSEE 500 LEG BASIS S 1,856 3,503 -47.0% 2,279 -18.6% 5,983 18,197 -6
TENNESSEE ZONE 0 BASIS SW 124 72 72.2% 1,120 -88.9% 1,272 8,586 -8
TEXAS GAS ZONE SL BASIS S 372 2,282 -83.7% 908 -59.0% 1,398 7,614 -8
TRANSCO ZONE 6 INDEX 0 0 0.0% 0 0.0% 0 11,676 -10
SOCAL SWING SWAP FUTURE 0 0 0.0% 0 0.0% 0 0
DOMINION-APPALACHIA SWING 0 0 0.0% 0 - 0 0
SAN JUAN SWING SWAP 0 1,432 -100.0% 0 0.0% 0 1,606 -10
KERN RIVER OPAL PLANT SWI 0 0 0.0% 0 - 0 0
TRANSCO ZONE 6 SWING SWAP 0 0 0.0% 0 - 0 0SUMAS SWING SWAP FUTURE 0 0 0.0% 0 0.0% 0 120 -10
TEXAS EASTERN ZONE M-3 SW 0 0 0.0% 0 0.0% 108 0
SOCAL INDEX 0 0 0.0% 0 0.0% 0 0
SAN JUAN INDEX 0 2,914 -100.0% 0 0.0% 62 6,860 -9
PG&E CITYGATE INDEX 0 0 0.0% 0 - 0 0
CINERGY HUB OFF-PEAK MONT 484 1,762 -72.5% 370 30.8% 3,064 5,862 -4
GULF COAST ULSD CALENDAR 23 203 -88.7% 265 -91.3% 1,245 4,017 -6
GULF COAST ULSD CRACK SPR 2,900 200 1,350.0% 0 0.0% 6,075 585 93
UP DOWN GC LSD VS NMX HO 0 0 0.0% 0 0.0% 0 0
HENRY HUB SWAP 1,642,479 1,684,461 -2.5% 2,169,663 -24.3% 7,178,162 7,384,429 -
DUBAI CRUDE OIL CALENDAR 16,882 31,815 -46.9% 42,529 -60.3% 96,072 163,734 -4
USGC UNL 87 CRACK SPREAD 2,030 325 524.6% 750 170.7% 5,205 1,385 27
NYH NO 2 CRACK SPREAD CAL 6,984 10,930 -36.1% 3,375 106.9% 21,432 30,482 -2
NO 2 UP-DOWN SPREAD CALEN 185 2,371 -92.2% 1,260 -85.3% 3,056 11,594 -7
SINGAPORE MOGAS 92 UNLEAD 703 100 603.0% 100 603.0% 1,403 358 29
ETHANOL T1FOB RTDM EX DUT 0 417 -100.0% 30 -100.0% 210 1,828 -8
ETHANOL T2 FOB ROTT INCL DU 220 90 144.4% 380 -42.1% 1,947 170 1,04
SINGAPORE MOGAS 92 UNLEAD 10,379 2,166 379.2% 12,257 -15.3% 37,651 11,095 23
FAME 0 BIODIESEL FOB RTDM S 120 1,440 -91.7% 770 -84.4% 2,195 8,465 -7
PROPANE NON-LDH MT. BEL (O 299 415 -28.0% 177 68.9% 1,026 914 1
PROPANE NON-LDH MB (OPIS) B 10 0 0.0% 35 -71.4% 45 0
NY JET FUEL (PLATTS) HEAT OI 0 0 0.0% 50 -100.0% 50 350 -8
JET AV FUEL (P) CAR FM ICE GA 0 0 0.0% 0 0.0% 0 0
FUEL OIL (PLATS) CAR CM 48 8 500.0% 354 -86.4% 444 18 2,36
FUEL OIL (PLATS) CAR CN 0 18 -100.0% 215 -100.0% 409 230 7
HEATING OIL MONTHLY (LATE P 0 0 0.0% 0 - 0 0
RBOB MONTHLY (LATE PRICED) 0 0 0.0% 0 - 0 0CRUDE OIL MONTHLY 0 0 0.0% 0 - 0 0
NY JET FUEL (ARGUS) VS HEATI 100 0 0.0% 0 0.0% 125 0
NY ULSD (ARGUS) VS HEATING 0 0 0.0% 98 -100.0% 98 986 -9
GULF CO HEAT OIL (ARGUS) VS 0 100 -100.0% 0 0.0% 0 2,495 -10
MISO 5MW PEAK 0 0 0.0% 255 -100.0% 510 20,343 -9
MISO 5MW OFF PEAK 0 0 0.0% 4,704 -100.0% 9,408 367,296 -9
ERCOT WEST MCPE50MW DAIL 0 0 0.0% 0 - 0 0
ERCOT SOUTH MCPE 50MW PE 0 0 0.0% 0 0.0% 0 43 -10
ERCOT NORTH MCPE50MW OFF 0 848 -100.0% 0 0.0% 0 848 -10
ERCOT NORTH MCPE50MW DAI 0 0 0.0% 0 - 0 0
ERCOT HOU MCPE50MW PEAK 0 0 0.0% 0 0.0% 0 0
ERCOT HOU MCPE50MW DAILY 0 0 0.0% 0 - 0 0
VOLUME
APR 2011
VOLUME
APR 2010 % CHG
VOLUME
MAR 2011 % CHG
VOLUME
Y.T.D 2011
VOLUME
Y.T.D 2010 % CHG
The information herein is taken form source believed to be reliable. However, it is intended for the purposes of information and education only and is not guaranteed by the CME Group as to accuracy,
completeness, nor trading results and does not constitute advice or continue a solicitation of the purchase or sale of any futures or options. The Rules and Regulations of the CME Group should beconsulted as the authoritative source on all current contract specifications and regulations. The previous year Average Daily Volume (ADV) may slightly differ for CBOT legacy products based on the way
CME Grou defines the number of tradin da s. The o en interest values are based on reliminar o en interest values onl .

8/6/2019 Web Volume Report CMEG
http://slidepdf.com/reader/full/web-volume-report-cmeg 12/20
CMEG Exchange Volume Report - Monthly
Energy Futures
ERCOT NORTH MCPE50MW PEA 0 65 -100.0% 0 0.0% 0 385 -10
ERCOT HOU MCPE50MW OFF 0 65 -100.0% 0 0.0% 0 85 -10
MONT BELVIEU ETHYLENE 0 80 -100.0% 0 0.0% 0 830 -10
PJM PECO ZONE5MW PEAK CAL 0 200 -100.0% 0 0.0% 2,892 640 35
IN DELIVERY MONTH CER 0 1,235 -100.0% 0 0.0% 852 3,005 -7
OPIS PHYSICAL LDH PROPANE 0 475 -100.0% 0 0.0% 590 2,666 -7
OPIS PHYSICAL NONLDH PROP 0 80 -100.0% 0 0.0% 0 655 -10
OPIS PHYSICAL NORMAL BUTAN 65 999 -93.5% 60 8.3% 520 4,384 -8
OPIS PHYSICAL NATURAL GASO 30 95 -68.4% 55 -45.5% 495 2,195 -7
OPIS PHYSICAL ETHANE 10 100 -90.0% 0 0.0% 10 2,860 -9
DATED BRENT (PLATTS) DAILY 726 600 21.0% 2,000 -63.7% 3,646 10,781 -6
PETRO OUTRIGHT EURO 1,189 604 96.9% 2,307 -48.5% 7,734 2,560 20
GAS EURO-BOB OXY NWE BARG 8,553 4,595 86.1% 11,102 -23.0% 41,282 29,352 4GAS EURO-BOB OXY NWE BARG 5,556 7,708 -27.9% 9,287 -40.2% 30,103 27,066 1
PREM UNL GAS 10PPM RDAM F 1 0 0.0% 0 0.0% 1 16 -9
PREM UNL GAS 10PPM RDAM F 82 0 0.0% 80 2.5% 261 46 46
MONT BELVIEU NORMAL BUTAN 3,613 6,099 -40.8% 6,274 -42.4% 17,159 25,663 -3
MONT BELVIEU ETHANE 5 DECI 6,031 8,720 -30.8% 3,850 56.6% 21,199 44,360 -5
MONT BELVIEU LDH PROPANE 5 8,410 13,638 -38.3% 11,663 -27.9% 44,514 86,317 -4
EUROPEAN GASOIL (ICE) 495 111 345.9% 315 57.1% 1,571 1,030 5
NBP HENRY HUB BASIS SWAP F 0 0 0.0% 0 0.0% 0 0
CARBON RGGI EMISSIONS O 0 0 0.0% 0 0.0% 0 400 -10
ERCOT NORTH ZMCPE 5MW OF 0 0 0.0% 0 - 0 0
ERCOT NORTH ZMCPE 5MW OF 0 0 0.0% 0 0.0% 0 0
ERCOT NORTH ZMCPE 5MW PE 105 0 0.0% 2,520 -95.8% 2,625 430 51
ERCOT HOUSTON Z MCPE 5MW 105 0 0.0% 0 0.0% 105 0
DIESEL 10PPM NWELEHAVRE V 0 0 0.0% 0 0.0% 0 15 -10
DIESEL 10PPM NWE LE HAVRE 0 0 0.0% 0 0.0% 0 15 -10
DIESEL 10PPM NWE LE HAVRE 0 0 0.0% 0 0.0% 32 198 -8
SINGAPORE JET KERO VS. GAS 75 150 -50.0% 100 -25.0% 1,000 600 6
MONT BELVIEU NORMAL BUTAN 389 324 20.1% 114 241.2% 846 1,202 -2
MONT BELVIEU ETHANE OPIS B 255 190 34.2% 35 628.6% 620 1,235 -4
MONT BELVIEU NATURAL GASO 26 65 -60.0% 51 -49.0% 357 215 6
MONT BELVIEU LDH PROPANE 180 725 -75.2% 215 -16.3% 1,522 4,091 -6
CONWAY NORMAL BUTANE (OPI 360 0 0.0% 240 50.0% 866 75 1,05
CONWAY NATURAL GASOLINE ( 342 70 388.6% 369 -7.3% 1,784 287 52
CONWAY PROPANE 5 DECIMAL 1,040 388 168.0% 650 60.0% 3,331 5,143 -3
PETROCHEMICALS 2,344 636 268.6% 3,074 -23.7% 8,187 1,905 32
MONT BELVIEU NATURAL GASO 7,025 6,715 4.6% 6,874 2.2% 27,753 23,109 2
TAS RBOB PHY 0 0 0.0% 0 - 0 0CRUDE OIL LAST DAY 0 0 0.0% 98 -100.0% 333 0
RBOB OIL LAST DAY 0 0 0.0% 0 0.0% 0 0
ELEC NYISO OFF-PEAK 0 0 0.0% 736 -100.0% 4,416 44,222 -9
ELEC MISO PEAK 440 430 2.3% 44 900.0% 918 3,135 -7
MARS BLEND CRUDE OIL 0 90 -100.0% 0 0.0% 0 615 -10
TRANSCO ZONE 3 NG SWING 0 0 0.0% 0 0.0% 0 158 -10
TRANSCO ZONE 4 NAT GAS SW 0 0 0.0% 0 0.0% 0 81 -10
NYMEX ALUMINUM FUTURES 0 0 0.0% 0 0.0% 0 180 -10
JET FUEL BARGES RDAM BALM 0 0 0.0% 0 0.0% 0 2 -10
GASOIL 0.1 CIF MED BALMO 0 0 0.0% 0 0.0% 0 5 -10
RBOB CRACK SPREAD BALMO S 0 0 0.0% 0 0.0% 0 508 -10
ANR OKLA SWING SWAP 0 0 - 0 0.0% 0 0
VOLUME
APR 2011
VOLUME
APR 2010 % CHG
VOLUME
MAR 2011 % CHG
VOLUME
Y.T.D 2011
VOLUME
Y.T.D 2010 % CHG
The information herein is taken form source believed to be reliable. However, it is intended for the purposes of information and education only and is not guaranteed by the CME Group as to accuracy,
completeness, nor trading results and does not constitute advice or continue a solicitation of the purchase or sale of any futures or options. The Rules and Regulations of the CME Group should beconsulted as the authoritative source on all current contract specifications and regulations. The previous year Average Daily Volume (ADV) may slightly differ for CBOT legacy products based on the way
CME Grou defines the number of tradin da s. The o en interest values are based on reliminar o en interest values onl .

8/6/2019 Web Volume Report CMEG
http://slidepdf.com/reader/full/web-volume-report-cmeg 13/20
CMEG Exchange Volume Report - Monthly
Energy Futures
CENTERPOINT EAST SWING SW 0 0 - 0 0.0% 0 0
CINERGY HUB PEAK DAILY FU 100 0 0.0% 130 -23.1% 280 360 -2
DIESEL 10PPM BARGES FOB B 0 0 - 1 -100.0% 1 0
EURO 3.5% FUEL OIL M CRK 0 0 - 0 0.0% 0 0
RBOB (PLATTS) CAL SWAP 400 0 - 250 60.0% 1,575 0
NEW YORK HEATING OIL PLAT 0 0 0.0% 0 0.0% 0 100 -10
PJM DUQUESNE 5MW D AH PK 1,280 0 0.0% 0 0.0% 1,280 1,700 -2
PJM DUQUS 5MW D AH O PK 23,440 0 0.0% 0 0.0% 23,440 30,380 -2
GRP THREE ULSD(PLT)VS HEA 51 60 -15.0% 10 410.0% 99 120 -1
HEATING OIL CRCK SPRD BAL 0 0 0.0% 0 0.0% 0 95 -10
CHICAGO ULSD PL VS HO SPR 0 0 0.0% 91 -100.0% 91 110 -1
CO2 VINTAGE 0 0 0.0% 0 0.0% 0 850 -10
PETRO CRK&SPRD EURO 203 200 1.5% 45 351.1% 1,585 614 15DAWN ONTARIO INDEX 0 0 0.0% 0 0.0% 0 0
GRP THREE UNL GS (PLT) VS 0 24 -100.0% 0 0.0% 5 124 -9
SOUTHERN NAT LA NAT GAS S 0 0 0.0% 0 0.0% 0 320 -10
LL JET (OPIS) SWAP 0 0 0.0% 0 0.0% 0 300 -10
GC JET (ARGUS) CAL SWAP 0 0 0.0% 0 0.0% 0 0
TS (ARGUS) CALENDAR SWA 0 0 0.0% 0 0.0% 0 0
CRUDE OIL OUTRIGHTS 1,474 0 0.0% 2,190 -32.7% 5,241 296 1,67
COLUMBIA GULF NAT GAS IN 0 0 0.0% 0 0.0% 0 4,520 -10
GC ULSD ARGUS CAL SWAP 0 0 0.0% 0 0.0% 0 738 -10
CAR VINTAGE 0 0 0.0% 0 0.0% 0 0
PJM WES HUB PEAK LMP 50 M 0 0 0.0% 0 0.0% 0 82 -10
NEPOOL NEW HAMP 5MW D AH 24,675 9,948 148.0% 24,795 -0.5% 49,470 9,948 39
ELECTRICITY OFF PEAK 23,440 0 - 32,816 -28.6% 109,248 0
HEATING OIL BALMO CLNDR S 0 19 -100.0% 0 0.0% 40 19 11
FREIGHT MARKETS 0 0 - 0 0.0% 60 0
PLASTICS 70 0 - 90 -22.2% 160 0
ALGONQUIN CITY-GATES NAT 0 0 - 0 0.0% 108 0
ELEC FINSETTLED 1,280 0 - 1,792 -28.6% 3,682 0
NEPOOL RHD ISLD 5MW D AH 7,450 0 - 0 0.0% 7,450 0
ANR LA NAT GAS INDEX SWAP 372 0 - 120 210.0% 728 0
TRANSCO ZONE 6 PIPE SWAP 0 0 - 0 0.0% 0 0
PJM APS ZONE DA OFF-PEAK 0 9,296 -100.0% 4,688 -100.0% 8,960 9,296 -
TEXAS EAST ELA NAT GAS IN 0 0 - 0 0.0% 0 0
PETRO OUTRIGHT NA 225 0 - 25 800.0% 250 0
NYMEX OMAN CRUDE PRODUC 0 0 - 200 -100.0% 1,237 0
GULF CST GASOL CRCK SPRD 0 0 - 0 0.0% 0 0
PJM APS ZONE DA PEAK 0 514 -100.0% 256 -100.0% 490 514 -ELEC ERCOT DLY PEAK 0 0 - 1,260 -100.0% 1,260 0
CRUDE OIL SPRDS 2,920 0 0.0% 3,925 -25.6% 12,705 0
ELEC ERCOT OFF PEAK 0 0 - 0 0.0% 0 0
GC ULSD VS GC JET SPREAD 0 0 - 0 0.0% 0 0
TD9 CARIBBEAN TO US GULF 0 0 - 0 0.0% 0 0
GC ULSD CRK SPD (ARGUS) 0 0 - 0 0.0% 0 0
NYMEX IRON ORE FUTURES 0 0 - 0 0.0% 0 0
ALGON CITY GATES NAT GAS 680 0 - 1,712 -60.3% 3,069 0
TS (ARGUS) TRADE MONTH 0 0 - 0 0.0% 0 0
MJC FUT 0 0 - 0 0.0% 672 0
PETRO CRCKS & SPRDS NA 15,577 0 - 16,114 -3.3% 33,911 0
RBOB SPREAD (PLATTS) SWAP 0 0 - 0 0.0% 0 0
VOLUME
APR 2011
VOLUME
APR 2010 % CHG
VOLUME
MAR 2011 % CHG
VOLUME
Y.T.D 2011
VOLUME
Y.T.D 2010 % CHG
The information herein is taken form source believed to be reliable. However, it is intended for the purposes of information and education only and is not guaranteed by the CME Group as to accuracy,
completeness, nor trading results and does not constitute advice or continue a solicitation of the purchase or sale of any futures or options. The Rules and Regulations of the CME Group should beconsulted as the authoritative source on all current contract specifications and regulations. The previous year Average Daily Volume (ADV) may slightly differ for CBOT legacy products based on the way
CME Grou defines the number of tradin da s. The o en interest values are based on reliminar o en interest values onl .

8/6/2019 Web Volume Report CMEG
http://slidepdf.com/reader/full/web-volume-report-cmeg 14/20
CMEG Exchange Volume Report - Monthly
Energy Futures
FL GAS ZONE 3 NAT GASSWIN 0 0 - 0 0.0% 0 0
MCCLOSKY RCH BAY COAL 0 0 - 0 0.0% 0 0
NGPL TEX/OK 4,319 26,307 -83.6% 3,192 35.3% 22,277 87,329 -7
MNC FUT 0 0 - 12 -100.0% 377 0
MCCLOSKY ARA ARGS COAL 0 0 - 0 0.0% 20 0
ALBERTA ELECTRICITY 0 0 - 0 0.0% 2,209 0
ONTARIO POWER SWAPS 6,385 0 - 7,680 -16.9% 14,065 0
SINGAPORE GASOIL 276 0 - 1,655 -83.3% 1,931 0
PREMIUM UNLEAD 10PPM C NW 0 0 - 5 -100.0% 5 0
TENN 800 LEG NAT GAS INDE 10,383 0 - 0 - 10,383 0
NEPOOL RHODE IL 5MW D AH 137,650 0 - 0 - 137,650 0
216 0 - 0 - 216 0
Energy Options
ETHANOL FWD 2,075 1,413 46.9% 3,831 -45.8% 7,948 9,381 -1
PGE CITYGATE PIPE SWAP 0 0 0.0% 0 0.0% 4,800 0
ALBERTA PIPE SWAP 0 0 0.0% 0 - 0 0
N ROCKIES PIPE SWAP 0 0 0.0% 200 -100.0% 2,360 27,600 -9
HUSTN SHIP CHNL PIPE SWP 0 0 0.0% 0 0.0% 0 1,800 -10
SAN JUAN PIPE SWAP 1,646 0 0.0% 0 0.0% 1,646 180 81
SOCAL PIPE SWAP 288 1,200 -76.0% 1,656 -82.6% 13,176 5,372 14
PANHANDLE PIPE SWAP 0 0 0.0% 0 0.0% 3,100 59,520 -9
BRENT OIL LAST DAY 43,354 4,875 789.3% 56,649 -23.5% 185,279 13,103 1,31
BRENT CALENDAR SWAP 39,400 8,601 358.1% 32,786 20.2% 167,284 23,691 60
SINGAPORE JET FUEL CALEND 0 0 0.0% 375 -100.0% 675 1,485 -5ROTTERDAM 3.5%FUEL OIL CL 441 291 51.5% 654 -32.6% 2,160 1,018 11
SINGAPORE FUEL OIL 180 CS 50 0 0.0% 360 -86.1% 860 200 33
CINERGY HUB PEAK MONTH 3,400 11,720 -71.0% 960 254.2% 9,040 39,440 -7
NATURAL GAS 1MO 0 10,800 -100.0% 0 0.0% 300 21,125 -9
HEATING OIL PHY 46,806 64,874 -27.9% 77,610 -39.7% 255,928 265,715 -
CENTRAL APPALACHIAN COAL 0 0 0.0% 0 0.0% 105 420 -7
N ILLINOIS HUB MTHLY 0 0 0.0% 0 0.0% 0 0
AHA BASIS 0 0 0.0% 0 0.0% 0 0
MT. BELVIEU NORMAL BUTANE 0 0 0.0% 0 - 0 0
MT. BELVIEU NATURAL GASOI 0 0 0.0% 0 - 0 0
MONT BELVIEU ETHANE (OPIS) 0 0 0.0% 0 - 0 0
MONT BELVIEU PROPANE (OPIS 0 0 0.0% 0 - 0 0
HENRY HUB FINANCIAL LAST 642 528 21.6% 1,485 -56.8% 9,372 7,496 2
RBOB PHY 37,636 57,710 -34.8% 37,800 -0.4% 143,719 232,148 -3
NATURAL GAS PHY 2,146,014 1,853,004 15.8% 2,542,143 -15.6% 9,295,884 8,252,314 1
CRUDE OIL APO 227,404 486,755 -53.3% 273,838 -17.0% 961,298 1,510,922 -3
NATURAL GAS 3 M CSO FIN 29,100 19,225 51.4% 43,495 -33.1% 179,100 53,008 23
NATURAL GAS 1 M CSO FIN 45,230 32,650 38.5% 19,950 126.7% 88,390 85,495
TI CRUDE OIL 1 M CSO FI 0 0 0.0% 0 0.0% 7,550 0
CRUDE OIL PHY 2,952,501 2,610,557 13.1% 3,850,121 -23.3% 13,864,459 10,801,409 2
RBOB CALENDAR SWAP 3,335 24,784 -86.5% 6,931 -51.9% 15,436 46,446 -6
RBOB CRACK 39 2,502 -98.4% 21 85.7% 225 2,902 -9
RBOB 1MO CAL SPD OPTIONS 1,800 6,100 -70.5% 0 0.0% 6,000 7,150 -1
ISO NEW ENGLAND PK LMP 150 280 -46.4% 33,960 -99.6% 37,440 2,686 1,29
NY HARBOR HEAT OIL SWP 16,969 60,782 -72.1% 38,275 -55.7% 92,813 256,931 -6
VOLUME
APR 2011
VOLUME
APR 2010 % CHG
VOLUME
MAR 2011 % CHG
VOLUME
Y.T.D 2011
VOLUME
Y.T.D 2010 % CHG
The information herein is taken form source believed to be reliable. However, it is intended for the purposes of information and education only and is not guaranteed by the CME Group as to accuracy,
completeness, nor trading results and does not constitute advice or continue a solicitation of the purchase or sale of any futures or options. The Rules and Regulations of the CME Group should beconsulted as the authoritative source on all current contract specifications and regulations. The previous year Average Daily Volume (ADV) may slightly differ for CBOT legacy products based on the way
CME Grou defines the number of tradin da s. The o en interest values are based on reliminar o en interest values onl .

8/6/2019 Web Volume Report CMEG
http://slidepdf.com/reader/full/web-volume-report-cmeg 15/20
CMEG Exchange Volume Report - Monthly
Energy Options
PJM MONTHLY 1,780 75,502 -97.6% 900 97.8% 90,550 295,020 -6
TI-BRENT BULLET SWAP 3,050 0 - 850 258.8% 4,512 0
HEATING OIL CRACK OPTIONS 0 4,729 -100.0% 50 -100.0% 687 5,004 -8
HO 1 MONTH CLNDR OPTIONS 700 1,800 -61.1% 200 250.0% 2,800 6,000 -5
HO 3 MONTH CAL 0 0 0.0% 0 0.0% 0 0
NG HH 3 MONTH CAL 0 200 -100.0% 100 -100.0% 100 700 -8
CRUDE OIL 1MO 109,733 174,650 -37.2% 223,799 -51.0% 1,034,349 534,540 9
TI 6 MONTH CALENDAR OPTI 0 2,100 -100.0% 0 0.0% 1,000 4,650 -7
TI 12 MONTH CALENDAR OPT 25 3,350 -99.3% 0 0.0% 525 17,950 -9
NYMEX EUROPEAN GASOIL APO 2,018 4,129 -51.1% 2,035 -0.8% 6,492 11,310 -4
NYMEX EUROPEAN GASOIL OPT 144 0 0.0% 0 0.0% 144 30 38
NG HH 2 MONTH CAL 0 0 0.0% 0 - 0 0
IN DELIVERY MONTH EUA OPTI 0 0 0.0% 0 0.0% 2,000 1,500 3NW PIPELINE ROCKIES BASIS 0 372 -100.0% 0 0.0% 0 4,800 -10
PANHANDLE BASIS 2,100 2,700 -22.2% 0 0.0% 2,940 2,700
NYISO ZONE J 5MW PEAK OPTI 0 0 0.0% 0 0.0% 0 0
NYISO ZONE G 5MW PEAK OPTI 0 0 0.0% 0 0.0% 0 19,260 -10
PETROCHEMICALS 740 810 -8.6% 1,200 -38.3% 3,260 4,811 -3
NATURAL GAS SUMMER STRIP 0 0 0.0% 0 0.0% 100 400 -7
NATURAL GAS OPTION ON CALE 2,143 200 971.5% 2,648 -19.1% 5,626 600 83
ELEC MISO PEAK 0 0 - 0 0.0% 0 0
EUROPEAN JET KEROSENE NW 0 156 -100.0% 0 0.0% 231 239 -
IN DELIVERY MONTH CER OPTI 0 500 -100.0% 0 0.0% 0 500 -10
SOCAL BASIS OPTION 0 0 0.0% 0 0.0% 0 2,800 -10
IN DELIVERY MONTH EUA SERI 0 0 0.0% 0 0.0% 0 500 -10
NATURAL GAS OPT 0 6,400 -100.0% 0 0.0% 0 28,336 -10
PJM CALENDAR STRIP 6,320 220 2,772.7% 3,200 97.5% 14,100 860 1,53
CRUDE OIL OUTRIGHTS 0 0 - 0 0.0% 0 0
APPALACHIAN COAL 40 130 -69.2% 150 -73.3% 625 195 22
NATURAL GAS 6 M CSO FIN 200 0 - 1,625 -87.7% 10,225 0
BRENT CRUDE OIL 1 M CSO 0 0 - 0 0.0% 2,500 0
ELEC FINSETTLED 2,757 0 - 2,717 1.5% 13,376 0
SINGAPORE GASOIL CALENDAR 0 0 - 150 -100.0% 450 0
TRANSCO ZONE 6 PIPE SWAP 0 0 - 0 0.0% 0 0
HEATING OIL CRK SPD AVG PRI 0 0 - 0 0.0% 0 0
PETRO OUTRIGHT NA 100 0 - 0 0.0% 100 0
NATURAL GAS 5 M CSO FIN 0 850 -100.0% 0 0.0% 0 850 -10
BRENT CRUDE OIL 6 M CSO 0 50 -100.0% 0 0.0% 0 50 -10
BRENT 1 MONTH CAL 0 0 - 0 0.0% 0 0
CAPP COAL CALENDAR STRIP 0 0 - 0 0.0% 0 0ETHANOL SWAP 0 0 - 0 0.0% 10 0
CRUDE OIL CALNDR STRIP 0 0 - 0 0.0% 0 0
GASOIL CRACK SPREAD AVG P 0 0 - 0 0.0% 1,350 0
NATURAL GAS WINTER STRIP 0 0 - 0 0.0% 0 0
NATURAL GAS 2 M CSO FIN 0 0 - 0 0.0% 0 0
NAT GAS BASIS SWAP 0 0 - 0 0.0% 0 0
HO 6 MONTH CAL 0 0 - 150 -100.0% 150 0
RBOB 3 MONTH CALENDAR SPR 700 0 - 0 - 700 0
VOLUME
APR 2011
VOLUME
APR 2010 % CHG
VOLUME
MAR 2011 % CHG
VOLUME
Y.T.D 2011
VOLUME
Y.T.D 2010 % CHG
The information herein is taken form source believed to be reliable. However, it is intended for the purposes of information and education only and is not guaranteed by the CME Group as to accuracy,
completeness, nor trading results and does not constitute advice or continue a solicitation of the purchase or sale of any futures or options. The Rules and Regulations of the CME Group should beconsulted as the authoritative source on all current contract specifications and regulations. The previous year Average Daily Volume (ADV) may slightly differ for CBOT legacy products based on the way
CME Grou defines the number of tradin da s. The o en interest values are based on reliminar o en interest values onl .

8/6/2019 Web Volume Report CMEG
http://slidepdf.com/reader/full/web-volume-report-cmeg 16/20
CMEG Exchange Volume Report - Monthly
FX Futures
AUSTRALIAN DOLLAR 1,679,421 1,842,359 -8.8% 2,780,475 -39.6% 8,278,118 8,009,788
BRITISH POUND 2,170,258 2,367,846 -8.3% 2,933,238 -26.0% 10,142,842 10,417,555 -
BRAZIL REAL 5,710 2,909 96.3% 40,951 -86.1% 91,901 13,547 57
CANADIAN DOLLAR 1,403,277 1,741,971 -19.4% 2,143,393 -34.5% 6,529,153 6,746,918 -
E-MINI EURO FX 101,302 99,926 1.4% 122,696 -17.4% 471,372 334,040 4
EURO FX 5,453,127 7,157,050 -23.8% 7,437,718 -26.7% 26,745,486 26,566,594
E-MINI JAPANESE YEN 17,310 4,299 302.7% 17,349 -0.2% 49,083 12,975 27
JAPANESE YEN 2,438,440 2,397,185 1.7% 3,763,993 -35.2% 11,317,189 9,765,326 1
MEXICAN PESO 477,953 446,211 7.1% 1,054,570 -54.7% 2,623,477 1,905,611 3
NEW ZEALND DOLLAR 173,196 188,447 -8.1% 259,439 -33.2% 717,434 790,550 -
NKR/USD CROSS RATE 345 314 9.9% 2,132 -83.8% 3,504 4,631 -2
RUSSIAN RUBLE 74,704 14,698 408.3% 57,423 30.1% 178,419 50,752 25
S.AFRICAN RAND 4,081 7,529 -45.8% 21,682 -81.2% 35,689 39,962 -1SWISS FRANC 826,972 1,105,769 -25.2% 1,266,443 -34.7% 3,967,801 4,325,299 -
AD/CD CROSS RATES 1 126 -99.2% 299 -99.7% 524 1,590 -6
AD/JY CROSS RATES 1,439 625 130.2% 7,262 -80.2% 12,936 8,446 5
AD/NE CROSS RATES 6 0 0.0% 27 -77.8% 33 93 -6
BP/JY CROSS RATES 2,645 1,223 116.3% 6,346 -58.3% 15,043 6,637 12
BP/SF CROSS RATES 2,302 1,052 118.8% 627 267.1% 5,750 4,496 2
CD/JY CROSS RATES 2 78 -97.4% 48 -95.8% 124 671 -8
EC/AD CROSS RATES 99 225 -56.0% 257 -61.5% 1,287 473 17
EC/CD CROSS RATES 158 17 829.4% 504 -68.7% 868 112 67
EC/NOK CROSS RATES 0 0 0.0% 4 -100.0% 14 7 10
EC/SEK CROSS RATES 0 6 -100.0% 6 -100.0% 6 120 -9
EFX/BP CROSS RATES 20,482 14,442 41.8% 37,350 -45.2% 91,765 70,476 3
EFX/JY CROSS RATES 28,525 19,962 42.9% 48,581 -41.3% 109,396 83,592 3
EFX/SF CROSS RATES 22,116 4,663 374.3% 34,322 -35.6% 98,041 32,474 20
SF/JY CROSS RATES 551 22 2,404.5% 1,479 -62.7% 3,293 36 9,04
SKR/USD CROSS RATES 252 260 -3.1% 342 -26.3% 815 5,074 -8
CZECK KORUNA (US) 0 83 -100.0% 30 -100.0% 40 218 -8
CZECK KORUNA (EC) 0 0 0.0% 0 0.0% 0 177 -10
HUNGARIAN FORINT (US) 94 234 -59.8% 758 -87.6% 1,043 648 6
HUNGARIAN FORINT (EC) 0 3 -100.0% 0 0.0% 0 444 -10
POLISH ZLOTY (US) 1,915 1,418 35.0% 9,571 -80.0% 14,742 8,153 8
POLISH ZLOTY (EC) 2,613 1,483 76.2% 3,073 -15.0% 13,139 15,132 -1
SHEKEL 302 486 -37.9% 623 -51.5% 2,078 2,656 -2
RMB USD 736 185 297.8% 1,452 -49.3% 3,245 706 35
KOREAN WON 42 553 -92.4% 665 -93.7% 1,356 2,455 -4
TURKISH LIRA 503 2,931 -82.8% 2,259 -77.7% 3,563 8,915 -6
TURKISH LIRA (EU) 1,232 581 112.0% 203 506.9% 2,215 6,316 -6E-MICRO EUR/USD 80,311 55,553 44.6% 95,808 -16.2% 388,456 195,353 9
E-MICRO GBP/USD 17,203 15,480 11.1% 20,108 -14.4% 59,537 44,777 3
E-MICRO USD/CAD 1,339 2,043 -34.5% 1,188 12.7% 4,279 8,761 -5
E-MICRO USD/CHF 1,921 598 221.2% 2,313 -16.9% 6,783 2,215 20
E-MICRO USD/JPY 2,967 1,125 163.7% 3,460 -14.2% 10,407 15,802 -3
E-MICRO AUD/USD 11,658 3,390 243.9% 17,013 -31.5% 49,092 12,568 29
COLOMBIAN PESO FUTURES 1,897 790 140.1% 2,450 -22.6% 7,679 3,498 11
FX$INDEX 20 0 - 70 -71.4% 202 0
MICRO CAD/USD 3,263 0 - 3,047 7.1% 7,558 0
MICRO CHF/USD 2,445 0 - 2,572 -4.9% 6,060 0
MICRO JYP/USD 9,688 0 - 10,580 -8.4% 26,342 0
EUR/USD REALIZED VOL 133 0 - 51 160.8% 195 0
VOLUME
APR 2011
VOLUME
APR 2010 % CHG
VOLUME
MAR 2011 % CHG
VOLUME
Y.T.D 2011
VOLUME
Y.T.D 2010 % CHG
The information herein is taken form source believed to be reliable. However, it is intended for the purposes of information and education only and is not guaranteed by the CME Group as to accuracy,
completeness, nor trading results and does not constitute advice or continue a solicitation of the purchase or sale of any futures or options. The Rules and Regulations of the CME Group should beconsulted as the authoritative source on all current contract specifications and regulations. The previous year Average Daily Volume (ADV) may slightly differ for CBOT legacy products based on the way
CME Grou defines the number of tradin da s. The o en interest values are based on reliminar o en interest values onl .

8/6/2019 Web Volume Report CMEG
http://slidepdf.com/reader/full/web-volume-report-cmeg 17/20
CMEG Exchange Volume Report - Monthly
FX Options
AUSTRALIAN DOLLAR 50,283 27,701 81.5% 55,387 -9.2% 201,413 113,767 7
BRITISH POUND 93,884 81,963 14.5% 69,278 35.5% 351,929 279,988 2
BRAZIL REAL 0 0 0.0% 0 - 0 0
CANADIAN DOLLAR 55,034 75,979 -27.6% 57,800 -4.8% 208,627 263,481 -2
EURO FX 475,144 698,346 -32.0% 422,486 12.5% 1,938,551 1,959,439 -
JAPANESE YEN 181,935 95,663 90.2% 217,924 -16.5% 595,072 392,316 5
MEXICAN PESO 0 10 -100.0% 0 0.0% 0 42 -10
RUSSIAN RUBLE 1,450 0 - 250 480.0% 1,700 0
SWISS FRANC 16,085 10,170 58.2% 17,458 -7.9% 70,966 29,909 13
EFX/BP CROSS RATES 0 0 - 0 0.0% 0 0
EFX/SF CROSS RATES 0 0 0.0% 0 0.0% 0 1,440 -10
JAPANESE YEN (EU) 802 2,228 -64.0% 887 -9.6% 2,820 7,863 -6
EURO FX (EU) 7,155 10,751 -33.4% 4,867 47.0% 25,831 51,366 -4
SWISS FRANC (EU) 220 2,168 -89.9% 176 25.0% 872 6,149 -8
CANADIAN DOLLAR (EU) 792 2,739 -71.1% 359 120.6% 1,737 10,681 -8
BRITISH POUND (EU) 906 2,963 -69.4% 506 79.1% 3,062 9,956 -6
AUSTRALIAN DLR (EU) 56 72 -22.2% 87 -35.6% 316 729 -5
Commodities and
Alternative Investments
Futures
CORN 8,715,138 6,466,011 34.8% 7,552,429 15.4% 29,721,635 19,644,769 5
SOYBEAN 4,143,101 3,414,381 21.3% 3,906,004 6.1% 16,199,161 12,398,684 3
SOYBEAN MEAL 1,546,888 1,264,337 22.3% 1,475,080 4.9% 5,575,618 4,722,957 1
SOYBEAN OIL 2,276,708 1,924,172 18.3% 2,153,680 5.7% 8,518,400 6,309,660 3OATS 35,451 37,409 -5.2% 32,798 8.1% 137,972 124,642 1
ROUGH RICE 53,413 40,823 30.8% 53,309 0.2% 241,881 133,707 8
HEAT 2,475,855 2,029,843 22.0% 2,131,831 16.1% 8,860,719 6,553,765 3
MINI CORN 38,313 14,939 156.5% 29,715 28.9% 128,897 55,650 13
MINI SOYBEAN 34,588 36,654 -5.6% 26,720 29.4% 138,799 111,783 2
MINI WHEAT 14,744 6,122 140.8% 12,609 16.9% 50,180 21,226 13
LIVE CATTLE 928,365 863,189 7.6% 1,531,599 -39.4% 4,552,603 3,714,273 2
FEEDER CATTLE 148,169 129,218 14.7% 155,692 -4.8% 539,361 453,345 1
LEAN HOGS 660,983 567,410 16.5% 925,083 -28.5% 3,126,257 2,410,736 2
PORK BELLIES 0 659 -100.0% 0 0.0% 2 3,895 -9
LUMBER 32,161 32,393 -0.7% 25,141 27.9% 105,635 105,169
OOD PULP 246 185 33.0% 65 278.5% 311 688 -5
MILK 16,713 22,661 -26.2% 37,892 -55.9% 143,020 99,554 4
MLK MID 0 0 0.0% 0 0.0% 0 0NFD MILK 762 152 401.3% 1,510 -49.5% 4,103 1,713 13
BUTTER 0 0 0.0% 0 0.0% 0 1 -10
BUTTER CS 1,018 1,128 -9.8% 2,110 -51.8% 6,081 4,928 2
CLASS IV MILK 1,162 85 1,267.1% 1,827 -36.4% 6,378 389 1,53
DRY WHEY 256 424 -39.6% 1,113 -77.0% 3,222 2,984
GSCI EXCESS RETURN FUT 1,755 429 309.1% 594 195.5% 81,407 466 17,36
GOLDMAN SACHS 28,622 51,874 -44.8% 37,030 -22.7% 135,699 201,776 -3
ETHANOL 16,665 12,659 31.6% 18,387 -9.4% 63,498 51,579 2
HDD WEATHER 1,149 1,480 -22.4% 4,443 -74.1% 20,135 31,989 -3
CDD WEATHER 1,085 1,550 -30.0% 0 0.0% 1,085 1,550 -3
HDD SEASONAL STRIP 0 0 0.0% 0 0.0% 1,125 440 15
VOLUME
APR 2011
VOLUME
APR 2010 % CHG
VOLUME
MAR 2011 % CHG
VOLUME
Y.T.D 2011
VOLUME
Y.T.D 2010 % CHG
The information herein is taken form source believed to be reliable. However, it is intended for the purposes of information and education only and is not guaranteed by the CME Group as to accuracy,
completeness, nor trading results and does not constitute advice or continue a solicitation of the purchase or sale of any futures or options. The Rules and Regulations of the CME Group should beconsulted as the authoritative source on all current contract specifications and regulations. The previous year Average Daily Volume (ADV) may slightly differ for CBOT legacy products based on the way
CME Grou defines the number of tradin da s. The o en interest values are based on reliminar o en interest values onl .

8/6/2019 Web Volume Report CMEG
http://slidepdf.com/reader/full/web-volume-report-cmeg 18/20
CMEG Exchange Volume Report - Monthly
Commodities and
Alternative InvestmentsFutures
CDD SEASONAL STRIP 200 0 0.0% 100 100.0% 300 0
HDD WEATHER EUROPEAN 78 175 -55.4% 1,478 -94.7% 2,564 6,725 -6
CAT WEATHER EUROPEAN 0 50 -100.0% 0 0.0% 0 100 -10
HDD EURO SEASONAL STRIP 0 1,700 -100.0% 0 0.0% 28 1,700 -9
CAT EURO SEASONAL STRIP 0 100 -100.0% 0 0.0% 0 100 -10
KLY AVG TEMP 0 0 0.0% 0 0.0% 50 0
HOUSING INDEX 45 1 4,400.0% 14 221.4% 93 7 1,22
PACIFIC RIM DAT SS WTHR 0 0 - 0 - 0 0
DLV NFD MILK 0 0 0.0% 0 0.0% 0 5 -10
ANNUAL NOX10 0 0 0.0% 0 0.0% 0 0
COTTON 401 263 52.5% 395 1.5% 2,261 752 20
COCOA TAS 146 102 43.1% 327 -55.4% 1,281 402 21
COFFEE 161 84 91.7% 142 13.4% 583 323 8SUGAR 11 208 1,073 -80.6% 595 -65.0% 2,611 3,879 -3
IN DELIVERY MONTH EUA 0 5,510 -100.0% 0 0.0% 14,167 8,854 6
CARBON EUA EMISSIONS EURO 0 0 0.0% 0 0.0% 0 10 -10
CARBON CER EURO 0 0 0.0% 0 0.0% 0 0
ANNUAL NOX09 0 0 0.0% 0 0.0% 0 0
REGIONAL GREENHOUSE GAS I 0 0 0.0% 0 - 0 0
SO2 EMISSIONS 0 0 0.0% 0 0.0% 0 0
HARD WOOD PULP 0 0 0.0% 0 0.0% 0 3,650 -10
SEAS SNOWFALL BINARY 0 0 0.0% 0 0.0% 0 0
SNOWFALL BINARY 0 0 0.0% 0 0.0% 0 0
GRAIN BASIS SWAPS 13,293 2,539 423.6% 23,934 -44.5% 69,674 9,303 64
USD CRUDE PALM OIL 23 0 - 134 -82.8% 817 0
CASH-SETTLED CHEESE 549 0 - 1,194 -54.0% 3,700 0
OTC SP GSCI ER 3MTH SWAP 5,711 2,919 95.6% 0 0.0% 5,711 2,919 9
DAILY EUA 0 0 - 0 0.0% 1,450 0
DOW-UBS COMMOD INDEX SWA 0 0 - 0 0.0% 0 0
SEAS SNOWFALL 0 0 - 0 - 0 0
OTC SP GSCI ER 2MTH SWAP 0 2,792 -100.0% 0 0.0% 0 2,792 -10
OTC SP GSCI ER SWAP 0 0 - 0 0.0% 0 0
INTL SK MILK 0 0 - 0 0.0% 0 0
DISTILLERS DRIED GRAIN 0 11 -100.0% 0 0.0% 0 11 -10
Commodities and
Alternative Investments
Options
CORN 2,393,765 1,174,882 103.7% 2,650,937 -9.7% 9,495,103 4,396,194 11
SOYBEAN 951,456 795,865 19.5% 1,189,452 -20.0% 4,436,624 2,832,470 5
SOYBEAN MEAL 80,868 89,008 -9.1% 78,327 3.2% 347,796 359,871 -
SOYBEAN OIL 196,068 94,950 106.5% 285,804 -31.4% 878,732 402,459 11
SOYBEAN CRUSH 153 196 -21.9% 148 3.4% 408 903 -5
OATS 1,711 1,198 42.8% 2,603 -34.3% 8,709 5,510 5
ROUGH RICE 4,367 2,501 74.6% 3,694 18.2% 17,926 10,543 7
HEAT 435,192 276,864 57.2% 497,437 -12.5% 1,779,586 1,095,627 6
LIVE CATTLE 231,275 146,415 58.0% 336,851 -31.3% 951,304 612,786 5
FEEDER CATTLE 9,216 11,848 -22.2% 18,632 -50.5% 49,518 38,034 3
LEAN HOGS 59,027 54,441 8.4% 84,260 -29.9% 254,307 204,531 2
PORK BELLIES 0 3 -100.0% 0 0.0% 0 3 -10
LUMBER 849 771 10.1% 674 26.0% 3,122 2,906
MILK 11,617 9,412 23.4% 26,272 -55.8% 97,995 62,288 5
VOLUME
APR 2011
VOLUME
APR 2010 % CHG
VOLUME
MAR 2011 % CHG
VOLUME
Y.T.D 2011
VOLUME
Y.T.D 2010 % CHG
The information herein is taken form source believed to be reliable. However, it is intended for the purposes of information and education only and is not guaranteed by the CME Group as to accuracy,
completeness, nor trading results and does not constitute advice or continue a solicitation of the purchase or sale of any futures or options. The Rules and Regulations of the CME Group should beconsulted as the authoritative source on all current contract specifications and regulations. The previous year Average Daily Volume (ADV) may slightly differ for CBOT legacy products based on the way
CME Grou defines the number of tradin da s. The o en interest values are based on reliminar o en interest values onl .

8/6/2019 Web Volume Report CMEG
http://slidepdf.com/reader/full/web-volume-report-cmeg 19/20
CMEG Exchange Volume Report - Monthly
Commodities and
Alternative InvestmentsOptions
MLK MID 108 115 -6.1% 224 -51.8% 992 437 12
NFD MILK 0 0 0.0% 1 -100.0% 81 0
BUTTER CS 445 0 0.0% 202 120.3% 1,155 60 1,82
CLASS IV MILK 24 0 - 0 0.0% 372 0
DRY WHEY 0 34 -100.0% 0 0.0% 0 382 -10
HDD WEATHER 0 250 -100.0% 4,320 -100.0% 18,295 15,600 1
CDD WEATHER 100 2,350 -95.7% 0 0.0% 100 2,350 -9
HDD SEASONAL STRIP 16 0 0.0% 300 -94.7% 21,316 15,600 3
CDD SEASONAL STRIP 26,900 21,000 28.1% 22,500 19.6% 56,900 31,000 8
HDD WEATHER EUROPEAN 0 0 0.0% 0 0.0% 0 0
HDD EURO SEASONAL STRIP 0 1,000 -100.0% 0 0.0% 0 7,200 -10
CAT EURO SEASONAL STRIP 500 0 0.0% 0 - 500 0
PACIFIC RIM DAT SS WTHR 0 0 0.0% 0 0.0% 0 0SBIN M HURR 0 0 0.0% 0 - 0 0
CORN NEARBY+2 CAL SPRD 5,480 480 1,041.7% 6,257 -12.4% 14,707 1,411 94
SOYBN NEARBY+2 CAL SPRD 6,386 0 0.0% 7,175 -11.0% 14,701 109 13,38
HEAT NEARBY+2 CAL SPRD 3,226 325 892.6% 2,001 61.2% 12,697 325 3,80
JULY-DEC CORN CAL SPRD 3,429 2,374 44.4% 11,528 -70.3% 26,154 2,794 83
DEC-JULY WHEAT CAL SPRD 499 0 0.0% 225 121.8% 729 0
JULY-NOV SOYBEAN CAL SPRD 13,747 7,747 77.4% 25,199 -45.4% 73,738 28,606 15
JULY-DEC WHEAT CAL SPRD 100 92 8.7% 300 -66.7% 900 504 7
JULY-JULY WHEAT CAL SPRD 964 618 56.0% 758 27.2% 3,969 2,882 3
NOV-NOV SOYBEAN CAL SPRD 1,405 0 0.0% 1,305 7.7% 2,710 0
SBIN M HURR EVENT2 0 0 0.0% 0 0.0% 0 1,000 -10
CARBON CER EURO OPTION 0 0 0.0% 0 0.0% 0 0
CARBON EUA EMISSIONS EURO 0 0 0.0% 0 0.0% 0 0
SEAS SNOWFALL BINARY 0 0 0.0% 0 0.0% 0 0
SNOWFALL BINARY 0 0 0.0% 0 0.0% 0 42 -10
LV CATL CSO 0 0 0.0% 10 -100.0% 10 58 -8
SOYMEAL NEARBY+2 CAL SPRD 0 0 0.0% 0 0.0% 0 300 -10
SBIN HURR 0 250 -100.0% 500 -100.0% 1,000 650 5
JULY-DEC SOYMEAL CAL SPRD 0 25 -100.0% 25 -100.0% 50 25 10
CASH-SETTLED CHEESE 9 0 - 9 0.0% 30 0
SOY OIL NEARBY+2 CAL SPRD 25 0 - 0 0.0% 770 0
DEC-DEC CORN CAL SPRD 25 0 - 0 0.0% 70 0
JULY-DEC SOY OIL CAL SPRD 50 0 - 0 0.0% 555 0
SNOWFALL 0 0 - 0 0.0% 110 0
SEAS SNOWFALL 0 0 - 0 0.0% 0 0
HEAT-CORN ICSO 295 0 - 290 1.7% 785 0
DEC-JULY CORN CAL SPRD 0 0 - 50 -100.0% 50 0NOV-JULY SOYBEAN CAL SPRD 0 0 - 0 0.0% 0 0
SOYBEAN CORN RATIO 50 0 - 0 - 50 0
TOTAL FUTURES GROUP
Interest Rate Futures 93,934,801 97,880,745 -4.0% 126,460,890 -25.7% 423,377,525 350,993,268 20.6
Equity Index Futures 40,896,369 54,139,309 -24.5% 75,807,209 -46.1% 208,654,811 218,578,132 -4.5
Metals Futures 7,485,108 5,133,216 45.8% 7,512,766 -0.4% 27,928,325 23,270,358 20.0
Energy Futures 27,908,911 32,960,172 -15.3% 34,064,714 -18.1% 129,578,683 114,135,575 13.5
FX Futures 15,044,956 17,506,150 -14.1% 22,216,250 -32.3% 72,099,374 69,526,639 3.7
Commodities and Alternative Invest 21,194,125 16,937,506 25.1% 20,144,974 5.2% 78,468,474 57,203,850 37.2
TOTAL FUTURES 206,464,270 224,557,098 -8.1% 286,206,803 -27.9% 940,107,192 833,707,822 12.8
VOLUME
APR 2011
VOLUME
APR 2010 % CHG
VOLUME
MAR 2011 % CHG
VOLUME
Y.T.D 2011
VOLUME
Y.T.D 2010 % CHG
The information herein is taken form source believed to be reliable. However, it is intended for the purposes of information and education only and is not guaranteed by the CME Group as to accuracy,
completeness, nor trading results and does not constitute advice or continue a solicitation of the purchase or sale of any futures or options. The Rules and Regulations of the CME Group should beconsulted as the authoritative source on all current contract specifications and regulations. The previous year Average Daily Volume (ADV) may slightly differ for CBOT legacy products based on the way
CME Grou defines the number of tradin da s. The o en interest values are based on reliminar o en interest values onl .

8/6/2019 Web Volume Report CMEG
http://slidepdf.com/reader/full/web-volume-report-cmeg 20/20
CMEG Exchange Volume Report - Monthly
TOTAL OPTIONS GROUP
Equity Index Options 3,612,972 3,100,220 16.5% 4,859,968 -25.7% 16,209,162 11,232,880 44.
Interest Rate Options 20,750,613 25,427,221 -18.4% 25,587,855 -18.9% 89,580,599 84,621,112 5.
Metals Options 1,001,040 589,021 69.9% 906,533 10.4% 3,894,772 2,422,651 60.
Energy Options 5,730,830 5,537,499 3.5% 7,262,874 -21.1% 26,555,249 22,672,562 17.
FX Options 883,746 1,010,753 -12.6% 847,465 4.3% 3,402,896 3,127,126 8.
Commodities and Alternative Invest 4,439,347 2,695,014 64.7% 5,258,270 -15.6% 18,574,626 10,135,460 83.
TOTAL OPTIONS 36,418,548 38,359,728 -5.1% 44,722,965 -18.6% 158,217,304 134,211,791 17.
TOTAL COMBINED
Interest Rate 114,685,414 123,307,966 -7.0% 152,048,745 -24.6% 512,958,124 435,614,380 17.
Equity Index 44,509,341 57,239,529 -22.2% 80,667,177 -44.8% 224,863,973 229,811,012 -2.
Metals 8,486,148 5,722,237 48.3% 8,419,299 0.8% 31,823,097 25,693,009 23.
Energy 33,639,741 38,497,671 -12.6% 41,327,588 -18.6% 156,133,932 136,808,137 14.
FX 15,928,702 18,516,903 -14.0% 23,063,715 -30.9% 75,502,270 72,653,765 3.
Commodities and Alternative Invest 25,633,472 19,632,520 30.6% 25,403,244 0.9% 97,043,100 67,339,310 44.
GRAND TOTAL 242,882,818 262,916,826 -7.6% 330,929,768 -26.6% 1,098,324,496 967,919,613 13.
VOLUME
APR 2011
VOLUME
APR 2010 % CHG
VOLUME
MAR 2011 % CHG
VOLUME
Y.T.D 2011
VOLUME
Y.T.D 2010 % CHG