webcast 1 t15 ing
TRANSCRIPT

Localiza Rent a Car S.A. 1Q15 Earnings
R$ million
April 24, 2015
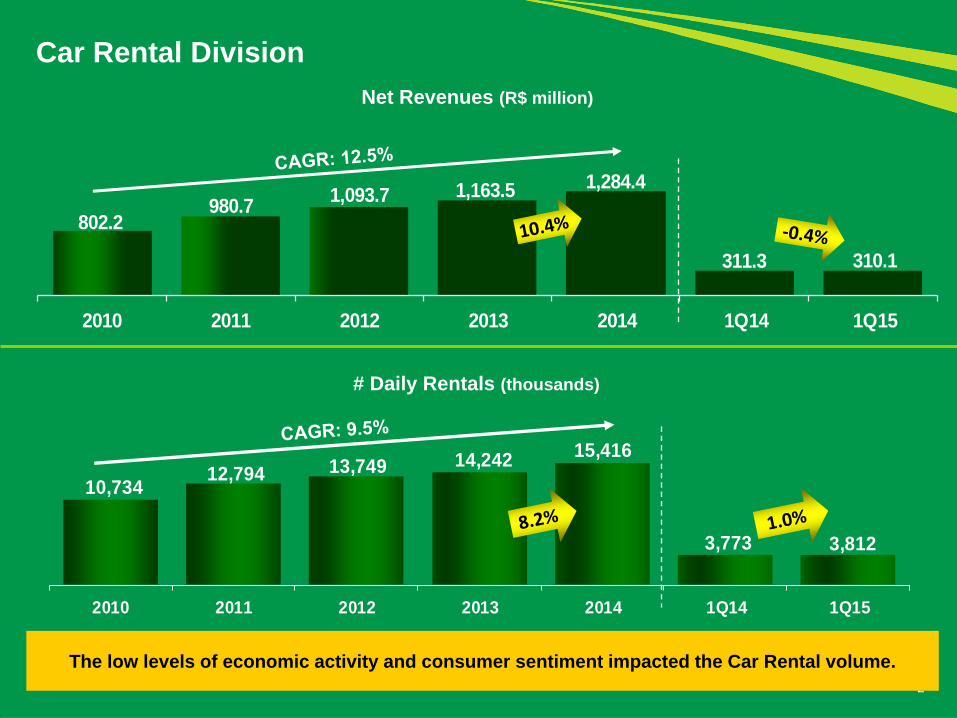
802.2980.7
1,093.7 1,163.5 1,284.4
311.3 310.1
2010 2011 2012 2013 2014 1Q14 1Q15
2
Net Revenues (R$ million)
# Daily Rentals (thousands)
Car Rental Division
The low levels of economic activity and consumer sentiment impacted the Car Rental volume.
10,734 12,794 13,749 14,242
15,416
3,773 3,812
2010 2011 2012 2013 2014 1Q14 1Q15
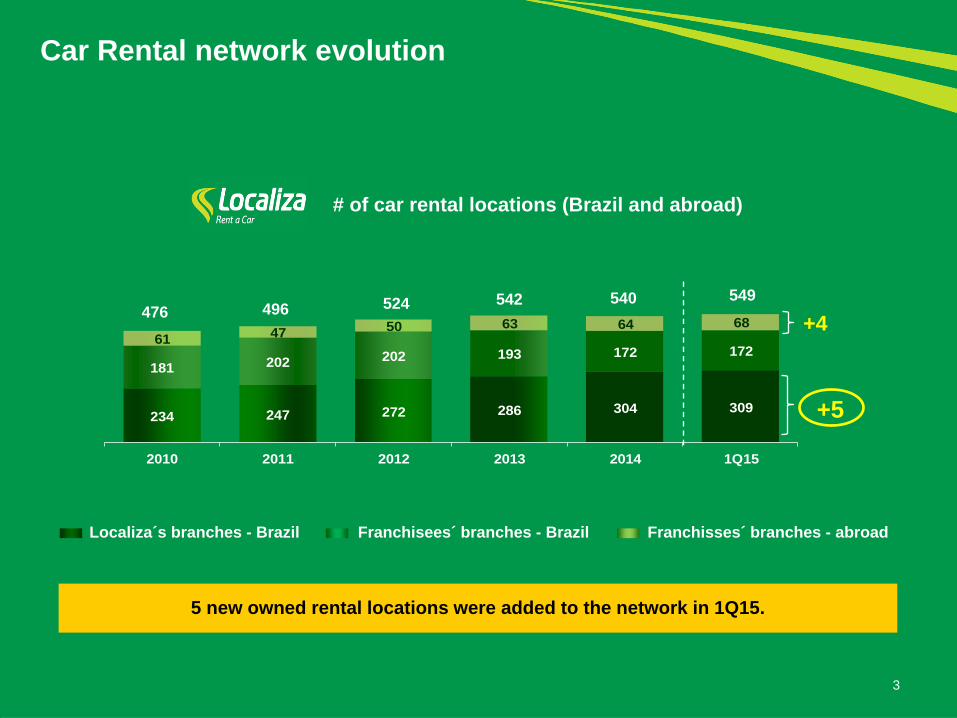
234 247 272 286 304 309
181 202 202 193 172 17261
47 50 63 64 68
2010 2011 2012 2013 2014 1Q15
3
Car Rental network evolution
5 new owned rental locations were added to the network in 1Q15.
# of car rental locations (Brazil and abroad)
Localiza´s branches - Brazil Franchisees´ branches - Brazil Franchisses´ branches - abroad
476 496 524 542 540
+5
549
+4
4
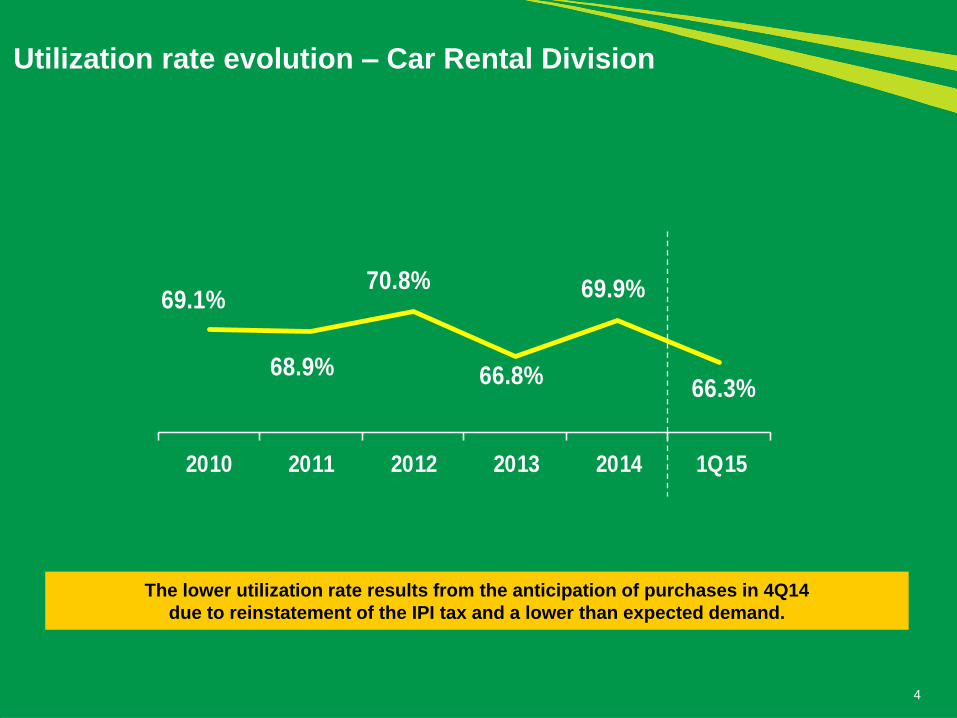
Utilization rate evolution – Car Rental Division
The lower utilization rate results from the anticipation of purchases in 4Q14
due to reinstatement of the IPI tax and a lower than expected demand.
69.1%
68.9%
70.8%
66.8%
69.9%
66.3%
2010 2011 2012 2013 2014 1Q15
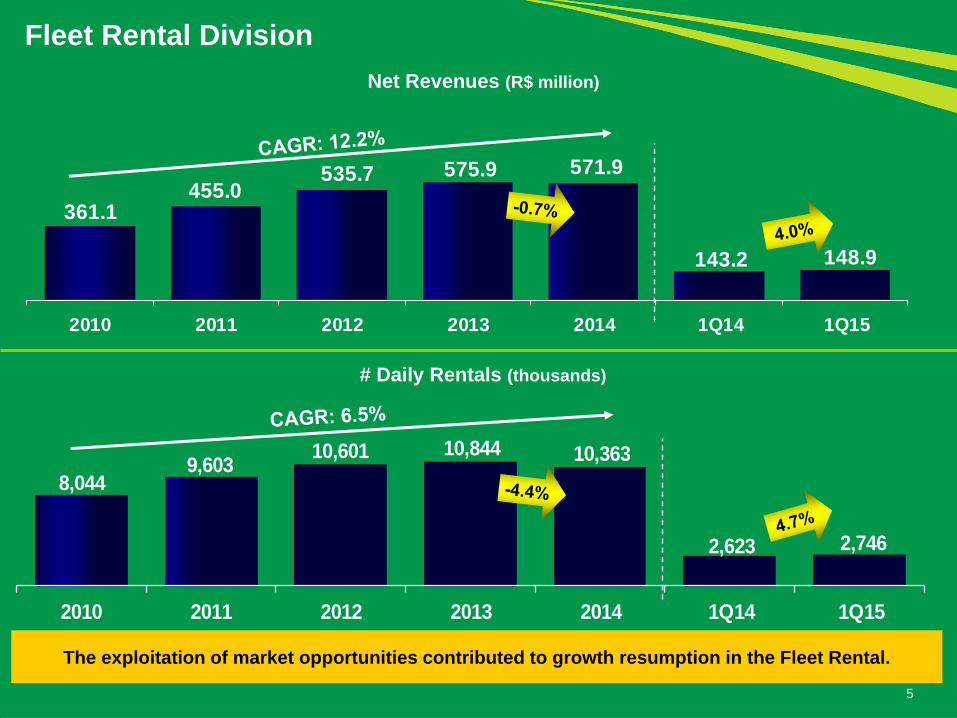
361.1 455.0
535.7 575.9 571.9
143.2 148.9
2010 2011 2012 2013 2014 1Q14 1Q15
8,0449,603
10,601 10,844 10,363
2,623 2,746
2010 2011 2012 2013 2014 1Q14 1Q15
5
Net Revenues (R$ million)
# Daily Rentals (thousands)
Fleet Rental Division
The exploitation of market opportunities contributed to growth resumption in the Fleet Rental.
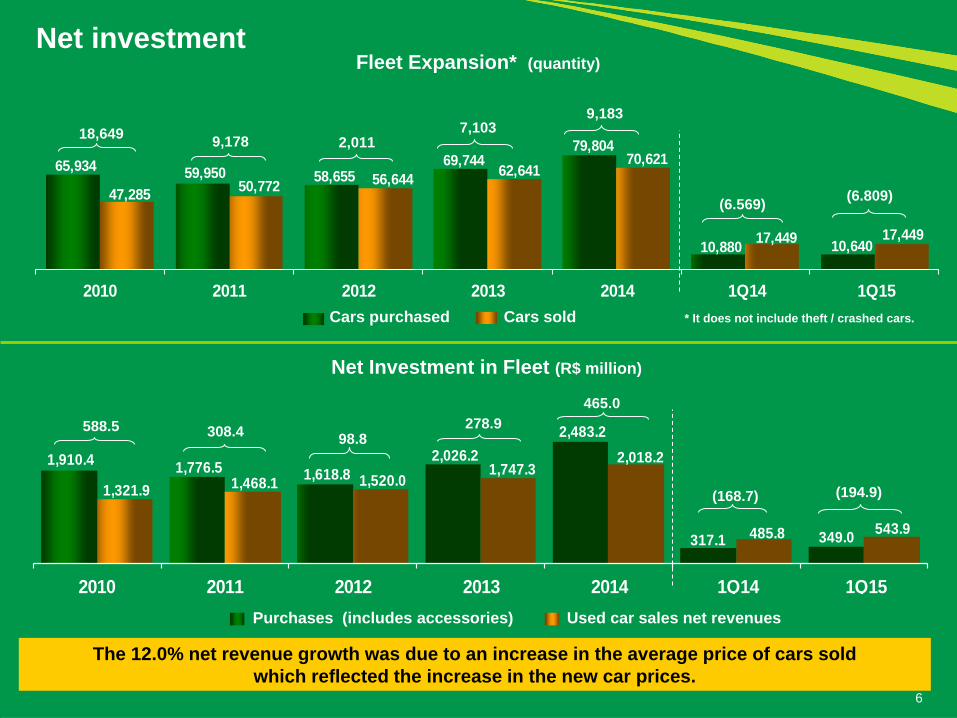
1,910.4 1,776.5 1,618.8
2,026.2
2,483.2
317.1 349.0
1,321.9 1,468.1 1,520.0
1,747.3 2,018.2
485.8 543.9
2010 2011 2012 2013 2014 1Q14 1Q15
Purchases (includes accessories) Used car sales net revenues
Cars purchased Cars sold
6
Net investment Fleet Expansion* (quantity)
The 12.0% net revenue growth was due to an increase in the average price of cars sold
which reflected the increase in the new car prices.
Net Investment in Fleet (R$ million)
65,934 59,950 58,655
69,744 79,804
10,880 10,640
47,285 50,772 56,644
62,641 70,621
17,449 17,449
2010 2011 2012 2013 2014 1Q14 1Q15
9,178 2,011 7,103 18,649
(6.569)
308.4 98.8
588.5 278.9
* It does not include theft / crashed cars.
(168.7)
(6.809)
(194.9)
9,183
465.0
7
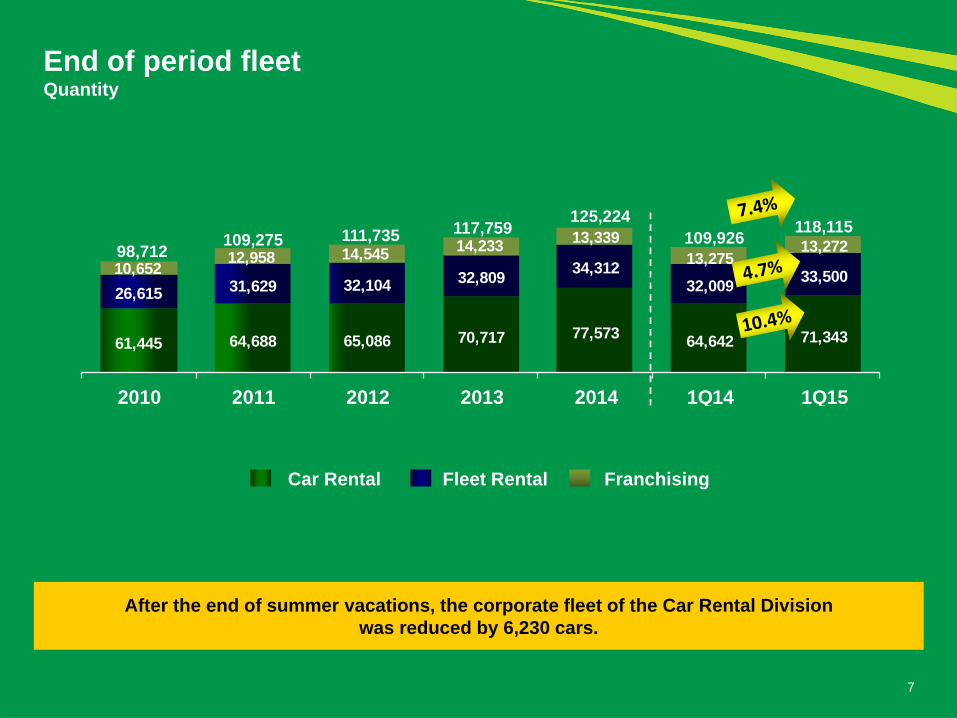
End of period fleet Quantity
After the end of summer vacations, the corporate fleet of the Car Rental Division
was reduced by 6,230 cars.
61,445 64,688 65,086 70,717 77,57364,642 71,343
26,615 31,629 32,10432,809
34,31232,009
33,50010,652
12,958 14,54514,233
13,339
13,27513,272
2010 2011 2012 2013 2014 1Q14 1Q15
98,712 109,275 111,735 117,759
125,224
Car Rental Fleet Rental Franchising
109,926 118,115
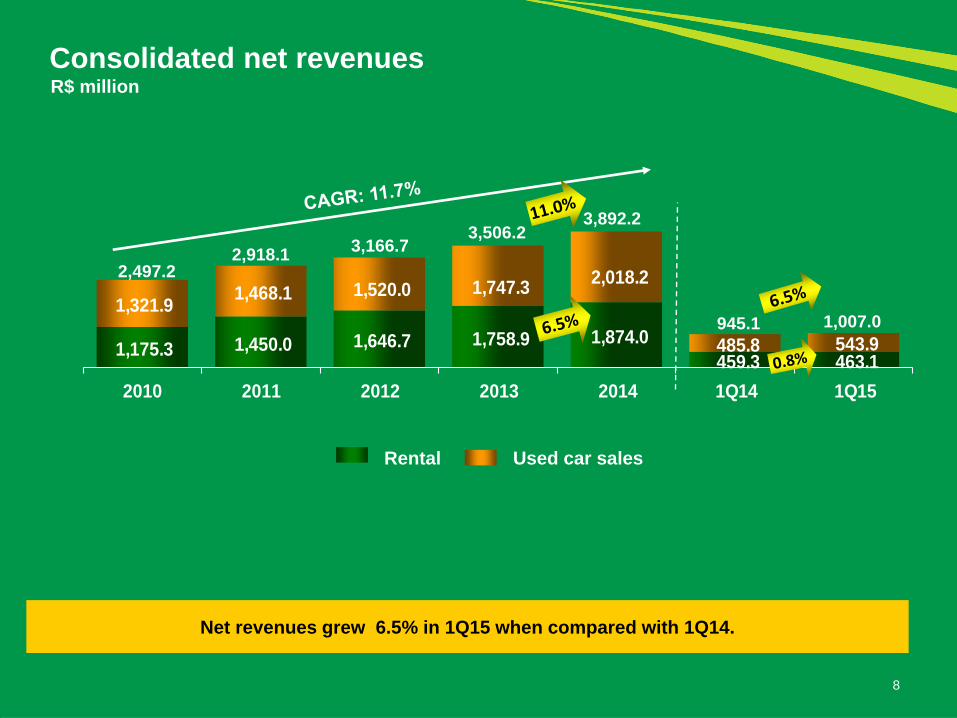
1,175.3 1,450.0 1,646.7 1,758.9 1,874.0
459.3 463.1
1,321.9 1,468.1 1,520.0 1,747.3
2,018.2
485.8 543.9
2010 2011 2012 2013 2014 1Q14 1Q15
8
Consolidated net revenues R$ million
Net revenues grew 6.5% in 1Q15 when compared with 1Q14.
Rental Used car sales
2,918.1
3,506.2 3,892.2
2,497.2
3,166.7
945.1 1,007.0
9
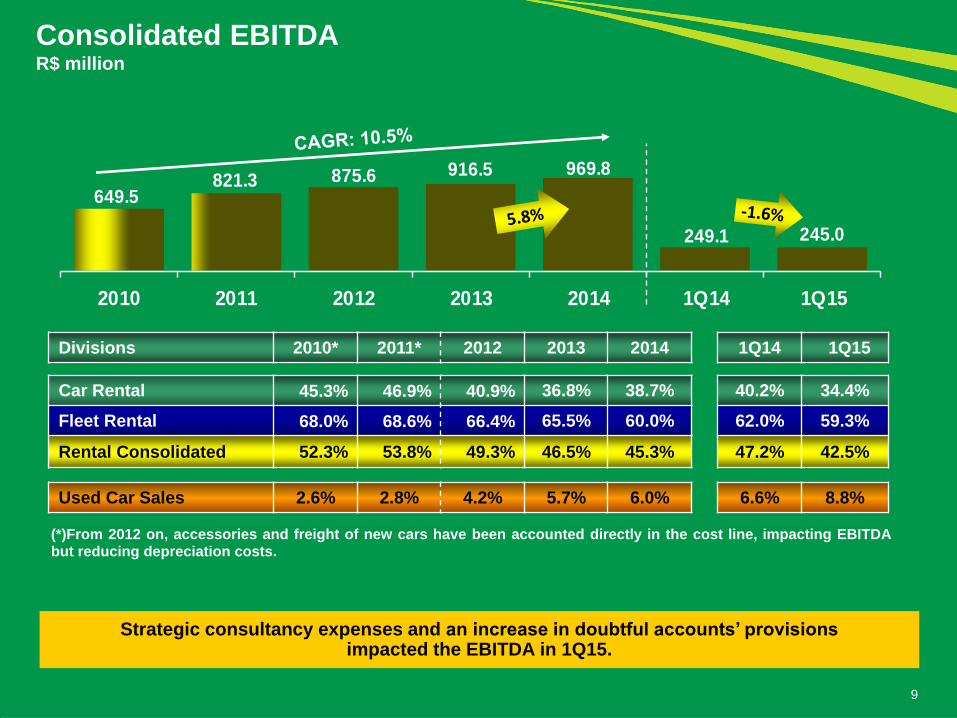
Consolidated EBITDA R$ million
Strategic consultancy expenses and an increase in doubtful accounts’ provisions impacted the EBITDA in 1Q15.
649.5821.3 875.6 916.5 969.8
249.1 245.0
2010 2011 2012 2013 2014 1Q14 1Q15
(*)From 2012 on, accessories and freight of new cars have been accounted directly in the cost line, impacting EBITDA
but reducing depreciation costs.
Divisions 2010* 2011* 2012 2013 2014 1Q14 1Q15
Car Rental 45.3% 46.9% 40.9% 36.8% 38.7% 40.2% 34.4%
Fleet Rental 68.0% 68.6% 66.4% 65.5% 60.0% 62.0% 59.3%
Rental Consolidated 52.3% 53.8% 49.3% 46.5% 45.3% 47.2% 42.5%
Used Car Sales 2.6% 2.8% 4.2% 5.7% 6.0% 6.6% 8.8%
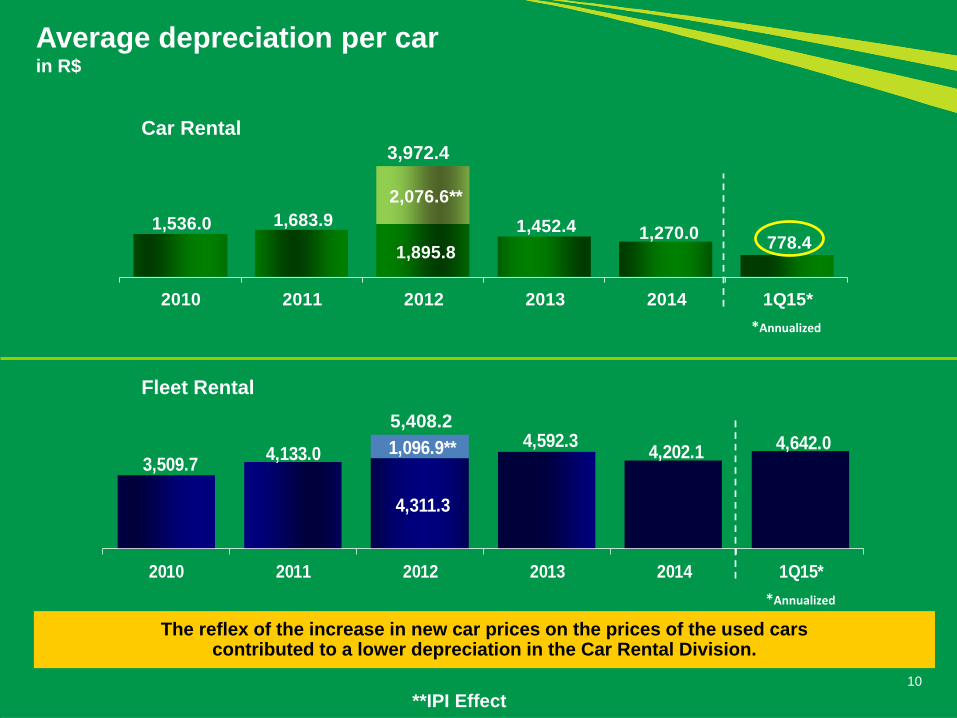
**IPI Effect
3,509.7 4,133.0
4,311.3
4,592.3 4,202.1
4,642.0 1,096.9**
2010 2011 2012 2013 2014 1Q15*
1,536.0 1,683.9
1,895.8
1,452.4 1,270.0 778.4
2,076.6**
2010 2011 2012 2013 2014 1Q15*
10
Average depreciation per car in R$
3,972.4
5,408.2
Car Rental
Fleet Rental
*Annualized
*Annualized
The reflex of the increase in new car prices on the prices of the used cars contributed to a lower depreciation in the Car Rental Division.
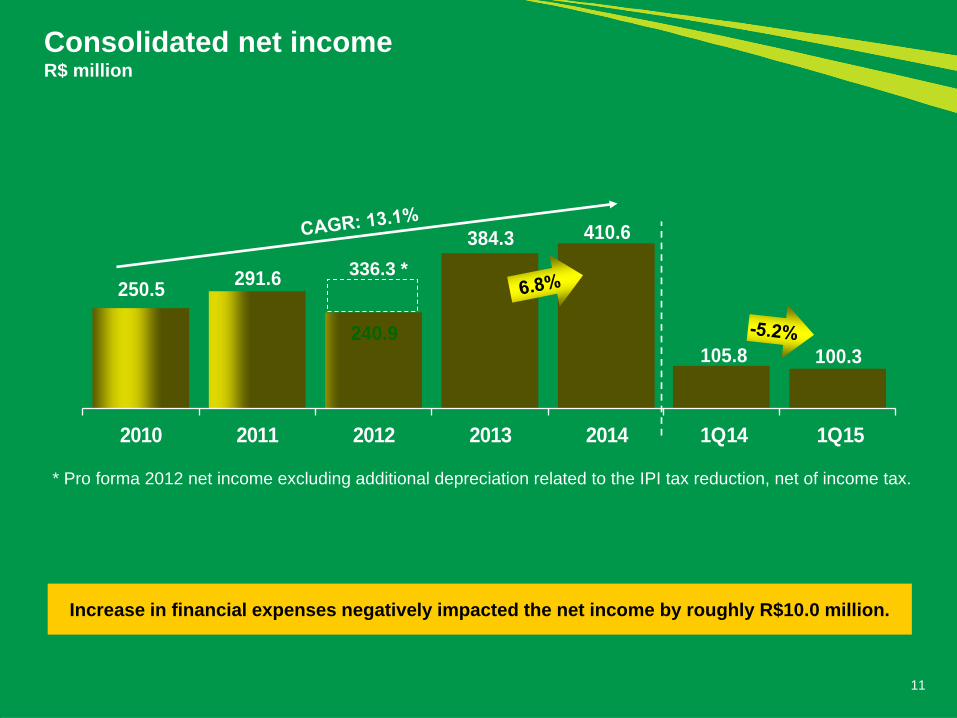
250.5291.6
240.9
384.3 410.6
105.8 100.3
2010 2011 2012 2013 2014 1Q14 1Q15
11
Consolidated net income R$ million
* Pro forma 2012 net income excluding additional depreciation related to the IPI tax reduction, net of income tax.
336.3 *
Increase in financial expenses negatively impacted the net income by roughly R$10.0 million.
12
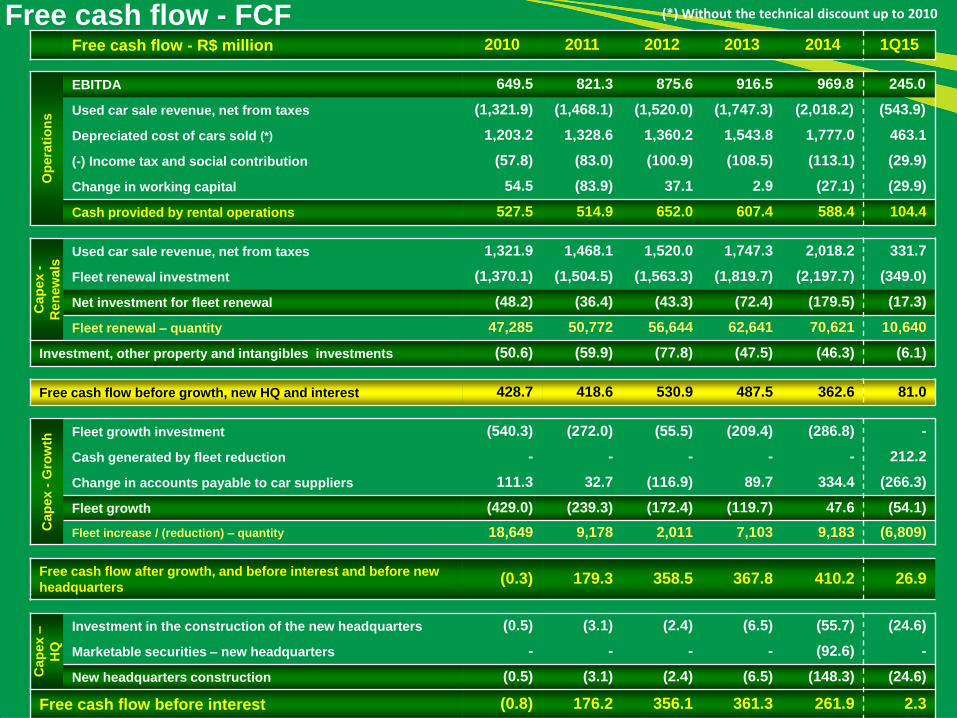
Free cash flow - FCF (*) Without the technical discount up to 2010
Free cash flow - R$ million 2010 2011 2012 2013 2014 1Q15 O
pe
rati
on
s
EBITDA 649.5 821.3 875.6 916.5 969.8 245.0
Used car sale revenue, net from taxes (1,321.9) (1,468.1) (1,520.0) (1,747.3) (2,018.2) (543.9)
Depreciated cost of cars sold (*) 1,203.2 1,328.6 1,360.2 1,543.8 1,777.0 463.1
(-) Income tax and social contribution (57.8) (83.0) (100.9) (108.5) (113.1) (29.9)
Change in working capital 54.5 (83.9) 37.1 2.9 (27.1) (29.9)
Cash provided by rental operations 527.5 514.9 652.0 607.4 588.4 104.4
Ca
pe
x -
Re
new
als
Used car sale revenue, net from taxes 1,321.9 1,468.1 1,520.0 1,747.3 2,018.2 331.7
Fleet renewal investment (1,370.1) (1,504.5) (1,563.3) (1,819.7) (2,197.7) (349.0)
Net investment for fleet renewal (48.2) (36.4) (43.3) (72.4) (179.5) (17.3)
Fleet renewal – quantity 47,285 50,772 56,644 62,641 70,621 10,640
Investment, other property and intangibles investments (50.6) (59.9) (77.8) (47.5) (46.3) (6.1)
Free cash flow before growth, new HQ and interest 428.7 418.6 530.9 487.5 362.6 81.0
Ca
pe
x -
Gro
wth
Fleet growth investment (540.3) (272.0) (55.5) (209.4) (286.8) -
Cash generated by fleet reduction - - - - - 212.2
Change in accounts payable to car suppliers 111.3 32.7 (116.9) 89.7 334.4 (266.3)
Fleet growth (429.0) (239.3) (172.4) (119.7) 47.6 (54.1)
Fleet increase / (reduction) – quantity 18,649 9,178 2,011 7,103 9,183 (6,809)
Free cash flow after growth, and before interest and before new
headquarters (0.3) 179.3 358.5 367.8 410.2 26.9
Ca
pe
x –
HQ
Investment in the construction of the new headquarters (0.5) (3.1) (2.4) (6.5) (55.7) (24.6)
Marketable securities – new headquarters - - - - (92.6) -
New headquarters construction (0.5) (3.1) (2.4) (6.5) (148.3) (24.6)
Free cash flow before interest (0.8) 176.2 356.1 361.3 261.9 2.3
13
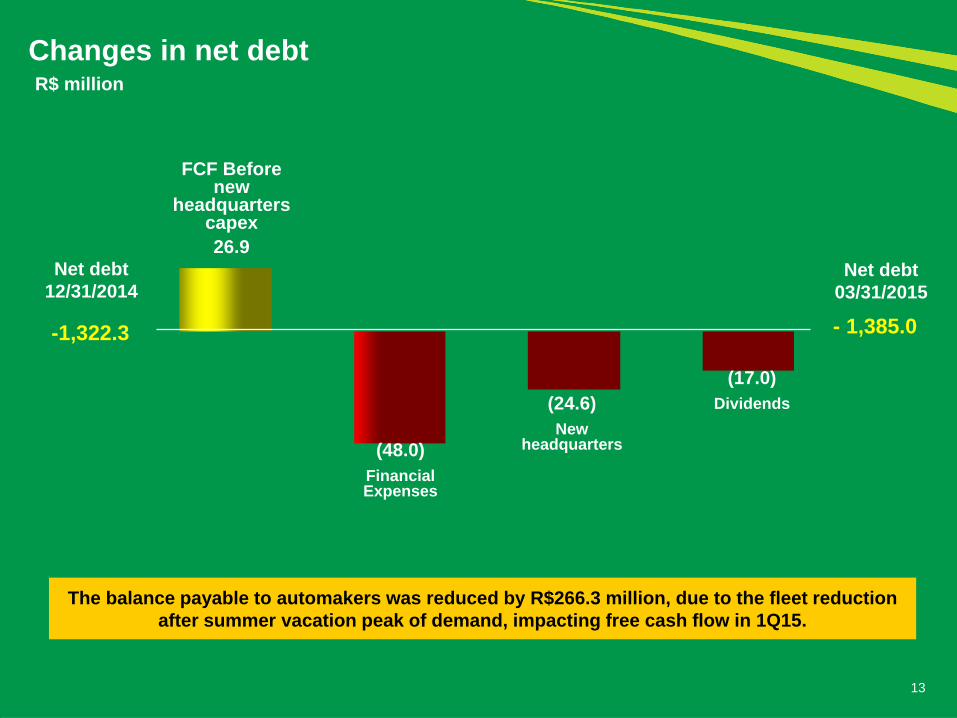
- 1,385.0
(48.0)
Financial Expenses
Net debt
03/31/2015
FCF Before new
headquarters capex
26.9
-1,322.3
Net debt
12/31/2014
(17.0)
Dividends (24.6)
New headquarters
Changes in net debt R$ million
The balance payable to automakers was reduced by R$266.3 million, due to the fleet reduction
after summer vacation peak of demand, impacting free cash flow in 1Q15.
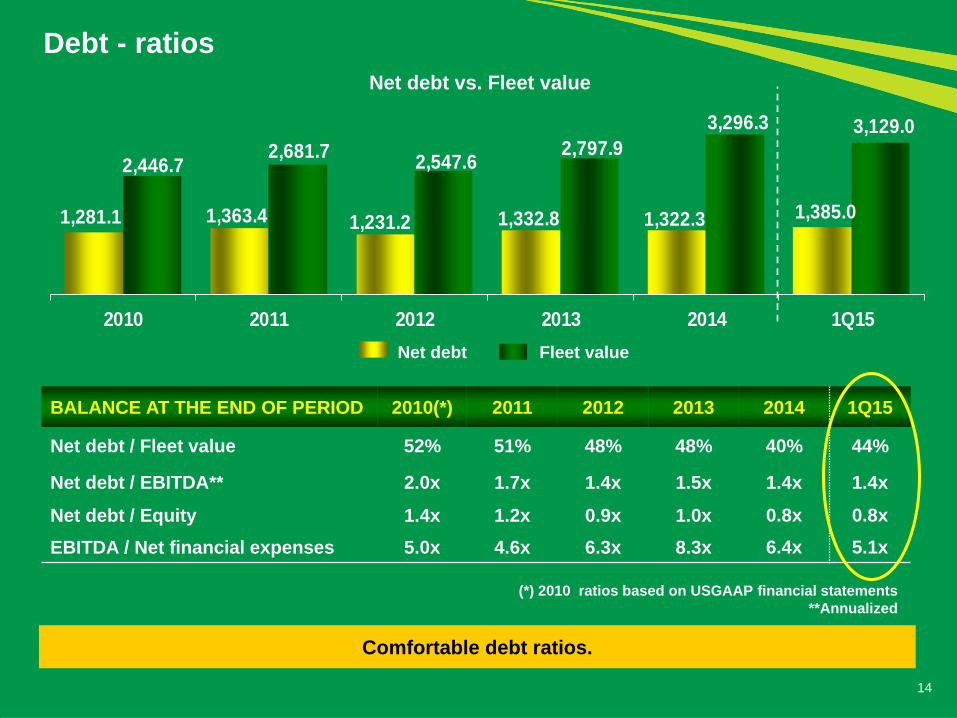
1,281.1 1,363.4 1,231.2 1,332.8 1,322.3 1,385.0
2,446.7 2,681.7
2,547.6 2,797.9
3,296.3 3,129.0
2010 2011 2012 2013 2014 1Q15
14
Debt - ratios
Net debt vs. Fleet value
BALANCE AT THE END OF PERIOD 2010(*) 2011 2012 2013 2014 1Q15
Net debt / Fleet value 52% 51% 48% 48% 40% 44%
Net debt / EBITDA** 2.0x 1.7x 1.4x 1.5x 1.4x 1.4x
Net debt / Equity 1.4x 1.2x 0.9x 1.0x 0.8x 0.8x
EBITDA / Net financial expenses 5.0x 4.6x 6.3x 8.3x 6.4x 5.1x
(*) 2010 ratios based on USGAAP financial statements
**Annualized
Net debt Fleet value
Comfortable debt ratios.

227.9
600.7 518.3
221.0
544.5 445.0
147.5
2015 2016 2017 2018 2019 2020 2021
15
Debt maturity profile (principal) R$ million
The new issuance and prepayment in 2Q15, aim at increasing the Company’s debt duration.
Cash
1,373.2
1,346.9 As of March 31, 2015
After the initiatives to improve debt maturity profile
203.9 302.7
397.3 221.0
594.5 595.0 447.5
1,429.2
2015 2016 2017 2018 2019 2020 2021
Cash
903.9

7.3%8.6%
6.3% 6.0%8.0% 8.7%
16.9% 17.1% 16.1% 16.5% 17.5% 16.8%
2010 2011 2012 2013 2014 1Q15*
16
ROIC versus cost of debt after taxes
9.6p.p. 8.5p.p. 9.5p.p. 9.8p.p.
ROIC and spread remained at a healthy level.
ROIC Cost of debt after taxes
10.5p.p. 8.1p.p.
*Annualized
Thank You!
The material presented is a presentation of general background information about LOCALIZA as of the date of the presentation. It is information in summary
form and does not purport to be complete. It is not intended to be relied upon as advice to potential investors. No representation or warranty, express or
implied, is made concerning, and no reliance should be placed on, the accuracy, fairness, or completeness of the information presented herein.
This presentation contains statements that are forward-looking within the meaning of Section 27A of the Securities Act of 1933 and Section 21E of the
Securities Exchange Act of 1934. Such forward-looking statements are only projections and are not guarantees of future performance. Investors are cautioned
that any such forward-looking statements are and will be, as the case may be, subject to many risks, uncertainties and factors relating to the operations and
business environments of LOCALIZA and its subsidiaries that may cause the actual results of the companies to be materially different from any future results
expressed or implied in such forward-looking statements.
Although LOCALIZA believes that the expectations and assumptions reflected in the forward-looking statements are reasonable based on information
currently available to LOCALIZA’s management, LOCALIZA cannot guarantee future results or events. LOCALIZA expressly disclaims a duty to update any of
the forward-looking statement.
Securities may not be offered or sold in the United States unless they are registered or exempt from registration under the Securities Act of 1933.
This presentation does not constitute an offer, invitation or solicitation of an offer to subscribe to or purchase any securities. Neither this presentation nor anything
contained herein shall form the basis of any contract or commitment whatsoever.
www.localiza.com/ri
Email: [email protected]
Tel: 55 31 3247-7024
Disclaimer