web.cbio.uct.ac.zaweb.cbio.uct.ac.za/.../downloads/computationaltools/re… · web viewonce the...
TRANSCRIPT
SelectionMap: a tool for detection and visualisation of natural patterns within codon alignments
I. DescriptionSelectionMap is a free Windows computer program designed to detect and graphically
illustrate the types and degree of natural selection acting along gene alignment(s). In
addition the program allows comparison of natural selection patterns between two or three
gene alignments of related virus species. The program can either take as input codon
alignment(s) in FASTA format for detection of selection and plotting of the selection map, or
it can take as input the FUBAR (Murrell et al. 2013) and/or MEME (Murrell et al. 2012) output
files in CSV format containing selection data and the corresponding codon alignments in
FASTA format to plot the map.
The program detects selection using the FUBAR method implemented in HYPHY (Pond et
al. 2005) and then produces a selection map in which every codon site is represented by a
vertical bar whose colour indicates the type selection and height indicates the degree of
selection detected at that sites. In general, when gene alignments of related species are
loaded, the produced figure shows sites that are evolving (1) under negative selection for the
same amino acid, (2) negative selection for different amino acids, (3) sites under negative
selection in only one species, (4) sites under positive selection, and (5) sites under episodic
positive selection.
II. Download and installationThe program can be downloaded from http://web.cbio.uct.ac.za/~brejnev/downloads/ComputationalTools/
1. Extract the SelectionMap-v1.0.zip file into a temporary folder.
2. In the temporary folder double-click on the file “SETUP.EXE and follow the instructions of
the setup program. NB. Please use the default installation directory “C:\ SelectionMap-v1.0” for installation.
3. The installation directory will contain the following:
SelectionMap-v1.0.exe: the main program executable file.
smap.ini, SelectionMap-v1.0.exe.manifest and ST6UNST.LOG: program
configuration files.
HyPhy-CLI2.2.6.exe: the HyPhy Command Line version 2.2.6 installation file.
README_SMap-v1.0.pdf: SelectionMap user guide.
A bin directory: which contains sequence alignment programs
(muscle3.8.31_i86win32.exe; Edgar 2004) and programs producing phylogenetic
trees (FastTree.exe; Price et al. 2010 and PhyML3.0_win32.exe; Guindon et al.
2010).
A test_data directory: which contains nine files to be used to test the program
once installation is completed (three codon alignments in FASTA format, and
three FUBAR and three MEME output files in CSV format contain selection data).
4. Inside the installation folder, run the “HyPhy-CLI2.2.6.exe” file to install HYPHY. After
HyPhy is installed successfully then SelectionMap will be able to run.
III. Uninstalling the programTo uninstall the program go to control panel and remove SelectionMap-v1.0. Go on C:\
check whether the C:\SelectionMap-v1.0 was removed, if not remove it manually.
IV. Running the program1. Starting the programTo plot a selection map you simply have to double-click on the SelectionMap-v1.0.exe file. When the program has launched you can either choose to load codon alignment(s)
and detect selection with FUBAR before plotting the selection map, or load FUBAR
and/or MEME CSV output file(s) and their corresponding codon alignment(s) and then
plot the map. The Start-up screen (Fig 1.) displays these two options of loading the input
files.

Fig 1. Start-up screen
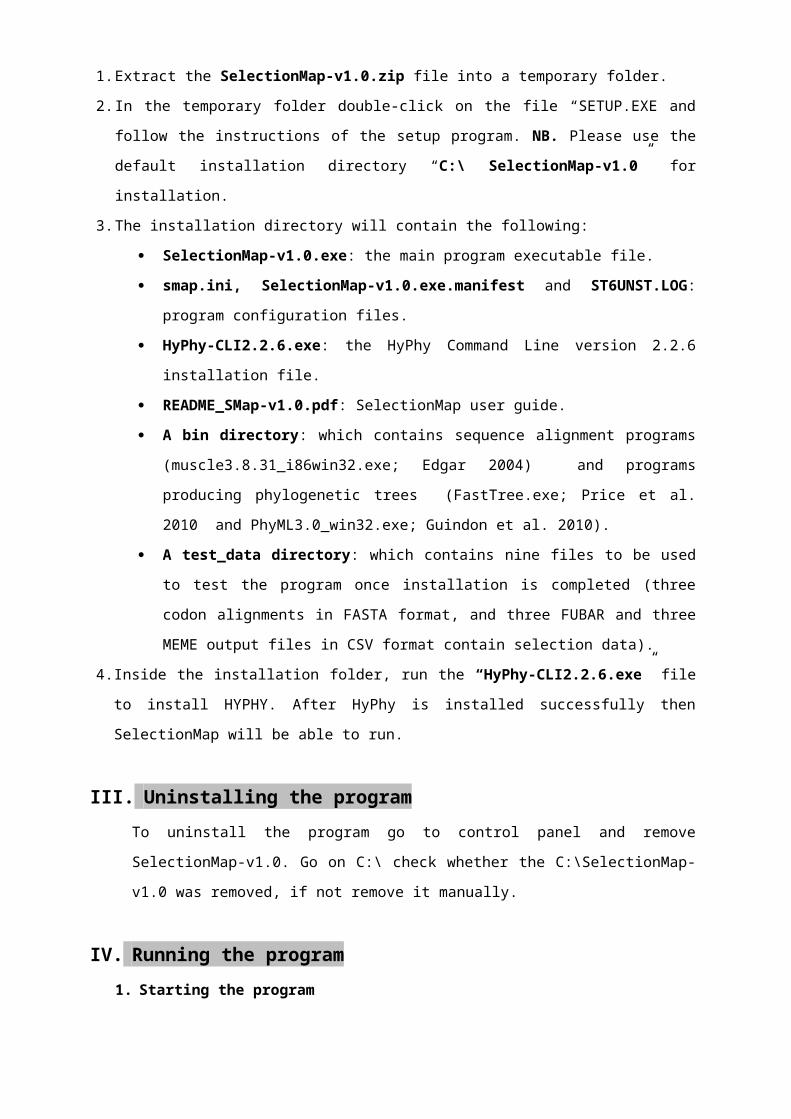
2. Option 1: Loading the input codon alignment(s)Once the user clicks the “Load codon alignment(s) in FASTA format” the “Loading codon
alignment(s) screen” (Fig 2.) will appear. To load the input the user can either click on the
frame in the middle or drag-and-drop the codon alignment file(s) to the frame. Once the
alignments are loaded, the user can click on the command button to “detect selection”.
NB: only codon alignment can be loaded, and these should contain neither stop codon nor
incomplete codons (i.e. codon containing one or two gaps).
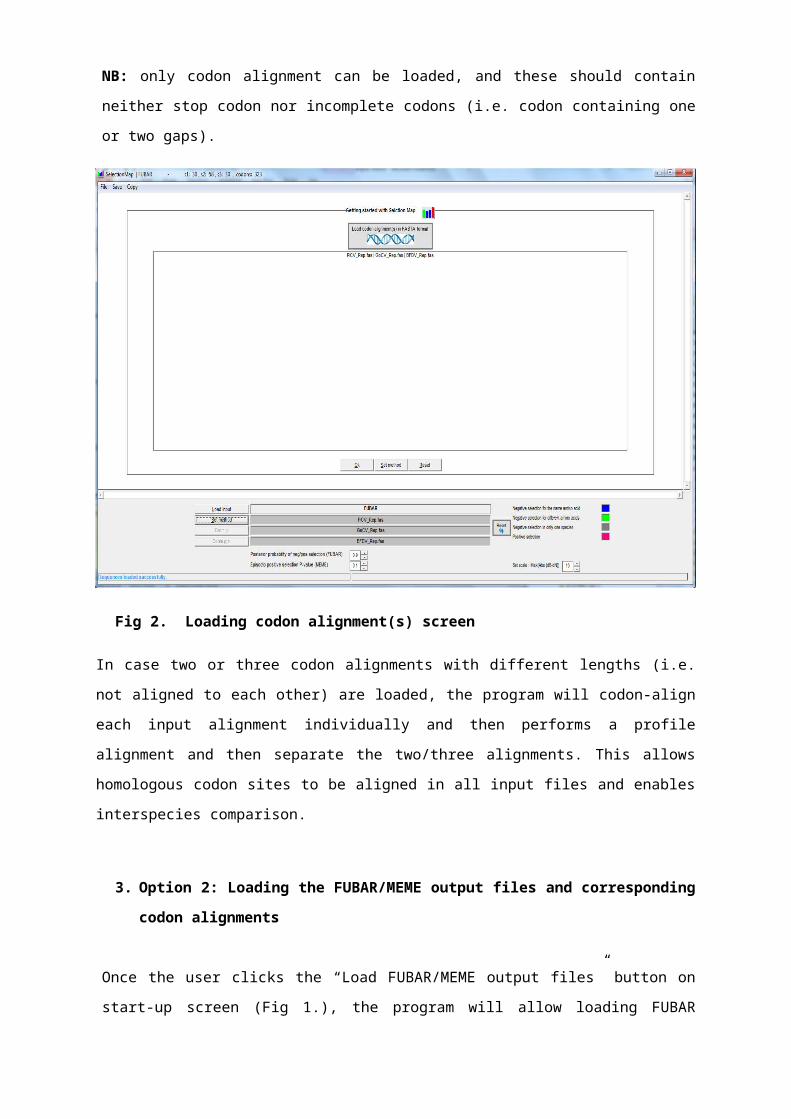
Fig 2. Loading codon alignment(s) screen
In case two or three codon alignments with different lengths (i.e. not aligned to each other)
are loaded, the program will codon-align each input alignment individually and then performs
a profile alignment and then separate the two/three alignments. This allows homologous
codon sites to be aligned in all input files and enables interspecies comparison.
3. Option 2: Loading the FUBAR/MEME output files and corresponding codon alignments
Once the user clicks the “Load FUBAR/MEME output files” button on start-up screen (Fig
1.), the program will allow loading FUBAR and/or MEME csv output files. If the method of
selection is set to “FUBAR”, the “FUBAR input screen” (Fig 3.) will appear to allow loading
of the FUBAR CSV output file(s) and their corresponding codon alignment(s). If the method
is set to “MEME”, the “MEME input screen” (Fig 4.) will be displayed to allow loading of the
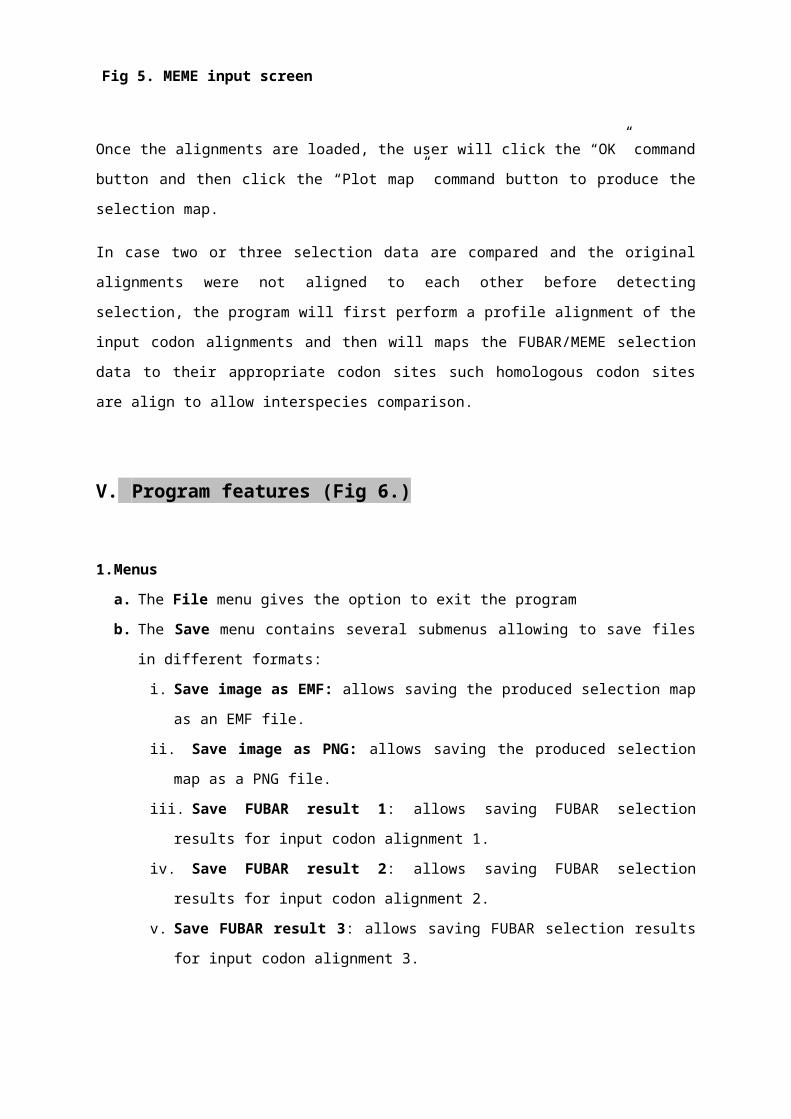
MEME CSV output file(s). If the method is set to “FUBAR+MEME”, the “FUBAR+MEME
input screen” (Fig 5.) will appear to allow loading of both FUBAR and MEME CSV output
file(s). Use the “Set method” command button to switch between these selection detection
options.
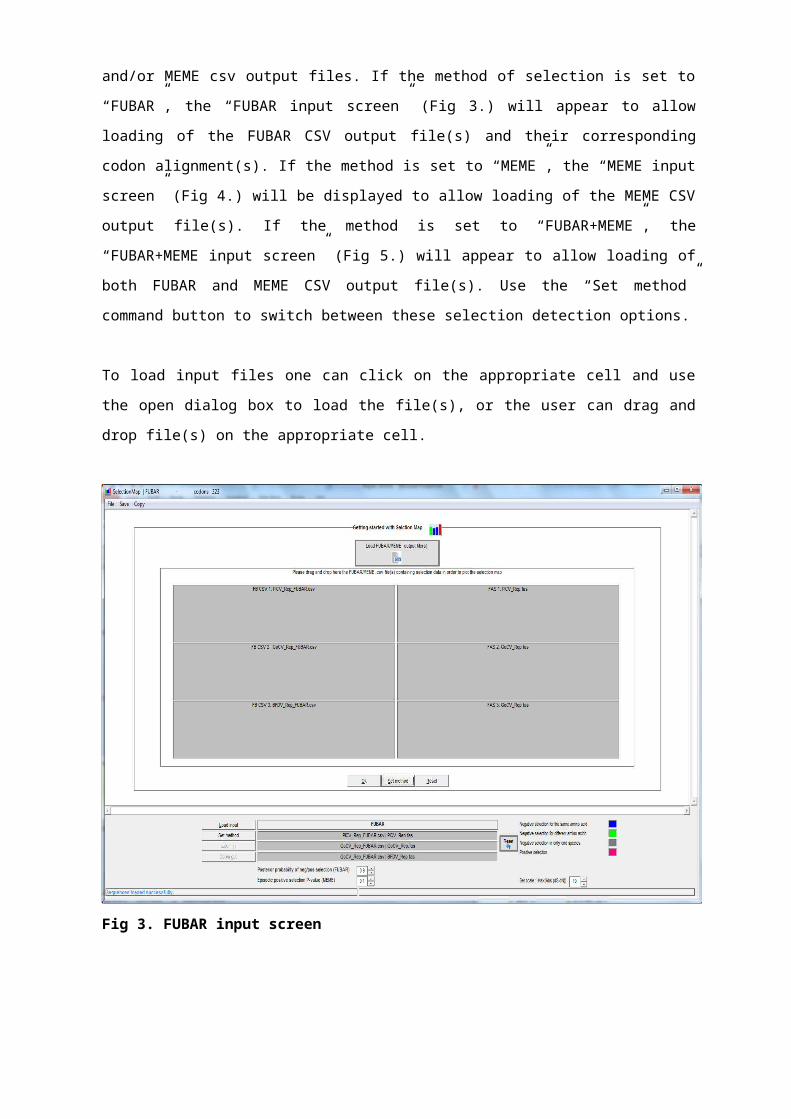
To load input files one can click on the appropriate cell and use the open dialog box to load
the file(s), or the user can drag and drop file(s) on the appropriate cell.
Fig 3. FUBAR input screen
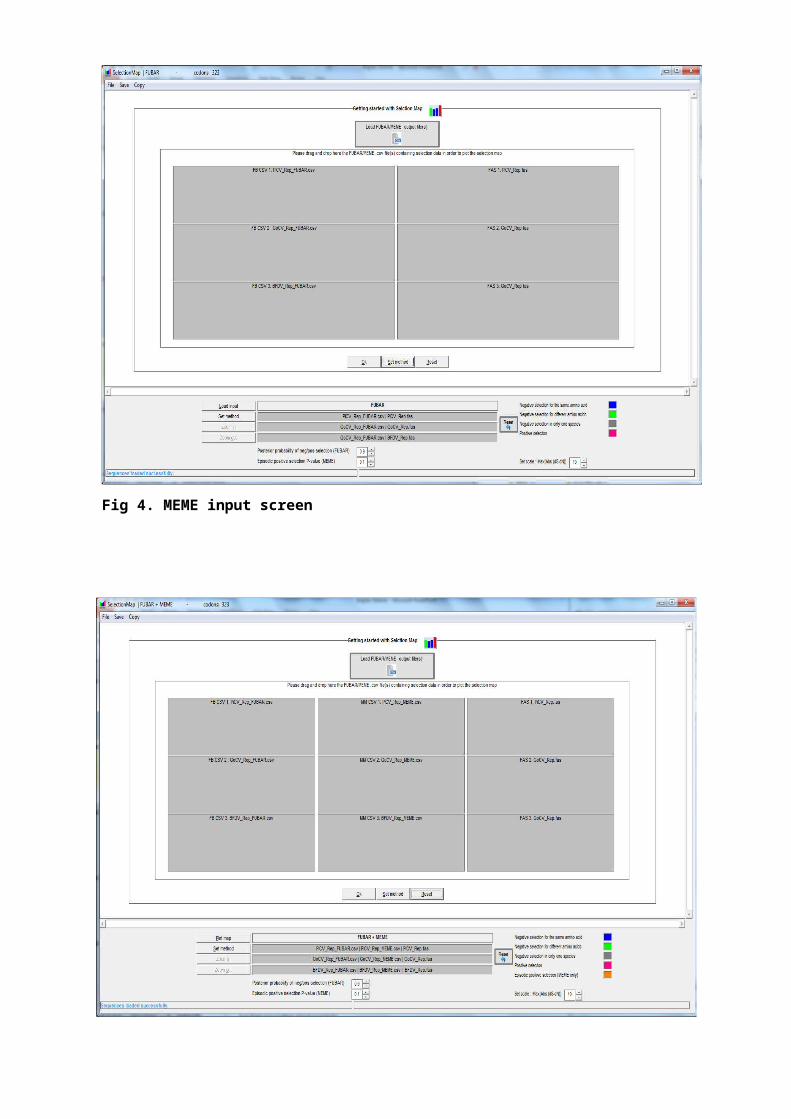
Fig 4. MEME input screen
Fig 5. MEME input screen
Once the alignments are loaded, the user will click the “OK” command button and then click
the “Plot map” command button to produce the selection map.
In case two or three selection data are compared and the original alignments were not
aligned to each other before detecting selection, the program will first perform a profile
alignment of the input codon alignments and then will maps the FUBAR/MEME selection
data to their appropriate codon sites such homologous codon sites are align to allow
interspecies comparison.
V. Program features (Fig 6.)
1. Menusa. The File menu gives the option to exit the program
b. The Save menu contains several submenus allowing to save files in different formats:
i. Save image as EMF: allows saving the produced selection map as an EMF file.
ii. Save image as PNG: allows saving the produced selection map as a PNG file.
iii. Save FUBAR result 1: allows saving FUBAR selection results for input codon
alignment 1.
iv. Save FUBAR result 2: allows saving FUBAR selection results for input codon
alignment 2.
v. Save FUBAR result 3: allows saving FUBAR selection results for input codon
alignment 3.
vi. Re-save codon align 1: allows re-saving the input codon alignment 1 after it
has been aligned to other input codon alignments.
vii. Re-save codon align 2: allows re-saving the input codon alignment 2 after it
has been aligned to other input codon alignments.
viii. Re-save codon align 3: allows re-saving the input codon alignment 3after it has
been aligned to other input codon alignment.
ix. Save translated align 1: allows saving the translated version of the input codon
alignment 1.
x. Save translated align 2: allows saving the translated version of the input codon
alignment 2.
xi. Save translated align 3: allows saving the translated version of the input codon
alignment 3.
xii. Save consensus AA sequence align 1: allows producing and saving the
consensus version amino-acid sequence for the input codon alignment 1.
xiii. Save consensus AA sequence align 2: allows producing and saving the
consensus version amino-acid sequence for the input codon alignment 2.
xiv. Save consensus AA sequence align 3: allows producing and saving the
consensus version amino-acid sequence for the input codon alignment 3.
c. The Copy menu allows copying and pasting the map, in either EMF or PNG format,
into another program such us MS PowerPoint or MS Word. An alternative option is to
write-click on the image and select copy.
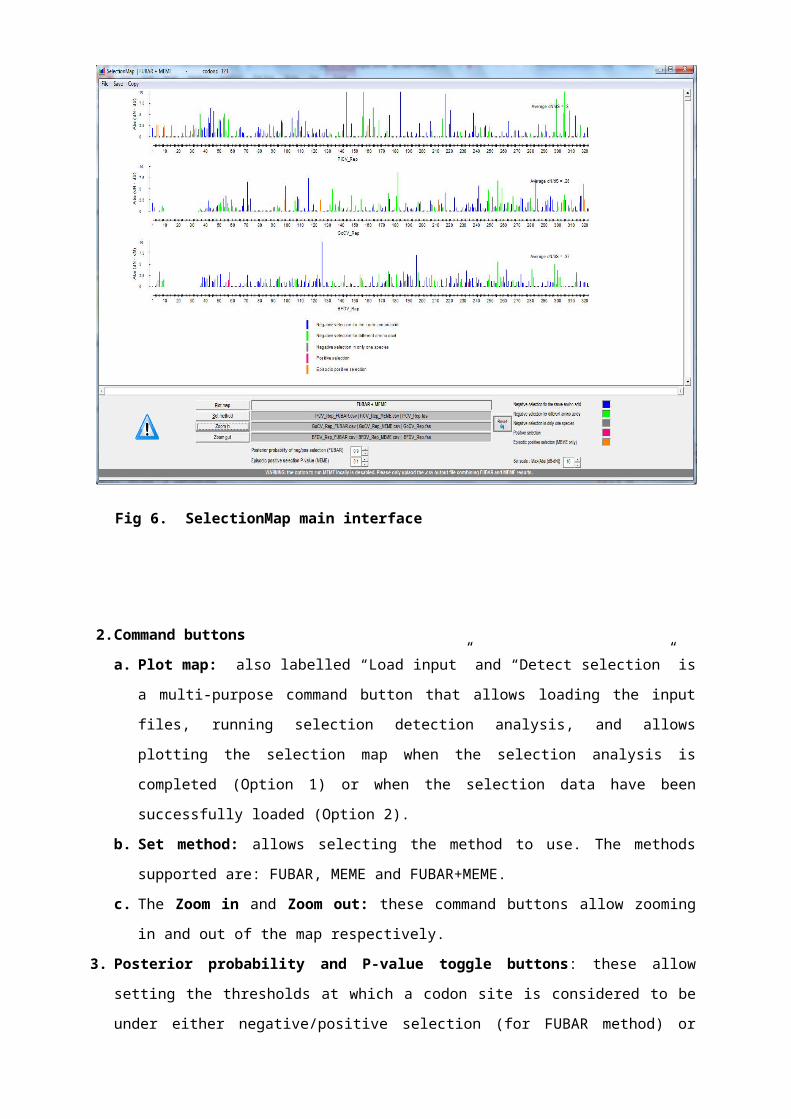
Fig 6. SelectionMap main interface
2. Command buttonsa. Plot map: also labelled “Load input” and “Detect selection” is a multi-purpose
command button that allows loading the input files, running selection detection
analysis, and allows plotting the selection map when the selection analysis is
completed (Option 1) or when the selection data have been successfully loaded
(Option 2).
b. Set method: allows selecting the method to use. The methods supported are:
FUBAR, MEME and FUBAR+MEME.
c. The Zoom in and Zoom out: these command buttons allow zooming in and out of the
map respectively.
3. Posterior probability and P-value toggle buttons: these allow setting the thresholds at
which a codon site is considered to be under either negative/positive selection (for
FUBAR method) or episodic positive selection (for the MEME method). The default values
for the posterior probability (FUBAR method) and P-value (MEME method) are 0.9 and
0.1 respectively.
4. Set scale: Max(Abs(dN-dS)) toggle button: allows setting the maximum value of the
height of each selection map produced (y-axis).
5. Reset: this command button allows resetting the program, removing all loaded input files
and resetting all program variables.
6. Colour boxes: allow setting the colour for different of types of selection detected.
Please cite (Stenzel et al. 2014):
Stenzel, T. et al., 2014. Pigeon circoviruses display patterns of recombination, genomic
secondary structure and selection similar to those of Beak and feather disease viruses. The
Journal of general virology. Available at: http://www.ncbi.nlm.nih.gov/pubmed/24639400
[Accessed March 26, 2014]
VI.Referencesdgar, R.C., 2004. MUSCLE: multiple sequence alignment with high accuracy and high
throughput. Nucleic acids research, 32(5), pp.1792–7. Available at: http://www.pubmedcentral.nih.gov/articlerender.fcgi?artid=390337&tool=pmcentrez&rendertype=abstract [Accessed August 7, 2013].
Guindon, S. et al., 2010. New Algorithms and Methods to Estimate Maximum-Likelihood Phylogenies: Assessing the Performance of PhyML 3.0. Systematic Biology, 59(3), pp.307–321. Available at: http://sysbio.oxfordjournals.org/cgi/doi/10.1093/sysbio/syq010.
Murrell, B. et al., 2012. Detecting individual sites subject to episodic diversifying selection. PLoS genetics, 8(7), p.e1002764. Available at: http://www.pubmedcentral.nih.gov/articlerender.fcgi?artid=3395634&tool=pmcentrez&rendertype=abstract [Accessed December 18, 2013].
Murrell, B. et al., 2013. FUBAR: a fast, unconstrained bayesian approximation for inferring selection. Molecular biology and evolution, 30(5), pp.1196–205. Available at: http://www.ncbi.nlm.nih.gov/pubmed/23420840 [Accessed August 8, 2013].
Pond, S.L.K., Frost, S.D.W. & Muse, S. V, 2005. HyPhy: hypothesis testing using phylogenies. Bioinformatics (Oxford, England), 21(5), pp.676–9. Available at: http://www.ncbi.nlm.nih.gov/pubmed/15509596 [Accessed August 13, 2013].
Price, M.N., Dehal, P.S. & Arkin, A.P., 2010. FastTree 2--approximately maximum-likelihood trees for large alignments. PloS one, 5(3), p.e9490. Available at: http://www.ncbi.nlm.nih.gov/pubmed/20224823.
Stenzel, T. et al., 2014. Pigeon circoviruses display patterns of recombination, genomic secondary structure and selection similar to those of Beak and feather disease viruses. The Journal of general virology. Available at: http://www.ncbi.nlm.nih.gov/pubmed/24639400 [Accessed March 26, 2014].
Authors: 1Brejnev Muhire, 1Penelope Hartnady, 2Arvind Varsani and 1Darren Martin 1Institute of Infectious Diseases and Molecular Medicine, Computational Biology Group, University of
Cape Town, South Africa2School of Biological Sciences, University of Canterbury, Private Bag 4800, Christchurch, 8140, New Zealand
Bug reporting: [email protected] or [email protected]