weber state university - utah
TRANSCRIPT

WEBER STATE UNIVERSITYCENTRAL CHILLED WATER PLANTAND DISTRIBUTION SYSTEM STUDY
WEBER STATE UNIVERSITYDIVISION OF FACILITIES CONSTRUCTION MANAGEMENT
PROJECT No.
October, 2005
WHW ENGINEERING INC.1354 East 3300 South #200Salt Lake City, Utah 84106P 801.466.4021 – F [email protected]

TABLE OF CONTENTS
Section 1 – Executive Summary1.1 Executive Summary
Section 2 – History of Existing Chilled Water Plant2.1 Central Chiller Plant Description2.2 Existing Central Chiller Plant Flow Sheets2.3 Existing Campus Buildings Load Summary
Section 3 – Existing Central Chiller Plant Conditions3.1 Introduction3.2 Central Plant Load Requirements
A. Existing Building Connected LoadsB. Projected Summer 2006 LoadsC. Projected Future Loads
3.3 Chiller Plant Capacity Requirement SummaryA. Existing Central Chilled Water Plant CapacityB. New Required Central Chilled Water Plant Capacity
3.4 Conclusion
Section 4 – Chilled Water Campus Distribution System4.1 Introduction4.2 Campus Piping and Pumping Systems
A. Chilled Water Pipe Section SummaryB. Pipe SectionsC. Existing Campus Piping Distribution Map
4.3 Chilled Water Pumping System Summary
Section 5 – New Central Chilled Water Plant Options5.1 Introduction5.2 New Central Chilled Water Plant Chiller Combinations5.3 Chiller Combination Cost Comparison5.4 Plate and Frame Heat Exchanger (Free Cooling)5.5 Thermal/Ice Storage Option
Section 6 – Recommendations6.1 Recommended Central Plant Chiller Combination
A. Recommended Central Plant Chiller CombinationsB. Cooling Tower Addition
6.2 Recommended Campus Distribution System UpgradesA. Campus Piping System RecommendationsB. Campus Pumping System Recommendations
6.3 Plate and Frame Exchanger (Free Cooling)6.4 Refrigeration Safety
Section 7 – Cost Estimate7.1 Chiller Plant
A. Combination AB. Combination F
7.2 Plate & Frame Heat Exchanger Recommendation7.3 Campus Piping System for Future Connected Load7.4 New Campus Chilled Water System Summary
AppendicesA.1 Campus Map

A.2 ReferencesA.3 Potential New Chiller Computer Run Performance DataA.4 Plate and Frame Heat Exchanger InformationA.5 Thermal/Ice Storage InformationA.6 Chiller Combinations Life Cycle and Optimizer Computer Run / Economic
analysis – “Combo A, A-1” “Combo F, F-1”A.7 ASHRAE Recommended Equipment Service Life

WEBER STATE UNIVERSITY CENTRAL CHILLER PLANT STUDYWHW ENGINEERING INC. – 2005
1.1-1
SECTION 1 – EXECUTIVE SUMMARY
1.1 Executive Summary
A. This study focuses on the existing and proposed chilled water systems forWeber State University. This study will identify existing chilled waterdistribution conditions, new and existing cooling requirements, andprovide recommendations for the construction of a new central chilledwater plant. The study will provide recommendations for new upgrades tothe existing chilled water distribution systems. Capacities of existing andfuture buildings were taken from the Weber State University master plan.These capacities and totals can be found in Sections 2 and 3.
B. Weber State University originally began as Weber State Academy in1889. It was made a State Junior College in 1933. Weber State Collegewas updated to University status in 1991. Weber State University hassince experienced a steady growth of students and educational facilities.The University is comprised of Thirty Six (36) main on-campus buildings,and Ten (10) auxiliary buildings. Among these buildings, Twenty One(21) on-campus buildings are connected to the campus Central ChilledWater Plant. This study will focus on the cooling requirements of theexisting buildings, future planned campus buildings, and projected loadincreases. All discovered and known information will be summarized andthe findings incorporated into the design of a new Central Chilled WaterPlant.
C. The following are the main concerns, and recommendations for improvingthe Existing Chilled Water Distribution System and the construction of anew Future Central Chilled Water Plant:
1. The capacities of the existing three chillers and piping areadequate to handle the existing connected demand. See Section3.4. However, the existing campus pumping system has reachedits’ operating limits. Pumps must operate at full capacity to meetcurrent campus needs, without adequate back-up. If a primarypump is lost, the campus capacity is reduced by 50% of onechiller. This could be as much as 625 tons. If a secondary pumpis lost, the entire campus cooling capacity will be reduced by 50%.
2. The capacities of the existing three chillers, cooling tower andpiping are adequate for the combined existing load and theprojected summer 2006 load as long as all three chillers areoperating. See Section 3.4. Pumping system will be inadequate asit is currently operating. A higher chilled water Delta T needs to beused to compensate for the lack of pump capacity at future peakdemands.
3. The capacities of the existing three chillers, pumps, cooling towerand piping are not adequate for the combined existing connectedload, projected summer 2006 load and the future projected load.See Sections 3.3 and 3.4.

WEBER STATE UNIVERSITY CENTRAL CHILLER PLANT STUDYWHW ENGINEERING INC. – 2005
1.1-2
4. The new projected central chiller plant should be designed so thata back-up chiller or combination of chillers will always provide thecapacity to cover the connected load.
5. Two of the existing chillers are manufactured by The Trane Co,the third chiller by Carrier Corp. The Trane chillers are in goodcondition and should be relocated to the new proposed centralchiller plant. The Carrier chiller is beyond ASHRAE’Srecommended service life and should be removed from service.
6. The different chiller combinations that are evaluated for the newcentral chiller plant in Section 5.2 are as follows:
Combination A:
1) Chiller #1 – New 1500 Ton with VFD2) Chiller #2 – Existing 1250 Ton Trane Unit3) Chiller #3 – New 1500 Ton with optional VFD4) Chiller #4 – Existing 650 Ton Trane Unit
Combination B:
1) Chiller #1 – New 2000 ton with VFD2) Chiller #2 – Existing 1250 Ton Trane Unit3) Chiller #3 – New 1250 ton4) Chiller #4 – Existing 650 Ton Trane Unit
Combination C:
1) Chiller #1 – New 1500 ton with VFD2) Chiller #2 – Existing 1250 Ton Trane Unit3) Chiller #3 – New 1250 ton with optional VFD4) Chiller #4 – Existing 650 Ton Trane Unit
Combination D:
1) Chiller #1 – New 2000 ton with VFD2) Chiller #2 – Existing 1250 Ton Trane Unit3) Chiller #3 – New 1500 ton4) Chiller #4 – Existing 650 Ton Trane Unit
Combination E:
1) Chiller #1 – New 2000 ton with VFD2) Chiller #2 – Existing 1250 Ton Trane Unit3) Chiller #3 – New 1700 ton4) Chiller #4 – Existing 650 Ton Trane Unit
Combination F:
1) Chiller #1 – New 1700 ton with VFD

WEBER STATE UNIVERSITY CENTRAL CHILLER PLANT STUDYWHW ENGINEERING INC. – 2005
1.1-3
2) Chiller #2 – Existing 1250 Ton Trane Unit3) Chiller #3 – New 1700 ton with optional VFD4) Chiller #4 – Existing 650 Ton Trane Unit
7. Modify the campus chilled water loop as recommended inSection 4. This includes the following:a. Incorporate a primary chilled water circulation loop for each
chiller.b. Provide a secondary loop with new pumps and variable
frequency drives. Incorporate the campus loop pipesection modifications as part of the secondary loop.
c. Provide a separate “decoupled” chilled water loop for theskybox and its’ associated loads. Provide a plate andframe heat exchanger and associated pumps andspecialties in the old chiller plant room to serve this loop.
8. Provide a new plate and frame heat exchanger to provide freecooling by utilizing condenser water from the cooling tower withoutactivating the chillers.
9. Provide all new chilled and condenser water pumps with stand bypumps for the chilled water and condenser water systems.
10. Provide an automated control system to match a sequence ofcontrol approved by WSU. An example of a sequence is asfollows:a. The first stage of cooling when the outdoor temperature is
below 60 degrees F, shall be provided by the “FreeCooling” ie. plate and frame exchanger and the coolingtower. This stage of cooling shall be provided until thereturn water temperature can no longer be maintained. Atthis point, the “Free Cooling” shall be terminated and thelead chiller shall start.
b. The lead chiller shall start and maintain operation until thereturn water temperature continues to rise at which time areturn water temperature controller (adjustable) will startthe other chillers depending on the combinationrecommended or approved by WSU.
11. The existing five cell cooling tower is not large enough to handlethe combination of the existing connected load, the projectedsummer 2006 load, and the future projected load.
12. Provide a refrigerant detection, evacuation and personnel safetysystem. See Section 6.4.
13. Design engineers shall use WSU and DFCM standards toArchitects and Engineers defining design criteria, equipmentapproval, etc. for the new central chiller plant.
14. The new chilled water distribution system and condenser watersystem within the new central chiller plant should be balanced byan independent testing and balancing agency after the newsystems are installed.

WEBER STATE UNIVERSITY CENTRAL CHILLER PLANT STUDYWHW ENGINEERING INC. – 2005
1.1-4
15. Based on Sections 3 and 5, we recommend for the new centralchilled water plant one of the following chiller combinations withthe associated equipment listed below:
a. Combination A
1) Chiller #1 – New 1500 ton with VFD2) Chiller #2 – Existing 1250 Ton3) Chiller #3 – New 1500 ton with optional VFD4) Chiller #4 – Existing 650 Ton
b. Combination F
1) Chiller #1 – New 1700 ton with VFD2) Chiller #2 – Existing 1250 Ton3) Chiller #3 – New 1700 ton with optional VFD4) Chiller #4 – Existing 650 Ton
c. Central Air Eliminator – Remove all existing building aireliminators.
d. Central expansion tanks – Remove all existing buildingexpansion tanks.
e. Four inline mounted, constant volume chilled water primaryloop circulating pumps for the chillers.
f. Three main campus base mounted secondary distributionpumps with variable frequency drives.
g. Three main condenser water pumps with variablefrequency drives.
h. Plate and frame heat exchanger for free cooling with anautomatic change over to mechanical cooling.
i. Cell addition to the existing cooling tower.j. Automation System.k. Re-using the existing 24 inch condenser water piping as
the new chilled water piping distribution system. SeeExisting Campus Distribution Map Section 4.2 C.
D. The recommendations included in this report are based off of the WSUmaster plan information dated September 2005. Because manyassumptions have been made concerning future buildings, i.e. futureloads, locations, etc., and because of future individual building designchanges, this report shall only be used as a guide and not a finisheddesign for future buildings. WHW Engineering, Inc. assumes no designliability for future modifications to the existing campus plan. Equipmentsizing, pipe sizing, loop modifications, field verification of existingconditions, and all other associated recommendations are theresponsibility of the future design teams to verify, calculate, and design atthe time of the associated future projects.
WEBER STATE UNIVERSITY CENTRAL CHILLER PLANT STUDYWHW ENGINEERING INC. – 2005
2.1-1
SECTION 2 – HISTORY OF EXISTING CHILLED WATER SYSTEM
2.1 Central Chiller Plant Description
A. Plant Use and Identification
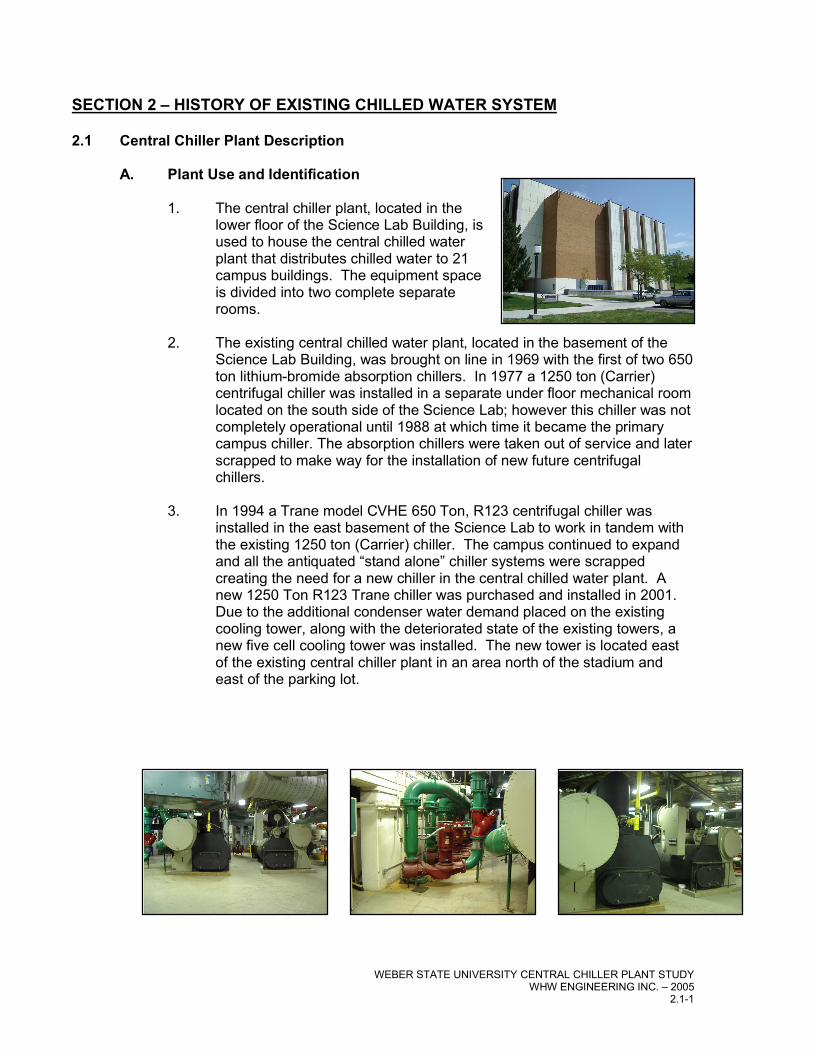
1. The central chiller plant, located in thelower floor of the Science Lab Building, isused to house the central chilled waterplant that distributes chilled water to 21campus buildings. The equipment spaceis divided into two complete separaterooms.
2. The existing central chilled water plant, located in the basement of theScience Lab Building, was brought on line in 1969 with the first of two 650ton lithium-bromide absorption chillers. In 1977 a 1250 ton (Carrier)centrifugal chiller was installed in a separate under floor mechanical roomlocated on the south side of the Science Lab; however this chiller was notcompletely operational until 1988 at which time it became the primarycampus chiller. The absorption chillers were taken out of service and laterscrapped to make way for the installation of new future centrifugalchillers.
3. In 1994 a Trane model CVHE 650 Ton, R123 centrifugal chiller wasinstalled in the east basement of the Science Lab to work in tandem withthe existing 1250 ton (Carrier) chiller. The campus continued to expandand all the antiquated “stand alone” chiller systems were scrappedcreating the need for a new chiller in the central chilled water plant. Anew 1250 Ton R123 Trane chiller was purchased and installed in 2001.Due to the additional condenser water demand placed on the existingcooling tower, along with the deteriorated state of the existing towers, anew five cell cooling tower was installed. The new tower is located eastof the existing central chiller plant in an area north of the stadium andeast of the parking lot.

WEBER STATE UNIVERSITY CENTRAL CHILLER PLANT STUDYWHW ENGINEERING INC. – 2005
2.1-2
B. Cooling Equipment – Northeast Chiller Room
1. The equipment installed in the Northeast chiller room consists of thefollowing:
Item 1: East side Chiller CH-2 – Trane Model CVHF-128,1250 Ton, R-123 Refrigerant.
Item 2: West side Chiller CH-1 – Trane model CVHE 8890-123, 650 Ton, R-123 Refrigerant.
Item 3: Expansion Tank – None
Item 4: Air Eliminator – None
Item 5: Chilled Water Pump P-11; Vertical Inline – Armstrong8x8x10; 1300 GPM @ 44 ft. Hd., 20 HP, 230/460 Volts,1800 rpm.
Item 6: Chilled Water Pump P-12; Vertical Inline – Armstrong8x8x10; 1300 GPM @ 44 ft. Hd., 20 HP, 230/460 Volts;1800 rpm.
Item 7: Chilled Water Pump P-13; Vertical Inline – Armstrong8x8x10; 1300 GPM @ 44 ft. Hd., 20 HP, 230/460 Volts;1800 rpm.
Item 8: Chilled Water Pump P-14; Vertical Inline – Armstrong8x8x10; 1300 GPM @ 44 ft. Hd., 20 HP, 230/460 Volts;1800 rpm.
Item 9: Condenser Water Pump. P-7 – Armstrong Vertical Inline8x8x11.5, 1950 GPM @ 89 ft. Hd.; 60 HP; 230/460 Volts;1770 rpm.
Item 10: Condenser Water Pump. P-8 – Armstrong Vertical Inline8x8x11.5, 1950 GPM @ 89 ft. Hd.; 60 HP; 230/460 Volts;1770 rpm.
Item 11: Condenser Water Pump. P-9 – Armstrong Vertical Inline8x8x11.5, 1950 GPM @ 89 ft. Hd.; 60 HP; 230/460 Volts;1770 rpm.
Item 12: Condenser Water Pump. P-10 – Armstrong Vertical Inline8x8x11.5, 1950 GPM @ 89 ft. Hd.; 60 HP; 230/460 Volts;1770 rpm.

WEBER STATE UNIVERSITY CENTRAL CHILLER PLANT STUDYWHW ENGINEERING INC. – 2005
2.1-3
C. Cooling Equipment – Southwest Chiller Room
1. The equipment installed in the Southwest chiller room consistsof the following:
Item 1: Chiller CH-3 – Carrier model 19FA, 1250 Tons–R-500Refrigerant.
Item 2: Chilled Water Pump P-1 – Bell & Gossett, Model VSCS,3000 GPM @ 120 ft. Hd., 125 HP, 460 Volt., 3 phase.
Item 3: Chilled Water Pump P-2 – Bell & Gossett, Model VSCS;3000 GPM @ 120 ft. Hd., 125 HP, 460 Volt., 3 phase.
Item 4: Chilled Water Pump P-3 – Bell & Gossett, Model VSCS,2733 GPM @ 45 ft. Hd., 60 HP, 230/460 Volt., 3 phase.
Item 5: Chilled Water Pump P-4 – Bell & Gossett, Model VSCS,2108 GPM @ 75 ft. Hd., 60 HP, 230/460 Volts.
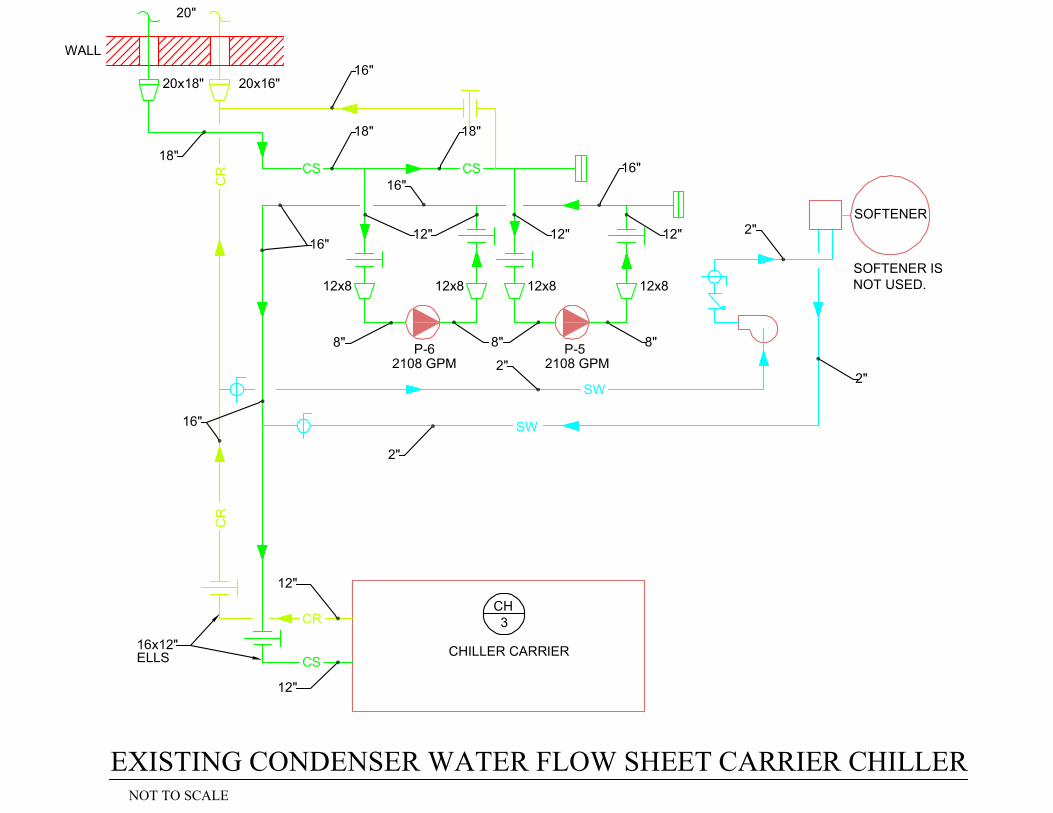
Item 6: Condenser Water Pump P-5 – Bell & Gossett VSCS, 2108GPM, 75 ft. Hd., 60 HP, 230/460 Volt., 3 phase.
Item 7: Condenser Water Pump P-6 – Bell & Gossett VSCS, 2108GPM, 75 ft. Hd., 60 HP, 230/460 Volt. 3 phase.
Item 8: Expansion Tank: Amtrol 1988, Vertical, size 1200-L; Model116557, 12 PSI; two provided.
Item 9: VFD Drives for chilled water pumps, P-1 and P-2.

CHILLER CARRIER
CWS CWR
CHILLER TRANE
CHILLER TRANE
MANHOLE
CW
S
CWS
CWS
CW
S
CW
R
CW
R
CW
S
CW
S
CW
S
CW
S
CWS
CWRCWR
CWS
CWS
CW
S
CW
S
CWS
CWR CWR
CWS
CWSTO CAMPUS
TO CAMPUS
FROM CAMPUS
20"
20"
P-1 VFD P-2 VFD P-3 P-4
CH3
TO STADIUM
CWR
TO LIND LECTURE HALL
CH2
CH1
P-11
P-12
P-13
P-14
2.2 EXISTING
CEN
TRA
L CH
ILLER PLA
NT FLO
W SH
EETS
1250 TONS
650 TONS
1300 GPM
1300 GPM
1300 GPM
1300 GPM
1250 TONS
3000 GPM 3000 GPM 2733 GPM 2108 GPM
OVERALL CHILLED WATER PIPING FLOW SHEETNOT TO SCALE
10"

TRANE
WALL
CHILLER1250T
TRANECHILLER650T
P-12 P-13 P-14P-11
TO ANDFROM SKYBOX
CWS
CWS
CW
S
WALL
CWS
CWR CWRCWR
CWR
CWR CWR
CWS
CWR
CWR
CW
S
CW
R
CWS
CWS
CH2
CH1
CWR
CWS
BLDG CHILLED WATERPUMPS NOT USED
CWS
TO LINDLECTURE HALL
1300GPM
1300GPM
1300GPM
1300GPM
EXISTING CHILLED WATER FLOW SHEET TRANE CHILLERSNOT TO SCALE

CHILLER CARRIER
P-3
CWR
12"
P-2
12"
12"
CW
S
P-4
CW
R
VFDP-1VFD
CWR
CWS CWR CWS
12"
10" CWR CWS
10" 12"
CW
R12"
CW
S
CW
S
20"20" 20"
10"10"
CWSCWS
12"12"
CH3
CWR
CW
S
CWS
3000GPM
3000GPM
2733GPM
2108GPM
EXISTING CHILLED WATER FLOW SHEET CARRIER CHILLERNOT TO SCALE

CHILLER/1250 T
14"
CS
14"
10"
P-7 P-8 P-9 P-10
CS
10" 10" 10"
CS
CS
CS
CS
12"
12"
18"
12"12"12"
18"14"14"
CS
CHILLER/650 T
CS
CR
CR
CR
CR
CS
CR
14"
10"
18"14" 18"
CS
10"14"
10"
18"
18"
FILTER
18"
18"
WALLFROM COOLING TOWER
TO COOLING TOWER
CH2
CH1
1950GPM
1950GPM
1950GPM
1950GPM
EXISTING CONDENSER WATER FLOW SHEET TRANE CHILLERSNOT TO SCALE
CHILLER CARRIER
P-6
WALL
SOFTENER
SW
CR
CR CS CS
CR
CS16x12"ELLS
12"
12"
16"
16"
18"
16"20x16"20x18"
20"
18"
18"
16"16"
12"12"12"
12x8 12x8 12x8 12x8
P-52"
2"
2"
8" 8"8"
SW
2"
CH3
SOFTENER ISNOT USED.
2108 GPM 2108 GPM
EXISTING CONDENSER WATER FLOW SHEET CARRIER CHILLERNOT TO SCALE

2.3 EXISTING CAMPUS BUILDINGS LOAD SUMMARY
Building Name Gross Sq.Feet
Connected toCentral Cooling
Plant
Gross CoolingTons GPM Future Planning
Building # 1 No 0 0 Demolish / Future New Bldg. 320 Tons
Building # 2 No 0 0 Demolish
Building # 3 No 0 0 Demolish
Building # 4 39897 Yes 119 286 Demolish / Future New Bldg. 320 Tons
Science Lab 112650 Yes 285 684 Future Additional 285 Tons
Lind Lecture 48200 Yes 133 320 None
Miller Administration 45147 Yes 179 430 None
Social Science 106327 Yes 346 830 None
Wattis Business 52269 Yes 118 284 None
McKay Education Building 67785 Yes 312 749 None
Heating Plant 6206 Yes 18 43 None
Technical Education 18163 Yes 54 130 Future Additional 271 Tons
Engineering Technology 72910 Yes 141 339 Future Additional 32 Tons
Allied Health Ph. 1 61198 Yes 132 316 None
Allied Health Ph. 2 27058 Yes 99 238 None
Student Services 82700 Yes 123 296 None
Shepherd Union 172231 Yes 513 1232 S-06 Additional 40 Tons
Stewart Library 159276 Yes 389 933 S-06 Additional 15 Tons
Browning Center 160143 Yes 472 1133 None
Lampros Hall 18361 Yes 68 163 None
Kimball Visual Arts 70872 Yes 201 482 None
Stadium Offices 21247 Yes 93 223 None
HPEC 78846 Yes 208 499 None
Stadium Sky Box 39507 Yes 109 261 None
Campus Services No Future Additional 40 Tons
Swenson Gym No S-06 Additional 280 Tons
Track Locker Room Yes 15 36 None

WEBER STATE UNIVERSITY CENTRAL CHILLER PLANT STUDYWHW ENGINEERING INC. – 2005
3.1-1
SECTION 3 – CENTRAL CHILLED WATER PLANT CONDITIONS
3.1 Introduction
A. The Existing Central Chiller Plant is located under the Science Lab Building #6and consists of three centrifugal chillers. Two chillers are manufactured by TraneCo., with capacities of 1250 and 650 Tons respectively. The third chiller ismanufactured by Carrier Corp., having a capacity of 1250 Tons.
The 650 Ton Trane chiller was installed in 1992, the 1250 Ton Trane unit in2001. Trane chillers are in good condition. The Carrier chiller was installed in1975 and is in fair to poor condition.
B. The following campus loads are indicated in both a numeric and graph format.
1. These loads include the existing campus load, the projected load forsummer 2006, and the projected overall future load. The total of these areshown, as well as conclusions to the capacities required for both the newand existing chilled water plants.
2. The loads include approximations for a campus central system diversityfactor. The campus currently sees around a 60% diversity factor. Thismeans that the central plant peak operation is approximately 60% of thesum of the individual building peak loads. Because this is the currentcampus diversity factor, it has been applied to the existing loads as wellas the summer of 2006 cooling loads; however, a 65% diversity factor isbeing used for the entire campus after 2006. This is done to add a safetyfactor and give some future flexibility. As the University continues to growand develop, building schedules may change, new buildings may havedifferent load profiles, and the campus diversity factor may change.When planning for a central chiller plant that is intended to serve thecampus needs for the unforeseeable future, we feel it prudent to use aslightly higher diversity factor to account for some future flexibility.

3.2 CENTRAL PLANT LOAD REQUIREMENTS
BuildingNo. Building Name Area Sq. FT. MBH Gross Tons 10 T GPM Diversity
Factor Net Tons Net GPM
4 Building #4 39,897 1,430 119 286 60% 71.4 1726 Science Lab 142,650 3,420 285 684 60% 171 4107 Lind Lecture 48,200 1,600 133 319 60% 79.8 191
10 Miller Administration 45,147 2,152 179 430 60% 107.4 25814 Social Science 106,327 4,150 346 830 60% 207.6 49815 Wattis Business 52,269 1,420 118 283 60% 70.8 17016 Education Building 67,785 3,744 312 749 60% 187.2 44918 Heating Plant 6,206 216 18 43 60% 10.8 2622 Technical Education 18,163 650 54 130 60% 32.4 7823 Engineering Tech. 72,910 1,694 141 338 60% 84.6 203
34a Allied Health PH.1 61,198 1,580 132 317 60% 79.2 190 34b Allied Health PH.II 27,058 1,192 99 238 60% 59.4 143
35 Student services 82,700 1,480 123 295 60% 73.8 17736 Shepherd Union 172,231 6,158 513 1231 60% 307.8 73937 Stewart Library 159,276 4,667 389 934 60% 233.4 56037 Browning Center 160,143 5,664 472 1133 60% 283.2 68039 Lampros Hall 18,361 816 68 163 60% 40.8 9840 Kimbal Visual Arts 70,872 2,409 201 482 60% 120.6 28952 Stadium Offices 21,247 1,116 93 223 60% 55.8 13451 HPEC 78,846 2,493 208 499 60% 124.8 299
Track Locker Rooms 180 15 36 60% 9 2255 Stadium Skybox 39,507 1,305 109 262 60% 65.4 157
Sub-Total 1,490,993 49,536 4,127 9,905 60% 2,476 5,943
A. EXISTING BUILDING CONNECTED LOADS
Gross Tons per Building
0
100
200
300
400
500
600
Build
ing
#4Sc
ienc
e La
bLi
nd L
ectu
reM
iller
Soci
al S
cien
ceW
attis
Educ
atio
nH
eatin
g Pl
ant
Tech
nica
lEn
gine
erin
gAl
lied
Hea
lthAl
lied
Hea
lthSt
uden
tSh
ephe
rdSt
ewar
tBr
owni
ngLa
mpr
os H
all
Kim
bal V
isua
lSt
adiu
mH
PEC
Trac
k Lo
cker
Stad
ium
Gross Tons
WEBER STATE UNIVERSITY CENTRAL CHILLER PLANT STUDYWHW ENGINEERING INC. - 2005
3.2-1

BuildingNo. Building Name Area Sq. FT. MBH Gross
Tons 10 T GPM DiversityFactor Net Tons Net GPM
50 Swenson Gym 85,000 3,120 280 672 60% 168 403.236 Union Building Addition 14,000 480 40 96 60% 24 57.637 Library Addition 5,000 180 15 36 60% 9 21.6
Sub-Total 104,000 3,780 335 804 60% 201 482
B. PROJECTED SUMMER 2006 LOADS
2006 Additional Gross Tons
0
50
100
150
200
250
300
Swenson Gym Union BuildingAddition
Library Addition
2006 Additional Gross Tons
WEBER STATE UNIVERSITY CENTRAL CHILLER PLANT STUDYWHW ENGINEERING INC. - 2005
3.2-2
BuildingNo. Building Name Area Sq. FT. MBH Gross
Tons 10 T GPM DiversityFactor Net Tons Net GPM
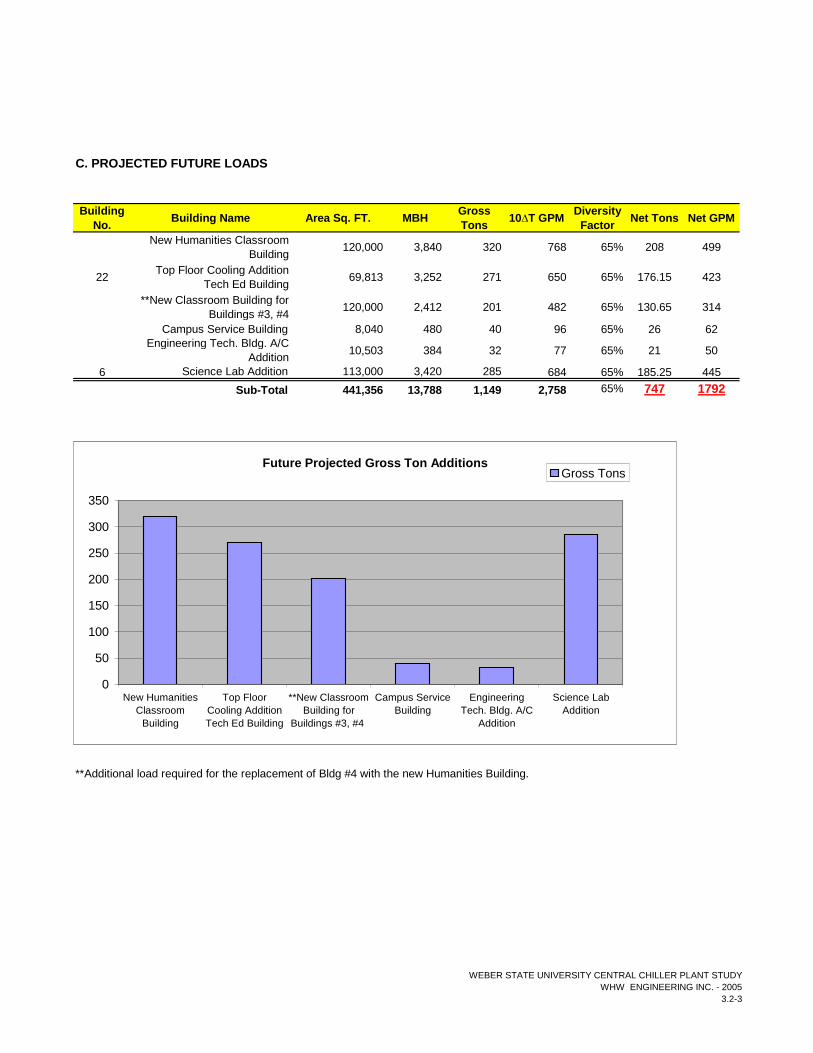
New Humanities ClassroomBuilding 120,000 3,840 320 768 65% 208 499
22 Top Floor Cooling AdditionTech Ed Building 69,813 3,252 271 650 65% 176.15 423
**New Classroom Building forBuildings #3, #4 120,000 2,412 201 482 65% 130.65 314
Campus Service Building 8,040 480 40 96 65% 26 62Engineering Tech. Bldg. A/C
Addition 10,503 384 32 77 65% 21 50
6 Science Lab Addition 113,000 3,420 285 684 65% 185.25 445Sub-Total 441,356 13,788 1,149 2,758 65% 747 1792
**Additional load required for the replacement of Bldg #4 with the new Humanities Building.
C. PROJECTED FUTURE LOADS
Future Projected Gross Ton Additions
0
50
100
150
200
250
300
350
New HumanitiesClassroom
Building
Top FloorCooling AdditionTech Ed Building
**New ClassroomBuilding for
Buildings #3, #4
Campus ServiceBuilding
EngineeringTech. Bldg. A/C
Addition
Science LabAddition
Gross Tons
WEBER STATE UNIVERSITY CENTRAL CHILLER PLANT STUDYWHW ENGINEERING INC. - 2005
3.2-3

3.3 CHILLER PLANT CAPACITY REQUIREMENT SUMMARY
Chiller Manufacturer/Type Size (Tons) Line Loss Factor Total Tons
Trane Centrifugal Chiller 1,250 95% 1,188
Carrier Centrifugal Chiller 1,250 95% 1,188
Trane Centrifugal Chiller 650 95% 618
Total Existing Central Plant Capacity: 2993
A. EXISTING CENTRAL CHILLED WATER PLANT CAPACITY
Current Chiller Plant Capacity
0
200
400
600
800
1,000
1,200
1,400
Trane CentrifugalChiller
Carrier CentrifugalChiller
Trane CentrifugalChiller
Size (Tons)
WEBER STATE UNIVERSITY CENTRAL CHILLER PLANT STUDYWHW ENGINEERING INC. - 2005
3.3-1

Connected Loads Area Sq. FT. MBH GrossTons 10 T GPM Diversity Net Tons Net GPM
Existing Campus Load 1,490,993 49,536 4,127 9,905 60% 2,476 5,943
Summer 2006 Projected Load 104,000 3,780 335 804 60% 201 482
Future Projected Load For FutureBuildings 441,356 13,788 1,149 2,758 65% 747 1792.44
Gross Totals 2,036,349 67,104 5,611 13,467 3,424 8,218
Overall Future Plant CapacityRequirements Area Sq. FT. MBH Gross
Tons 10 T GPM Diversity Net Tons Net GPM
Overall Future Loads with NewDiversity 2,036,349 67,104 5,611 13,467 65% 3,647 8,753
Projected Gross TonRequirements
Req'd GrossTons
Req'd NetTons
Existing Campus Load 4,127 2,476
Summer 2006 Projected Load 4,462 2,677
Overall Future Projected Load 5,611 3,647
B. NEW REQUIRED CHILLED WATER PLANT CAPACITY
PROJECTED LOAD INCREASE
47%
8%
0%
Load Increase FromExisting
Projected Ton Requirements
0
1,000
2,000
3,000
4,000
5,000
6,000
Existing Campus Load Summer 2006 ProjectedLoad
Overall Future ProjectedLoad
Chi
ller T
ons
Req'd Gross TonsReq'd Net Tons
WEBER STATE UNIVERSITY CENTRAL CHILLER PLANT STUDYWHW ENGINEERING INC. - 2005
3.3-2

WEBER STATE UNIVERSITY CENTRAL CHILLER PLANT STUDYWHW ENGINEERING INC. – 2005
3.4 -1
3.4 Conclusion
1. The existing chiller capacity is capable of serving the needs of the existing connectedload:
Ø Existing connected load: 2,476 TonsØ Existing chiller plant capacity: 2,993 TonsØ Excess capacity: 517 Tons
2. The existing chiller capacity is capable* of serving the needs of the existingconnected load and the additional loads projected for the summer of 2006:
Ø Existing connected load & 2006 addition: 2,677 TonsØ Existing chiller plant capacity: 2,993 TonsØ Excess capacity: 316 Tons
*In order to meet this demand, all three chillers must be in operation andfunctioning to capacity. In an event that any one of the three chillers fail, theresult would be a higher water temperature distribution system with significantlyless cooling at each individual building.
Note: Pumping system will be inadequate as it is currently operating. A higherchilled water Delta T will need to be used in attempt to compensate for lack ofpumping capacity at peak loads.
3. The existing chiller capacity is not capable of serving the needs of the existingconnected load, the additional projected summer load of 2006, and the additionalfuture load.
Ø Total projected future load: 3,647 TonsØ Existing chiller plant capacity: 2,993 TonsØ Capacity insufficiency: 654 Tons
0
1000
2000
3000
4000
ExistingLoad
Projected2006 Load
ProjectedFuture Load
Chiller Plant Capacity Summary
Existing Chiller PlantCapacityRequired Tons

WEBER STATE UNIVERSITY CENTRAL CHILLER PLANT STUDYWHW ENGINEERING INC. – 2005
4.1-1
SECTION 4 – CHILLED WATER CAMPUS DISTRIBUTION SYSTEM
4.1 Introduction
A. This section will describe the existing and future chilled water pipingdistribution systems. This description includes maps, flow sheets, pipinganalysis sheets, comparison sheets between existing and future pipingcapacities, pipe sizing and recommendations.
B. The existing campus chilled water piping distribution system is a two pipedirect return system. Each building is equipped with two way valves or 3-way valves operating as two way valves. Piping is routed both in tunnelsand directly buried.
C. The piping distribution system begins at the existing central chilled waterplant located under the Science lab building. The piping is routed westwhere it separates into one branch going north and one going south.Both branches turn and head west. (See campus distribution map.)Chilled water piping is also distributed east to the stadium. The east sideof campus is the high point and the west the low point of the system.
D. See the central chilled water flow sheets this section for existing pipingarrangements. Pipe flow analysis sheets, indicate existing and futureconditions. Pipe section nodes show pipe size, GPM, and required tonsfor that section of piping. Supply and return chilled water piping is shownon the map as one.
Tunnel to Kimball Arts
Tunnel to Student Services

4.2 CAMPUS PIPING AND PUMPING SYSTEMS
A. CHILLED WATER PIPE SECTION SUMMARY (see individual flow sheets and campus map for further detail)
Pipe Section
Existing Size Tons GPM Tons GPM Tons GPM Tons GPM
Recommended Minimum Future
Size*
A-A.224"
condenser 5611 13466 3647 8753 24"
B-B.1 6" 285 684 285 684 285 684 285 684 6"B-B.2 4" 133 319 133 319 133 319 133 319 4"B-S 6" 217 521 217 521 217 521 217 521 6"S-S.2 6" 217 521 217 521 217 521 217 521 6"S.3-S.4 4" 93 223 93 223 93 223 93 223 4"S.2-S.3 4" 108 259 108 259 108 259 108 259 4"S.2-S.5 4" 109 262 109 262 109 262 109 262 4"S.3-S.6 2" 15 36 15 36 15 36 15 36 2"A.2-T - - - - - 5611 13466 3647 8753 24"T-T.1 - - - - - 285 684 285 684 6"T-T.2 - - - - - 5326 12782 3462 8309 24"T.2-C 20" 1133 2719 1133 2719 10"BC 20" 3492 8381 2270 5448 - - - - abandon/removeCB**** 10" 635 1524 635 1524 635 1524 635 1524 8"CR 8" 195 468 195 468 498 1195 498 1195 8"R-R.2 6" 141 338 141 338 173 415 173 415 5"R-R.3 4" 54 130 54 130 325 780 325 780 6"CD 20" 3297 7913 2143 5143T.2-D 20" 4193 10063 2725 6541 18"D-D.1 20" 3297 7913 2143 5143 4193 10063 2725 6541 18"D.1-D.2 6" 132 317 132 317 132 317 132 317 5"D.1-E 20" 3165 7596 2057 4937 4061 9746 2640 6335 18"EQ 10" 696 1670 592 1420 991 2378 842 2022 10"Q-Q.1 10" 389 934 389 934 404 970 404 970 8"Q-Q.2 10" 307 737 307 737 587 1409 587 1409 8"Q.2-Q.3 4" 99 238 99 238 99 238 99 238 4"Q.2-Q.4 208 499 208 499 488 1171 488 1171 8"Q.4-Q.5 5" 208 499 208 499 208 499 208 499 5"Q.4-Q.6 (5" stub) - - - - 280 672 280 672 6"EF 20" 2469 5926 1605 3852 3070 7368 1996 4789 18"F-F.2 5" 119 286 119 286 320 768 320 768 6"FG 18" 2350 5640 1528 3666 2750 6600 1788 4290 16"GH 18" 1658 3979 1078 2586 2058 4939 1338 3210 12"GP 8" 692 1661 588 1412 692 1661 588 1412 8"P-P.2 5" 152 365 152 365 152 365 152 365 5"P-P.3 8" 472 1133 472 1133 472 1133 472 1133 8"P-P.4 4" 68 163 68 163 68 163 68 163 4"HI 12" 685 1644 582 1397 725 1740 616 1479 8"I-I.2 8" 361 866 361 866 401 962 401 962 8"I.2-I.3 - - - - - 40 96 40 96 3"IJ 12" 324 778 324 778 324 778 324 778 8"J-J.2 5" 123 295 123 295 123 295 123 295 5"JK 10" 201 482 201 482 201 482 201 482 6"K-K.2 3" 51 122 51 122 51 122 51 122 3"K-K.3 6" 150 360 150 360 150 360 150 360 5"HL 12" 973 2335 827 1985 1333 3199 1133 2719 12"LM 10" 525 1260 525 1260 525 1260 525 1260 8"M-M.2 5" 179 430 179 430 179 430 179 430 5"M-M.3 8" 346 830 346 830 346 830 346 830 8"LN 8" 448 1075 381 914 808 1939 687 1648 8"N-N.2 6" 118 283 118 283 118 283 118 283 4"NO 8" 330 792 330 792 690 1656 690 1656 8"O-O.2 8" 312 749 312 749 312 749 312 749 6"O-O.2.5 2.5" 18 43 18 43 378 907 378 907 8"O2.5-O.3 2.5" 18 43 18 43 58 139 58 139 3"O.3-O.3.5 2.5" 18 43 18 43 18 43 18 43 2"O2.5-O.5 - - - - - 320 768 320 768 6"O.3-O.4 - - - - - 40 96 40 96 3"
*** Where section loads increase as a result of anticipated development, these new loads are shown in italics.**** A 20" pipe runs from B to C, and a 10" pipe runs back from C to B, so both sections are listed.
Chilled Water Pipe Section Summary
New configuration. Becomes T.2-D and T.2-CExisting pipe re-configured in future
Existing pipe re-configured in future
Existing pipe re-configured in future
Existing Net CHW Load**
Anticipated Future Net CHW Load**
** The net chilled water load for the pipe sections is based on approximate diversity factors at the different sections. The individual building branch loads do not use a diversity factor. The existing building loads are shown in blue. The sub-mains that serve relatively few buildings do not use a diversity factor, and are shown in regular black. The diversity factor for the main chilled water lines is approximated at 65%. This is the same diversity as the central plant. These loads are shown in magenta. The diversity factor for the sub-mains serving large groups of buildings is approximated at 85%. These loads are shown in green.
* Based on anticipated future net load, using the 2005 campus master plan. Pipe size recommendations are made using a maximum pressure drop of 5.0'/100 ft and maximum velocity of 8.0'/sec. The sizes and sections shown in red indicate either new sections of piping, or sections where the future recommended line size is larger than the existing line size. These recommendations only apply to the current anticipated development. If changes are made to the campus master plan, then recommended line sizes should be re-evaluated.
Existing Gross CHW Load
Anticipated Future Gross CHW Load***
WEBER STATE UNIVERSITY CENTRAL CHILLER PLANT STUDYWHW ENGINEERING INC. - 2005
4.2-1

HEATINGPLANT
N
18 TONS43 GPM
O3
EDUCATIONBLDG.
312 TONS749 GPM
O2O
N2
18 TONS43 GPMRS = 2"ES = 2-1/2"NCR
330 TONS792 GPMRS = 6"ES = 8"NCR 448 GROSS X 0.85 =
381 NET TONS1075 GROSS X 0.85= 914 NET GPMRS = 8"ES = 8"NCR
WATTISBUSINESSBLDG.118 TONS284 GPM
L H
973 GROSS X 0.85 = 827 NET TONS2335 GROSS X 0.85 = 1985 NET GPMRS = 10"ES = 12"NCR525 TONS
1260 GPM
M2
MILLERADMINISTRATIONBLDG.179 TONS430 GPM
M
M3
SOCIALSCIENCE
346 TONS830 GPM
RS = 8"ES = 8"NCR
RS = 5"ES = 5"NCR
RS = 8"ES = 10"NCR
TO I
685 GROSS x 0.85 = 582 NET TONS1644 GROSS X0.85 = 1397 NET GPM
1658 GROSS X 0.65 = 1078 NET TONS3979 GROSS X 0.65 = 2586 NET GPMRS = 12"ES = 18"NCR
TO G
RS = 4"ES = 6"NCR
RS = 6"
RS = REQUIRED PIPE SIZEES = EXISTING PIPE SIZENCR = NO CORRECTIONS REQUIREDCR = CORRECTIONS REQUIREDGREEN = PARTIAL (85%) DIVERSITYMAGENTA = FULL (65%) DIVERSITYRED = RECOMMENDED CHANGES
B. P
IPE
SE
CTIO
NS
BRANCH #1 & #2 EXISTINGNOT TO SCALE

HEATINGPLANT
N
18 TONS43 GPM
O3.5
EDUCATIONBLDG.
312 TONS749 GPM
O2O
N2
58 TONS139 GPM
690 TONS1656 GPM
808 GROSS X 0.85= 687 NET TONS1940 GROSS X 0.85= 1648 NET GPMRS = 8"ES = 8"NCR
WATTISBUSINESSBLDG.118 TONS284 GPM
L H
525 TONS1260 GPM
M2
MILLERADMINISTRATIONBLDG.179 TONS430 GPM
M
M3
SOCIALSCIENCE
346 TONS830 GPM
CAMPUSSERVICE
40 TONS96 GPM
O4
NEWHUMANITIESBUILDING
320 TONS768 GPM
O5378 TONS907 GPM
1333 GROSS X 0.85 = 1133 NET TONS3199 GPM X 0.85 = 2719 NET GPMRS = 12"ES = 12"NCR
TO G
TO I725 GROSS X 0.85 = 616 NET TONS1740 GROSS X 0.85 = 1479 NET GPMS06'
RS = 8"ES = 10"NCR
RS = 5"ES = 5"NCR
RS = 8"ES = 8"NCR
RS = 4"ES = 6"
RS = 8"ES = 8"NCR
RS = 6"
RS = 8"ES = 4"CR
RS = 6"ES = NONE
RS = 3"ES = 2-1/2"CR
02.503
RS = 2"ES = 2-1/2"NCR
RS = 3"ES = NONECR
RS = REQUIRED PIPE SIZEES = EXISTING PIPE SIZENCR = NO CORRECTIONS REQUIREDCR = CORRECTIONS REQUIREDGREEN = PARTIAL (85%) DIVERSITYMAGENTA = FULL (65%) DIVERSITYRED = RECOMMENDED CHANGES
2058 GROSS X 0.65 = 1338 NET TONS4939 GROSS X 0.65 = 3210 NET GPMRS = 12"ES = 18"NCR
BRANCH #1 & #2A FUTURENOT TO SCALE

H
SHEPHERDUNIONBLDG
123 TONS295 GPMRS = 5"ES = 5"NCR
J
I2
I
STUDENTSERVICES
J2324 TONS778 GPMRS = 8"ES = 12"NCR
361 TONS866 GPMRS = 8"ES = 8"NCR
201 TONS482 GPMRS = 5"ES = 10"NCR
KIMBALLARTS.
K
K3
K2
360 GPMRS = 5"ES = 6"NCR122 GPMRS = 3"ES = 3"NCR
201 TONS482 GPM
TO G
685 GROSS x 0.85 = 582 NET TONS1644 GROSS X0.85 = 1397 NET GPM
RS = REQUIRED PIPE SIZEES = EXISTING PIPE SIZENCR = NO CORRECTIONS REQUIREDCR = CORRECTIONS REQUIREDGREEN = PARTIAL (85%) DIVERSITYMAGENTA = FULL (65%) DIVERSITYRED = RECOMMENDED CHANGES
BRANCH #3 EXISTINGNOT TO SCALE

H
SHEPHERDUNIONBLDG
123 TONS296 GPMRS = 5"ES = 5"NCR
J
I2
I
STUDENTSERVICES
J2324 TONS778 GPMRS = 8"ES = 12"NCR
201 TONS482 GPMRS = 5"ES = 10"NCR
KIMBALLAPTS.
K
K2
401 TONS962 GPMRS = 8"ES = 8"NCR
361 TONS866 GPM
40 TONS96 GPMS06RS = 3"ES = NONECR
201 TONS482 GPM
G
360 GPMRS = 5"ES = 6"NCR122 GPMRS = 3"ES = 3"NCR
K3
RS = REQUIRED PIPE SIZEES = EXISTING PIPE SIZENCR = NO CORRECTIONS REQUIREDCR = CORRECTIONS REQUIREDGREEN = PARTIAL (85%) DIVERSITYMAGENTA = FULL (65%) DIVERSITYRED = RECOMMENDED CHANGES
725 GROSS X 0.85 = 616 NET TONS1740 GROSS X 0.85 = 1479 NET GPM
S06'
I3
BRANCH #3A SUMMER 2006NOT TO SCALE

G
UNIONBLDG.
P4LAMPROSHALL
P3 BROWNINGCENTER
472 TONS1133 GPMRS = 8"ES = 8"
P
P2
68 TONS163 GPMRS = 4"ES = 4"
692 GROSS X 0.85 =588 NET TONS1661 GROSS X 0.85 =1412 NET GPMRS = 8"
152 TONS365 GPMRS = 5"ES = 5"TO H
TO F
2350 GROSS X 0.65 = 1528 NET TONS5640 GROSS X 0.65 = 3666 NET GPMRS = 12" PRESENTES = 18"2750 GROSS X 0.65 = 1788 NET TONS6600 GROSS X 0.65 = 4290 NET GPMRS = 16" FUTURENCR
1658GROSS X 0.65 = 1078 NET TONS3979 GROSS X 0.65 =2586 NET GPMRS = 12" PRESENTES = 18"2058 GROSS X 0.65 = 1338 NET TONS4939 GROSS X 0.65 = 3210 NET GPMRS = 12" FUTURENCR
RS = REQUIRED PIPE SIZEES = EXISTING PIPE SIZENCR = NO CORRECTIONS REQUIREDCR = CORRECTIONS REQUIREDGREEN = PARTIAL (85%) DIVERSITYMAGENTA = FULL (65%) DIVERSITYRED = RECOMMENDED CHANGES
BRANCH #4 EXISTING AND FUTURENOT TO SCALE

E
696 GROSS X 0.85 = 592 NET TONS1670 GROSS X 0.85 = 1420 NET GPMRS = 8"ES = 10"
STEWARTLIBRARY
Q3
ALLIEDHEALTHPHASE II
Q5HPEC.GYM
208 TONS499 GPM
Q4
208 TONS499 GPMRS = 5"
389 TONS934 GPMRS = 5"
Q
Q2
Q1
307 TONS737 GPMRS = 6"
99 TONS238 GPMRS = 4"
E
D1
D2
ALLIEDHEALTHPHASE I
132 TONS316 GPMRS = 5"
3165 GROSS X 0.65 =2057 NET TONS
7596 GROSS X 0.65 =4937 NET GPM
RS = 16"ES = 20"
NCR
TO F
2469 GROSS X 0.65 =1605 NET TONS5926 GROSS X 0.65 =3852 NET GPM
TO D
RS = REQUIRED PIPE SIZEES = EXISTING PIPE SIZENCR = NO CORRECTIONS REQUIREDCR = CORRECTIONS REQUIREDGREEN = PARTIAL (85%) DIVERSITYMAGENTA = FULL (65%) DIVERSITYRED = RECOMMENDED CHANGES
3297 GROSS X 0.65 =2143 NET TONS
7913 GROSS X 0.65 =5143 NET GPM
RS = 16"ES = 20"
NCR
BRANCH #5 & #7 EXISTINGNOT TO SCALE

E
STEWARTLIBRARY
Q3
ALLIEDHEALTHPHASE II
Q5HPEC.GYM
208 TONS499 GPM
Q4
488 TONS1171 GPMRS = 8"
404 TONS970 GPMRS = 8"
Q
Q2
Q1
587 TONS1409 GPMRS = 8"
Q6
SWENSONGYM.
389 TONS933 GPM
S0615 TONS36 GPM
S06280 TONS672 GPM
D1
D2
ALLIEDHEALTHPHASE I
132 TONS316 GPMRS = 5"
RS = 6"
RS = 5"
TO F
TO D99 TONS238 GPMRS = 4"
RS = REQUIRED PIPE SIZEES = EXISTING PIPE SIZENCR = NO CORRECTIONS REQUIREDCR = CORRECTIONS REQUIREDGREEN = PARTIAL (85%) DIVERSITYMAGENTA = FULL (65%) DIVERSITYRED = RECOMMENDED CHANGES
4061 GROSS X 0.65 =2640 NET TONS
9746 GROSS X 0.65 =6335 NET GPM
RS = 18"ES = 20"
NCR
3070 GROSS X 0.65 =1996 NET TONS7368 GROSS X 0.65 =4789 NET GPM
4193 GROSS X 0.65 =2725 NET TONS
10063 GROSS X 0.65= 6541 NET GPM
RS = 18"ES = 20"
NCR
991 GROSS X 0.85 = 842 NET TONS2378 GROSS X 0.85 = 2022 NET GPMRS = 10"ES = 10"
BRANCH #5 SUMMER 2006NOT TO SCALE
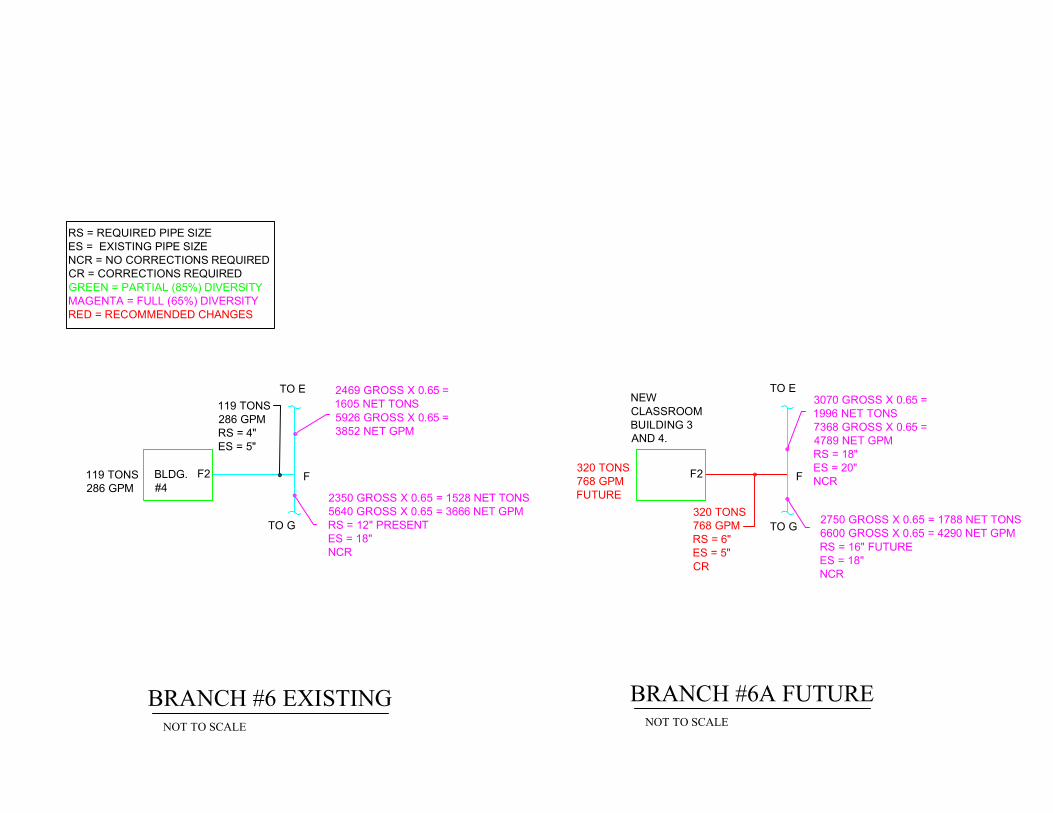
BLDG.#4
FF2119 TONS286 GPM
119 TONS286 GPMRS = 4"ES = 5"
TO ENEWCLASSROOMBUILDING 3AND 4.
FF2
320 TONS768 GPMRS = 6"ES = 5"CR
TO E
TO G
320 TONS768 GPMFUTURE
TO G
RS = REQUIRED PIPE SIZEES = EXISTING PIPE SIZENCR = NO CORRECTIONS REQUIREDCR = CORRECTIONS REQUIREDGREEN = PARTIAL (85%) DIVERSITYMAGENTA = FULL (65%) DIVERSITYRED = RECOMMENDED CHANGES
2350 GROSS X 0.65 = 1528 NET TONS5640 GROSS X 0.65 = 3666 NET GPMRS = 12" PRESENTES = 18"NCR
2750 GROSS X 0.65 = 1788 NET TONS6600 GROSS X 0.65 = 4290 NET GPMRS = 16" FUTUREES = 18"NCR
2469 GROSS X 0.65 =1605 NET TONS5926 GROSS X 0.65 =3852 NET GPM
3070 GROSS X 0.65 =1996 NET TONS7368 GROSS X 0.65 =4789 NET GPMRS = 18"ES = 20"NCR
BRANCH #6A FUTUREBRANCH #6 EXISTINGNOT TO SCALE NOT TO SCALE

R3
RR2
C
B2
VB
TECHNICALEDUCATION
ENGINEERINGTECHNICALEDUCATION
141 TONS338 GPM
54 TONS130 GPM
195 TONS468 GPMRS = 5"ES = 8"NCR
MANHOLE635 TONS1524 GPMRS = 8"ES = 10"
D
EXISTING VALVEBOX
SCIENCELAB
285 TONS684 GPMRS = 6"ES = 6"
350 TONS841 GPMRS = 8"ES = 10"
LIND.LECTUREHALL
93 TONS223 GPMRS = 4"ES = 4"
S4
S5
S6
STADIUMOFFICES
TRACK/LOCKERROOM
STADIUM/SKY BOX
108 TONS260 GPMRS = 4"ES = 4"
109 TONS262 GPMRS = 4"ES = 4"
15 TONS36 GPMRS = 2"ES = 2"
133 TONS320 GPMRS = 4"ES = 4"NCR
217 TONS521 GPMRS = 6"ES = 6"NCR
RS = 3"ES = 4"NCR
RS = 5"ES = 6"NCR
TO D1
EXISTING
BB1
RS = REQUIRED PIPE SIZEES = EXISTING PIPE SIZENCR = NO CORRECTIONS REQUIREDCR = CORRECTIONS REQUIREDGREEN = PARTIAL (85%) DIVERSITYMAGENTA = FULL (65%) DIVERSITYRED = RECOMMENDED CHANGES
3297 GROSS X 0.65 =2143 NET TONS
7913 GROSS X 0.65 =5143 NET GPM
3297 GROSS X 0.65 = 2143NET TONS7913 GROSS X 0.65 = 5143NET GPM
S2
S3
BRANCH #8 & #9 EXISTINGNOT TO SCALE

R3
RR2
C
B2
VB
FUTURE A/C271 TONS650 GPM
TECHNICALEDUCATION
325 TONS780 GPMRS = 6"ES = 4"CR
173 TONS415 GPMRS = 5"ES = 6"NCR
ENGINEERINGTECHNICALEDUCATION
141 TONS339 GPM
FUTURE A/C32 TONS77 GPM
54 TONS130 GPM
498 TONS1195 GPMRS = 8"ES = 8"NCR
MANHOLE635 TONS1524 GPMRS = 8"ES = 10"NCR
D
1133 TONS2719 GPMRS = 10"ES = 20"
EXISTING VALVEBOX
T
SCIENCELAB
285 TONS684 GPMRS = 6"ES = 6"NCR
133 TONS319 GPM
LIND.LECTUREHALL
FUTURESCIENCELAB. ADD.
285 TONS684 GPMRS = 6"ES = NONECR
217 TONS521 GPMRS = 6"ES = 6"NCR
T1
EXISTING
BB1
133 TONS319 GPMRS = 4"ES = 4"NCR
CAP
RS = REQUIRED PIPE SIZEES = EXISTING PIPE SIZENCR = NO CORRECTIONS REQUIREDCR = CORRECTIONS REQUIREDGREEN = PARTIAL (85%) DIVERSITYMAGENTA = FULL (65%) DIVERSITYRED = RECOMMENDED CHANGES
T2
TO A
5326 GROSS X 0.65 =3462 NET TONS12782 GROSS X 0.65= 8309 NET GPMRS = 24"ES = NONECR
5611 GROSS X 0.65 =3647 NET TONS13466 GROSS X 0.65= 8753 NET GPMRS = 24"ES = NONECR
93 TONS223 GPMRS = 4"ES = 4"
S4
S5
S6
STADIUMOFFICES
TRACK/LOCKERROOM
STADIUM/SKY BOX
108 TONS260 GPMRS = 4"ES = 4"
109 TONS262 GPMRS = 4"ES = 4"
15 TONS36 GPMRS = 2"ES = 2"
S2
S3
S
A2
4193 GROSS X 0.65 =2725 NET TONS
10063 GROSS X 0.65= 6541 NET GPM
RS = 18"ES = 20"
NCR
5611 GROSS X 0.65 =3647 NET TONS
13466 GROSS X 0.65= 8753 NET GPM
RS = 24"ES = NONE
CR
BRANCH #8A & #9A SUMMER 2006 AND FUTURENOT TO SCALE

WEBER STATE UNIVERSITYCAMPUS PIPIPING DISTRIBUTION MAP
CHILLED WATER LOOP
A
B.2
C
D
E
F
G
HI
J
K
L
MM.3
N
N.2
OO.2
O.3
P
P.2P.3
K.2
K.3M.2
J.2
I.2
F.2
Q.1
Q.3
Q.4
D.2
R
R.2R.3
B.1
B.3
S S.2
P.4
S.4
Q.6
Q.5Q
Q.2
S.6
S.3
S.5B
D.1
O2.5 O5O3.5
O4
TT.1
T.2
A.2

WEBER STATE UNIVERSITY CENTRAL CHILLER PLANT STUDYWHW ENGINEERING INC. – 2005
4.3 -1
4.3 CHILLED WATER PUMPING SYSTEM SUMMARY
A. The existing chilled water plant pumping system consists ofprimary pump loops for each chiller, and a secondary pump loopfor the campus:
1. Primary Loops: There are two primary pumps for each chiller. Eachpump in the Trane room is sized for approximately 50% of the chillercapacity, or 1300 GPM each. The two primary pumps in the Carrier roomare closer to 100% redundant. Pump P-4 is sized for 2733 GPM andpump P-3 is sized for 2108 GPM. Pump P-4 runs as the lead primarypump, and pump P-3 runs as a manual back-up for the chilled water orcondenser water as necessary.
2. Secondary Loop:a. Pumps P-1 and P-2 are the main campus pumps. Each is sized
for 3000 GPM and 120 ft of head. Both pumps have VariableFrequency Drives.
b. The VFD is ramped based on the worst case scenario of threedifferential pressure sensors in the campus loop. Currently thisdifferential pressure has been set high enough to satisfy thepressure demands of the Skybox and Kimball Fine Arts buildings.This high pressure is causing problems at some of the buildingscloser to the plant and at lower elevations. Most of the reliefvalves in these areas have been changed, or adjusted to handlethe higher pressure, but there are still occasional problems. Inaddition, many of the buildings closer to the central plant have

WEBER STATE UNIVERSITY CENTRAL CHILLER PLANT STUDYWHW ENGINEERING INC. – 2005
4.3 -2
pressure reducing valves in the chilled water lines to protectagainst this problem.
c. Both of P-1 and P-2 pumps need to operate simultaneously todeliver 6000 GPM in order to meet the peak chiller capacity. Infact, with a 10 degree delta T on the chilled water, the maximumpumping capacity is closer to 2500 tons. This is approximately 490tons less than the maximum chiller capacity. In a case where thecampus load exceeds 2500 tons, it will be necessary to use alarger delta T, and if possible, a colder supply water temperatureto meet that additional demand.
Existing Campus Load GPM
Ø Existing connected load: 5,943Ø Chilled water pump capacity: 6,000Ø Excess capacity: 57
Summer 2006 Load
Ø Projected summer 2006 load: 6,425Ø Chilled water pump capacity: 6,000Ø Capacity insufficiency: 425
Projected Future Load
Ø Projected future load: 8,753Ø Chilled water pump capacity: 6,000Ø Capacity insufficiency: 2,753
B. The individual buildings vary in their chilled water distribution systems. Somebuildings have main chilled water pumps, some have coil pumps, and some donot have pumps. Some of the pumps are running, and some have been shut-offand bypassed. See section 2.3 for an individual building load summary.
Chilled Water PumpStudent Services Building
Chilled Water Pump RemovedAdministration Building
No Pumps – Piped Directly to CoilsKimball Arts
WEBER STATE UNIVERSITY CENTRAL CHILLER PLANT STUDYWHW ENGINEERING INC. – 2005
4.3 -3
C. Chilled Water Pumping System Summary
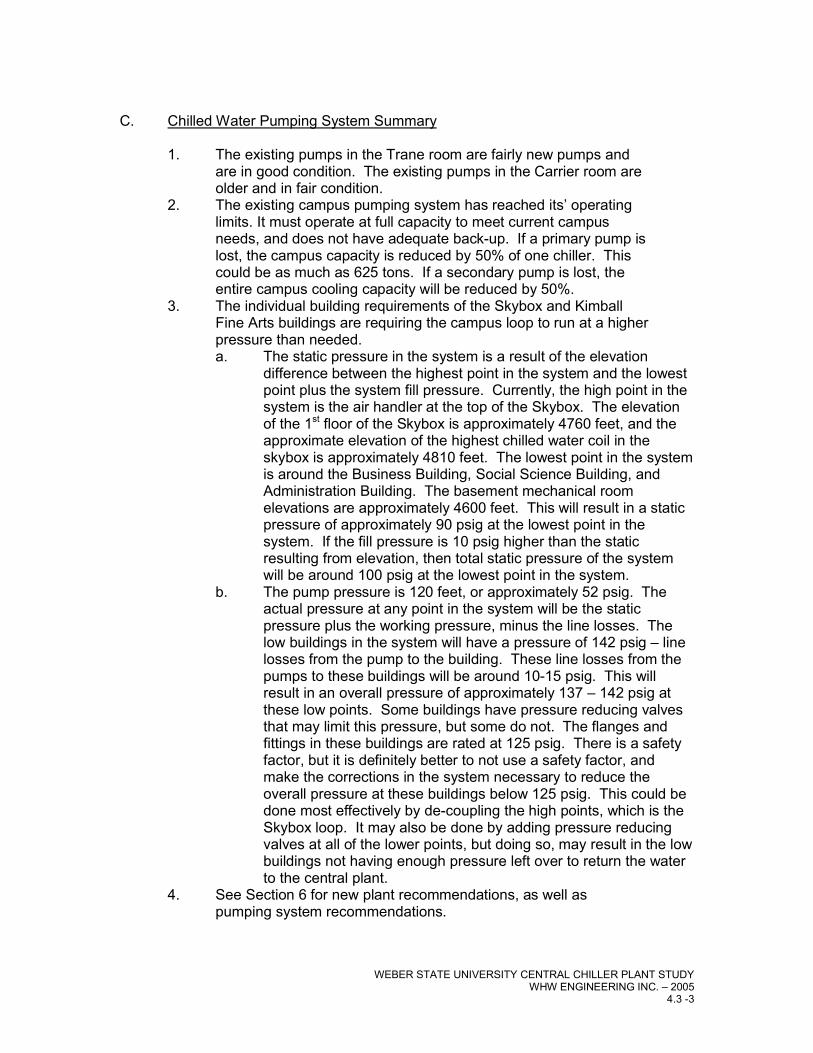
1. The existing pumps in the Trane room are fairly new pumps andare in good condition. The existing pumps in the Carrier room areolder and in fair condition.
2. The existing campus pumping system has reached its’ operatinglimits. It must operate at full capacity to meet current campusneeds, and does not have adequate back-up. If a primary pump islost, the campus capacity is reduced by 50% of one chiller. Thiscould be as much as 625 tons. If a secondary pump is lost, theentire campus cooling capacity will be reduced by 50%.
3. The individual building requirements of the Skybox and KimballFine Arts buildings are requiring the campus loop to run at a higherpressure than needed.a. The static pressure in the system is a result of the elevation
difference between the highest point in the system and the lowestpoint plus the system fill pressure. Currently, the high point in thesystem is the air handler at the top of the Skybox. The elevationof the 1st floor of the Skybox is approximately 4760 feet, and theapproximate elevation of the highest chilled water coil in theskybox is approximately 4810 feet. The lowest point in the systemis around the Business Building, Social Science Building, andAdministration Building. The basement mechanical roomelevations are approximately 4600 feet. This will result in a staticpressure of approximately 90 psig at the lowest point in thesystem. If the fill pressure is 10 psig higher than the staticresulting from elevation, then total static pressure of the systemwill be around 100 psig at the lowest point in the system.
b. The pump pressure is 120 feet, or approximately 52 psig. Theactual pressure at any point in the system will be the staticpressure plus the working pressure, minus the line losses. Thelow buildings in the system will have a pressure of 142 psig – linelosses from the pump to the building. These line losses from thepumps to these buildings will be around 10-15 psig. This willresult in an overall pressure of approximately 137 – 142 psig atthese low points. Some buildings have pressure reducing valvesthat may limit this pressure, but some do not. The flanges andfittings in these buildings are rated at 125 psig. There is a safetyfactor, but it is definitely better to not use a safety factor, andmake the corrections in the system necessary to reduce theoverall pressure at these buildings below 125 psig. This could bedone most effectively by de-coupling the high points, which is theSkybox loop. It may also be done by adding pressure reducingvalves at all of the lower points, but doing so, may result in the lowbuildings not having enough pressure left over to return the waterto the central plant.
4. See Section 6 for new plant recommendations, as well aspumping system recommendations.

WEBER STATE UNIVERSITY CENTRAL CHILLER PLANT STUDYWHW ENGINEERING INC. – 2005
5.1-1
SECTION 5 – NEW CENTRAL CHILLED WATER PLANT OPTIONS
5.1 Introduction
A. This section provides six different chiller combinations and capacities forthe new central chilled water plant.
B. Options or recommendations for Free Cooling and Thermal Ice Storageare also provided in this section.
C. The combination graphs indicate the different operational stages and thecorresponding capacity of the chillers at these stages.
D. See Appendix A.6 for chiller optimization and SPLV (System Part LoadValue efficiency) summaries. These runs also have VFD (VariableFrequency Drive) options and costs.

5.2 NEW CENTRAL CHILLED WATER PLANT CHILLER COMBINATIONS
New Central Chilled Water Plant Chiller Combinations: Combination A
Chiller # New/Existing Size (tons) VFDCH-1 New 1500 YesCH-2 Existing 1250 NoCH-3 New 1500 Optional***CH-4 Existing 650 No
Combination Capacity: 4900
Campus PeakTons Req'd
CombinationCapacity Excess Tons
3647 4900 1253
Stage Chillers Operating StandbyChillers
Stage Chiller TonCapacity
0 0 1,2,3,4 01 1 2,3,4 15002 1,2 3,4 27503 1,3 2,4 30004 1,2,3 4 4250
*Chiller manufactures provide twin compressors for chillers over 1500 Tons.
**Plate and Frame Exchanger will be provided for the first stage of cooling during spring, winter, and fall See Appendix A.4 for cut sheets.
***See Appendix A.6. for option - Combination A and A-1 life cycle cost and optimization.
Combination A
01
23
4
Stage Peak Req'd Tons
Stage Chiller Ton Capacity0
1000
2000
3000
4000
5000
Stage
Tons
Stage Peak Req'd TonsStage Chiller Ton Capacity
WEBER STATE UNIVERSITY CENTRAL CHILLER PLANT STUDYWHW ENGINEERING INC. – 2005
5.2-1
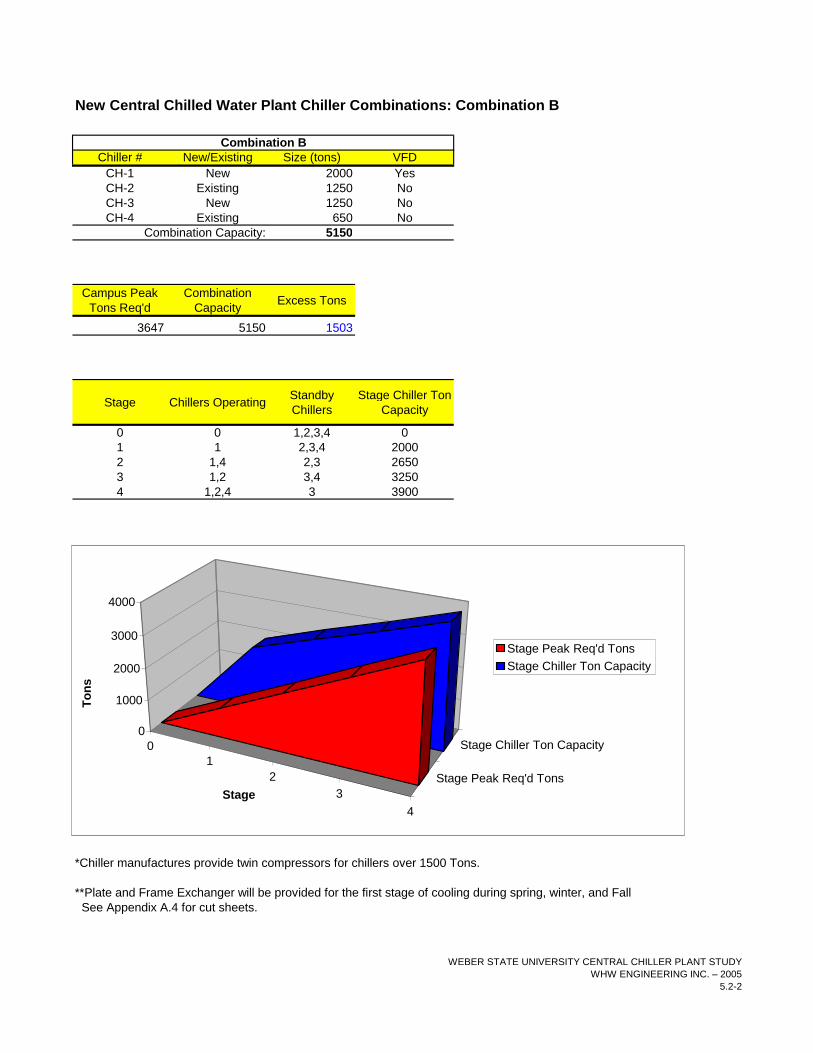
New Central Chilled Water Plant Chiller Combinations: Combination B
Chiller # New/Existing Size (tons) VFDCH-1 New 2000 YesCH-2 Existing 1250 NoCH-3 New 1250 NoCH-4 Existing 650 No
Combination Capacity: 5150
Campus PeakTons Req'd
CombinationCapacity Excess Tons
3647 5150 1503
Stage Chillers Operating StandbyChillers
Stage Chiller TonCapacity
0 0 1,2,3,4 01 1 2,3,4 20002 1,4 2,3 26503 1,2 3,4 32504 1,2,4 3 3900
*Chiller manufactures provide twin compressors for chillers over 1500 Tons.
**Plate and Frame Exchanger will be provided for the first stage of cooling during spring, winter, and Fall See Appendix A.4 for cut sheets.
Combination B
01
23
4
Stage Peak Req'd Tons
Stage Chiller Ton Capacity0
1000
2000
3000
4000
Stage
Tons
Stage Peak Req'd TonsStage Chiller Ton Capacity
WEBER STATE UNIVERSITY CENTRAL CHILLER PLANT STUDYWHW ENGINEERING INC. – 2005
5.2-2

New Central Chilled Water Plant Chiller Combinations: Combination C
Chiller # New/Existing Size (tons) VFDCH-1 New 1500 YesCH-2 Existing 1250 NoCH-3 New 1250 Optional***CH-4 Existing 650 No
Combination Capacity: 4650
Campus PeakTons Req'd
CombinationCapacity Excess Tons
3647 4650 1003
Stage Chillers Operating StandbyChillers
Stage Chiller TonCapacity
0 0 1,2,3,4 01 1 2,3,4 15002 1,2 3,4 27503 1,2,4 3 34004 1,2,3 4 4000
*Chiller manufactures provide twin compressors for chillers over 1500 Tons.
**Plate and Frame Exchanger will be provided for the first stage of cooling during spring, winter, and Fall See Appendix A.4 for cut sheets.
***See Appendix A.6 for option - Combination C and C-1 life cycle cost and optimization.
Combination C
01
23
4
Stage Peak Req'd Tons
Stage Chiller Ton Capacity0
1000
2000
3000
4000
Stage
Tons
Stage Peak Req'd TonsStage Chiller Ton Capacity
WEBER STATE UNIVERSITY CENTRAL CHILLER PLANT STUDYWHW ENGINEERING INC. – 2005
5.2-3

New Central Chilled Water Plant Chiller Combinations: Combination D
Chiller # New/Existing Size (tons) VFDCH-1 New 2000 YesCH-2 Existing 1250 NoCH-3 New 1500 NoCH-4 Existing 650 No
Combination Capacity: 5400
Campus PeakTons Req'd
CombinationCapacity Excess Tons
3647 5400 1753
Stage Chillers Operating StandbyChillers
Stage Chiller TonCapacity
0 0 1,2,3,4 01 1 2,3,4 20002 1,4 2,3 26503 1,2 3,4 32504 1,2,4 3 3900
*Chiller manufactures provide twin compressors for chillers over 1500 Tons.
**Plate and Frame Exchanger will be provided for the first stage of cooling during spring, winter, and Fall See Appendix A.4 for cut sheets.
Combination D
01
23
4
Stage Peak Req'd Tons
Stage Chiller Ton Capacity0
1000
2000
3000
4000
Stage
Tons
Stage Peak Req'd TonsStage Chiller Ton Capacity
WEBER STATE UNIVERSITY CENTRAL CHILLER PLANT STUDYWHW ENGINEERING INC. – 2005
5.2-4

New Central Chilled Water Plant Chiller Combinations: Combination E
Chiller # New/Existing Size (tons) VFDCH-1 New 2000 YesCH-2 Existing 1250 NoCH-3 New 1700 NoCH-4 Existing 650 No
Combination Capacity: 5600
Campus PeakTons Req'd
CombinationCapacity Excess Tons
3647 5600 1953
Stage Chillers Operating StandbyChillers
Stage Chiller TonCapacity
0 0 1,2,3,4 01 1 2,3,4 20002 1,2 3,4 32503 1,3 2,4 37004 1,3,4 2 4350
*Chiller manufactures provide twin compressors for chillers over 1500 Tons.
**Plate and Frame Exchanger will be provided for the first stage of cooling during spring, winter, and Fall See Appendix A.4 for cut sheets.
Combination E
01
23
4
Stage Peak Req'd Tons
Stage Chiller Ton Capacity0
1000
2000
3000
4000
5000
Stage
Tons
Stage Peak Req'd TonsStage Chiller Ton Capacity
WEBER STATE UNIVERSITY CENTRAL CHILLER PLANT STUDYWHW ENGINEERING INC. – 2005
5.2-5

New Central Chilled Water Plant Chiller Combinations: Combination F
Chiller # New/Existing Size (tons) VFDCH-1 New 1700 YesCH-2 Existing 1250 NoCH-3 New 1700 Optional***CH-4 Existing 650 No
Combination Capacity: 5300
Campus PeakTons Req'd
CombinationCapacity Excess Tons
3647 5300 1653
Stage Chillers Operating StandbyChillers
Stage Chiller TonCapacity
0 0 1,2,3,4 01 1 2,3,4 17002 1,2 3,4 29503 1,2,4 3 36004 1,3,4 2 4050
*Chiller manufactures provide twin compressors for chillers over 1500 Tons.
**Plate and Frame Exchanger will be provided for the first stage of cooling during spring, winter, and Fall See Appendix A.4 for cut sheets.
***See Appendix A.6 for option - Combination F and F-1 life cycle cost and optimization.
Combination F
01
23
4
Stage Peak Req'd Tons
Stage Chiller Ton Capacity0
1000
2000
3000
4000
5000
Stage
Tons
Stage Peak Req'd TonsStage Chiller Ton Capacity
WEBER STATE UNIVERSITY CENTRAL CHILLER PLANT STUDYWHW ENGINEERING INC. – 2005
5.2-6

WEBER STATE UNIVERSITY CENTRAL CHILLER PLANT STUDYWHW ENGINEERING INC. – 2005
5.3 -1
5.3 Chiller Combination Cost Comparison
A. Combination A – (Two VFD’s)
Approximate Chiller Cost: $1,043,000Approximate System Part Load Value: 0.320 KW/Ton
Combination A-1 – (One VFD, One Constant)
Approximate Chiller Cost: $998,000Approximate System Part Load Value: 0.352 KW/Ton
B. Combination B
Approximate Chiller Cost: $1,076,000Approximate System Part Load Value: 0.393 KW/Ton
C. Combination C
Approximate Chiller Cost: $957,000Approximate System Part Load Value: 0.329 KW/Ton
D. Combination D
Approximate Chiller Cost: $1,143,000Approximate System Part Load Value: 0.352 KW/Ton
E. Combination E
Approximate Chiller Cost: $1,285,00Approximate System Part Load Value: 0.337 KW/Ton
F. Combination F – (Two VFD’s)
Approximate Chiller Cost: $1,266,000Approximate System Part Load Value: 0.293 KW/Ton
Combination F-1 – (One VFD, One Constant)
Approximate Chiller Cost: $1,197,000Approximate System Part Load Value: 0.336 KW/Ton

WEBER STATE UNIVERSITY CENTRAL CHILLER PLANT STUDYWHW ENGINEERING INC. – 2005
5.4 -1
5.4 Plate and Frame Heat Exchanger (Free Cooling)
A. The campus is preparing to operate the chilled water system year round.One possible option to achieve significant energy savings during coolerperiods such as winter, spring and fall is to use condenser water to coolthe chilled water loop.
B. The condenser water can be used to cool the chilled water loopeffectively through a Plate and Frame Heat Exchanger. The exchangershall be sized for the capacity of the 1st stage chiller, when outdoor airwet bulb temperature is less than the chilled water set-point, minus theapproach temperatures of the heat exchanger and the cooling tower.
C. The cooling tower can bring the condenser water loop temperature closeto the outdoor wet bulb temperature. If the condenser water is used tomaintain the normal chilled water set point of 45 degrees F, then the heatexchanger loop can handle the load when outdoor air wet bulbtemperature is less than 40 degrees F. In Ogden, Utah, this condition istypically available from November through March, including ½ of April and½ of October. This is an overall total of approximately 6 months a yearwhere the chilled water demand could be met without the use of thechillers.
D. See recommendations Section 6.3 for further recommendationsregarding the plate and frame heat exchanger. See section 6.2 B. forassociated pumping recommendations.
E. See Appendix A.4 for preliminary Plate & Frame Heat Exchangerselection.
F. The change over between “free cooling” and mechanical cooling shall beaccomplished automatically using electronic 3-way valves, return watertemperature, and outdoor wet bulb temperature.
G. See Appendix A.6 for energy savings and approximate operating hours.

WEBER STATE UNIVERSITY CENTRAL CHILLER PLANT STUDYWHW ENGINEERING INC. – 2005
5.5 -1
5.5 Thermal / Ice Storage Option
A. Due to the high peak demand cost, Weber State University has askedthat the option for thermal storage be investigated. See Appendix A.5 forproduct literature.
B. The new efficient chillers are much more reliable then their olderpredecessors. See Appendix A.6 for KW/TON for part loadconditions of the chillers.
C. The principle behind chilled water storage is to produce and store iceduring off peak hours for use during the peak hours. This reduces on-peak electrical demand by shifting electrical demand to off-peak hours inorder to obtain on-peak cooling at close to off-peak costs.
D. A common design mistake in using this system is under sizing the chillersso they are unable to handle the connected load when the ice storagesystem is down.
E. The best ice making machines, if this is used in lieu of using the chillers,can produce ice at 0.63 KW/TON.
F. Storage for the ice or chilled water consumes a large amount of realestate.

WEBER STATE UNIVERSITY CENTRAL CHILLER PLANT STUDYWHW ENGINEERING INC. – 2005
6.1 - 1
SECTION 6 – NEW CENTRAL CHILLER PLANT RECOMMENDATIONS
6.1 Recommended Central Chiller Plant Upgrades
A. Recommended Central Chiller Plant Chiller Combinations
1. Combinations “A” and “F” we feel are the best two choices for thenew Central Chilled Water Plant.
2. Combination “A”is recommended for the following reasons:a. Using standard chiller sizes; not using two compressors
with a one pass machine. This will likely achieve a morecompetitive bid and a lower initial cost per Ton.
b. Requires less physical space, leaving more room formaintenance, etc.
c. Even though this combination does not provide 100%back-up, it will provide sufficient back-up capacity (93%).
d. Lower life cycle cost.e. This combination remains one of the more efficient
combinations, although not quite as efficient ascombination “F”.
3. Combination “F” is recommended for the following reasons:a. More efficient (lower SLPV).b. Total 100% back-up without having to install larger chillers.c. Some chiller manufactures can supply the 1700 Ton chiller
using only one compressor; however, some manufactureslike Carrier might have a problem.
4. Life Cycle Cost Analysis
The life cycle cost analysis shows that chiller combination A-1 with1 new 1500 ton chiller with a VFD and 1 new 1500 Ton chillerwithout a VFD is the lowest cost for the 1st 5 years. Typically a lifecycle cost that does not pay back within 5 years is not considered;
Combo Peak kw/ton SPLV Overall AnnualEnergy Cost Initial Cost Payback
Term (yrs)
Combo A 0.425 0.32 $157,389 $1,043,000 5.09Combo A1 0.425 0.352 $166,233 $998,000 0.00Combo F 0.4 0.293 $145,844 $1,197,000 9.76Combo F1 0.405 0.336 $158,508 $1,152,000 19.94
Peak Demand $/KW $8.78Operating $/KW $0.28634Operating Hours/yr 5070
Life Cycle Cost Approximations

WEBER STATE UNIVERSITY CENTRAL CHILLER PLANT STUDYWHW ENGINEERING INC. – 2005
6.1 - 2
however, with energy costs escalating, a payback term of 5.2years is definitely worth considering. Combinations F and F-1 arenot as economical according to the life cycle cost analysis. Theadvantage with combinations F and F-1 is the 100% back-up forall conditions. The University will need to decide which is a higherpriority, the life cycle cost or the 100% back up. Based off of thatdecision, the design team can then proceed with the combinationthat best meets the University's highest priorities.
B. Cooling Tower Addition
1. A five (5) cell Cooling Tower, manufactured by TowerEngineering, Inc. was installed at the end of 2000 and thebeginning of 2001. The cooling tower is located east of parking lotW5 and north of the stadium on the crest of the hill. The totalcooling tower consists of three (3) cells located on the north sideand two (2) cells, with VFD drives, located on the south side.
2. Each of the cooling tower’s five (5) cells has a capacity of 700Tons and 2100 GPM. The total capacity of the cooling tower is3500 Tons and 10,500 GPM.
3. 24” condenser water piping is routed west and underground fromthe tower basin to the existing central chilled water plant located inthe lower floor of the Science Lab Building.
4. The existing cooling tower capacity is not large enough to handlethe new proposed central chilled water plant.
5. Design options were discussed with Tower Engineering, Inc. Thefollowing paragraphs are results of these discussions, as well asour recommendations for adding capacity to the existing tower.
6. Since the installation of the new cooling tower, a maintenanceprocedure was conducted in which the fill was removed, the towercells cleaned, and the fill replaced. The contractor however, didnot install the fill per the manufactures recommendations resultingin lower tower efficiency.
3 Cell Side2 Cell Sidewith VFD
Two underground 24” condenser water piping

WEBER STATE UNIVERSITY CENTRAL CHILLER PLANT STUDYWHW ENGINEERING INC. – 2005
6.1 - 3
7. Tower Engineering, Inc., through their engineering technicalservice department, came up with two options for increasing thecapacity of the existing cooling tower in order to meet theincreased load of the new central chiller plant.
a. Option 1:1) Remove the entire existing ceramic tile from the existing
five (5) cell tower and replace with a new high performancecombination (HPC) ceramic plaster tile that is 30% moreefficient than the existing fill.
2) The HPC fill will increase the existing tower capacity from700 Tons per cell to 900 Tons per cell. The total capacityof the existing tower will increase from 3500 Tons to 4500Tons. New fill shall be installed in accordance with TowerEngineering instructions.
3) If the new HPC fill is used in all five (5) cells, only one (1)additional 900 Ton cell would be required. The retrofittedtower would become a six (6) cell tower with an overallcapacity of 5,400 Tons and 13,200 GPM.
b. Option 2:1) Remove the entire existing ceramic tile from all five (5)
cells and replace with the same tile using the patternapproved by Tower Engineering.
2) The capacity of the cooling tower after the fill is installedproperly is 3,500 Tons and 10,500 GPM.
2) Provide one (1) new 900 Ton cell with the (HPC) tile to theexisting five (5) cells with existing ceramic tile, making thetower into a six (6) cell tower. The tower would then havean overall capacity of 4,400 Tons and 13,200 GPM.
c. The peak capacity of the new condenser water system is4,560 Tons and 10,950 GPM. Option 1 provides 5,400 Tonsand 13,200 GPM, adequately handling the peak demand.Option 2 provides 4,400 Tons and 13,200 GPM which isslightly less than demand in Tons, but adequate for GPM.Option 1 provides back-up if one cell should fail. The excesscapacity in option 1 will also allow for increased chillercapacity.
8. We recommend Option 1 for the following reasons:
Ø 30% more efficient cooling tower.Ø Adequately handles the new system loads.Ø Future available capacity.

WEBER STATE UNIVERSITY CENTRAL CHILLER PLANT STUDYWHW ENGINEERING INC. – 2005
6.1 - 4
9. Cooling Tower capacity summary:
Existing Cooling Tower Capacity Ton GPM700 Tons x 5 cells 3,5002100 GPM x 5 cells 10,500Totals 3,500 10,500
New Modified Tower Capacity Ton GPM900 Tons x 5 cells 4,500New 900 Ton additional cell 9002100 GPM x 5 cells 10,5002700 GPM additional cell 2,700Totals 5,400 13,200
10. We also recommend a modification to the 24” condenser waterpiping from the tower. We recommend a new 24” condenserwater line be routed from the tower basin to the new central chilledwater plant.
11. The two existing 24” condenser water lines routed to the existingcentral chilled water plant, located in the basement of the ScienceLab Building, will be re-used as the chilled water piping in the newscheme.

WEBER STATE UNIVERSITY CENTRAL CHILLER PLANT STUDYWHW ENGINEERING INC. – 2005
6.2 - 1
6.2 Recommended Campus Distribution System Upgrades
A. Campus Piping System Recommendations
1. Piping System Recommendations:
Leave the chilled water distribution system a secondary loop,direct return system from the campus buildings to the centralchilled water plant.a. Direct return piping is the most economical arrangement
because it requires a minimum amount of piping.b. Friction, in the piping, is the principal source of operating
costs in closed water systems. This being the case, adirect return system has less pipe friction than any otherequivalent system.
c. The direct return system is a simple system and the mostefficient pumping system for multiple building systemswith a central chilled water plant.
2. Central plant chiller room piping design guidelines:
a. Provide a primary loop system.b. Install the piping so that the energy consumption of the
chillers is not increased. Chillers are more vulnerable toincorrect installation due to the fact that their energyconsumption is greatly affected by the piping arrangement.
c. Arrange the piping so that all chillers receive the samewater temperature.
d. Insure that the required water flow through the chillers isalways maintained.
e. Install the chillers and piping in accordance with themanufacturer’s instructions and recommendations.
3. Remove and replace the undersized chilled water piping, locatedin the existing campus distribution system noted in Section 4.2 A.
B. Campus Pumping System Recommendations
1. The new central chilled water plant should consist of four (4)chillers and one (1) plate and frame heat exchanger.
2. Primary (Chiller) Pumps: Each chiller and the plate and frameheat exchanger shall have a dedicated primary constant volumein-line pump. The primary pumps, serving the plate and frameexchanger and one (1) of the large chillers, shall have a manualbypass allowing each pump to back up the other in case of pumpfailure.
3. Secondary (Campus) Pumps: The campus loop shall be served bythree (3) base mounted vertical or horizontal split case pumps.

WEBER STATE UNIVERSITY CENTRAL CHILLER PLANT STUDYWHW ENGINEERING INC. – 2005
6.2 - 2
a. Each pump shall be sized for 50% of the overall future netload, or approximately 4377 GPM per pump. The overallhead pressure shall be designed to meet the needs of theSkybox and Kimball buildings. This arrangement allowsone (1) pump to fail, while the remaining pumps stillprovide 100% of the capacity. It will also allow 1 pump tohandle the campus load when the demand is less than50% of the overall peak.
b. Each pump shall have a variable frequency drive. The VFDshall run off a differential static pressure sensor. Thissensor shall be located in the tunnels between theBusiness building and the Student Service Center. Thedifferential pressure shall be set to meet the design flowrates required at the longest runs, which is currently theKimball building. In the future, if pumps are added at thisbuilding, or if another building is added at a longer run,then the differential pressure set-point shall be re-set tomeet the needs at the new longest run.
4. Tertiary (Building) Pumps: The buildings that are connected to thecampus chilled water loop should be modified to be consistentacross campus. Each building should have building chilled waterpumps with variable frequency drives, and two way automaticvalves. In addition:
a. Tertiary pumps should be added at buildings thatcurrently do not have pumps, as well as at all newbuildings. Tertiary pumps shall be repaired or replaced atbuildings where they are already installed. Variablefrequency drives shall be provided for these existing orreplaced pumps. As tertiary pumps are added at the pumppressure critical path (lines with the highest pressurerequirements), the secondary pump differential pressureset-point should be re-adjusted by a qualified Test andBalance Contractor to meet new pressure requirements.This will be determined by setting the differential pressureto maintain design flow at the buildings with the greatestpressure requirements. The buildings with the greatestpressure requirements will be those with the longest runs,and those without tertiary pumping systems.
b. Automatic Bypass: Because of the existing conditions ateach building, the new secondary pumps will be sized forthe current largest pressure requirements. This pressureis adequate to provide the full chilled water flow at mostbuildings, and as a result, their tertiary pumps have beenpermanently bypassed. Existing manual bypasses shall bereplaced with automatic bypasses. Buildings that do notcurrently have a bypass, as well as new buildings, shall beprovided with an automatic bypass. This bypass shall
WEBER STATE UNIVERSITY CENTRAL CHILLER PLANT STUDYWHW ENGINEERING INC. – 2005
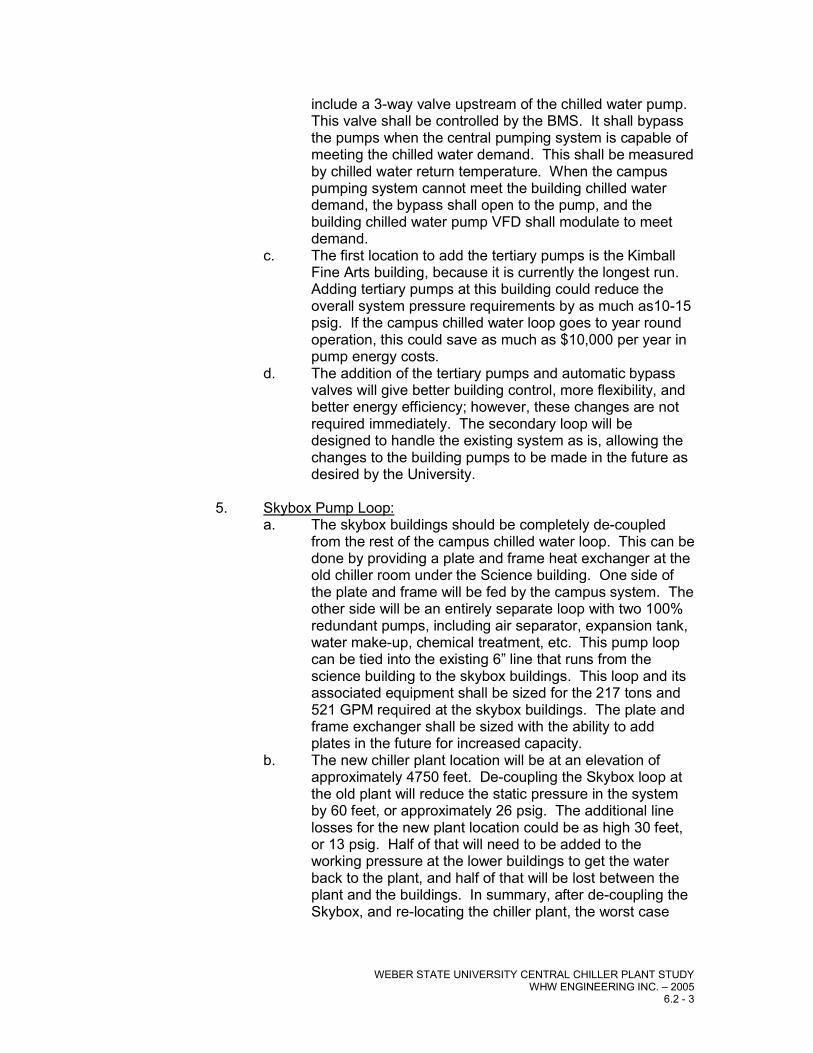
6.2 - 3
include a 3-way valve upstream of the chilled water pump.This valve shall be controlled by the BMS. It shall bypassthe pumps when the central pumping system is capable ofmeeting the chilled water demand. This shall be measuredby chilled water return temperature. When the campuspumping system cannot meet the building chilled waterdemand, the bypass shall open to the pump, and thebuilding chilled water pump VFD shall modulate to meetdemand.
c. The first location to add the tertiary pumps is the KimballFine Arts building, because it is currently the longest run.Adding tertiary pumps at this building could reduce theoverall system pressure requirements by as much as10-15psig. If the campus chilled water loop goes to year roundoperation, this could save as much as $10,000 per year inpump energy costs.
d. The addition of the tertiary pumps and automatic bypassvalves will give better building control, more flexibility, andbetter energy efficiency; however, these changes are notrequired immediately. The secondary loop will bedesigned to handle the existing system as is, allowing thechanges to the building pumps to be made in the future asdesired by the University.
5. Skybox Pump Loop:a. The skybox buildings should be completely de-coupled
from the rest of the campus chilled water loop. This can bedone by providing a plate and frame heat exchanger at theold chiller room under the Science building. One side ofthe plate and frame will be fed by the campus system. Theother side will be an entirely separate loop with two 100%redundant pumps, including air separator, expansion tank,water make-up, chemical treatment, etc. This pump loopcan be tied into the existing 6” line that runs from thescience building to the skybox buildings. This loop and itsassociated equipment shall be sized for the 217 tons and521 GPM required at the skybox buildings. The plate andframe exchanger shall be sized with the ability to addplates in the future for increased capacity.
b. The new chiller plant location will be at an elevation ofapproximately 4750 feet. De-coupling the Skybox loop atthe old plant will reduce the static pressure in the systemby 60 feet, or approximately 26 psig. The additional linelosses for the new plant location could be as high 30 feet,or 13 psig. Half of that will need to be added to theworking pressure at the lower buildings to get the waterback to the plant, and half of that will be lost between theplant and the buildings. In summary, after de-coupling theSkybox, and re-locating the chiller plant, the worst case

WEBER STATE UNIVERSITY CENTRAL CHILLER PLANT STUDYWHW ENGINEERING INC. – 2005
6.2 - 4
scenario total overall pressure at the lower buildings wouldbe approximately 118 – 123 psig.
c. This total overall pressure at the low buildings could befurther reduced by adding the tertiary pumps at the KimballFine Arts Building. Such pumps could reduce the systemworking pressure by an additional 10-15 psig.
6. Condenser Water Pumps: Provide 3 condenser water pumps withvariable frequency drives. These pumps shall be sized for 50% ofthe overall condenser water load. The VFD shall modulate tomaintain minimum flows at each chiller. This shall be coordinatedwith the chiller manufacturer, and integrated into the chillercontrols.

WEBER STATE UNIVERSITY CENTRAL CHILLER PLANT STUDYWHW ENGINEERING INC. – 2005
6.3 - 1
6.3 Plate and Frame Heat Exchanger – Free Cooling
A. We recommend the installation of a plate and frame heat exchanger inthe new central chilled water plant for free cooling.
1. The plate and frame heat exchanger, pumps and piping are to berouted in a parallel bypass circuit with the new chillers. Size theplate and frame for 1500 tons of free cooling at design conditions.The chiller optimizer runs found in Appendix A.6 are veryfavorable for the free cooling option.
2. The Design parameters recommended for free cooling are asfollows:
a. Select plate and frame exchanger at no more than twodegrees F. approach.
b. Pressure drop on chilled water side and condenser waterside through the plate and frame exchanger shall matchthe pressure drop through the chillers.
c. Provide automatic change over between the free cooling(evaporation) and the mechanical chilling cycles. Thereason for the automation is that with automation thesystem will take advantage of every occurrence whenoutdoor conditions are suitable for free cooling.
B. We recommend the following change over sequence:
1. Cycle Changeover (Mechanical to Evaporative) –
a. When wet bulb temperature is less than the chilled waterset point minus the approach temperatures of the plateand frame heat exchanger and cooling tower the followingsequence will occur:1) Chillers are stopped.2) Chilled water pump continues to run.3) Condenser auto valve on lead chiller is open to
plate and frame heat exchanger.4) Cooling tower set point is changed to chilled water
supply set point to cool the condenser water loop.5) When condenser water supply temperature is less
than the chilled water return temperature, the leadchiller’s chilled water auto valve is open to the plateand frame heat exchanger.
2. Cycle Changeover (Evaporative to Mechanical) –
a. When wet bulb temperature plus the approachtemperatures of the plate and frame heat exchanger and

WEBER STATE UNIVERSITY CENTRAL CHILLER PLANT STUDYWHW ENGINEERING INC. – 2005
6.3 - 2
the cooling tower is greater than the chilled water supplyset point, the:1) Lead chiller water auto valve will open to chiller.2) Cooling tower set point will change to the
mechanical cycle set point.3) Lead chiller will start.4) Lead chiller auto damper condenser valve will
modulate to maintain the required head pressure.

WEBER STATE UNIVERSITY CENTRAL CHILLER PLANT STUDYWHW ENGINEERING INC. – 2005
6.4 - 1
6.4 Refrigeration Safety
A. Owner Liability
1. As an owner and user of refrigerants, DFCM, the engineer, andWeber State University are automatically liable for therequirements of ASHREA 15-1994 by being aware of thestandard. In any new chiller equipment rooms, ASHRAE 15-1994automatically applies.
2. ASHREA15-1994 requires that all chilled water plants be providedwith some means for detecting and evacuating refrigerants fromthe space.
B. Room Evacuation and Ventilation
1. The new central cooling plant room must have a mechanicalexhaust system interconnected to the refrigerant detector/sensorso that when the exposure limit of refrigerant is exceeded, analarm will sound and the exhaust fan will activate. The ASHRAEformula for sizing ventilation capacities is Q= 100 x G0.5 where Q=air flow CFM and G= mass of refrigerant in lbs.
C. Emergency Breathing Apparatus
1. A self-contained breathing apparatus (SCBA) must be provided atentrances to the chiller room located on the outside of the room.The SCBA must be worn anytime the sensor has alarmed andsomeone needs to enter the room for any reason.
D. Chiller Room Requirements
1. Provide tight seal doors at any entrance into the new chiller plant.2. All purge lines and relief devices from the chillers shall vent
outside on the roof. Relief discharge must be located not lessthan 20 feet from ventilation openings and not less than 15 feetabove ground level.
3. ASHRAE 15-1994 specifies that access to the chiller room shouldbe restricted to authorized personnel.
4. Provide sensor/detectors in the chiller room at the noted locations:1) between the chillers at floor level.2) Refrigerant storage – floor area.3) Any point lower than floor.
5. Provide requirements noted in paragraph B-1 for chiller roomevacuation.
6. Provide requirements noted in paragraph C-1 for self-containedbreathing apparatus.
E. Refrigerant Storage

WEBER STATE UNIVERSITY CENTRAL CHILLER PLANT STUDYWHW ENGINEERING INC. – 2005
6.4 - 2
1. The total amount of refrigerant stored without relief valves piped inaccordance with ASHRAE 15-1994 standard must not exceed 330pounds.

7.1 A.Item Description Amount Units Materials Labor Cost Total
DemolitionChiller - Carrier 1 LS 3,500.00$ 3,500.00$ 3,500.00$Chiller - 1250 Ton Relocation 1 LS 25,240.00$ 25,240.00$ 25,240.00$Chiller - 650 Ton Relocation 1 LS 20,240.00$ 20,240.00$ 20,240.00$Piping 1 LS 3,000.00$ 3,000.00$ 3,000.00$Pumps, Ex. Tanks, Electrical, ControlsSoftener 1 LS 23,000.00$ 23,000.00$ 23,000.00$
ConcreteConcrete Pads 36 CU. YD. 144.00$ 66.00$ 210.00$ 7,560.00$
Cooling TowerCooling Tower 1 EA 225,000.00$ 100,000.00$ 325,000.00$ 325,000.00$
Meters and GaugesThermometers 40 EA 90.00$ 12.00$ 102.00$ 4,080.00$Pressure Gauges 40 EA 36.00$ 34.00$ 70.00$ 2,800.00$Thermowells 30 EA 32.00$ 25.00$ 57.00$ 1,710.00$
Supports and AnchorsPipe Hangers 96 EA 61.00$ 15.00$ 76.00$ 7,296.00$Pipe Supports 30 EA 200.00$ 7.00$ 207.00$ 6,210.00$Flanges/Wall Supports @ Penetrations 4 EA 920.00$ 203.00$ 1,123.00$ 4,492.00$
ElectricalVFD 250 HP 3 EA 27,380.00$ 3,100.00$ 30,480.00$ 91,440.00$VFD 100 HP 4 EA 11,715.00$ 1,600.00$ 13,315.00$ 53,260.00$VFD 60 HP 1 EA 8,458.00$ 1,425.00$ 9,883.00$ 9,883.00$VFD 30 HP 1 EA 4,675.00$ 975.00$ 5,650.00$ 5,650.00$VFD 20 HP 1 EA 3,300.00$ 735.00$ 4,035.00$ 4,035.00$
Mechanical IdentificationPainting 1 LS 2,500.00$ 1,800.00$ 4,300.00$ 4,300.00$Valve Tags 90 EA 50.00$ 50.00$ 100.00$ 9,000.00$Name Plates 20 EA 40.00$ 60.00$ 100.00$ 2,000.00$
InsulationPump Casings 1 LS 1,800.00$ 600.00$ 2,400.00$ 2,400.00$Chilled Water Piping 800 LF 9.00$ 8.00$ 17.00$ 13,600.00$Equipment 1 LS 1,600.00$ 900.00$ 2,500.00$ 2,500.00$
PlumbingWater Make-Up C/W (all assoc. valves) 1 LS 300.00$ 300.00$ 600.00$ 600.00$Water Piping, Valves, Insulation 1 LS 13,000.00$ 13,000.00$
PumpsCondenser Water - Chilled Water Main -Chilled Water Circulators 10 LS 200,578.00$ 65,968.00$ 266,546.00$ 266,546.00$Sky Box Pumps 2 EA 6,900.00$ 2,000.00$ 8,900.00$ 17,800.00$
Chiller/Equipment1500 Ton Chiller W/VFD 2 EA 521,500.00$ 21,700.00$ 543,200.00$ 1,086,400.00$Air Eliminator 1 EA 30,736.00$ 2,500.00$ 33,236.00$ 33,236.00$Expansion Tank 1 EA 25,147.00$ 1,000.00$ 26,147.00$ 26,147.00$Sky Box Plate & Frame, Piping, Ex. Tank,Air Eliminator 1 LS 45,679.00$ 9,300.00$ 54,979.00$ 54,979.00$
Water TreatmentCondenser Water -Treatment,Chemicals,Pumps,Piping,Valves 1 LS 3,000.00$ 2,000.00$ 5,000.00$ 5,000.00$
Hydronic PipingChilled and Condenser Water Piping &Valves 1 LS 398,000.00$ 398,000.00$
WEBER STATE UNIVERSITYCHILLED WATER STUDY COST ESTIMATE - Preliminary Opinion of Probable Costs
CHILLER PLANT - Combination A
WEBER STATE UNIVERSITY CENTRAL CHILLER PLANT STUDYWHW ENGINEERING INC. – 2005
7.1A-1
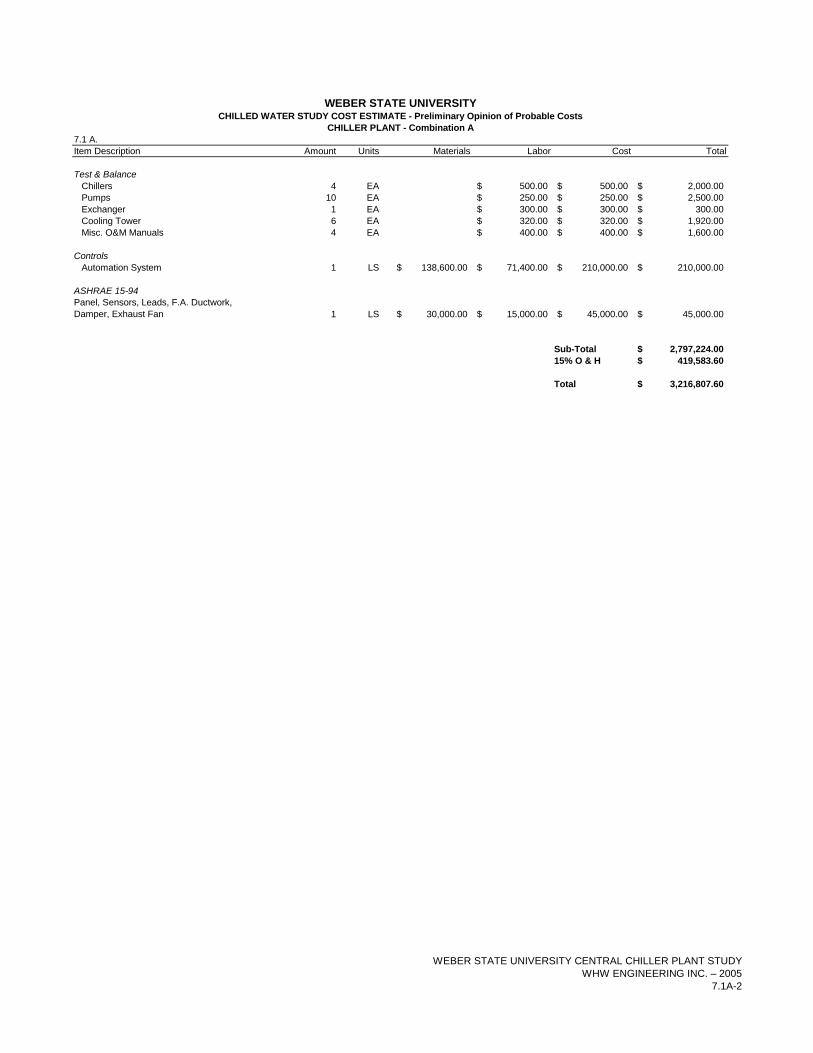
7.1 A.Item Description Amount Units Materials Labor Cost Total
WEBER STATE UNIVERSITYCHILLED WATER STUDY COST ESTIMATE - Preliminary Opinion of Probable Costs
CHILLER PLANT - Combination A
Test & BalanceChillers 4 EA 500.00$ 500.00$ 2,000.00$Pumps 10 EA 250.00$ 250.00$ 2,500.00$Exchanger 1 EA 300.00$ 300.00$ 300.00$Cooling Tower 6 EA 320.00$ 320.00$ 1,920.00$Misc. O&M Manuals 4 EA 400.00$ 400.00$ 1,600.00$
ControlsAutomation System 1 LS 138,600.00$ 71,400.00$ 210,000.00$ 210,000.00$
ASHRAE 15-94Panel, Sensors, Leads, F.A. Ductwork,Damper, Exhaust Fan 1 LS 30,000.00$ 15,000.00$ 45,000.00$ 45,000.00$
Sub-Total 2,797,224.00$15% O & H 419,583.60$
Total 3,216,807.60$
WEBER STATE UNIVERSITY CENTRAL CHILLER PLANT STUDYWHW ENGINEERING INC. – 2005
7.1A-2

7.1 B.Item Description Amount Units Materials Labor Cost Total
DemolitionChiller - Carrier 1 LS 3,500.00$ 3,500.00$ 3,500.00$Chiller - 1250 Ton Relocation 1 LS 25,240.00$ 25,240.00$ 25,240.00$Chiller - 650 Ton Relocation 1 LS 20,240.00$ 20,240.00$ 20,240.00$Piping 1 LS 3,000.00$ 3,000.00$ 3,000.00$Pumps, Ex. Tanks, Electrical, ControlsSoftener 1 LS 23,000.00$ 23,000.00$ 23,000.00$
ConcreteConcrete Pads 36 CU. YD. 144.00$ 66.00$ 210.00$ 7,560.00$
Cooling TowerCooling Tower 1 EA 100,000.00$ 225,000.00$ 325,000.00$ 325,000.00$
Meters and GaugesThermometers 40 EA 90.00$ 12.00$ 102.00$ 4,080.00$Pressure Gauges 40 EA 36.00$ 34.00$ 70.00$ 2,800.00$Thermowells 30 EA 32.00$ 25.00$ 57.00$ 1,710.00$
Supports and AnchorsPipe Hangers 96 EA 61.00$ 15.00$ 76.00$ 7,296.00$Pipe Supports 30 EA 200.00$ 7.00$ 207.00$ 6,210.00$Flanges/Wall Supports @ Penetrations 4 EA 920.00$ 203.00$ 1,123.00$ 4,492.00$
ElectricalVFD 250 HP 3 EA 27,380.00$ 3,100.00$ 30,480.00$ 91,440.00$VFD 100 HP 4 EA 11,715.00$ 1,600.00$ 13,315.00$ 53,260.00$VFD 60 HP 1 EA 8,458.00$ 1,425.00$ 9,883.00$ 9,883.00$VFD 30 HP 1 EA 4,675.00$ 975.00$ 5,650.00$ 5,650.00$VFD 20 HP 1 EA 3,300.00$ 735.00$ 4,035.00$ 4,035.00$
Mechanical IdentificationPainting 1 LS 2,500.00$ 1,800.00$ 4,300.00$ 4,300.00$Valve Tags 90 EA 50.00$ 50.00$ 100.00$ 9,000.00$Name Plates 20 EA 40.00$ 60.00$ 100.00$ 2,000.00$
InsulationPump Casings 1 LS 1,800.00$ 600.00$ 2,400.00$ 2,400.00$Chilled Water Piping 800 LF 9.00$ 10.00$ 19.00$ 15,200.00$Equipment 1 LS 1,600.00$ 1,000.00$ 2,600.00$ 2,600.00$
PlumbingWater Make-Up C/W (all assoc. valves) 1 LS 300.00$ 300.00$ 600.00$ 600.00$Water Piping, Valves, Insulation 1 LS 13,000.00$ 13,000.00$
PumpsCondenser Water - Chilled Water Main -Chilled Water Circulators 10 LS 200,578.00$ 65,968.00$ 266,546.00$ 266,546.00$Sky Box Pumps 2 EA 6,900.00$ 2,000.00$ 8,900.00$ 17,800.00$
Chiller/Equipment1700 Ton Chiller W/VFD 2 EA 609,000.00$ 24,000.00$ 633,000.00$ 1,266,000.00$Air Eliminator 1 EA 30,736.00$ 2,500.00$ 33,236.00$ 33,236.00$Expansion Tank 1 EA 25,147.00$ 1,000.00$ 26,147.00$ 26,147.00$Sky Box Plate & Frame, Piping, Ex. Tank,Air Eliminator 1 LS 45,679.00$ 9,300.00$ 54,979.00$ 54,979.00$
Water TreatmentCondenser Water -Treatment,Chemicals,Pumps,Piping,Valves 1 LS 3,000.00$ 2,000.00$ 5,000.00$ 5,000.00$
Hydronic PipingChilled and Condenser Water Piping &Valves 1 LS 420,000.00$ 420,000.00$
WEBER STATE UNIVERSITYCHILLED WATER STUDY COST ESTIMATE - Preliminary Opinion of Probable Costs
CHILLER PLANT - Combination F
WEBER STATE UNIVERSITY CENTRAL CHILLER PLANT STUDYWHW ENGINEERING INC. – 2005
7.1B-1

7.1 B.Item Description Amount Units Materials Labor Cost Total
WEBER STATE UNIVERSITYCHILLED WATER STUDY COST ESTIMATE - Preliminary Opinion of Probable Costs
CHILLER PLANT - Combination F
Test & BalanceChillers 4 EA 500.00$ 500.00$ 2,000.00$Pumps 10 EA 250.00$ 250.00$ 2,500.00$Exchanger 1 EA 300.00$ 300.00$ 300.00$Cooling Tower 6 EA 320.00$ 320.00$ 1,920.00$Misc. O&M Manuals 4 EA 400.00$ 400.00$ 1,600.00$
ControlsAutomation System 1 LS 138,600.00$ 71,400.00$ 210,000.00$ 210,000.00$
ASHRAE 15-94Panel, Sensors, Leads, F.A. Ductwork,Damper, Exhaust Fan 1 LS 30,000.00$ 15,000.00$ 45,000.00$ 45,000.00$
Sub-Total 3,000,524.00$15% O & H 450,078.60$
Total 3,450,602.60$
WEBER STATE UNIVERSITY CENTRAL CHILLER PLANT STUDYWHW ENGINEERING INC. – 2005
7.1B-2

7.2Item Description Amount Units Materials Labor Cost Total
Supports and AnchorsPipe Hangers 10 EA 61.00$ 15.00$ 76.00$ 760.00$
Mechanical IdentificationValve Tags 8 EA 50.00$ 50.00$ 100.00$ 800.00$Name Plates 2 EA 40.00$ 60.00$ 100.00$ 200.00$
InsulationChilled Water Piping 160 LF 9.00$ 8.00$ 17.00$ 2,720.00$
ExchangerPlate & Frame Exchanger 1 EA 90,000.00$ 11,000.00$ 101,000.00$ 101,000.00$
Hydronic PipingChilled Water 160 LF 88.00$ 48.00$ 136.00$ 21,760.00$Condenser Water 160 LF 88.00$ 48.00$ 136.00$ 21,760.00$
Test & BalanceCooling Tower 6 EA 320.00$ 320.00$ 1,920.00$Condenser Water System 1 EA 300.00$ 300.00$ 300.00$
ControlsChilled Water System 1 LS 2,000.00$ 3,000.00$ 5,000.00$ 5,000.00$Condenser Water System 1 LS 3,300.00$ 3,700.00$ 7,000.00$ 7,000.00$
Sub-Total 163,220.00$15% O & H 24,483.00$
Total 187,703.00$
WEBER STATE UNIVERSITYCHILLED WATER STUDY COST ESTIMATE - Preliminary Opinion of Probable Costs
Plate & Frame Exchanger (Free Cooling) Recommendation
WEBER STATE UNIVERSITY CENTRAL CHILLER PLANT STUDYWHW ENGINEERING INC. – 2005
7.2-1

7.3Item Description Amount Units Materials Labor Cost Total
DemolitionPiping 1 LS 10,000.00$ 10,000.00$ 10,000.00$
Mechanical IdentificationPainting 1 LS 200.00$ 200.00$ 400.00$ 400.00$Valve Tags 1 EA 50.00$ 50.00$ 100.00$ 100.00$
InsulationChilled Water Piping 1000 LF 9.00$ 8.00$ 17.00$ 17,000.00$
Water TreatmentFlushing and Filling 1 LS 1,000.00$ 900.00$ 1,900.00$ 1,900.00$
Hydronic PipingChilled and Condenser Water Piping &Valves 1000 LF 100.00$ 60.00$ 160.00$ 160,000.00$
Sub-Total 189,400.00$15% O & H 28,410.00$
Total 217,810.00$
WEBER STATE UNIVERSITYCHILLED WATER STUDY COST ESTIMATE - Preliminary Opinion of Probable Costs
Campus Piping System For Future Connected Load
WEBER STATE UNIVERSITY CENTRAL CHILLER PLANT STUDYWHW ENGINEERING INC. – 2005
7.3-1

7.4Combination AItem Description Sub-Total 15% O & H Total
Chiller PlantChiller Plant - Combination A 2,797,224.00$ 419,583.60$ 3,216,807.60$
Plate & Frame RecommendationPlate & Frame Exchanger (Free Cooling) 163,220.00$ 24,483.00$ 187,703.00$
Campus Piping System For Future Connected LoadFuture Connected Load 189,400.00$ 28,410.00$ 217,810.00$
3,149,844.00$ 472,476.60$ 3,622,320.60$
Sub-Total 3,149,844.00$15% O & H 472,476.60$
Total 3,622,320.60$
Combination FItem Description Sub-Total 15% O & H Total
Chiller PlantChiller Plant - Combination F 3,000,524.00$ 450,078.60$ 3,450,602.60$
Plate & Frame RecommendationPlate & Frame Exchanger (Free Cooling) 163,220.00$ 24,483.00$ 187,703.00$
Campus Piping System For Future Connected LoadFuture Connected Load 189,400.00$ 28,410.00$ 217,810.00$
3,353,144.00$ 502,971.60$ 3,856,115.60$
Sub-Total 3,353,144.00$15% O & H 502,971.60$
Total 3,856,115.60$
WEBER STATE UNIVERSITYCHILLED WATER STUDY COST ESTIMATE - Preliminary Opinion of Probable Costs
New Campus Chilled Water System Summary
WEBER STATE UNIVERSITY CENTRAL CHILLER PLANT STUDYWHW ENGINEERING INC. – 2005
7.4-1

Building Directory
1. B1 Building 12. B2 Building 23. B3 Building 34. B4 Building 46. SL Science Lab7. LL Lind Lecture10. MA Miller Administration12. IB Information Booth14. SS Social Science15. WB Wattis Business16. ED McKay Education18. HP Heat Plant20. CS Campus Services22. TE Technical Education23. ET Engineering Technology26. FM Facilities Management27. SR Stores and Receiving/ Mail Room31. ST Stewart Bell Tower34. MH Marriott Health35. SC Student Service Center36. SU Shepherd Union37. LI Stewart Library38. BC Browning Center39. LP Lampros Hall40. KA Kimball Visual Arts Center50. SG Swenson Building51. SB Stromberg Center52. SD Stromberg Stadium Offices54. WR Stromberg Strength Training55. SK Stewart Stadium Sky Suites56. TR Davidson Track Locker Rooms63. AL Lindquist Alumni Center70. WH Wasatch Hall72. SH Stansbury Hall74. LS LaSal Hall76. PT Promontory Tower100. DC Dee Events Center110. VC Village Community Center111-115. V1-5 University Village
Annex Directory
Annex 1 Police AcademyAnnex 2 English Annex 4 PoliceAnnex 5 Parking and Environmental Health & SafetyAnnex 8 English/ESLAnnex 9 Wilderness RecreationAnnex 10 Upward BoundAnnex 11 ROTCAnnex 12 Skills Enhancement CenterAnnex 13 Athletics
Parking Lots
A1 A1 Permit and Visitor MetersA2 A2 Permit and Visitor MetersA3 A3 PermitA4 A4 PermitA5 A5 PermitA6 A6 PermitA7 A7 PermitA8 A8 PermitA9 A9 PermitA10 A10 PermitA11 A11 PermitDC Dee Center A,W and R Permits (Shuttle Available)PPL Public Pay LotR2 Residence Halls/W and A PermitsR3 Residence Halls/W and A PermitsR4 Residence Halls and A PermitsS1 Children's School PermitW1-9 W, R/W and A Permits
Non-campus Buildings
CU Weber State Credit UnionOI Ogden LDS InstituteNC Newman CenterIS Ice Sheet
Disabled Access
WEBER STATE UNIVERSITY - OGDEN
20052006
Campus Route
University Village and Campus Route
Express Route
Shuttle-bus Stops
Weber State University3850 University CircleOgden, UT 84408801-626-6000weber.edu
Ride the Wildcat Express Shuttle.
All Weber State University parking is by permit only. You can buy a $20 pass and always find a place to park in one of the 3,000 available spaces at the Dee Events Center. The shuttle leaves every five minutes from 7 a.m. to 2 p.m. and every 20 minutes from2 - 6 p.m. From 6-11 p.m., you can call 543-1439 for shuttle service times.
1 B1
2 B2
3 B3
4 B4
15 WB
14 SS
10 MA
12 IB
31 ST
35 SC
36 SU
37 LI
39 LP
38 BC
51 PE
34 MH
52 SD
56 TR
Stewart Stadium
55 SK
54 WR
23 ET
22 TE
26 FM27 SR
20 CS
18 HP
6 SL7 LL
50 SG
100 DC
40 KA
63 AL
76 PT
74 LH
70 WH
110 VC
111 V5
112 V4
113 V3
114 V1
115 V2
72 SH
16 ED
ANNEX 2
Quad Pond
ANNEX 11
ANNEX 12
ANNEX 10
ANNEX 4
ANNEX 1
ANNEX 5
ANNEX 13ANNEX 9
PE Play Field
PT Play Field
ANNEX 8
W5
W3
W4
W1
W2
A2
A1
S1
PPL
A6
A8
W9
A7
F1
R2
R3
R4
A11
A10
W8
A9
W7
A3A4
A5
HARRISON BLVD
DIXON DRIVE
EDVA
LSON
SKYLINE DRIVE SKYLINE DRIVE
TAYLOR AVE.
TAYLOR AVE.
4100 SOUTH
4600 SOUTH
4200 SOUTH
TO WSU
IS
CU
OI
NC

A.2 REFERENCES

A.2 References
A. References Used:
1. ASHRAE2. Weber State University3. Carrier Corporation4. The Trane Company5. Mueller Corporation6. Bell & Gossett7. RS Means Cost Data – 20058. Johnson Controls9. Tower Engineering10. Cameron Hydraulic Data11. Current Industry Standards12. Field Investigation

A.3 POTENTIAL NEW CHILLER COMPUTER RUN PERFORMANCE DATA


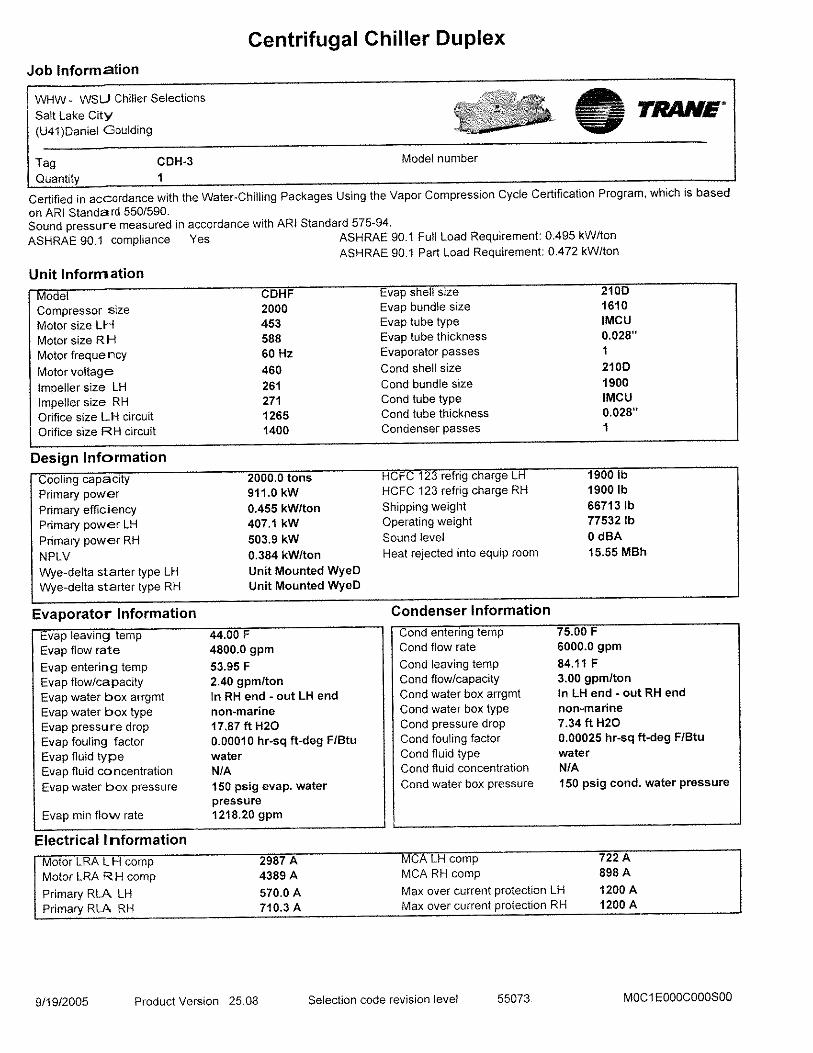


Evergreen Chiller Performance OutputsProject Name: WHW Weber State 09/20/2005 Sales Office: USAirconditioning Distributors 10:34 AM
Tag Name: 1500 Ton with VFD
Chiller Chiller Model 19XR-8787592ELS64 Starter / VFD VFD - Freestanding Refrigerant Type R-134a Cooler Size 87 Waterbox Type Nozzle-in-Head, 150 psi Passes 2 Tubing Turbo-EDE2 (TBE2), .025 in, Copper Fluid Type Fresh Water Fouling Factor (hr-sqft-F)/BTU 0.00010 Compressor Size 592 Flow Controls Float Valve Size 15 Flasc Orifice 73
Weights Total Rigging Weight 42895 lb Total Operating Weight 49784 lb Refrigerant Weight 2800 lb Condenser Size 87 Waterbox Type Nozzle-in-Head, 150 psi Passes 2 Tubing Spike Fin III (SPK3), .025 in, Copper Fluid Type Fresh Water Fouling Factor (hr-sqft-F)/BTU 0.00025 Motor Size ELS Line Voltage/Hertz 460-3-60
Output Type Full Load Part Load Part Load Part Load
Percent Load 100.00 75.00 50.00 25.00
Chiller Capacity 1,500 Tons 1,125 Tons 750 Tons 375 Tons
Chiller Input kW 723 kW 384 kW 186 kW 142 kW
Chiller Input Power 0.482 kW/Ton 0.342 kW/Ton 0.248 kW/Ton 0.378 kW/Ton
NPLV 0.296 kW/Ton
Cooler
Entering Temp. 54.0 F 51.5 F 49.0 F 46.5 F
Leaving Temp. 44.0 F 44.0 F 44.0 F 44.0 F
Flow Rate 3595.8 gpm 3595.8 gpm 3595.8 gpm 3595.8 gpm
Pressure Drop 34.5 ft wg 34.7 ft wg 34.8 ft wg 35.0 ft wg
Condenser
Leaving Temp. 85.0 F 77.3 F 69.7 F 67.5 F
Entering Temp. 75.0 F 70.0 F 65.0 F 65.0 F
Flow Rate 4101.0 gpm 4101.0 gpm 4101.0 gpm 4101.0 gpm
Pressure Drop 30.6 ft wg 31.0 ft wg 31.5 ft wg 31.5 ft wg
Motor
Motor Input Power 706 kW 375 kW 180 kW 137 kW
Motor RLA 1066 688 422 356
Motor OLTA 1151
Motor LRDA 6686
Chiller RLA 996 554 307 252
Chiller Inrush Amps 996
Max Fuse/CB Amps 2000
Min Circuit Ampacity 1244
Messages:
( 1) Certified in accordance with the ARI Water-Chilling Packages using the Vapor Compression Cycle Certification Program, which is based on ARI Standard 550/590-2003.
Evergreen Chiller Builder v4.14 Page 1 of 1

Evergreen Chiller Performance OutputsProject Name: WHW Weber State 09/20/2005 Sales Office: USAirconditioning Distributors 10:35 AM
Tag Name: 1500 Ton Constant Volume
Chiller Chiller Model 19XR-8787592ELS64 Starter / VFD Starter - Freestanding Refrigerant Type R-134a Cooler Size 87 Waterbox Type Nozzle-in-Head, 150 psi Passes 2 Tubing Turbo-EDE2 (TBE2), .025 in, Copper Fluid Type Fresh Water Fouling Factor (hr-sqft-F)/BTU 0.00010 Compressor Size 592 Flow Controls Float Valve Size 15 Flasc Orifice 73
Weights Total Rigging Weight 42895 lb Total Operating Weight 49784 lb Refrigerant Weight 2800 lb Condenser Size 87 Waterbox Type Nozzle-in-Head, 150 psi Passes 2 Tubing Spike Fin III (SPK3), .025 in, Copper Fluid Type Fresh Water Fouling Factor (hr-sqft-F)/BTU 0.00025 Motor Size ELS Line Voltage/Hertz 460-3-60
Output Type Full Load Part Load Part Load Part Load
Percent Load 100.00 75.00 50.00 25.00
Chiller Capacity 1,500 Tons 1,125 Tons 750 Tons 375 Tons
Chiller Input kW 686 kW 479 kW 334 kW 216 kW
Chiller Input Power 0.458 kW/Ton 0.426 kW/Ton 0.446 kW/Ton 0.577 kW/Ton
NPLV 0.449 kW/Ton
Cooler
Entering Temp. 54.0 F 51.5 F 49.0 F 46.5 F
Leaving Temp. 44.0 F 44.0 F 44.0 F 44.0 F
Flow Rate 3595.8 gpm 3595.8 gpm 3595.8 gpm 3595.8 gpm
Pressure Drop 34.5 ft wg 34.7 ft wg 34.8 ft wg 35.0 ft wg
Condenser
Leaving Temp. 85.0 F 77.5 F 70.0 F 67.6 F
Entering Temp. 75.0 F 70.0 F 65.0 F 65.0 F
Flow Rate 4084.6 gpm 4084.6 gpm 4084.6 gpm 4084.6 gpm
Pressure Drop 30.3 ft wg 30.8 ft wg 31.2 ft wg 31.3 ft wg
Motor
Motor Input Power 685 kW 478 kW 333 kW 215 kW
Motor RLA 998 742 579 473
Motor OLTA 1078
Motor LRYA 2106
Motor LRDA 6686
Max Fuse/CB Amps 2000
Min Circuit Ampacity 1247
Messages:
( 1) Certified in accordance with the ARI Water-Chilling Packages using the Vapor Compression Cycle Certification Program, which is based on ARI Standard 550/590-2003.
Evergreen Chiller Builder v4.14 Page 1 of 1

A.4 PLATE AND FRAME HEAT EXCHANGER INFORMATION

ITT Heat Transfer Plate & Frame Specification
WHW Item: 6001
PHE-Type P100-350-TKTM-20 Hot side Cold sideFlowrate (g.p.m.) 3600.01 3596.20Inlet temperature (°F) 55.00 40.00Outlet temperature (°F) 45.00 50.00Pressure drop (PSI) 10.02 10.02Heat exchanged (Btu/h) 18061369 Thermodynamic proporties: Water Water Density (Lb/Ft³) 62.37 62.39Specific heat (Btu/Lb*F) 1.00 1.00Thermal conductivity (Btu/h*Ft*F) 0.34 0.33Mean viscosity (cP) 1.32 1.43Wall viscosity (cP) 1.43 1.32LMTD (Ft²*h*F/kBtu)Excess Surface % 0.00 Inlet branch F1 F3Outlet branch F4 F2
Design of Frame / Plates: Plate arrangement (passes*channel) 1 x 174 + 0 x 0Plate arrangement (passes*channel) 1 x 175 + 0 x 0Number of plates 350Effective heat surface (Ft²) 3,745.84Overall K-value Duty/Clean (Btu/Ft²*h*F) 961.90 961.90 Plate material 0.0197 inch AISI 304 Gasket material NITRIL LOCKMax. working temperature (°F) 230.00Working/test pressure (PSI) 150.00 195.00 Liquid volume (Ft³) 29.32Carry Bar Length (Ft) 8.20 Max. No. of Plates 413Net weight (Lb)Frame type ISConnections HOT side : 8.00 '' Unlined studded port,150 # ANSI Connections COLD side: 8.00 '' Unlined studded port,150 # ANSI
ITT Heat Transfer 175 Standard Parkway Cheektowaga, NY Tel: 800-447-7700 Fax: 716-897-1777
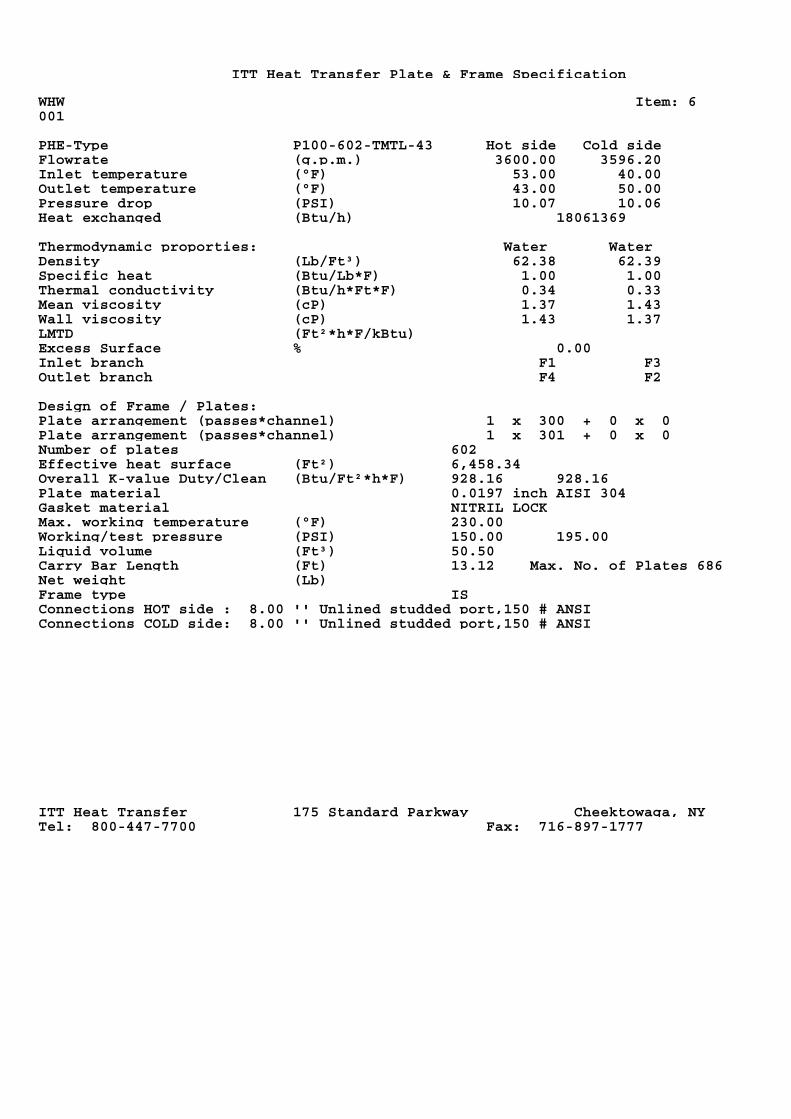
ITT Heat Transfer Plate & Frame Specification
WHW Item: 6001
PHE-Type P100-602-TMTL-43 Hot side Cold sideFlowrate (g.p.m.) 3600.00 3596.20Inlet temperature (°F) 53.00 40.00Outlet temperature (°F) 43.00 50.00Pressure drop (PSI) 10.07 10.06Heat exchanged (Btu/h) 18061369 Thermodynamic proporties: Water Water Density (Lb/Ft³) 62.38 62.39Specific heat (Btu/Lb*F) 1.00 1.00Thermal conductivity (Btu/h*Ft*F) 0.34 0.33Mean viscosity (cP) 1.37 1.43Wall viscosity (cP) 1.43 1.37LMTD (Ft²*h*F/kBtu)Excess Surface % 0.00 Inlet branch F1 F3Outlet branch F4 F2
Design of Frame / Plates: Plate arrangement (passes*channel) 1 x 300 + 0 x 0Plate arrangement (passes*channel) 1 x 301 + 0 x 0Number of plates 602Effective heat surface (Ft²) 6,458.34Overall K-value Duty/Clean (Btu/Ft²*h*F) 928.16 928.16 Plate material 0.0197 inch AISI 304 Gasket material NITRIL LOCKMax. working temperature (°F) 230.00Working/test pressure (PSI) 150.00 195.00 Liquid volume (Ft³) 50.50Carry Bar Length (Ft) 13.12 Max. No. of Plates 686Net weight (Lb)Frame type ISConnections HOT side : 8.00 '' Unlined studded port,150 # ANSI Connections COLD side: 8.00 '' Unlined studded port,150 # ANSI
ITT Heat Transfer 175 Standard Parkway Cheektowaga, NY Tel: 800-447-7700 Fax: 716-897-1777


MUELLER ACCU-THERMPLATE HEAT EXCHANGER SPECIFICATION SHEET
PMC Spec. No.: 90430-01.01 Sales Manager: /TB
Ref No.: Date: 19 September, 2005
Design Data: Hot Side: Cold Side:
Heat Transfer Media: Water Water
Volume Flow Rate: 3600.0 3595.0 GPM
Mass Flow Rate: 1801851.1 1799664.6 LB/HR
Inlet Temperature: 55.0 40.0 °F
Outlet Temperature: 45.0 50.0 °F
Density 8.34 8.35 LB/GAL
Specific Heat: 1.001 1.003 BTU/LB F
Viscosity: 1.30 1.41 CPS
Thermal Conductivity: 0.334 0.330 BTU/FT H F
Pressure Drop: 10.1 10.2 PSI
Operating Pressure: 50 50 PSI G
Heat Transfer Rate: 18040736 BTU/H
Log Mean Temp Diff: 5.0 °F
Operating U-Value: 348 BTU/FT2 H F
Heat Transfer Area (All Frames): 10355.3 FT2
Mechanical Description:
Frame: Plate:
Type B-20 Carbon Steel
Design Code ASME Section VIII, DIV. 1
Design Pressure 100 PSI G
Design Temp. Max/Min 150 °F / 32°F
Test Pressure 130 PSI G
Frames In Parallel/Series/Total 2/ 1/ 2
A-Dim. Min./Max. 55.73/ 59.64 Inch
Overall Length 124.64 Inch
Overall Width 34.88 Inch
Overall Height 104.50 Inch
Guide Bar Length 120.00 Inch
Compression Bolt Length 96.00 Inch
Weight Operating/Empty 9390/ 5876 LB
Type 120M H
Plate Material 0.4 MM 304 S/S
Plates/Frame 404
Passes-H/C 1/1
Channels-H/C 201/202
Gasket Material NBR
Connections Location
Hot In 6.00 Inch 316L S/S Studded 1F
Hot Out 6.00 Inch 316L S/S Studded 4F
Cold In 6.00 Inch 316L S/S Studded 3F
Cold Out 6.00 Inch 316L S/S Studded 2F
Notes:Aluminum shroud omittedThe purchaser of the equipment bears total responsibility for suitability of use of all materials in this application.We may have assumed some design values. If they differ from your requirements, a new design may be necessary.

MUELLER ACCU-THERMPLATE HEAT EXCHANGER SPECIFICATION SHEET
PMC Spec. No.: 90430-01.01 Sales Manager: /TB
Ref No.: Date: 19 September, 2005
Design Data: Hot Side: Cold Side:
Heat Transfer Media: Water Water
Volume Flow Rate: 3600.0 3595.0 GPM
Mass Flow Rate: 1801851.1 1799664.6 LB/HR
Inlet Temperature: 55.0 40.0 °F
Outlet Temperature: 45.0 50.0 °F
Density 8.34 8.35 LB/GAL
Specific Heat: 1.001 1.003 BTU/LB F
Viscosity: 1.30 1.41 CPS
Thermal Conductivity: 0.334 0.330 BTU/FT H F
Pressure Drop: 10.1 10.2 PSI
Operating Pressure: 50 50 PSI G
Heat Transfer Rate: 18040736 BTU/H
Log Mean Temp Diff: 5.0 °F
Operating U-Value: 534 BTU/FT2 H F
Heat Transfer Area (All Frames): 6749.0 FT2
Mechanical Description:
Frame: Plate:
Type B-20 Carbon Steel
Design Code ASME Section VIII, DIV. 1
Design Pressure 100 PSI G
Design Temp. Max/Min 150 °F / 32°F
Test Pressure 130 PSI G
Frames In Parallel/Series/Total 2/ 1/ 2
A-Dim. Min./Max. 36.42/ 38.98 Inch
Overall Length 88.63 Inch
Overall Width 34.88 Inch
Overall Height 104.50 Inch
Guide Bar Length 84.00 Inch
Compression Bolt Length 78.00 Inch
Weight Operating/Empty 7890/ 5593 LB
Type 120M HV
Plate Material 0.4 MM 304 S/S
Plates/Frame 264
Passes-H/C 1/1
Channels-H/C 131/132
Gasket Material NBR
Connections Location
Hot In 6.00 Inch 316L S/S Studded 1F
Hot Out 6.00 Inch 316L S/S Studded 4F
Cold In 6.00 Inch 316L S/S Studded 3F
Cold Out 6.00 Inch 316L S/S Studded 2F
Notes:Aluminum shroud omittedThe purchaser of the equipment bears total responsibility for suitability of use of all materials in this application.We may have assumed some design values. If they differ from your requirements, a new design may be necessary.
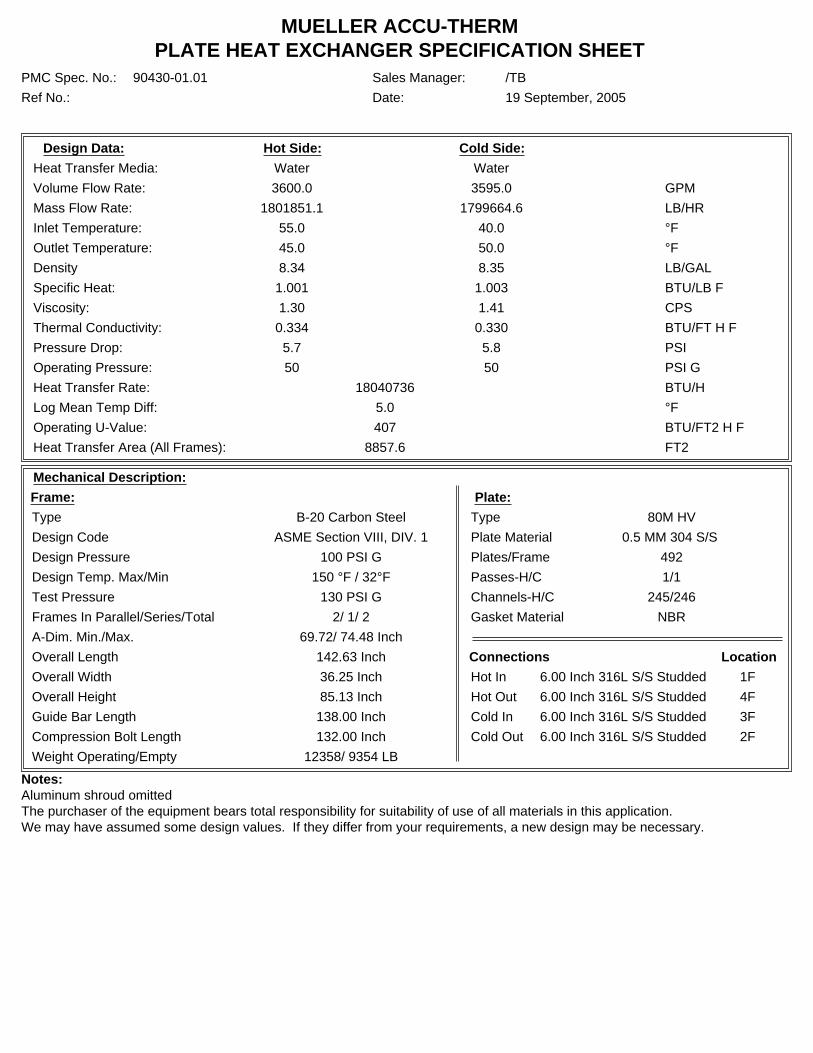
MUELLER ACCU-THERMPLATE HEAT EXCHANGER SPECIFICATION SHEET
PMC Spec. No.: 90430-01.01 Sales Manager: /TB
Ref No.: Date: 19 September, 2005
Design Data: Hot Side: Cold Side:
Heat Transfer Media: Water Water
Volume Flow Rate: 3600.0 3595.0 GPM
Mass Flow Rate: 1801851.1 1799664.6 LB/HR
Inlet Temperature: 55.0 40.0 °F
Outlet Temperature: 45.0 50.0 °F
Density 8.34 8.35 LB/GAL
Specific Heat: 1.001 1.003 BTU/LB F
Viscosity: 1.30 1.41 CPS
Thermal Conductivity: 0.334 0.330 BTU/FT H F
Pressure Drop: 5.7 5.8 PSI
Operating Pressure: 50 50 PSI G
Heat Transfer Rate: 18040736 BTU/H
Log Mean Temp Diff: 5.0 °F
Operating U-Value: 407 BTU/FT2 H F
Heat Transfer Area (All Frames): 8857.6 FT2
Mechanical Description:
Frame: Plate:
Type B-20 Carbon Steel
Design Code ASME Section VIII, DIV. 1
Design Pressure 100 PSI G
Design Temp. Max/Min 150 °F / 32°F
Test Pressure 130 PSI G
Frames In Parallel/Series/Total 2/ 1/ 2
A-Dim. Min./Max. 69.72/ 74.48 Inch
Overall Length 142.63 Inch
Overall Width 36.25 Inch
Overall Height 85.13 Inch
Guide Bar Length 138.00 Inch
Compression Bolt Length 132.00 Inch
Weight Operating/Empty 12358/ 9354 LB
Type 80M HV
Plate Material 0.5 MM 304 S/S
Plates/Frame 492
Passes-H/C 1/1
Channels-H/C 245/246
Gasket Material NBR
Connections Location
Hot In 6.00 Inch 316L S/S Studded 1F
Hot Out 6.00 Inch 316L S/S Studded 4F
Cold In 6.00 Inch 316L S/S Studded 3F
Cold Out 6.00 Inch 316L S/S Studded 2F
Notes:Aluminum shroud omittedThe purchaser of the equipment bears total responsibility for suitability of use of all materials in this application.We may have assumed some design values. If they differ from your requirements, a new design may be necessary.

MUELLER ACCU-THERMPLATE HEAT EXCHANGER SPECIFICATION SHEET
PMC Spec. No.: 90430-01.01 Sales Manager: /TB
Ref No.: Date: 19 September, 2005
Design Data: Hot Side: Cold Side:
Heat Transfer Media: Water Water
Volume Flow Rate: 3600.0 3595.0 GPM
Mass Flow Rate: 1801851.1 1799664.6 LB/HR
Inlet Temperature: 55.0 40.0 °F
Outlet Temperature: 45.0 50.0 °F
Density 8.34 8.35 LB/GAL
Specific Heat: 1.001 1.003 BTU/LB F
Viscosity: 1.30 1.41 CPS
Thermal Conductivity: 0.334 0.330 BTU/FT H F
Pressure Drop: 7.6 7.7 PSI
Operating Pressure: 50 50 PSI G
Heat Transfer Rate: 18040736 BTU/H
Log Mean Temp Diff: 5.0 °F
Operating U-Value: 437 BTU/FT2 H F
Heat Transfer Area (All Frames): 8258.7 FT2
Mechanical Description:
Frame: Plate:
Type B-20 Carbon Steel
Design Code ASME Section VIII, DIV. 1
Design Pressure 100 PSI G
Design Temp. Max/Min 150 °F / 32°F
Test Pressure 130 PSI G
Frames In Parallel/Series/Total 4/ 1/ 4
A-Dim. Min./Max. 43.98/ 46.81 Inch
Overall Length 105.89 Inch
Overall Width 26.75 Inch
Overall Height 85.50 Inch
Guide Bar Length 102.00 Inch
Compression Bolt Length 96.00 Inch
Weight Operating/Empty 5856/ 4430 LB
Type 60M HV
Plate Material 0.5 MM 304 S/S
Plates/Frame 310
Passes-H/C 1/1
Channels-H/C 154/155
Gasket Material NBR
Connections Location
Hot In 4.00 Inch 316L S/S Studded 1F
Hot Out 4.00 Inch 316L S/S Studded 4F
Cold In 4.00 Inch 316L S/S Studded 3F
Cold Out 4.00 Inch 316L S/S Studded 2F
Notes:Aluminum shroud omittedThe purchaser of the equipment bears total responsibility for suitability of use of all materials in this application.We may have assumed some design values. If they differ from your requirements, a new design may be necessary.

A.5 THERMAL/ICE STORAGE INFORMATION


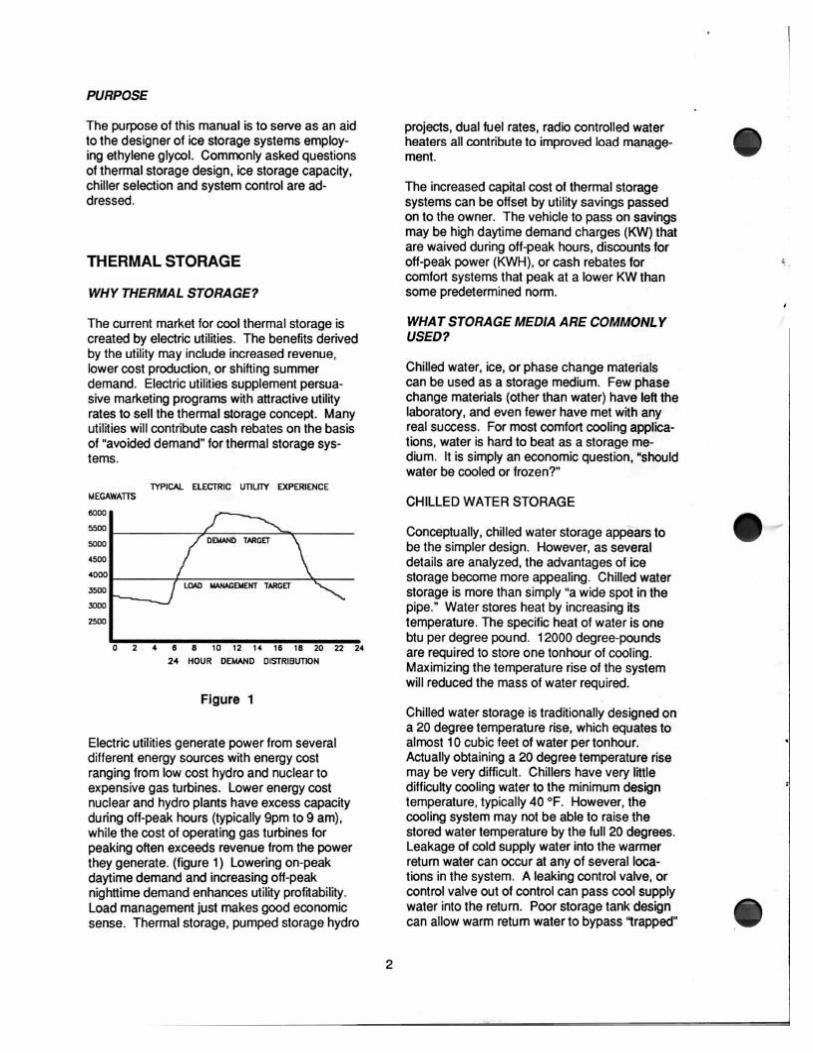


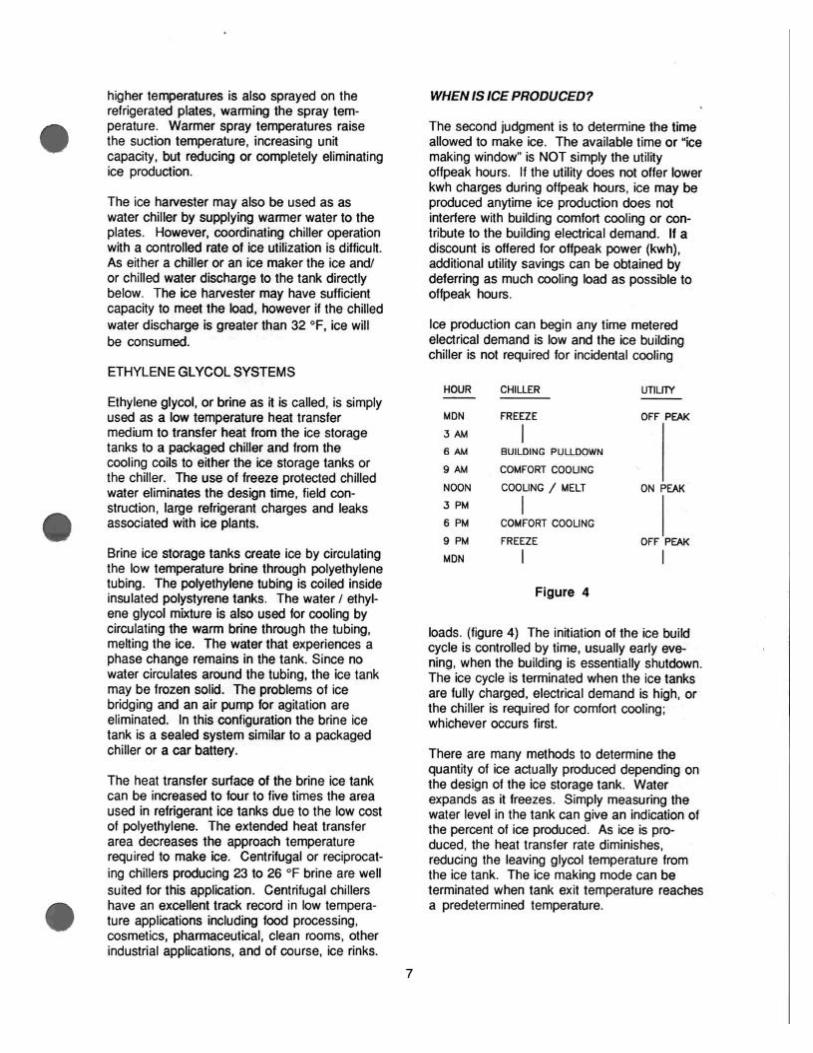


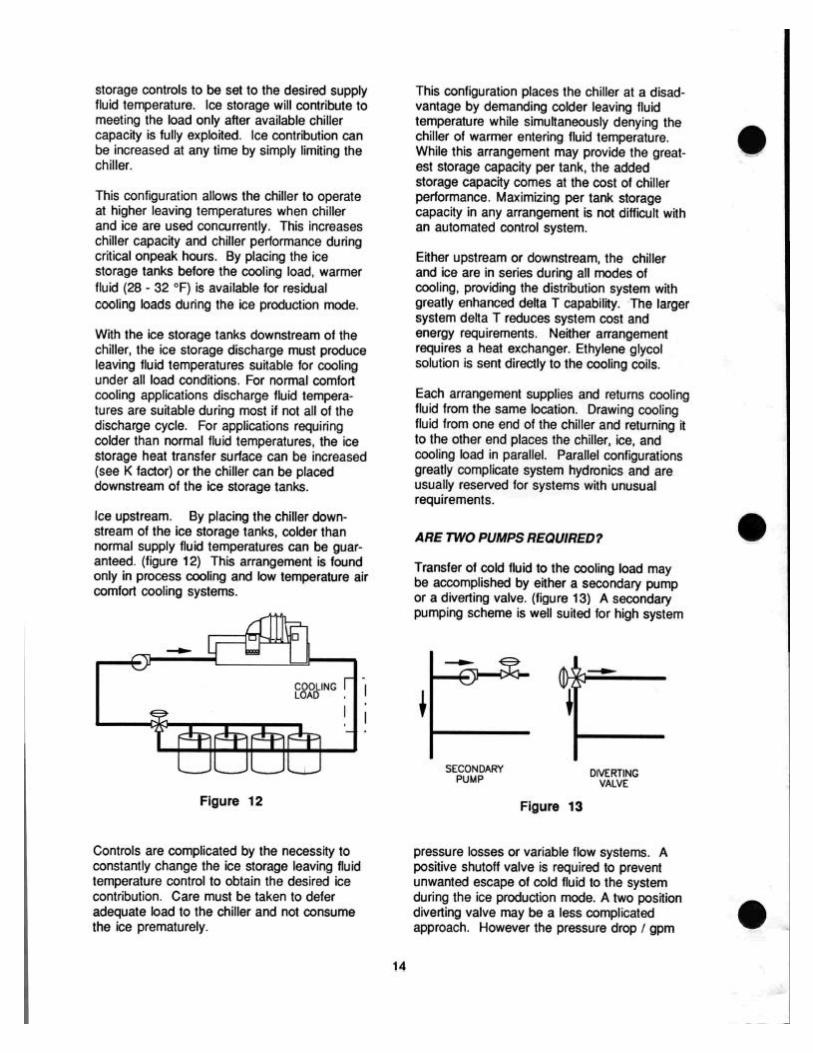


A.6 CHILLER LIFE CYCLE AND OPTIMIZER COMPUTER RUNS / ECONOMIC ANALYSIS

5 Year Constant Dollar Cost Model
Chiller Combination ATwo new 1500 with vfds
Approximate Energy Cost
Chilled Water Condenser Water Tons KW/Ton KW Hours kWH Demand Cost Energy Use CostLWT ْF EWT ْF EWT ْF LWT ْF $8.78/kW/month $0.0286340/kWH
44 54 80 3647 0.425 1549.98 82 127098 $27,217.56 $3,639.3244 54 75 3282 0.406 1332.61 245 326490.4 $9,348.7344 54 80 2954 0.386 1140.27 263 299891.3 $20,023.16 $8,587.0944 54 75 2659 0.4 1063.47 313 332864.6 $9,531.2544 54 75 2393 0.372 890.12 392 348927.2 $7,815.26 $9,991.1844 54 70 2154 0.343 738.656 517 381885.3 $10,934.9044 54 75 1938 0.317 614.398 525 322559.2 $5,394.42 $9,236.1644 54 70 1744 0.287 500.628 575 287861.2 $8,242.6244 54 70 1570 0.273 428.586 721 309010.9 $8,848.2244 54 65 1413 0.267 377.25 685 258416.5 $7,399.5044 54 65 1272 0.29 368.773 752 277317.1 $3,237.82 $7,940.70
Annual Energy Cost $157,387.875 Year Energy Cost: $786,939.37Chiller Purchase Price: 1,043,000
5 Year Life Cycle Evaluation Total: $1,829,939.37

System PLV ReportProject: Weber State Chiller University 09/15/2005Prepared By: 03:46 PM
1. Executive SummarySystem Part Load Value (SPLV): PLV
Comination A 0.320 kW/TonIPLV or NPLV (ARI 550/590-1998):
Carrier 1500 Ton VFD 0.296 kW/TonTrane 1250 0.354 kW/TonCarrier 1500 Ton VFD 0.296 kW/TonTrane 650 0.354 kW/Ton
2. Input Data Summary
WeatherCity Salt Lake City, UtahSchedule On All Day: Weekday
On All Day: SaturdayOn All Day: Sunday
LoadsUser-Defined Load Profile
Chiller SystemName Comination AChillers in Plant 4Plant Control SequencedFull Load LCHWT 44.0 FTower Configuration One Tower for SystemCooling Tower 6 Cell Tower(1)
Detailed Cooling Tower ModelFree Cooling Plate-Frame Heat Exchanger
Sequence Chiller Name FL Capacity (Tons)
Full Load Power
CH-1 Carrier 1500 Ton VFD 1,500 0.482 kW/TonCH-2 Trane 1250 1,250 0.473 kW/TonCH-3 Carrier 1500 Ton VFD 1,500 0.482 kW/TonCH-4 Trane 650 650 0.473 kW/Ton
Chiller System Optimizer v2.02 Page 1

System PLV ReportProject: Weber State Chiller University 09/15/2005Prepared By: 03:46 PM
3. Chiller System Operating ConditionsBin Temp (F) Bin MCWB
(F)Building Load
(%)Building Load
(Tons)Chillers On Chiller Load
(%)97.5 61.5 100 4,900 4 10092.5 60.5 95 4,667 4 9587.5 59.5 90 4,433 4 9082.5 57.9 86 4,200 3 9977.5 55.9 81 3,967 3 9372.5 54.2 76 3,734 3 8867.5 51.9 71 3,500 3 8262.5 49.5 67 3,267 3 7757.5 47.1 62 3,034 3 7152.5 43.8 57 2,800 3 6647.5 40.4 42 2,067 2 7542.5 36.9 37 1,834 0 037.5 33.4 33 1,601 0 032.5 29.4 28 1,367 0 027.5 25.1 23 1,134 0 022.5 20.8 18 901 0 017.5 16.0 14 667 0 012.5 11.2 9 434 0 0
7.5 5.9 4 201 0 0
Chiller System Optimizer v2.02 Page 2

System PLV ReportProject: Weber State Chiller University 09/15/2005Prepared By: 03:46 PM
4a. Chiller System PerformanceCH-1 CH-2 CH-3
Bin Temp
(F)
Load (Tons)
(kW/Ton)
Lchwt (F)
Cond Temp
(F)
Load (Tons)
(kW/Ton)
Lchwt (F)
Cond Temp
(F)
Load (Tons)
(kW/Ton)
Lchwt (F)
Cond Temp
(F)97.5 1,500 0.433 44.00 67.52 1,250 0.412 44.00 67.52 1,500 0.433 44.00 67.5292.5 1,429 0.411 44.00 66.44 1,190 0.398 44.00 66.44 1,429 0.411 44.00 66.4487.5 1,357 0.386 44.00 65.35 1,131 0.384 44.00 65.35 1,357 0.386 44.00 65.3582.5 1,482 0.408 44.00 63.78 1,235 0.379 44.00 63.78 1,482 0.408 44.00 63.7877.5 1,400 0.377 44.00 61.81 1,167 0.358 44.00 61.81 1,400 0.377 44.00 61.8172.5 1,318 0.344 44.00 60.06 1,098 0.341 44.00 60.06 1,318 0.344 44.00 60.0667.5 1,235 0.308 44.00 57.77 1,029 0.337 44.00 57.77 1,235 0.308 44.00 57.7762.5 1,153 0.267 44.00 55.35 961 0.333 44.00 55.35 1,153 0.267 44.00 55.3557.5 1,071 0.248 44.00 55.00 892 0.334 44.00 55.00 1,071 0.248 44.00 55.0052.5 988 0.237 44.00 55.00 824 0.338 44.00 55.00 988 0.237 44.00 55.0047.5 1,128 0.256 44.00 55.00 940 0.331 44.00 55.00 0 0.000 44.00 n/a42.5 0 0.000 44.00 n/a 0 0.000 44.00 n/a 0 0.000 44.00 n/a37.5 0 0.000 44.00 n/a 0 0.000 44.00 n/a 0 0.000 44.00 n/a32.5 0 0.000 44.00 n/a 0 0.000 44.00 n/a 0 0.000 44.00 n/a27.5 0 0.000 44.00 n/a 0 0.000 44.00 n/a 0 0.000 44.00 n/a22.5 0 0.000 44.00 n/a 0 0.000 44.00 n/a 0 0.000 44.00 n/a17.5 0 0.000 44.00 n/a 0 0.000 44.00 n/a 0 0.000 44.00 n/a12.5 0 0.000 44.00 n/a 0 0.000 44.00 n/a 0 0.000 44.00 n/a
7.5 0 0.000 44.00 n/a 0 0.000 44.00 n/a 0 0.000 44.00 n/a
Minimum ECWT condition has been reached for chiller(s): CH-1, CH-2, CH-3Tower cycling assumed to hold minimum ECWT.
Chiller System Optimizer v2.02 Page 3
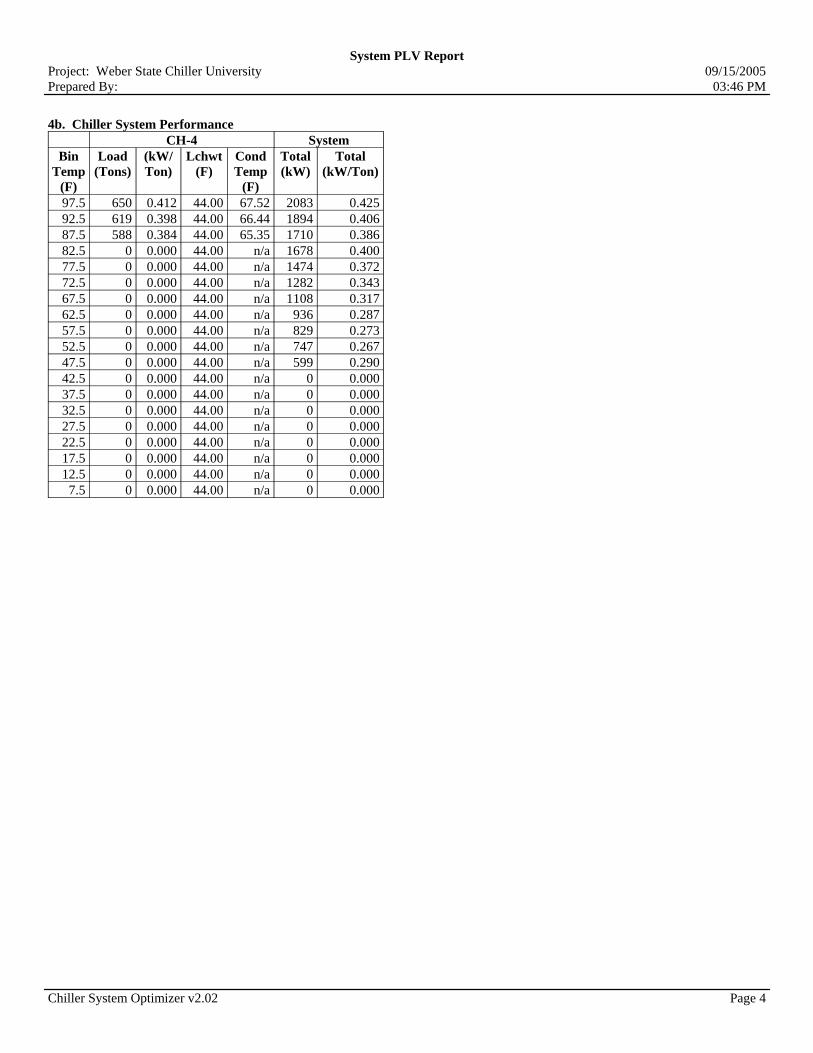
System PLV ReportProject: Weber State Chiller University 09/15/2005Prepared By: 03:46 PM
4b. Chiller System PerformanceCH-4 System
Bin Temp
(F)
Load (Tons)
(kW/Ton)
Lchwt (F)
Cond Temp
(F)
Total (kW)
Total (kW/Ton)
97.5 650 0.412 44.00 67.52 2083 0.42592.5 619 0.398 44.00 66.44 1894 0.40687.5 588 0.384 44.00 65.35 1710 0.38682.5 0 0.000 44.00 n/a 1678 0.40077.5 0 0.000 44.00 n/a 1474 0.37272.5 0 0.000 44.00 n/a 1282 0.34367.5 0 0.000 44.00 n/a 1108 0.31762.5 0 0.000 44.00 n/a 936 0.28757.5 0 0.000 44.00 n/a 829 0.27352.5 0 0.000 44.00 n/a 747 0.26747.5 0 0.000 44.00 n/a 599 0.29042.5 0 0.000 44.00 n/a 0 0.00037.5 0 0.000 44.00 n/a 0 0.00032.5 0 0.000 44.00 n/a 0 0.00027.5 0 0.000 44.00 n/a 0 0.00022.5 0 0.000 44.00 n/a 0 0.00017.5 0 0.000 44.00 n/a 0 0.00012.5 0 0.000 44.00 n/a 0 0.000
7.5 0 0.000 44.00 n/a 0 0.000
Chiller System Optimizer v2.02 Page 4

System PLV ReportProject: Weber State Chiller University 09/15/2005Prepared By: 03:46 PM
5. SPLV WorksheetBin Temp
(F)Building Load (%)
Building Load
(Tons)
Cooling Hours
Cooling (Ton-hrs)
Bin Wgt Factor
System (kW/Ton)
Bin Ratio
97.5 100 4,900 82 401,800 0.0238 0.425 0.056092.5 95 4,667 245 1,143,345 0.0677 0.406 0.166887.5 90 4,433 263 1,165,992 0.0690 0.386 0.179082.5 86 4,200 313 1,314,645 0.0778 0.400 0.194877.5 81 3,967 392 1,555,008 0.0921 0.372 0.247872.5 76 3,734 517 1,930,256 0.1143 0.343 0.332967.5 71 3,500 525 1,837,650 0.1088 0.317 0.343762.5 67 3,267 575 1,878,525 0.1112 0.287 0.388357.5 62 3,034 721 2,187,308 0.1295 0.273 0.474052.5 57 2,800 685 1,918,293 0.1136 0.267 0.425947.5 42 2,067 752 1,554,459 0.0920 0.290 0.317542.5 37 1,834 776 0 0.0000 0.000 0.000037.5 33 1,601 857 0 0.0000 0.000 0.000032.5 28 1,367 828 0 0.0000 0.000 0.000027.5 23 1,134 671 0 0.0000 0.000 0.000022.5 18 901 221 0 0.0000 0.000 0.000017.5 14 667 135 0 0.0000 0.000 0.000012.5 9 434 70 0 0.0000 0.000 0.0000
7.5 4 201 132 0 0.0000 0.000 0.0000Total: 5,070 16,887,281 1.0000 3.1267
Bin Wgt Factor = Bin Ton-hrs / Total Ton-hrsBin Ratio = [Bin Wgt Factor] / [System kW/Ton]SPLV = 1 / [sum of Bin Ratios]SPLV = 1 / [3.1267] = 0.320 kW/Ton
6. Procedure for Calculating IPLV for Chillers
Procedure for Calculating IPLV for Water-Cooled Electric ChillersChiller
Load (%)LCHWT
(F)Cond
Temp (F)Wgt
FactorChiller
(kW/Ton)Bin Ratio
100 44.00 85.00 0.01 A 0.01/A75 44.00 75.00 0.42 B 0.42/B50 44.00 65.00 0.45 C 0.45/C25 44.00 65.00 0.12 D 0.12/D
Total: 1.00
IPLV = 1 / [sum of Bin Ratios]IPLV = 1 / [0.10/A + 0.42/B + 0.45/C + 0.12/D]per ARI Standard 550/590-1998
Chiller System Optimizer v2.02 Page 5

Custom PLV Factors ReportProject: Weber State Chiller University 09/15/2005Prepared By: 03:46 PM
1. Summary of Custom Weighting Factors and ECWTsCustom Weighting Factors Custom Entering Condenser
Temperatures (F)Chiller 25% 50% 75% 100% 25% 50% 75% 100%CH-1 - Carrier 1500 Ton VFD 0.000 0.000 0.558 0.442 n/a n/a 55.6 63.0CH-2 - Trane 1250 0.000 0.000 0.588 0.412 n/a n/a 55.5 63.0CH-3 - Carrier 1500 Ton VFD 0.000 0.000 0.558 0.442 n/a n/a 55.6 63.0CH-4 - Trane 650 0.000 0.000 0.000 1.000 n/a n/a n/a 66.1
2. Input Data Summary
WeatherCity Salt Lake City, UtahSchedule On All Day: Weekday
On All Day: SaturdayOn All Day: Sunday
LoadsUser-Defined Load Profile
Chiller SystemName Comination AChillers in Plant 4Plant Control SequencedFull Load LCHWT 44.0 FTower Configuration One Tower for SystemCooling Tower 6 Cell Tower(1)
Detailed Cooling Tower ModelFree Cooling Plate-Frame Heat Exchanger
Sequence Chiller Name FL Capacity (Tons)
Full Load Power
CH-1 Carrier 1500 Ton VFD 1,500 0.482 kW/TonCH-2 Trane 1250 1,250 0.473 kW/TonCH-3 Carrier 1500 Ton VFD 1,500 0.482 kW/TonCH-4 Trane 650 650 0.473 kW/Ton
Chiller System Optimizer v2.02 Page 1

Custom PLV Factors ReportProject: Weber State Chiller University 09/15/2005Prepared By: 03:46 PM
3. Chiller System Operating ConditionsBin Temp (F) Bin MCWB
(F)Building Load
(%)Building Load
(Tons)Chillers On Chiller Load
(%)97.5 61.5 100 4,900 4 10092.5 60.5 95 4,667 4 9587.5 59.5 90 4,433 4 9082.5 57.9 86 4,200 3 9977.5 55.9 81 3,967 3 9372.5 54.2 76 3,734 3 8867.5 51.9 71 3,500 3 8262.5 49.5 67 3,267 3 7757.5 47.1 62 3,034 3 7152.5 43.8 57 2,800 3 6647.5 40.4 42 2,067 2 7542.5 36.9 37 1,834 0 037.5 33.4 33 1,601 0 032.5 29.4 28 1,367 0 027.5 25.1 23 1,134 0 022.5 20.8 18 901 0 017.5 16.0 14 667 0 012.5 11.2 9 434 0 0
7.5 5.9 4 201 0 0
Chiller System Optimizer v2.02 Page 2

Custom PLV Factors ReportProject: Weber State Chiller University 09/15/2005Prepared By: 03:46 PM
4a. Custom PLV Worksheet for CH-1 (Carrier 1500 Ton VFD)
Avg DB Cond Temp Total CWH Total Load Load 25% Bin 50% Bin 75% Bin 100% Bin(F) (F) (Hrs) (Ton-hrs) (Tons) (%) (CWH) (Ton-hrs) (CWH) (Ton-hrs) (CWH) (Ton-hrs) (CWH) (Ton-hrs)
97.5 67.5 82 5,537 123,000 1,500 100 0 0 0 0 0 0 5,537 123,00092.5 66.4 245 16,279 350,004 1,429 95 0 0 0 0 0 0 16,279 350,00487.5 65.3 263 17,187 356,936 1,357 90 0 0 0 0 0 0 17,187 356,93682.5 63.8 313 19,964 463,992 1,482 99 0 0 0 0 0 0 19,964 463,99277.5 61.8 392 24,229 548,826 1,400 93 0 0 0 0 0 0 24,229 548,82672.5 60.1 517 31,049 681,267 1,318 88 0 0 0 0 0 0 31,049 681,26767.5 57.8 525 30,328 648,582 1,235 82 0 0 0 0 30,328 648,582 0 062.5 55.3 575 31,824 663,009 1,153 77 0 0 0 0 31,824 663,009 0 057.5 55.0 721 39,655 771,991 1,071 71 0 0 0 0 39,655 771,991 0 052.5 55.0 685 37,675 677,045 988 66 0 0 0 0 37,675 677,045 0 047.5 55.0 752 41,360 847,887 1,128 75 0 0 0 0 41,360 847,887 0 042.5 n/a 0 0 0 0 0 0 0 0 0 0 0 0 037.5 n/a 0 0 0 0 0 0 0 0 0 0 0 0 032.5 n/a 0 0 0 0 0 0 0 0 0 0 0 0 027.5 n/a 0 0 0 0 0 0 0 0 0 0 0 0 022.5 n/a 0 0 0 0 0 0 0 0 0 0 0 0 017.5 n/a 0 0 0 0 0 0 0 0 0 0 0 0 012.5 n/a 0 0 0 0 0 0 0 0 0 0 0 0 0
7.5 n/a 0 0 0 0 0 0 0 0 0 0 0 0 0Totals: 5,070 295,086 6,132,540 0 0 0 0 180,842 3,608,514 114,244 2,524,026
Chiller System Optimizer v2.02 Page 3

Custom PLV Factors ReportProject: Weber State Chiller University 09/15/2005Prepared By: 03:46 PM
4b. Custom PLV Worksheet for CH-2 (Trane 1250)
Avg DB Cond Temp Total CWH Total Load Load 25% Bin 50% Bin 75% Bin 100% Bin(F) (F) (Hrs) (Ton-hrs) (Tons) (%) (CWH) (Ton-hrs) (CWH) (Ton-hrs) (CWH) (Ton-hrs) (CWH) (Ton-hrs)
97.5 67.5 82 5,537 102,500 1,250 100 0 0 0 0 0 0 5,537 102,50092.5 66.4 245 16,279 291,670 1,190 95 0 0 0 0 0 0 16,279 291,67087.5 65.3 263 17,187 297,447 1,131 90 0 0 0 0 0 0 17,187 297,44782.5 63.8 313 19,964 386,660 1,235 99 0 0 0 0 0 0 19,964 386,66077.5 61.8 392 24,229 457,355 1,167 93 0 0 0 0 0 0 24,229 457,35572.5 60.1 517 31,049 567,723 1,098 88 0 0 0 0 0 0 31,049 567,72367.5 57.8 525 30,328 540,485 1,029 82 0 0 0 0 30,328 540,485 0 062.5 55.3 575 31,824 552,507 961 77 0 0 0 0 31,824 552,507 0 057.5 55.0 721 39,655 643,326 892 71 0 0 0 0 39,655 643,326 0 052.5 55.0 685 37,675 564,204 824 66 0 0 0 0 37,675 564,204 0 047.5 55.0 752 41,360 706,572 940 75 0 0 0 0 41,360 706,572 0 042.5 n/a 0 0 0 0 0 0 0 0 0 0 0 0 037.5 n/a 0 0 0 0 0 0 0 0 0 0 0 0 032.5 n/a 0 0 0 0 0 0 0 0 0 0 0 0 027.5 n/a 0 0 0 0 0 0 0 0 0 0 0 0 022.5 n/a 0 0 0 0 0 0 0 0 0 0 0 0 017.5 n/a 0 0 0 0 0 0 0 0 0 0 0 0 012.5 n/a 0 0 0 0 0 0 0 0 0 0 0 0 0
7.5 n/a 0 0 0 0 0 0 0 0 0 0 0 0 0Totals: 5,070 295,086 5,110,450 0 0 0 0 180,842 3,007,095 114,244 2,103,355Cust Wgt Factors: 0.000 0.000 0.588 0.412Custom Entering Condenser Temperatures (F): n/a n/a 55.5 63.0
Chiller System Optimizer v2.02 Page 4

Custom PLV Factors ReportProject: Weber State Chiller University 09/15/2005Prepared By: 03:46 PM
4c. Custom PLV Worksheet for CH-3 (Carrier 1500 Ton VFD)
Avg DB Cond Temp Total CWH Total Load Load 25% Bin 50% Bin 75% Bin 100% Bin(F) (F) (Hrs) (Ton-hrs) (Tons) (%) (CWH) (Ton-hrs) (CWH) (Ton-hrs) (CWH) (Ton-hrs) (CWH) (Ton-hrs)
97.5 67.5 82 5,537 123,000 1,500 100 0 0 0 0 0 0 5,537 123,00092.5 66.4 245 16,279 350,004 1,429 95 0 0 0 0 0 0 16,279 350,00487.5 65.3 263 17,187 356,936 1,357 90 0 0 0 0 0 0 17,187 356,93682.5 63.8 313 19,964 463,992 1,482 99 0 0 0 0 0 0 19,964 463,99277.5 61.8 392 24,229 548,826 1,400 93 0 0 0 0 0 0 24,229 548,82672.5 60.1 517 31,049 681,267 1,318 88 0 0 0 0 0 0 31,049 681,26767.5 57.8 525 30,328 648,582 1,235 82 0 0 0 0 30,328 648,582 0 062.5 55.3 575 31,824 663,009 1,153 77 0 0 0 0 31,824 663,009 0 057.5 55.0 721 39,655 771,991 1,071 71 0 0 0 0 39,655 771,991 0 052.5 55.0 685 37,675 677,045 988 66 0 0 0 0 37,675 677,045 0 047.5 n/a 0 0 0 0 0 0 0 0 0 0 0 0 042.5 n/a 0 0 0 0 0 0 0 0 0 0 0 0 037.5 n/a 0 0 0 0 0 0 0 0 0 0 0 0 032.5 n/a 0 0 0 0 0 0 0 0 0 0 0 0 027.5 n/a 0 0 0 0 0 0 0 0 0 0 0 0 022.5 n/a 0 0 0 0 0 0 0 0 0 0 0 0 017.5 n/a 0 0 0 0 0 0 0 0 0 0 0 0 012.5 n/a 0 0 0 0 0 0 0 0 0 0 0 0 0
7.5 n/a 0 0 0 0 0 0 0 0 0 0 0 0 0Totals: 4,318 253,726 5,284,653 0 0 0 0 139,482 2,760,627 114,244 2,524,026
Chiller System Optimizer v2.02 Page 5

Custom PLV Factors ReportProject: Weber State Chiller University 09/15/2005Prepared By: 03:46 PM
4d. Custom PLV Worksheet for CH-4 (Trane 650)
Avg DB Cond Temp Total CWH Total Load Load 25% Bin 50% Bin 75% Bin 100% Bin(F) (F) (Hrs) (Ton-hrs) (Tons) (%) (CWH) (Ton-hrs) (CWH) (Ton-hrs) (CWH) (Ton-hrs) (CWH) (Ton-hrs)
97.5 67.5 82 5,537 53,300 650 100 0 0 0 0 0 0 5,537 53,30092.5 66.4 245 16,279 151,668 619 95 0 0 0 0 0 0 16,279 151,66887.5 65.3 263 17,187 154,672 588 90 0 0 0 0 0 0 17,187 154,67282.5 n/a 0 0 0 0 0 0 0 0 0 0 0 0 077.5 n/a 0 0 0 0 0 0 0 0 0 0 0 0 072.5 n/a 0 0 0 0 0 0 0 0 0 0 0 0 067.5 n/a 0 0 0 0 0 0 0 0 0 0 0 0 062.5 n/a 0 0 0 0 0 0 0 0 0 0 0 0 057.5 n/a 0 0 0 0 0 0 0 0 0 0 0 0 052.5 n/a 0 0 0 0 0 0 0 0 0 0 0 0 047.5 n/a 0 0 0 0 0 0 0 0 0 0 0 0 042.5 n/a 0 0 0 0 0 0 0 0 0 0 0 0 037.5 n/a 0 0 0 0 0 0 0 0 0 0 0 0 032.5 n/a 0 0 0 0 0 0 0 0 0 0 0 0 027.5 n/a 0 0 0 0 0 0 0 0 0 0 0 0 022.5 n/a 0 0 0 0 0 0 0 0 0 0 0 0 017.5 n/a 0 0 0 0 0 0 0 0 0 0 0 0 012.5 n/a 0 0 0 0 0 0 0 0 0 0 0 0 0
7.5 n/a 0 0 0 0 0 0 0 0 0 0 0 0 0Totals: 590 39,002 359,641 0 0 0 0 0 0 39,002 359,641Cust Wgt Factors: 0.000 0.000 0.000 1.000Custom Entering Condenser Temperatures (F): n/a n/a n/a 66.1
Chiller System Optimizer v2.02 Page 6

Custom PLV Factors ReportProject: Weber State Chiller University 09/15/2005Prepared By: 03:46 PM
KEY for Custom PLV Worksheet table(s):[Avg DB] = Midpoint temperature for bin.[Cond Temp] = Entering condenser temperature for bin. Entering water temperature for water-cooled chillers. Entering air temperature for air-cooled chillers.[Tot Hrs] = Hours of operation in bin.[CWH] = Condenser temperature hours. [Tot Hrs] times [Cond Temp]. Later used to derive the four average entering condenser temperature values for the PLV calculation.[Load] = Chiller load for bin.[Load (%)] = Chiller load as a percentage of full load capacity.[Total (Ton-hrs)] = Chiller [Load] times [Tot Hrs]. Later used to derive the four weighting factors for the PLV calculation.[Bin (CWH)] = [CWH] values separated into the four PLV bins: 25%, 50%, 75% and 100% load according to chiller load for each bin.[Bin (Ton-hrs)] = Values separated into the four PLV bins: 25%, 50%, 75% and 100% load according to the chiller load for each bin.[Cust Wgt Factor] = The four custom PLV weighting factors. [Total (Ton-hrs)] for PLV Bin divided by [Total (Ton-hrs)] for the chiller.[Cust Ent Cond Temps] = The four custom condenser temperature values for the PLV calculation = [Total (CWH)] for PLV bin divided by [Tot Hrs] in the PLV bin.
5a. Average Weighting Factors and Entering Condenser Temperatures (CH-1, CH-3)
25% Bin 50% Bin 75% Bin 100% BinChiller Hrs CWH Ton-hrs Hrs CWH Ton-hrs Hrs CWH Ton-hrs Hrs CWH Ton-hrs
CH-1 0 0 0 0 0 0 3,258 180,842 3,608,514 1,812 114,244 2,524,026CH-3 0 0 0 0 0 0 2,506 139,482 2,760,627 1,812 114,244 2,524,026Totals: 0 0 0 0 0 0 5,764 320,324 6,369,141 3,624 228,489 5,048,051Cust Wgt Factor: 0.000 0.000 0.558 0.442Cust Ent Cond Temps (F): n/a n/a 55.6 63.0
Grand Total Ton-hrs = 11,417,192
Average weighting factors and entering condenser temperatures are calculated because the following chillers are all identical: CH-1, CH-3. Over the life of the chiller plant, these chillers will be rotated to operate in each of the CH-1, CH-3 sequencing positions. Therefore, a lifecycle PLV must consider each chiller operating in each of these sequencing positions.
Chiller System Optimizer v2.02 Page 7

System Load ProfilesProject: Weber State Chiller University 09/15/2005Prepared By: 03:46 PM
0
10
20
30
40
50
60
70
80
90
100
0 10 20 30 40 50 60 70 80 90 100
Chi
ller L
oad
(%)
Building Load (%)
CH-1 CH-2 CH-3 CH-4
Note: Individual chiller curves in this graph have been adjusted up or down so the number of chillers operating at each point can be seen. If the curves had not been adjusted, all curves would lie on top of each other. Because of the adjustment each chiller load shown on the graph is only accurate to within a few percentage points plus or minus of the original calculated values.
2. Input Data Summary
WeatherCity Salt Lake City, UtahSchedule On All Day: Weekday
On All Day: SaturdayOn All Day: Sunday
LoadsUser-Defined Load Profile
Chiller SystemName Comination AChillers in Plant 4Plant Control SequencedFull Load LCHWT 44.0 FTower Configuration One Tower for SystemCooling Tower 6 Cell Tower(1)
Detailed Cooling Tower ModelFree Cooling Plate-Frame Heat Exchanger
Sequence Chiller Name FL Capacity (Tons)
Full Load Power
CH-1 Carrier 1500 Ton VFD 1,500 0.482 kW/TonCH-2 Trane 1250 1,250 0.473 kW/TonCH-3 Carrier 1500 Ton VFD 1,500 0.482 kW/TonCH-4 Trane 650 650 0.473 kW/Ton
Chiller System Optimizer v2.02 Page 1

System Performance ProfileProject: Weber State Chiller University 09/15/2005Prepared By: 03:46 PM
0
250000
500000
750000
1000000
1250000
1500000
1750000
2000000
2250000
0.275
0.300
0.325
0.350
0.375
0.400
0.425
0 10 20 30 40 50 60 70 80 90 100
Coo
ling
Ton-
hrs
Per
Yea
r Chiller S
ystem kW
/Ton
Building Load (%)
Cooling Ton-hrs Chiller System kW/Ton
2. Input Data Summary
WeatherCity Salt Lake City, UtahSchedule On All Day: Weekday
On All Day: SaturdayOn All Day: Sunday
LoadsUser-Defined Load Profile
Chiller SystemName Comination AChillers in Plant 4Plant Control SequencedFull Load LCHWT 44.0 FTower Configuration One Tower for SystemCooling Tower 6 Cell Tower(1)
Detailed Cooling Tower ModelFree Cooling Plate-Frame Heat Exchanger
Sequence Chiller Name FL Capacity (Tons)
Full Load Power
CH-1 Carrier 1500 Ton VFD 1,500 0.482 kW/TonCH-2 Trane 1250 1,250 0.473 kW/TonCH-3 Carrier 1500 Ton VFD 1,500 0.482 kW/TonCH-4 Trane 650 650 0.473 kW/Ton
Chiller System Optimizer v2.02 Page 1

5 Year Constant Dollar Cost Model
Chiller Combination A-1One new 1500 with vfd, one without
Approximate Energy Cost
Chilled Water Condenser Water Tons KW/Ton KW Hours kWH Demand Cost Energy Use CostLWT ْF EWT ْF EWT ْF LWT ْF $8.78/kW/month $0.0286340/kWH
44 54 80 3647 0.425 1549.98 82 127098 $27,217.56 $3,639.3244 54 75 3282 0.412 1352.31 245 331315.4 $9,486.8844 54 80 2954 0.397 1172.77 263 308437.4 $20,593.77 $8,831.8044 54 75 2659 0.405 1076.76 313 337025.4 $9,650.3944 54 75 2393 0.386 923.62 392 362058.9 $8,109.38 $10,367.1944 54 70 2154 0.367 790.341 517 408606.2 $11,700.0344 54 75 1938 0.351 680.296 525 357155.4 $5,973.00 $10,226.7944 54 70 1744 0.334 582.612 575 335002.2 $9,592.4544 54 70 1570 0.328 514.932 721 371265.8 $10,630.8244 54 65 1413 0.326 460.613 685 315519.7 $9,034.5944 54 65 1272 0.29 368.773 752 277317.1 $3,237.82 $7,940.70
Annual Energy Cost $166,232.505 Year Energy Cost: $831,162.50Chiller Purchase Price: 998,000
5 Year Life Cycle Evaluation Total: $1,829,162.50

System PLV ReportProject: Weber State Chiller University 09/15/2005Prepared By: 03:58 PM
1. Executive SummarySystem Part Load Value (SPLV): PLV
Combination A-1 0.352 kW/TonIPLV or NPLV (ARI 550/590-1998):
Carrier 1500 Ton VFD 0.296 kW/TonTrane 1250 0.354 kW/TonCarrier 1500 Ton Constant 0.449 kW/TonTrane 650 0.354 kW/Ton
2. Input Data Summary
WeatherCity Salt Lake City, UtahSchedule On All Day: Weekday
On All Day: SaturdayOn All Day: Sunday
LoadsUser-Defined Load Profile
Chiller SystemName Combination A-1Chillers in Plant 4Plant Control SequencedFull Load LCHWT 44.0 FTower Configuration One Tower for SystemCooling Tower 6 Cell Tower(2)
Detailed Cooling Tower ModelFree Cooling Plate-Frame Heat Exchanger
Sequence Chiller Name FL Capacity (Tons)
Full Load Power
CH-1 Carrier 1500 Ton VFD 1,500 0.482 kW/TonCH-2 Trane 1250 1,250 0.473 kW/TonCH-3 Carrier 1500 Ton Constant 1,500 0.458 kW/TonCH-4 Trane 650 650 0.473 kW/Ton
Chiller System Optimizer v2.02 Page 1

System PLV ReportProject: Weber State Chiller University 09/15/2005Prepared By: 03:58 PM
3. Chiller System Operating ConditionsBin Temp (F) Bin MCWB
(F)Building Load
(%)Building Load
(Tons)Chillers On Chiller Load
(%)97.5 61.5 100 4,900 4 10092.5 60.5 95 4,667 4 9587.5 59.5 90 4,433 4 9082.5 57.9 86 4,200 3 9977.5 55.9 81 3,967 3 9372.5 54.2 76 3,734 3 8867.5 51.9 71 3,500 3 8262.5 49.5 67 3,267 3 7757.5 47.1 62 3,034 3 7152.5 43.8 57 2,800 3 6647.5 40.4 42 2,067 2 7542.5 36.9 37 1,834 0 037.5 33.4 33 1,601 0 032.5 29.4 28 1,367 0 027.5 25.1 23 1,134 0 022.5 20.8 18 901 0 017.5 16.0 14 667 0 012.5 11.2 9 434 0 0
7.5 5.9 4 201 0 0
Chiller System Optimizer v2.02 Page 2

System PLV ReportProject: Weber State Chiller University 09/15/2005Prepared By: 03:58 PM
4a. Chiller System PerformanceCH-1 CH-2 CH-3
Bin Temp
(F)
Load (Tons)
(kW/Ton)
Lchwt (F)
Cond Temp
(F)
Load (Tons)
(kW/Ton)
Lchwt (F)
Cond Temp
(F)
Load (Tons)
(kW/Ton)
Lchwt (F)
Cond Temp
(F)97.5 1,500 0.433 44.00 67.53 1,250 0.413 44.00 67.53 1,500 0.434 44.00 67.5392.5 1,429 0.411 44.00 66.46 1,190 0.398 44.00 66.46 1,429 0.429 44.00 66.4687.5 1,357 0.387 44.00 65.37 1,131 0.385 44.00 65.37 1,357 0.425 44.00 65.3782.5 1,482 0.408 44.00 63.80 1,235 0.379 44.00 63.80 1,482 0.423 44.00 63.8077.5 1,400 0.377 44.00 61.83 1,167 0.359 44.00 61.83 1,400 0.416 44.00 61.8372.5 1,318 0.345 44.00 60.09 1,098 0.341 44.00 60.09 1,318 0.411 44.00 60.0967.5 1,235 0.308 44.00 57.82 1,029 0.337 44.00 57.82 1,235 0.406 44.00 57.8262.5 1,153 0.268 44.00 55.42 961 0.333 44.00 55.42 1,153 0.403 44.00 55.4257.5 1,071 0.248 44.00 55.00 892 0.334 44.00 55.00 1,071 0.403 44.00 55.0052.5 988 0.237 44.00 55.00 824 0.338 44.00 55.00 988 0.405 44.00 55.0047.5 1,128 0.256 44.00 55.00 940 0.331 44.00 55.00 0 0.000 44.00 n/a42.5 0 0.000 44.00 n/a 0 0.000 44.00 n/a 0 0.000 44.00 n/a37.5 0 0.000 44.00 n/a 0 0.000 44.00 n/a 0 0.000 44.00 n/a32.5 0 0.000 44.00 n/a 0 0.000 44.00 n/a 0 0.000 44.00 n/a27.5 0 0.000 44.00 n/a 0 0.000 44.00 n/a 0 0.000 44.00 n/a22.5 0 0.000 44.00 n/a 0 0.000 44.00 n/a 0 0.000 44.00 n/a17.5 0 0.000 44.00 n/a 0 0.000 44.00 n/a 0 0.000 44.00 n/a12.5 0 0.000 44.00 n/a 0 0.000 44.00 n/a 0 0.000 44.00 n/a
7.5 0 0.000 44.00 n/a 0 0.000 44.00 n/a 0 0.000 44.00 n/a
Minimum ECWT condition has been reached for chiller(s): CH-1, CH-2, CH-3Tower cycling assumed to hold minimum ECWT.
Chiller System Optimizer v2.02 Page 3

System PLV ReportProject: Weber State Chiller University 09/15/2005Prepared By: 03:58 PM
4b. Chiller System PerformanceCH-4 System
Bin Temp
(F)
Load (Tons)
(kW/Ton)
Lchwt (F)
Cond Temp
(F)
Total (kW)
Total (kW/Ton)
97.5 650 0.413 44.00 67.53 2084 0.42592.5 619 0.398 44.00 66.46 1921 0.41287.5 588 0.385 44.00 65.37 1762 0.39782.5 0 0.000 44.00 n/a 1700 0.40577.5 0 0.000 44.00 n/a 1530 0.38672.5 0 0.000 44.00 n/a 1370 0.36767.5 0 0.000 44.00 n/a 1230 0.35162.5 0 0.000 44.00 n/a 1093 0.33457.5 0 0.000 44.00 n/a 995 0.32852.5 0 0.000 44.00 n/a 913 0.32647.5 0 0.000 44.00 n/a 599 0.29042.5 0 0.000 44.00 n/a 0 0.00037.5 0 0.000 44.00 n/a 0 0.00032.5 0 0.000 44.00 n/a 0 0.00027.5 0 0.000 44.00 n/a 0 0.00022.5 0 0.000 44.00 n/a 0 0.00017.5 0 0.000 44.00 n/a 0 0.00012.5 0 0.000 44.00 n/a 0 0.000
7.5 0 0.000 44.00 n/a 0 0.000
Chiller System Optimizer v2.02 Page 4

System PLV ReportProject: Weber State Chiller University 09/15/2005Prepared By: 03:58 PM
5. SPLV WorksheetBin Temp
(F)Building Load (%)
Building Load
(Tons)
Cooling Hours
Cooling (Ton-hrs)
Bin Wgt Factor
System (kW/Ton)
Bin Ratio
97.5 100 4,900 82 401,800 0.0238 0.425 0.055992.5 95 4,667 245 1,143,345 0.0677 0.412 0.164587.5 90 4,433 263 1,165,992 0.0690 0.397 0.173782.5 86 4,200 313 1,314,645 0.0778 0.405 0.192377.5 81 3,967 392 1,555,008 0.0921 0.386 0.238872.5 76 3,734 517 1,930,256 0.1143 0.367 0.311467.5 71 3,500 525 1,837,650 0.1088 0.351 0.309762.5 67 3,267 575 1,878,525 0.1112 0.334 0.332657.5 62 3,034 721 2,187,308 0.1295 0.328 0.394952.5 57 2,800 685 1,918,293 0.1136 0.326 0.348447.5 42 2,067 752 1,554,459 0.0920 0.290 0.317542.5 37 1,834 776 0 0.0000 0.000 0.000037.5 33 1,601 857 0 0.0000 0.000 0.000032.5 28 1,367 828 0 0.0000 0.000 0.000027.5 23 1,134 671 0 0.0000 0.000 0.000022.5 18 901 221 0 0.0000 0.000 0.000017.5 14 667 135 0 0.0000 0.000 0.000012.5 9 434 70 0 0.0000 0.000 0.0000
7.5 4 201 132 0 0.0000 0.000 0.0000Total: 5,070 16,887,281 1.0000 2.8398
Bin Wgt Factor = Bin Ton-hrs / Total Ton-hrsBin Ratio = [Bin Wgt Factor] / [System kW/Ton]SPLV = 1 / [sum of Bin Ratios]SPLV = 1 / [2.8398] = 0.352 kW/Ton
6. Procedure for Calculating IPLV for Chillers
Procedure for Calculating IPLV for Water-Cooled Electric ChillersChiller
Load (%)LCHWT
(F)Cond
Temp (F)Wgt
FactorChiller
(kW/Ton)Bin Ratio
100 44.00 85.00 0.01 A 0.01/A75 44.00 75.00 0.42 B 0.42/B50 44.00 65.00 0.45 C 0.45/C25 44.00 65.00 0.12 D 0.12/D
Total: 1.00
IPLV = 1 / [sum of Bin Ratios]IPLV = 1 / [0.10/A + 0.42/B + 0.45/C + 0.12/D]per ARI Standard 550/590-1998
Chiller System Optimizer v2.02 Page 5
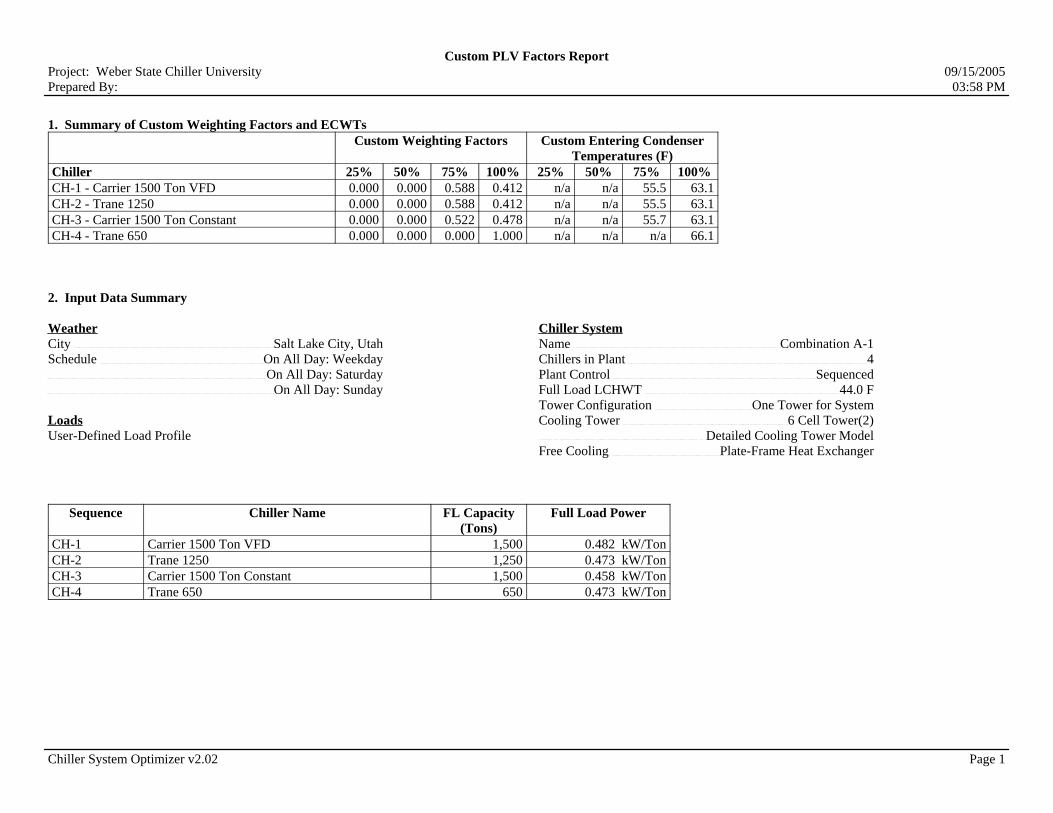
Custom PLV Factors ReportProject: Weber State Chiller University 09/15/2005Prepared By: 03:58 PM
1. Summary of Custom Weighting Factors and ECWTsCustom Weighting Factors Custom Entering Condenser
Temperatures (F)Chiller 25% 50% 75% 100% 25% 50% 75% 100%CH-1 - Carrier 1500 Ton VFD 0.000 0.000 0.588 0.412 n/a n/a 55.5 63.1CH-2 - Trane 1250 0.000 0.000 0.588 0.412 n/a n/a 55.5 63.1CH-3 - Carrier 1500 Ton Constant 0.000 0.000 0.522 0.478 n/a n/a 55.7 63.1CH-4 - Trane 650 0.000 0.000 0.000 1.000 n/a n/a n/a 66.1
2. Input Data Summary
WeatherCity Salt Lake City, UtahSchedule On All Day: Weekday
On All Day: SaturdayOn All Day: Sunday
LoadsUser-Defined Load Profile
Chiller SystemName Combination A-1Chillers in Plant 4Plant Control SequencedFull Load LCHWT 44.0 FTower Configuration One Tower for SystemCooling Tower 6 Cell Tower(2)
Detailed Cooling Tower ModelFree Cooling Plate-Frame Heat Exchanger
Sequence Chiller Name FL Capacity (Tons)
Full Load Power
CH-1 Carrier 1500 Ton VFD 1,500 0.482 kW/TonCH-2 Trane 1250 1,250 0.473 kW/TonCH-3 Carrier 1500 Ton Constant 1,500 0.458 kW/TonCH-4 Trane 650 650 0.473 kW/Ton
Chiller System Optimizer v2.02 Page 1

Custom PLV Factors ReportProject: Weber State Chiller University 09/15/2005Prepared By: 03:58 PM
3. Chiller System Operating ConditionsBin Temp (F) Bin MCWB
(F)Building Load
(%)Building Load
(Tons)Chillers On Chiller Load
(%)97.5 61.5 100 4,900 4 10092.5 60.5 95 4,667 4 9587.5 59.5 90 4,433 4 9082.5 57.9 86 4,200 3 9977.5 55.9 81 3,967 3 9372.5 54.2 76 3,734 3 8867.5 51.9 71 3,500 3 8262.5 49.5 67 3,267 3 7757.5 47.1 62 3,034 3 7152.5 43.8 57 2,800 3 6647.5 40.4 42 2,067 2 7542.5 36.9 37 1,834 0 037.5 33.4 33 1,601 0 032.5 29.4 28 1,367 0 027.5 25.1 23 1,134 0 022.5 20.8 18 901 0 017.5 16.0 14 667 0 012.5 11.2 9 434 0 0
7.5 5.9 4 201 0 0
Chiller System Optimizer v2.02 Page 2

Custom PLV Factors ReportProject: Weber State Chiller University 09/15/2005Prepared By: 03:58 PM
4a. Custom PLV Worksheet for CH-1 (Carrier 1500 Ton VFD)
Avg DB Cond Temp Total CWH Total Load Load 25% Bin 50% Bin 75% Bin 100% Bin(F) (F) (Hrs) (Ton-hrs) (Tons) (%) (CWH) (Ton-hrs) (CWH) (Ton-hrs) (CWH) (Ton-hrs) (CWH) (Ton-hrs)
97.5 67.5 82 5,537 123,000 1,500 100 0 0 0 0 0 0 5,537 123,00092.5 66.5 245 16,282 350,004 1,429 95 0 0 0 0 0 0 16,282 350,00487.5 65.4 263 17,192 356,936 1,357 90 0 0 0 0 0 0 17,192 356,93682.5 63.8 313 19,968 463,992 1,482 99 0 0 0 0 0 0 19,968 463,99277.5 61.8 392 24,239 548,826 1,400 93 0 0 0 0 0 0 24,239 548,82672.5 60.1 517 31,068 681,267 1,318 88 0 0 0 0 0 0 31,068 681,26767.5 57.8 525 30,355 648,582 1,235 82 0 0 0 0 30,355 648,582 0 062.5 55.4 575 31,865 663,009 1,153 77 0 0 0 0 31,865 663,009 0 057.5 55.0 721 39,655 771,991 1,071 71 0 0 0 0 39,655 771,991 0 052.5 55.0 685 37,675 677,045 988 66 0 0 0 0 37,675 677,045 0 047.5 55.0 752 41,360 847,887 1,128 75 0 0 0 0 41,360 847,887 0 042.5 n/a 0 0 0 0 0 0 0 0 0 0 0 0 037.5 n/a 0 0 0 0 0 0 0 0 0 0 0 0 032.5 n/a 0 0 0 0 0 0 0 0 0 0 0 0 027.5 n/a 0 0 0 0 0 0 0 0 0 0 0 0 022.5 n/a 0 0 0 0 0 0 0 0 0 0 0 0 017.5 n/a 0 0 0 0 0 0 0 0 0 0 0 0 012.5 n/a 0 0 0 0 0 0 0 0 0 0 0 0 0
7.5 n/a 0 0 0 0 0 0 0 0 0 0 0 0 0Totals: 5,070 295,197 6,132,540 0 0 0 0 180,910 3,608,514 114,287 2,524,026Cust Wgt Factors: 0.000 0.000 0.588 0.412Custom Entering Condenser Temperatures (F): n/a n/a 55.5 63.1
Chiller System Optimizer v2.02 Page 3

Custom PLV Factors ReportProject: Weber State Chiller University 09/15/2005Prepared By: 03:58 PM
4b. Custom PLV Worksheet for CH-2 (Trane 1250)
Avg DB Cond Temp Total CWH Total Load Load 25% Bin 50% Bin 75% Bin 100% Bin(F) (F) (Hrs) (Ton-hrs) (Tons) (%) (CWH) (Ton-hrs) (CWH) (Ton-hrs) (CWH) (Ton-hrs) (CWH) (Ton-hrs)
97.5 67.5 82 5,537 102,500 1,250 100 0 0 0 0 0 0 5,537 102,50092.5 66.5 245 16,282 291,670 1,190 95 0 0 0 0 0 0 16,282 291,67087.5 65.4 263 17,192 297,447 1,131 90 0 0 0 0 0 0 17,192 297,44782.5 63.8 313 19,968 386,660 1,235 99 0 0 0 0 0 0 19,968 386,66077.5 61.8 392 24,239 457,355 1,167 93 0 0 0 0 0 0 24,239 457,35572.5 60.1 517 31,068 567,723 1,098 88 0 0 0 0 0 0 31,068 567,72367.5 57.8 525 30,355 540,485 1,029 82 0 0 0 0 30,355 540,485 0 062.5 55.4 575 31,865 552,507 961 77 0 0 0 0 31,865 552,507 0 057.5 55.0 721 39,655 643,326 892 71 0 0 0 0 39,655 643,326 0 052.5 55.0 685 37,675 564,204 824 66 0 0 0 0 37,675 564,204 0 047.5 55.0 752 41,360 706,572 940 75 0 0 0 0 41,360 706,572 0 042.5 n/a 0 0 0 0 0 0 0 0 0 0 0 0 037.5 n/a 0 0 0 0 0 0 0 0 0 0 0 0 032.5 n/a 0 0 0 0 0 0 0 0 0 0 0 0 027.5 n/a 0 0 0 0 0 0 0 0 0 0 0 0 022.5 n/a 0 0 0 0 0 0 0 0 0 0 0 0 017.5 n/a 0 0 0 0 0 0 0 0 0 0 0 0 012.5 n/a 0 0 0 0 0 0 0 0 0 0 0 0 0
7.5 n/a 0 0 0 0 0 0 0 0 0 0 0 0 0Totals: 5,070 295,197 5,110,450 0 0 0 0 180,910 3,007,095 114,287 2,103,355Cust Wgt Factors: 0.000 0.000 0.588 0.412Custom Entering Condenser Temperatures (F): n/a n/a 55.5 63.1
Chiller System Optimizer v2.02 Page 4

Custom PLV Factors ReportProject: Weber State Chiller University 09/15/2005Prepared By: 03:58 PM
4c. Custom PLV Worksheet for CH-3 (Carrier 1500 Ton Constant)
Avg DB Cond Temp Total CWH Total Load Load 25% Bin 50% Bin 75% Bin 100% Bin(F) (F) (Hrs) (Ton-hrs) (Tons) (%) (CWH) (Ton-hrs) (CWH) (Ton-hrs) (CWH) (Ton-hrs) (CWH) (Ton-hrs)
97.5 67.5 82 5,537 123,000 1,500 100 0 0 0 0 0 0 5,537 123,00092.5 66.5 245 16,282 350,004 1,429 95 0 0 0 0 0 0 16,282 350,00487.5 65.4 263 17,192 356,936 1,357 90 0 0 0 0 0 0 17,192 356,93682.5 63.8 313 19,968 463,992 1,482 99 0 0 0 0 0 0 19,968 463,99277.5 61.8 392 24,239 548,826 1,400 93 0 0 0 0 0 0 24,239 548,82672.5 60.1 517 31,068 681,267 1,318 88 0 0 0 0 0 0 31,068 681,26767.5 57.8 525 30,355 648,582 1,235 82 0 0 0 0 30,355 648,582 0 062.5 55.4 575 31,865 663,009 1,153 77 0 0 0 0 31,865 663,009 0 057.5 55.0 721 39,655 771,991 1,071 71 0 0 0 0 39,655 771,991 0 052.5 55.0 685 37,675 677,045 988 66 0 0 0 0 37,675 677,045 0 047.5 n/a 0 0 0 0 0 0 0 0 0 0 0 0 042.5 n/a 0 0 0 0 0 0 0 0 0 0 0 0 037.5 n/a 0 0 0 0 0 0 0 0 0 0 0 0 032.5 n/a 0 0 0 0 0 0 0 0 0 0 0 0 027.5 n/a 0 0 0 0 0 0 0 0 0 0 0 0 022.5 n/a 0 0 0 0 0 0 0 0 0 0 0 0 017.5 n/a 0 0 0 0 0 0 0 0 0 0 0 0 012.5 n/a 0 0 0 0 0 0 0 0 0 0 0 0 0
7.5 n/a 0 0 0 0 0 0 0 0 0 0 0 0 0Totals: 4,318 253,837 5,284,653 0 0 0 0 139,550 2,760,627 114,287 2,524,026Cust Wgt Factors: 0.000 0.000 0.522 0.478Custom Entering Condenser Temperatures (F): n/a n/a 55.7 63.1
Chiller System Optimizer v2.02 Page 5

Custom PLV Factors ReportProject: Weber State Chiller University 09/15/2005Prepared By: 03:58 PM
4d. Custom PLV Worksheet for CH-4 (Trane 650)
Avg DB Cond Temp Total CWH Total Load Load 25% Bin 50% Bin 75% Bin 100% Bin(F) (F) (Hrs) (Ton-hrs) (Tons) (%) (CWH) (Ton-hrs) (CWH) (Ton-hrs) (CWH) (Ton-hrs) (CWH) (Ton-hrs)
97.5 67.5 82 5,537 53,300 650 100 0 0 0 0 0 0 5,537 53,30092.5 66.5 245 16,282 151,668 619 95 0 0 0 0 0 0 16,282 151,66887.5 65.4 263 17,192 154,672 588 90 0 0 0 0 0 0 17,192 154,67282.5 n/a 0 0 0 0 0 0 0 0 0 0 0 0 077.5 n/a 0 0 0 0 0 0 0 0 0 0 0 0 072.5 n/a 0 0 0 0 0 0 0 0 0 0 0 0 067.5 n/a 0 0 0 0 0 0 0 0 0 0 0 0 062.5 n/a 0 0 0 0 0 0 0 0 0 0 0 0 057.5 n/a 0 0 0 0 0 0 0 0 0 0 0 0 052.5 n/a 0 0 0 0 0 0 0 0 0 0 0 0 047.5 n/a 0 0 0 0 0 0 0 0 0 0 0 0 042.5 n/a 0 0 0 0 0 0 0 0 0 0 0 0 037.5 n/a 0 0 0 0 0 0 0 0 0 0 0 0 032.5 n/a 0 0 0 0 0 0 0 0 0 0 0 0 027.5 n/a 0 0 0 0 0 0 0 0 0 0 0 0 022.5 n/a 0 0 0 0 0 0 0 0 0 0 0 0 017.5 n/a 0 0 0 0 0 0 0 0 0 0 0 0 012.5 n/a 0 0 0 0 0 0 0 0 0 0 0 0 0
7.5 n/a 0 0 0 0 0 0 0 0 0 0 0 0 0Totals: 590 39,012 359,641 0 0 0 0 0 0 39,012 359,641Cust Wgt Factors: 0.000 0.000 0.000 1.000Custom Entering Condenser Temperatures (F): n/a n/a n/a 66.1
Chiller System Optimizer v2.02 Page 6

Custom PLV Factors ReportProject: Weber State Chiller University 09/15/2005Prepared By: 03:58 PM
KEY for Custom PLV Worksheet table(s):[Avg DB] = Midpoint temperature for bin.[Cond Temp] = Entering condenser temperature for bin. Entering water temperature for water-cooled chillers. Entering air temperature for air-cooled chillers.[Tot Hrs] = Hours of operation in bin.[CWH] = Condenser temperature hours. [Tot Hrs] times [Cond Temp]. Later used to derive the four average entering condenser temperature values for the PLV calculation.[Load] = Chiller load for bin.[Load (%)] = Chiller load as a percentage of full load capacity.[Total (Ton-hrs)] = Chiller [Load] times [Tot Hrs]. Later used to derive the four weighting factors for the PLV calculation.[Bin (CWH)] = [CWH] values separated into the four PLV bins: 25%, 50%, 75% and 100% load according to chiller load for each bin.[Bin (Ton-hrs)] = Values separated into the four PLV bins: 25%, 50%, 75% and 100% load according to the chiller load for each bin.[Cust Wgt Factor] = The four custom PLV weighting factors. [Total (Ton-hrs)] for PLV Bin divided by [Total (Ton-hrs)] for the chiller.[Cust Ent Cond Temps] = The four custom condenser temperature values for the PLV calculation = [Total (CWH)] for PLV bin divided by [Tot Hrs] in the PLV bin.
Chiller System Optimizer v2.02 Page 7

System Load ProfilesProject: Weber State Chiller University 09/15/2005Prepared By: 03:58 PM
0
10
20
30
40
50
60
70
80
90
100
0 10 20 30 40 50 60 70 80 90 100
Chi
ller L
oad
(%)
Building Load (%)
CH-1 CH-2 CH-3 CH-4
Note: Individual chiller curves in this graph have been adjusted up or down so the number of chillers operating at each point can be seen. If the curves had not been adjusted, all curves would lie on top of each other. Because of the adjustment each chiller load shown on the graph is only accurate to within a few percentage points plus or minus of the original calculated values.
2. Input Data Summary
WeatherCity Salt Lake City, UtahSchedule On All Day: Weekday
On All Day: SaturdayOn All Day: Sunday
LoadsUser-Defined Load Profile
Chiller SystemName Combination A-1Chillers in Plant 4Plant Control SequencedFull Load LCHWT 44.0 FTower Configuration One Tower for SystemCooling Tower 6 Cell Tower(2)
Detailed Cooling Tower ModelFree Cooling Plate-Frame Heat Exchanger
Sequence Chiller Name FL Capacity (Tons)
Full Load Power
CH-1 Carrier 1500 Ton VFD 1,500 0.482 kW/TonCH-2 Trane 1250 1,250 0.473 kW/TonCH-3 Carrier 1500 Ton Constant 1,500 0.458 kW/TonCH-4 Trane 650 650 0.473 kW/Ton
Chiller System Optimizer v2.02 Page 1

System Performance ProfileProject: Weber State Chiller University 09/15/2005Prepared By: 03:58 PM
0
250000
500000
750000
1000000
1250000
1500000
1750000
2000000
2250000
0.300
0.325
0.350
0.375
0.400
0.425
0 10 20 30 40 50 60 70 80 90 100
Coo
ling
Ton-
hrs
Per
Yea
r Chiller S
ystem kW
/Ton
Building Load (%)
Cooling Ton-hrs Chiller System kW/Ton
2. Input Data Summary
WeatherCity Salt Lake City, UtahSchedule On All Day: Weekday
On All Day: SaturdayOn All Day: Sunday
LoadsUser-Defined Load Profile
Chiller SystemName Combination A-1Chillers in Plant 4Plant Control SequencedFull Load LCHWT 44.0 FTower Configuration One Tower for SystemCooling Tower 6 Cell Tower(2)
Detailed Cooling Tower ModelFree Cooling Plate-Frame Heat Exchanger
Sequence Chiller Name FL Capacity (Tons)
Full Load Power
CH-1 Carrier 1500 Ton VFD 1,500 0.482 kW/TonCH-2 Trane 1250 1,250 0.473 kW/TonCH-3 Carrier 1500 Ton Constant 1,500 0.458 kW/TonCH-4 Trane 650 650 0.473 kW/Ton
Chiller System Optimizer v2.02 Page 1

5 Year Constant Dollar Cost Model
Chiller Combination FTwo new 1700 with vfds
Approximate Energy Cost
Chilled Water Condenser Water Tons KW/Ton KW Hours kWH Demand Cost Energy Use CostLWT ْF EWT ْF EWT ْF LWT ْF $8.78/kW/month $0.0286340/kWH
44 54 80 3647 0.4 1458.8 82 119621.6 $25,616.53 $3,425.2444 54 75 3282 0.382 1253.84 245 307190.5 $8,796.0944 54 80 2954 0.363 1072.33 263 282022.1 $18,830.07 $8,075.4244 54 75 2659 0.371 986.364 313 308731.9 $8,840.2344 54 75 2393 0.345 825.515 392 323601.8 $7,248.02 $9,266.0144 54 70 2154 0.319 686.972 517 355164.5 $10,169.7844 54 75 1938 0.287 556.253 525 292033.1 $4,883.91 $8,362.0744 54 70 1744 0.252 439.576 575 252756.1 $7,237.4244 54 70 1570 0.246 386.199 721 278449.4 $7,973.1244 54 65 1413 0.245 346.166 685 237123.7 $6,789.8044 54 65 1272 0.268 340.797 752 256279.3 $2,992.20 $7,338.30
5070Annual Energy Cost $145,844.225 Year Energy Cost: $729,221.08Chiller Purchase Price: 1,197,000
5 Year Life Cycle Evaluation Total: $1,926,221.08

System PLV ReportProject: Weber State University ----- 09/15/2005Prepared By: 04:11 PM
1. Executive SummarySystem Part Load Value (SPLV): PLV
Combination F 0.293 kW/TonIPLV or NPLV (ARI 550/590-1998):
Carrier 1700 Ton VFD 0.300 kW/TonTrane 1250 0.354 kW/TonCarrier 1700 Ton VFD 0.300 kW/TonTrane 650 0.354 kW/Ton
2. Input Data Summary
WeatherCity Salt Lake City, UtahSchedule On All Day: Weekday
On All Day: SaturdayOn All Day: Sunday
LoadsUser-Defined Load Profile
Chiller SystemName Combination FChillers in Plant 4Plant Control SequencedFull Load LCHWT 44.0 FTower Configuration One Tower for SystemCooling Tower 6 Cell Tower (1)
Detailed Cooling Tower ModelFree Cooling Plate-Frame Heat Exchanger
Sequence Chiller Name FL Capacity (Tons)
Full Load Power
CH-1 Carrier 1700 Ton VFD 1,700 0.490 kW/TonCH-2 Trane 1250 1,250 0.473 kW/TonCH-3 Carrier 1700 Ton VFD 1,700 0.490 kW/TonCH-4 Trane 650 650 0.473 kW/Ton
Chiller System Optimizer v2.02 Page 1

System PLV ReportProject: Weber State University ----- 09/15/2005Prepared By: 04:11 PM
3. Chiller System Operating ConditionsBin Temp (F) Bin MCWB
(F)Building Load
(%)Building Load
(Tons)Chillers On Chiller Load
(%)97.5 61.5 100 5,300 4 10092.5 60.5 95 5,048 4 9587.5 59.5 90 4,795 4 9082.5 57.9 86 4,542 3 9877.5 55.9 81 4,290 3 9272.5 54.2 76 4,039 3 8767.5 51.9 71 3,786 3 8162.5 49.5 67 3,534 3 7657.5 47.1 62 3,281 3 7152.5 43.8 57 3,029 3 6547.5 40.4 42 2,235 2 7642.5 36.9 37 1,984 0 037.5 33.4 33 1,731 0 032.5 29.4 28 1,479 0 027.5 25.1 23 1,227 0 022.5 20.8 17 916 0 017.5 16.0 14 750 0 012.5 11.2 9 501 0 0
7.5 5.9 4 216 0 0
Chiller System Optimizer v2.02 Page 2
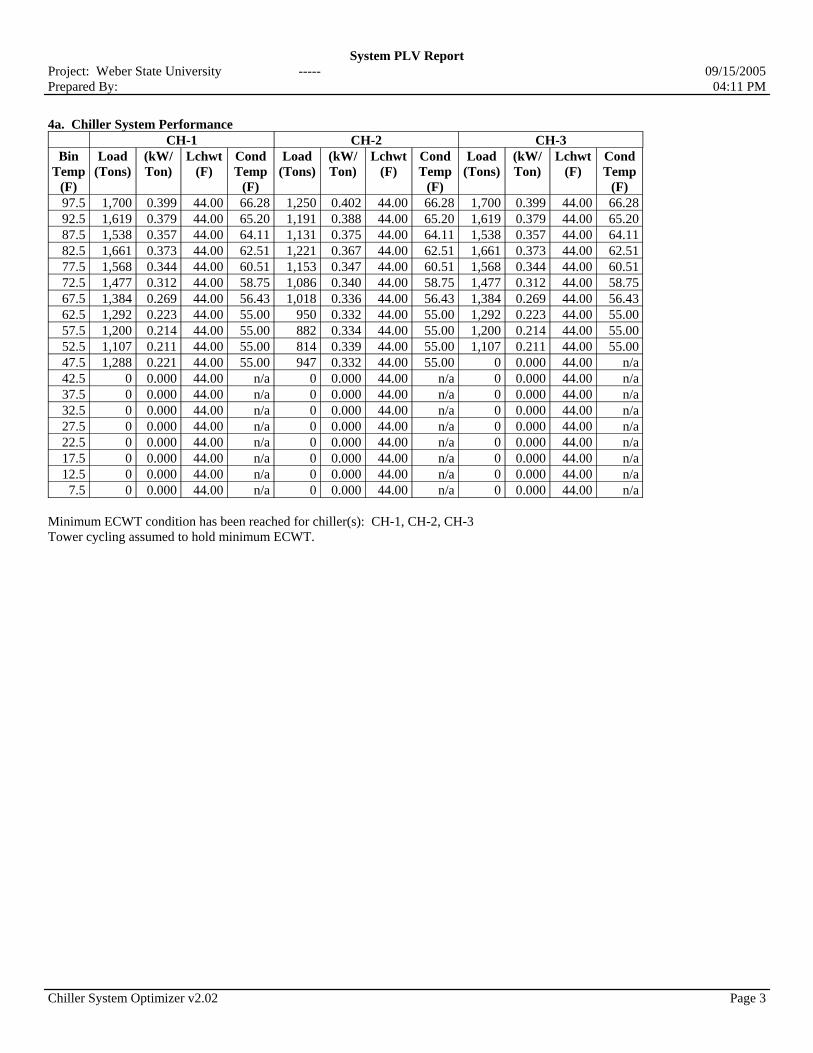
System PLV ReportProject: Weber State University ----- 09/15/2005Prepared By: 04:11 PM
4a. Chiller System PerformanceCH-1 CH-2 CH-3
Bin Temp
(F)
Load (Tons)
(kW/Ton)
Lchwt (F)
Cond Temp
(F)
Load (Tons)
(kW/Ton)
Lchwt (F)
Cond Temp
(F)
Load (Tons)
(kW/Ton)
Lchwt (F)
Cond Temp
(F)97.5 1,700 0.399 44.00 66.28 1,250 0.402 44.00 66.28 1,700 0.399 44.00 66.2892.5 1,619 0.379 44.00 65.20 1,191 0.388 44.00 65.20 1,619 0.379 44.00 65.2087.5 1,538 0.357 44.00 64.11 1,131 0.375 44.00 64.11 1,538 0.357 44.00 64.1182.5 1,661 0.373 44.00 62.51 1,221 0.367 44.00 62.51 1,661 0.373 44.00 62.5177.5 1,568 0.344 44.00 60.51 1,153 0.347 44.00 60.51 1,568 0.344 44.00 60.5172.5 1,477 0.312 44.00 58.75 1,086 0.340 44.00 58.75 1,477 0.312 44.00 58.7567.5 1,384 0.269 44.00 56.43 1,018 0.336 44.00 56.43 1,384 0.269 44.00 56.4362.5 1,292 0.223 44.00 55.00 950 0.332 44.00 55.00 1,292 0.223 44.00 55.0057.5 1,200 0.214 44.00 55.00 882 0.334 44.00 55.00 1,200 0.214 44.00 55.0052.5 1,107 0.211 44.00 55.00 814 0.339 44.00 55.00 1,107 0.211 44.00 55.0047.5 1,288 0.221 44.00 55.00 947 0.332 44.00 55.00 0 0.000 44.00 n/a42.5 0 0.000 44.00 n/a 0 0.000 44.00 n/a 0 0.000 44.00 n/a37.5 0 0.000 44.00 n/a 0 0.000 44.00 n/a 0 0.000 44.00 n/a32.5 0 0.000 44.00 n/a 0 0.000 44.00 n/a 0 0.000 44.00 n/a27.5 0 0.000 44.00 n/a 0 0.000 44.00 n/a 0 0.000 44.00 n/a22.5 0 0.000 44.00 n/a 0 0.000 44.00 n/a 0 0.000 44.00 n/a17.5 0 0.000 44.00 n/a 0 0.000 44.00 n/a 0 0.000 44.00 n/a12.5 0 0.000 44.00 n/a 0 0.000 44.00 n/a 0 0.000 44.00 n/a
7.5 0 0.000 44.00 n/a 0 0.000 44.00 n/a 0 0.000 44.00 n/a
Minimum ECWT condition has been reached for chiller(s): CH-1, CH-2, CH-3Tower cycling assumed to hold minimum ECWT.
Chiller System Optimizer v2.02 Page 3

System PLV ReportProject: Weber State University ----- 09/15/2005Prepared By: 04:11 PM
4b. Chiller System PerformanceCH-4 System
Bin Temp
(F)
Load (Tons)
(kW/Ton)
Lchwt (F)
Cond Temp
(F)
Total (kW)
Total (kW/Ton)
97.5 650 0.402 44.00 66.28 2119 0.40092.5 619 0.388 44.00 65.20 1929 0.38287.5 588 0.375 44.00 64.11 1742 0.36382.5 0 0.000 44.00 n/a 1687 0.37177.5 0 0.000 44.00 n/a 1479 0.34572.5 0 0.000 44.00 n/a 1290 0.31967.5 0 0.000 44.00 n/a 1086 0.28762.5 0 0.000 44.00 n/a 892 0.25257.5 0 0.000 44.00 n/a 808 0.24652.5 0 0.000 44.00 n/a 742 0.24547.5 0 0.000 44.00 n/a 599 0.26842.5 0 0.000 44.00 n/a 0 0.00037.5 0 0.000 44.00 n/a 0 0.00032.5 0 0.000 44.00 n/a 0 0.00027.5 0 0.000 44.00 n/a 0 0.00022.5 0 0.000 44.00 n/a 0 0.00017.5 0 0.000 44.00 n/a 0 0.00012.5 0 0.000 44.00 n/a 0 0.000
7.5 0 0.000 44.00 n/a 0 0.000
Chiller System Optimizer v2.02 Page 4

System PLV ReportProject: Weber State University ----- 09/15/2005Prepared By: 04:11 PM
5. SPLV WorksheetBin Temp
(F)Building Load (%)
Building Load
(Tons)
Cooling Hours
Cooling (Ton-hrs)
Bin Wgt Factor
System (kW/Ton)
Bin Ratio
97.5 100 5,300 82 434,600 0.0238 0.400 0.059592.5 95 5,048 245 1,236,760 0.0677 0.382 0.177287.5 90 4,795 263 1,261,085 0.0690 0.363 0.190182.5 86 4,542 313 1,421,646 0.0778 0.371 0.209577.5 81 4,290 392 1,681,680 0.0921 0.345 0.267172.5 76 4,039 517 2,088,163 0.1143 0.319 0.358067.5 71 3,786 525 1,987,650 0.1088 0.287 0.379462.5 67 3,534 575 2,032,050 0.1113 0.252 0.441057.5 62 3,281 721 2,365,601 0.1295 0.246 0.526252.5 57 3,029 685 2,074,865 0.1136 0.245 0.463647.5 42 2,235 752 1,680,720 0.0920 0.268 0.343242.5 37 1,984 776 0 0.0000 0.000 0.000037.5 33 1,731 857 0 0.0000 0.000 0.000032.5 28 1,479 828 0 0.0000 0.000 0.000027.5 23 1,227 671 0 0.0000 0.000 0.000022.5 17 916 221 0 0.0000 0.000 0.000017.5 14 750 135 0 0.0000 0.000 0.000012.5 9 501 70 0 0.0000 0.000 0.0000
7.5 4 216 132 0 0.0000 0.000 0.0000Total: 5,070 18,264,820 1.0000 3.4148
Bin Wgt Factor = Bin Ton-hrs / Total Ton-hrsBin Ratio = [Bin Wgt Factor] / [System kW/Ton]SPLV = 1 / [sum of Bin Ratios]SPLV = 1 / [3.4148] = 0.293 kW/Ton
6. Procedure for Calculating IPLV for Chillers
Procedure for Calculating IPLV for Water-Cooled Electric ChillersChiller
Load (%)LCHWT
(F)Cond
Temp (F)Wgt
FactorChiller
(kW/Ton)Bin Ratio
100 44.00 85.00 0.01 A 0.01/A75 44.00 75.00 0.42 B 0.42/B50 44.00 65.00 0.45 C 0.45/C25 44.00 65.00 0.12 D 0.12/D
Total: 1.00
IPLV = 1 / [sum of Bin Ratios]IPLV = 1 / [0.10/A + 0.42/B + 0.45/C + 0.12/D]per ARI Standard 550/590-1998
Chiller System Optimizer v2.02 Page 5

Custom PLV Factors ReportProject: Weber State University ----- 09/15/2005Prepared By: 04:11 PM
1. Summary of Custom Weighting Factors and ECWTsCustom Weighting Factors Custom Entering Condenser
Temperatures (F)Chiller 25% 50% 75% 100% 25% 50% 75% 100%CH-1 - Carrier 1700 Ton VFD 0.000 0.000 0.677 0.323 n/a n/a 55.8 63.0CH-2 - Trane 1250 0.000 0.000 0.699 0.301 n/a n/a 55.7 63.0CH-3 - Carrier 1700 Ton VFD 0.000 0.000 0.677 0.323 n/a n/a 55.8 63.0CH-4 - Trane 650 0.000 0.000 0.000 1.000 n/a n/a n/a 64.9
2. Input Data Summary
WeatherCity Salt Lake City, UtahSchedule On All Day: Weekday
On All Day: SaturdayOn All Day: Sunday
LoadsUser-Defined Load Profile
Chiller SystemName Combination FChillers in Plant 4Plant Control SequencedFull Load LCHWT 44.0 FTower Configuration One Tower for SystemCooling Tower 6 Cell Tower (1)
Detailed Cooling Tower ModelFree Cooling Plate-Frame Heat Exchanger
Sequence Chiller Name FL Capacity (Tons)
Full Load Power
CH-1 Carrier 1700 Ton VFD 1,700 0.490 kW/TonCH-2 Trane 1250 1,250 0.473 kW/TonCH-3 Carrier 1700 Ton VFD 1,700 0.490 kW/TonCH-4 Trane 650 650 0.473 kW/Ton
Chiller System Optimizer v2.02 Page 1

Custom PLV Factors ReportProject: Weber State University ----- 09/15/2005Prepared By: 04:11 PM
3. Chiller System Operating ConditionsBin Temp (F) Bin MCWB
(F)Building Load
(%)Building Load
(Tons)Chillers On Chiller Load
(%)97.5 61.5 100 5,300 4 10092.5 60.5 95 5,048 4 9587.5 59.5 90 4,795 4 9082.5 57.9 86 4,542 3 9877.5 55.9 81 4,290 3 9272.5 54.2 76 4,039 3 8767.5 51.9 71 3,786 3 8162.5 49.5 67 3,534 3 7657.5 47.1 62 3,281 3 7152.5 43.8 57 3,029 3 6547.5 40.4 42 2,235 2 7642.5 36.9 37 1,984 0 037.5 33.4 33 1,731 0 032.5 29.4 28 1,479 0 027.5 25.1 23 1,227 0 022.5 20.8 17 916 0 017.5 16.0 14 750 0 012.5 11.2 9 501 0 0
7.5 5.9 4 216 0 0
Chiller System Optimizer v2.02 Page 2

Custom PLV Factors ReportProject: Weber State University ----- 09/15/2005Prepared By: 04:11 PM
4a. Custom PLV Worksheet for CH-1 (Carrier 1700 Ton VFD)
Avg DB Cond Temp Total CWH Total Load Load 25% Bin 50% Bin 75% Bin 100% Bin(F) (F) (Hrs) (Ton-hrs) (Tons) (%) (CWH) (Ton-hrs) (CWH) (Ton-hrs) (CWH) (Ton-hrs) (CWH) (Ton-hrs)
97.5 66.3 82 5,435 139,400 1,700 100 0 0 0 0 0 0 5,435 139,40092.5 65.2 245 15,974 396,697 1,619 95 0 0 0 0 0 0 15,974 396,69787.5 64.1 263 16,860 404,499 1,538 90 0 0 0 0 0 0 16,860 404,49982.5 62.5 313 19,566 519,742 1,661 98 0 0 0 0 0 0 19,566 519,74277.5 60.5 392 23,720 614,808 1,568 92 0 0 0 0 0 0 23,720 614,80872.5 58.8 517 30,374 763,414 1,477 87 0 0 0 0 30,374 763,414 0 067.5 56.4 525 29,625 726,668 1,384 81 0 0 0 0 29,625 726,668 0 062.5 55.0 575 31,625 742,900 1,292 76 0 0 0 0 31,625 742,900 0 057.5 55.0 721 39,655 864,843 1,200 71 0 0 0 0 39,655 864,843 0 052.5 55.0 685 37,675 758,553 1,107 65 0 0 0 0 37,675 758,553 0 047.5 55.0 752 41,360 968,551 1,288 76 0 0 0 0 41,360 968,551 0 042.5 n/a 0 0 0 0 0 0 0 0 0 0 0 0 037.5 n/a 0 0 0 0 0 0 0 0 0 0 0 0 032.5 n/a 0 0 0 0 0 0 0 0 0 0 0 0 027.5 n/a 0 0 0 0 0 0 0 0 0 0 0 0 022.5 n/a 0 0 0 0 0 0 0 0 0 0 0 0 017.5 n/a 0 0 0 0 0 0 0 0 0 0 0 0 012.5 n/a 0 0 0 0 0 0 0 0 0 0 0 0 0
7.5 n/a 0 0 0 0 0 0 0 0 0 0 0 0 0Totals: 5,070 291,869 6,900,074 0 0 0 0 210,315 4,824,929 81,554 2,075,145
Chiller System Optimizer v2.02 Page 3

Custom PLV Factors ReportProject: Weber State University ----- 09/15/2005Prepared By: 04:11 PM
4b. Custom PLV Worksheet for CH-2 (Trane 1250)
Avg DB Cond Temp Total CWH Total Load Load 25% Bin 50% Bin 75% Bin 100% Bin(F) (F) (Hrs) (Ton-hrs) (Tons) (%) (CWH) (Ton-hrs) (CWH) (Ton-hrs) (CWH) (Ton-hrs) (CWH) (Ton-hrs)
97.5 66.3 82 5,435 102,500 1,250 100 0 0 0 0 0 0 5,435 102,50092.5 65.2 245 15,974 291,689 1,191 95 0 0 0 0 0 0 15,974 291,68987.5 64.1 263 16,860 297,426 1,131 90 0 0 0 0 0 0 16,860 297,42682.5 62.5 313 19,566 382,163 1,221 98 0 0 0 0 0 0 19,566 382,16377.5 60.5 392 23,720 452,065 1,153 92 0 0 0 0 0 0 23,720 452,06572.5 58.8 517 30,374 561,334 1,086 87 0 0 0 0 30,374 561,334 0 067.5 56.4 525 29,625 534,315 1,018 81 0 0 0 0 29,625 534,315 0 062.5 55.0 575 31,625 546,250 950 76 0 0 0 0 31,625 546,250 0 057.5 55.0 721 39,655 635,914 882 71 0 0 0 0 39,655 635,914 0 052.5 55.0 685 37,675 557,759 814 65 0 0 0 0 37,675 557,759 0 047.5 55.0 752 41,360 712,170 947 76 0 0 0 0 41,360 712,170 0 042.5 n/a 0 0 0 0 0 0 0 0 0 0 0 0 037.5 n/a 0 0 0 0 0 0 0 0 0 0 0 0 032.5 n/a 0 0 0 0 0 0 0 0 0 0 0 0 027.5 n/a 0 0 0 0 0 0 0 0 0 0 0 0 022.5 n/a 0 0 0 0 0 0 0 0 0 0 0 0 017.5 n/a 0 0 0 0 0 0 0 0 0 0 0 0 012.5 n/a 0 0 0 0 0 0 0 0 0 0 0 0 0
7.5 n/a 0 0 0 0 0 0 0 0 0 0 0 0 0Totals: 5,070 291,869 5,073,584 0 0 0 0 210,315 3,547,742 81,554 1,525,842Cust Wgt Factors: 0.000 0.000 0.699 0.301Custom Entering Condenser Temperatures (F): n/a n/a 55.7 63.0
Chiller System Optimizer v2.02 Page 4
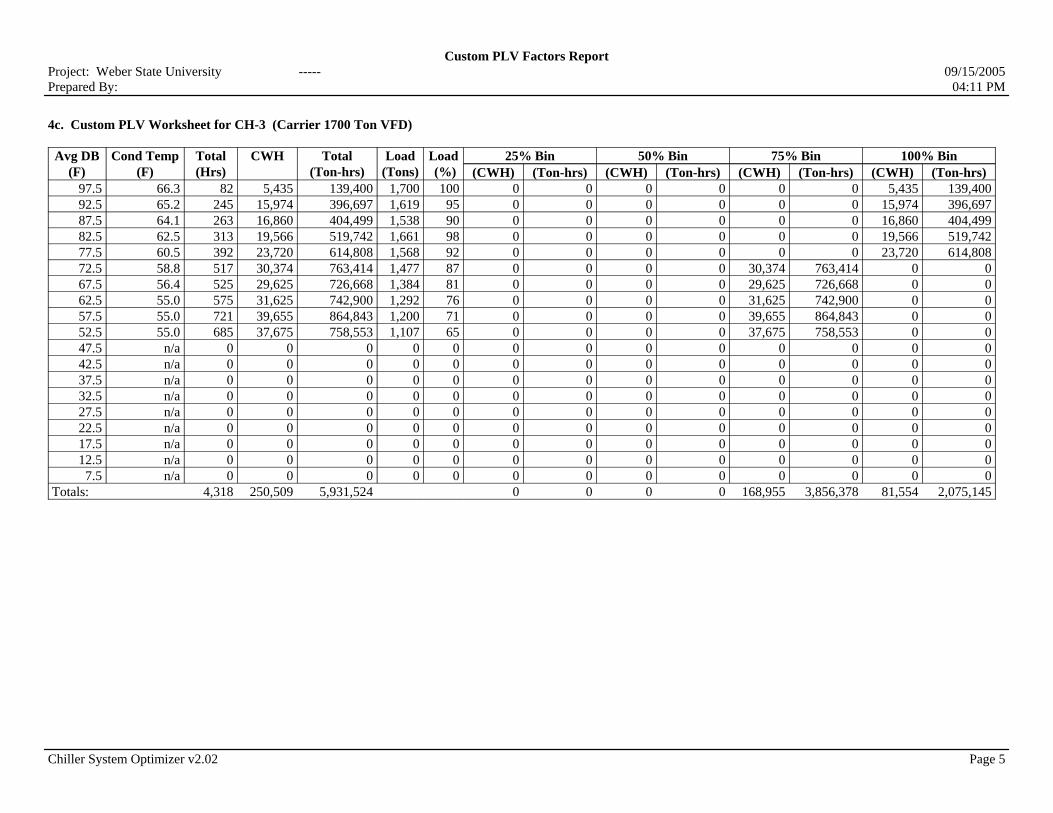
Custom PLV Factors ReportProject: Weber State University ----- 09/15/2005Prepared By: 04:11 PM
4c. Custom PLV Worksheet for CH-3 (Carrier 1700 Ton VFD)
Avg DB Cond Temp Total CWH Total Load Load 25% Bin 50% Bin 75% Bin 100% Bin(F) (F) (Hrs) (Ton-hrs) (Tons) (%) (CWH) (Ton-hrs) (CWH) (Ton-hrs) (CWH) (Ton-hrs) (CWH) (Ton-hrs)
97.5 66.3 82 5,435 139,400 1,700 100 0 0 0 0 0 0 5,435 139,40092.5 65.2 245 15,974 396,697 1,619 95 0 0 0 0 0 0 15,974 396,69787.5 64.1 263 16,860 404,499 1,538 90 0 0 0 0 0 0 16,860 404,49982.5 62.5 313 19,566 519,742 1,661 98 0 0 0 0 0 0 19,566 519,74277.5 60.5 392 23,720 614,808 1,568 92 0 0 0 0 0 0 23,720 614,80872.5 58.8 517 30,374 763,414 1,477 87 0 0 0 0 30,374 763,414 0 067.5 56.4 525 29,625 726,668 1,384 81 0 0 0 0 29,625 726,668 0 062.5 55.0 575 31,625 742,900 1,292 76 0 0 0 0 31,625 742,900 0 057.5 55.0 721 39,655 864,843 1,200 71 0 0 0 0 39,655 864,843 0 052.5 55.0 685 37,675 758,553 1,107 65 0 0 0 0 37,675 758,553 0 047.5 n/a 0 0 0 0 0 0 0 0 0 0 0 0 042.5 n/a 0 0 0 0 0 0 0 0 0 0 0 0 037.5 n/a 0 0 0 0 0 0 0 0 0 0 0 0 032.5 n/a 0 0 0 0 0 0 0 0 0 0 0 0 027.5 n/a 0 0 0 0 0 0 0 0 0 0 0 0 022.5 n/a 0 0 0 0 0 0 0 0 0 0 0 0 017.5 n/a 0 0 0 0 0 0 0 0 0 0 0 0 012.5 n/a 0 0 0 0 0 0 0 0 0 0 0 0 0
7.5 n/a 0 0 0 0 0 0 0 0 0 0 0 0 0Totals: 4,318 250,509 5,931,524 0 0 0 0 168,955 3,856,378 81,554 2,075,145
Chiller System Optimizer v2.02 Page 5

Custom PLV Factors ReportProject: Weber State University ----- 09/15/2005Prepared By: 04:11 PM
4d. Custom PLV Worksheet for CH-4 (Trane 650)
Avg DB Cond Temp Total CWH Total Load Load 25% Bin 50% Bin 75% Bin 100% Bin(F) (F) (Hrs) (Ton-hrs) (Tons) (%) (CWH) (Ton-hrs) (CWH) (Ton-hrs) (CWH) (Ton-hrs) (CWH) (Ton-hrs)
97.5 66.3 82 5,435 53,300 650 100 0 0 0 0 0 0 5,435 53,30092.5 65.2 245 15,974 151,678 619 95 0 0 0 0 0 0 15,974 151,67887.5 64.1 263 16,860 154,661 588 90 0 0 0 0 0 0 16,860 154,66182.5 n/a 0 0 0 0 0 0 0 0 0 0 0 0 077.5 n/a 0 0 0 0 0 0 0 0 0 0 0 0 072.5 n/a 0 0 0 0 0 0 0 0 0 0 0 0 067.5 n/a 0 0 0 0 0 0 0 0 0 0 0 0 062.5 n/a 0 0 0 0 0 0 0 0 0 0 0 0 057.5 n/a 0 0 0 0 0 0 0 0 0 0 0 0 052.5 n/a 0 0 0 0 0 0 0 0 0 0 0 0 047.5 n/a 0 0 0 0 0 0 0 0 0 0 0 0 042.5 n/a 0 0 0 0 0 0 0 0 0 0 0 0 037.5 n/a 0 0 0 0 0 0 0 0 0 0 0 0 032.5 n/a 0 0 0 0 0 0 0 0 0 0 0 0 027.5 n/a 0 0 0 0 0 0 0 0 0 0 0 0 022.5 n/a 0 0 0 0 0 0 0 0 0 0 0 0 017.5 n/a 0 0 0 0 0 0 0 0 0 0 0 0 012.5 n/a 0 0 0 0 0 0 0 0 0 0 0 0 0
7.5 n/a 0 0 0 0 0 0 0 0 0 0 0 0 0Totals: 590 38,269 359,640 0 0 0 0 0 0 38,269 359,640Cust Wgt Factors: 0.000 0.000 0.000 1.000Custom Entering Condenser Temperatures (F): n/a n/a n/a 64.9
Chiller System Optimizer v2.02 Page 6

Custom PLV Factors ReportProject: Weber State University ----- 09/15/2005Prepared By: 04:11 PM
KEY for Custom PLV Worksheet table(s):[Avg DB] = Midpoint temperature for bin.[Cond Temp] = Entering condenser temperature for bin. Entering water temperature for water-cooled chillers. Entering air temperature for air-cooled chillers.[Tot Hrs] = Hours of operation in bin.[CWH] = Condenser temperature hours. [Tot Hrs] times [Cond Temp]. Later used to derive the four average entering condenser temperature values for the PLV calculation.[Load] = Chiller load for bin.[Load (%)] = Chiller load as a percentage of full load capacity.[Total (Ton-hrs)] = Chiller [Load] times [Tot Hrs]. Later used to derive the four weighting factors for the PLV calculation.[Bin (CWH)] = [CWH] values separated into the four PLV bins: 25%, 50%, 75% and 100% load according to chiller load for each bin.[Bin (Ton-hrs)] = Values separated into the four PLV bins: 25%, 50%, 75% and 100% load according to the chiller load for each bin.[Cust Wgt Factor] = The four custom PLV weighting factors. [Total (Ton-hrs)] for PLV Bin divided by [Total (Ton-hrs)] for the chiller.[Cust Ent Cond Temps] = The four custom condenser temperature values for the PLV calculation = [Total (CWH)] for PLV bin divided by [Tot Hrs] in the PLV bin.
5a. Average Weighting Factors and Entering Condenser Temperatures (CH-1, CH-3)
25% Bin 50% Bin 75% Bin 100% BinChiller Hrs CWH Ton-hrs Hrs CWH Ton-hrs Hrs CWH Ton-hrs Hrs CWH Ton-hrs
CH-1 0 0 0 0 0 0 3,775 210,315 4,824,929 1,295 81,554 2,075,145CH-3 0 0 0 0 0 0 3,023 168,955 3,856,378 1,295 81,554 2,075,145Totals: 0 0 0 0 0 0 6,798 379,269 8,681,307 2,590 163,109 4,150,290Cust Wgt Factor: 0.000 0.000 0.677 0.323Cust Ent Cond Temps (F): n/a n/a 55.8 63.0
Grand Total Ton-hrs = 12,831,597
Average weighting factors and entering condenser temperatures are calculated because the following chillers are all identical: CH-1, CH-3. Over the life of the chiller plant, these chillers will be rotated to operate in each of the CH-1, CH-3 sequencing positions. Therefore, a lifecycle PLV must consider each chiller operating in each of these sequencing positions.
Chiller System Optimizer v2.02 Page 7

System Load ProfilesProject: Weber State University ----- 09/15/2005Prepared By: 04:11 PM
0
10
20
30
40
50
60
70
80
90
100
0 10 20 30 40 50 60 70 80 90 100
Chi
ller L
oad
(%)
Building Load (%)
CH-1 CH-2 CH-3 CH-4
Note: Individual chiller curves in this graph have been adjusted up or down so the number of chillers operating at each point can be seen. If the curves had not been adjusted, all curves would lie on top of each other. Because of the adjustment each chiller load shown on the graph is only accurate to within a few percentage points plus or minus of the original calculated values.
2. Input Data Summary
WeatherCity Salt Lake City, UtahSchedule On All Day: Weekday
On All Day: SaturdayOn All Day: Sunday
LoadsUser-Defined Load Profile
Chiller SystemName Combination FChillers in Plant 4Plant Control SequencedFull Load LCHWT 44.0 FTower Configuration One Tower for SystemCooling Tower 6 Cell Tower (1)
Detailed Cooling Tower ModelFree Cooling Plate-Frame Heat Exchanger
Sequence Chiller Name FL Capacity (Tons)
Full Load Power
CH-1 Carrier 1700 Ton VFD 1,700 0.490 kW/TonCH-2 Trane 1250 1,250 0.473 kW/TonCH-3 Carrier 1700 Ton VFD 1,700 0.490 kW/TonCH-4 Trane 650 650 0.473 kW/Ton
Chiller System Optimizer v2.02 Page 1
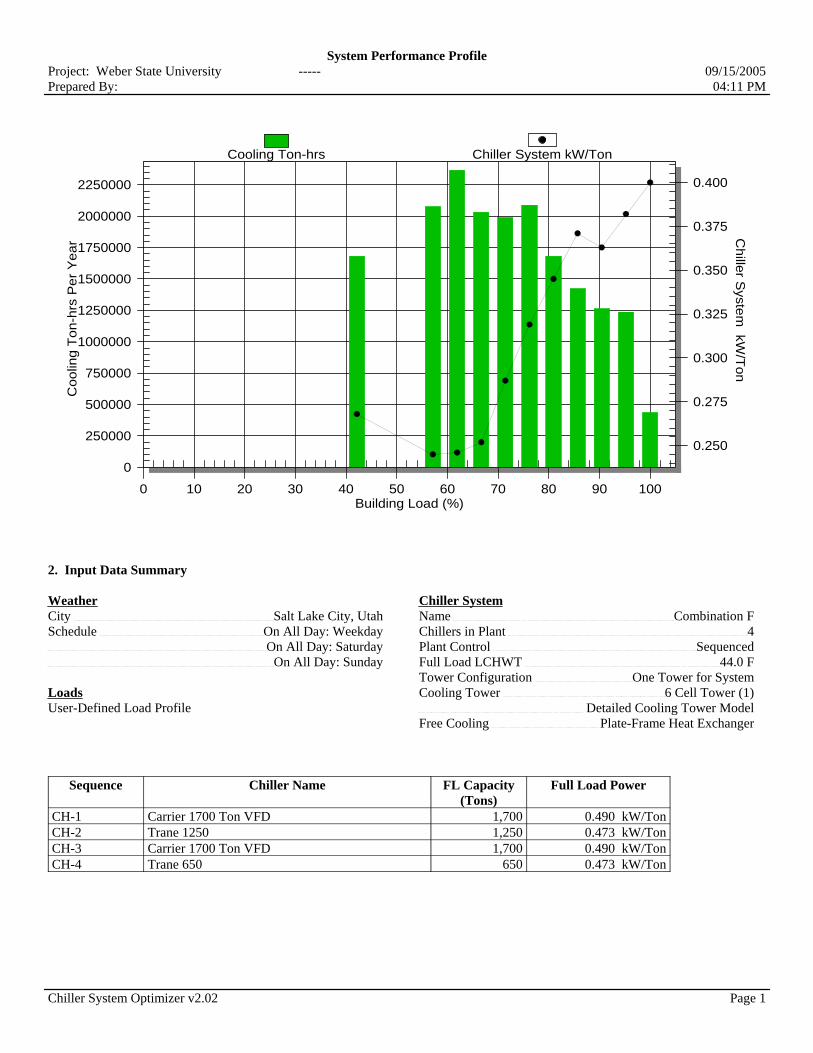
System Performance ProfileProject: Weber State University ----- 09/15/2005Prepared By: 04:11 PM
0
250000
500000
750000
1000000
1250000
1500000
1750000
2000000
2250000
0.250
0.275
0.300
0.325
0.350
0.375
0.400
0 10 20 30 40 50 60 70 80 90 100
Coo
ling
Ton-
hrs
Per
Yea
r Chiller S
ystem kW
/Ton
Building Load (%)
Cooling Ton-hrs Chiller System kW/Ton
2. Input Data Summary
WeatherCity Salt Lake City, UtahSchedule On All Day: Weekday
On All Day: SaturdayOn All Day: Sunday
LoadsUser-Defined Load Profile
Chiller SystemName Combination FChillers in Plant 4Plant Control SequencedFull Load LCHWT 44.0 FTower Configuration One Tower for SystemCooling Tower 6 Cell Tower (1)
Detailed Cooling Tower ModelFree Cooling Plate-Frame Heat Exchanger
Sequence Chiller Name FL Capacity (Tons)
Full Load Power
CH-1 Carrier 1700 Ton VFD 1,700 0.490 kW/TonCH-2 Trane 1250 1,250 0.473 kW/TonCH-3 Carrier 1700 Ton VFD 1,700 0.490 kW/TonCH-4 Trane 650 650 0.473 kW/Ton
Chiller System Optimizer v2.02 Page 1

5 Year Constant Dollar Cost Model
Chiller Combination F-1One new 1700 with vfd, 1 without
Approximate Energy Cost
Chilled Water Condenser Water Tons KW/Ton KW Hours kWH Demand Cost Energy Use CostLWT ْF EWT ْF EWT ْF LWT ْF $8.78/kW/month $0.0286340/kWH
44 54 80 3647 0.405 1477.04 82 121116.9 $25,936.73 $3,468.0644 54 75 3282 0.393 1289.94 245 316036.3 $9,049.3844 54 80 2954 0.38 1122.55 263 295229.8 $19,711.92 $8,453.6144 54 75 2659 0.383 1018.27 313 318717.9 $9,126.1744 54 75 2393 0.366 875.764 392 343299.3 $7,689.20 $9,830.0344 54 70 2154 0.351 755.884 517 390792.3 $11,189.9544 54 75 1938 0.334 647.347 525 339857.3 $5,683.71 $9,731.4744 54 70 1744 0.317 552.959 575 317951.2 $9,104.2144 54 70 1570 0.318 499.233 721 359946.7 $10,306.7144 54 65 1413 0.321 453.548 685 310680.5 $8,896.0244 54 65 1272 0.268 340.797 752 256279.3 $2,992.20 $7,338.30
5070Annual Energy Cost $158,507.695 Year Energy Cost: $792,538.44Chiller Purchase Price: 1,152,000
5 Year Life Cycle Evaluation Total: $1,944,538.44

System PLV ReportProject: Weber State University ----- 09/15/2005Prepared By: 04:13 PM
1. Executive SummarySystem Part Load Value (SPLV): PLV
Combination F-1 0.336 kW/TonIPLV or NPLV (ARI 550/590-1998):
Carrier 1700 Ton VFD 0.300 kW/TonTrane 1250 0.354 kW/TonCarrier 1700 Ton Constant 0.462 kW/TonTrane 650 0.354 kW/Ton
2. Input Data Summary
WeatherCity Salt Lake City, UtahSchedule On All Day: Weekday
On All Day: SaturdayOn All Day: Sunday
LoadsUser-Defined Load Profile
Chiller SystemName Combination F-1Chillers in Plant 4Plant Control SequencedFull Load LCHWT 44.0 FTower Configuration One Tower for SystemCooling Tower 6 Cell Tower (2)
Detailed Cooling Tower ModelFree Cooling Plate-Frame Heat Exchanger
Sequence Chiller Name FL Capacity (Tons)
Full Load Power
CH-1 Carrier 1700 Ton VFD 1,700 0.490 kW/TonCH-2 Trane 1250 1,250 0.473 kW/TonCH-3 Carrier 1700 Ton Constant 1,732 0.470 kW/TonCH-4 Trane 650 650 0.473 kW/Ton
Chiller System Optimizer v2.02 Page 1

System PLV ReportProject: Weber State University ----- 09/15/2005Prepared By: 04:13 PM
3. Chiller System Operating ConditionsBin Temp (F) Bin MCWB
(F)Building Load
(%)Building Load
(Tons)Chillers On Chiller Load
(%)97.5 61.5 100 5,300 4 9992.5 60.5 95 5,048 4 9587.5 59.5 90 4,795 4 9082.5 57.9 86 4,542 3 9777.5 55.9 81 4,290 3 9272.5 54.2 76 4,039 3 8667.5 51.9 71 3,786 3 8162.5 49.5 67 3,534 3 7557.5 47.1 62 3,281 3 7052.5 43.8 57 3,029 3 6547.5 40.4 42 2,235 2 7642.5 36.9 37 1,984 0 037.5 33.4 33 1,731 0 032.5 29.4 28 1,479 0 027.5 25.1 23 1,227 0 022.5 20.8 17 916 0 017.5 16.0 14 750 0 012.5 11.2 9 501 0 0
7.5 5.9 4 216 0 0
Chiller System Optimizer v2.02 Page 2

System PLV ReportProject: Weber State University ----- 09/15/2005Prepared By: 04:13 PM
4a. Chiller System PerformanceCH-1 CH-2 CH-3
Bin Temp
(F)
Load (Tons)
(kW/Ton)
Lchwt (F)
Cond Temp
(F)
Load (Tons)
(kW/Ton)
Lchwt (F)
Cond Temp
(F)
Load (Tons)
(kW/Ton)
Lchwt (F)
Cond Temp
(F)97.5 1,690 0.397 44.00 66.28 1,242 0.401 44.00 66.28 1,722 0.416 44.00 66.2892.5 1,609 0.377 44.00 65.21 1,183 0.388 44.00 65.21 1,640 0.413 44.00 65.2187.5 1,529 0.355 44.00 64.13 1,124 0.374 44.00 64.13 1,558 0.411 44.00 64.1382.5 1,649 0.371 44.00 62.52 1,213 0.367 44.00 62.52 1,680 0.406 44.00 62.5277.5 1,558 0.342 44.00 60.53 1,145 0.347 44.00 60.53 1,587 0.403 44.00 60.5372.5 1,467 0.309 44.00 58.78 1,078 0.339 44.00 58.78 1,494 0.401 44.00 58.7867.5 1,375 0.266 44.00 56.48 1,011 0.336 44.00 56.48 1,401 0.400 44.00 56.4862.5 1,283 0.219 44.00 55.00 944 0.331 44.00 55.00 1,307 0.403 44.00 55.0057.5 1,191 0.213 44.00 55.00 876 0.335 44.00 55.00 1,214 0.409 44.00 55.0052.5 1,100 0.210 44.00 55.00 809 0.339 44.00 55.00 1,121 0.416 44.00 55.0047.5 1,288 0.221 44.00 55.00 947 0.332 44.00 55.00 0 0.000 44.00 n/a42.5 0 0.000 44.00 n/a 0 0.000 44.00 n/a 0 0.000 44.00 n/a37.5 0 0.000 44.00 n/a 0 0.000 44.00 n/a 0 0.000 44.00 n/a32.5 0 0.000 44.00 n/a 0 0.000 44.00 n/a 0 0.000 44.00 n/a27.5 0 0.000 44.00 n/a 0 0.000 44.00 n/a 0 0.000 44.00 n/a22.5 0 0.000 44.00 n/a 0 0.000 44.00 n/a 0 0.000 44.00 n/a17.5 0 0.000 44.00 n/a 0 0.000 44.00 n/a 0 0.000 44.00 n/a12.5 0 0.000 44.00 n/a 0 0.000 44.00 n/a 0 0.000 44.00 n/a
7.5 0 0.000 44.00 n/a 0 0.000 44.00 n/a 0 0.000 44.00 n/a
Minimum ECWT condition has been reached for chiller(s): CH-1, CH-2, CH-3Tower cycling assumed to hold minimum ECWT.
Chiller System Optimizer v2.02 Page 3

System PLV ReportProject: Weber State University ----- 09/15/2005Prepared By: 04:13 PM
4b. Chiller System PerformanceCH-4 System
Bin Temp
(F)
Load (Tons)
(kW/Ton)
Lchwt (F)
Cond Temp
(F)
Total (kW)
Total (kW/Ton)
97.5 646 0.401 44.00 66.28 2144 0.40592.5 615 0.388 44.00 65.21 1982 0.39387.5 585 0.374 44.00 64.13 1823 0.38082.5 0 0.000 44.00 n/a 1739 0.38377.5 0 0.000 44.00 n/a 1569 0.36672.5 0 0.000 44.00 n/a 1419 0.35167.5 0 0.000 44.00 n/a 1266 0.33462.5 0 0.000 44.00 n/a 1121 0.31757.5 0 0.000 44.00 n/a 1043 0.31852.5 0 0.000 44.00 n/a 971 0.32147.5 0 0.000 44.00 n/a 599 0.26842.5 0 0.000 44.00 n/a 0 0.00037.5 0 0.000 44.00 n/a 0 0.00032.5 0 0.000 44.00 n/a 0 0.00027.5 0 0.000 44.00 n/a 0 0.00022.5 0 0.000 44.00 n/a 0 0.00017.5 0 0.000 44.00 n/a 0 0.00012.5 0 0.000 44.00 n/a 0 0.000
7.5 0 0.000 44.00 n/a 0 0.000
Chiller System Optimizer v2.02 Page 4

System PLV ReportProject: Weber State University ----- 09/15/2005Prepared By: 04:13 PM
5. SPLV WorksheetBin Temp
(F)Building Load (%)
Building Load
(Tons)
Cooling Hours
Cooling (Ton-hrs)
Bin Wgt Factor
System (kW/Ton)
Bin Ratio
97.5 100 5,300 82 434,600 0.0238 0.405 0.058892.5 95 5,048 245 1,236,760 0.0677 0.393 0.172587.5 90 4,795 263 1,261,085 0.0690 0.380 0.181782.5 86 4,542 313 1,421,646 0.0778 0.383 0.203377.5 81 4,290 392 1,681,680 0.0921 0.366 0.251872.5 76 4,039 517 2,088,163 0.1143 0.351 0.325367.5 71 3,786 525 1,987,650 0.1088 0.334 0.325562.5 67 3,534 575 2,032,050 0.1113 0.317 0.350957.5 62 3,281 721 2,365,601 0.1295 0.318 0.407352.5 57 3,029 685 2,074,865 0.1136 0.321 0.354247.5 42 2,235 752 1,680,720 0.0920 0.268 0.343242.5 37 1,984 776 0 0.0000 0.000 0.000037.5 33 1,731 857 0 0.0000 0.000 0.000032.5 28 1,479 828 0 0.0000 0.000 0.000027.5 23 1,227 671 0 0.0000 0.000 0.000022.5 17 916 221 0 0.0000 0.000 0.000017.5 14 750 135 0 0.0000 0.000 0.000012.5 9 501 70 0 0.0000 0.000 0.0000
7.5 4 216 132 0 0.0000 0.000 0.0000Total: 5,070 18,264,820 1.0000 2.9745
Bin Wgt Factor = Bin Ton-hrs / Total Ton-hrsBin Ratio = [Bin Wgt Factor] / [System kW/Ton]SPLV = 1 / [sum of Bin Ratios]SPLV = 1 / [2.9745] = 0.336 kW/Ton
6. Procedure for Calculating IPLV for Chillers
Procedure for Calculating IPLV for Water-Cooled Electric ChillersChiller
Load (%)LCHWT
(F)Cond
Temp (F)Wgt
FactorChiller
(kW/Ton)Bin Ratio
100 44.00 85.00 0.01 A 0.01/A75 44.00 75.00 0.42 B 0.42/B50 44.00 65.00 0.45 C 0.45/C25 44.00 65.00 0.12 D 0.12/D
Total: 1.00
IPLV = 1 / [sum of Bin Ratios]IPLV = 1 / [0.10/A + 0.42/B + 0.45/C + 0.12/D]per ARI Standard 550/590-1998
Chiller System Optimizer v2.02 Page 5

Custom PLV Factors ReportProject: Weber State University ----- 09/15/2005Prepared By: 04:13 PM
1. Summary of Custom Weighting Factors and ECWTsCustom Weighting Factors Custom Entering Condenser
Temperatures (F)Chiller 25% 50% 75% 100% 25% 50% 75% 100%CH-1 - Carrier 1700 Ton VFD 0.000 0.000 0.699 0.301 n/a n/a 55.7 63.0CH-2 - Trane 1250 0.000 0.000 0.699 0.301 n/a n/a 55.7 63.0CH-3 - Carrier 1700 Ton Constant 0.000 0.000 0.650 0.350 n/a n/a 55.9 63.0CH-4 - Trane 650 0.000 0.000 0.000 1.000 n/a n/a n/a 64.9
2. Input Data Summary
WeatherCity Salt Lake City, UtahSchedule On All Day: Weekday
On All Day: SaturdayOn All Day: Sunday
LoadsUser-Defined Load Profile
Chiller SystemName Combination F-1Chillers in Plant 4Plant Control SequencedFull Load LCHWT 44.0 FTower Configuration One Tower for SystemCooling Tower 6 Cell Tower (2)
Detailed Cooling Tower ModelFree Cooling Plate-Frame Heat Exchanger
Sequence Chiller Name FL Capacity (Tons)
Full Load Power
CH-1 Carrier 1700 Ton VFD 1,700 0.490 kW/TonCH-2 Trane 1250 1,250 0.473 kW/TonCH-3 Carrier 1700 Ton Constant 1,732 0.470 kW/TonCH-4 Trane 650 650 0.473 kW/Ton
Chiller System Optimizer v2.02 Page 1

Custom PLV Factors ReportProject: Weber State University ----- 09/15/2005Prepared By: 04:13 PM
3. Chiller System Operating ConditionsBin Temp (F) Bin MCWB
(F)Building Load
(%)Building Load
(Tons)Chillers On Chiller Load
(%)97.5 61.5 100 5,300 4 9992.5 60.5 95 5,048 4 9587.5 59.5 90 4,795 4 9082.5 57.9 86 4,542 3 9777.5 55.9 81 4,290 3 9272.5 54.2 76 4,039 3 8667.5 51.9 71 3,786 3 8162.5 49.5 67 3,534 3 7557.5 47.1 62 3,281 3 7052.5 43.8 57 3,029 3 6547.5 40.4 42 2,235 2 7642.5 36.9 37 1,984 0 037.5 33.4 33 1,731 0 032.5 29.4 28 1,479 0 027.5 25.1 23 1,227 0 022.5 20.8 17 916 0 017.5 16.0 14 750 0 012.5 11.2 9 501 0 0
7.5 5.9 4 216 0 0
Chiller System Optimizer v2.02 Page 2
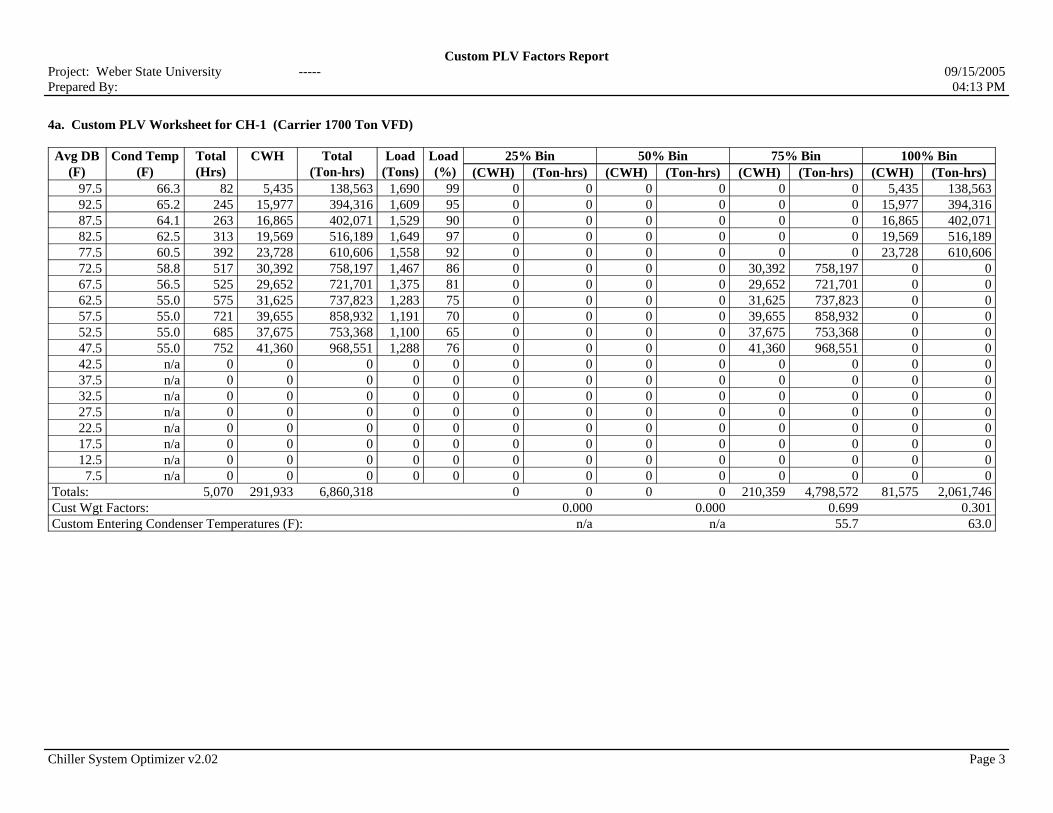
Custom PLV Factors ReportProject: Weber State University ----- 09/15/2005Prepared By: 04:13 PM
4a. Custom PLV Worksheet for CH-1 (Carrier 1700 Ton VFD)
Avg DB Cond Temp Total CWH Total Load Load 25% Bin 50% Bin 75% Bin 100% Bin(F) (F) (Hrs) (Ton-hrs) (Tons) (%) (CWH) (Ton-hrs) (CWH) (Ton-hrs) (CWH) (Ton-hrs) (CWH) (Ton-hrs)
97.5 66.3 82 5,435 138,563 1,690 99 0 0 0 0 0 0 5,435 138,56392.5 65.2 245 15,977 394,316 1,609 95 0 0 0 0 0 0 15,977 394,31687.5 64.1 263 16,865 402,071 1,529 90 0 0 0 0 0 0 16,865 402,07182.5 62.5 313 19,569 516,189 1,649 97 0 0 0 0 0 0 19,569 516,18977.5 60.5 392 23,728 610,606 1,558 92 0 0 0 0 0 0 23,728 610,60672.5 58.8 517 30,392 758,197 1,467 86 0 0 0 0 30,392 758,197 0 067.5 56.5 525 29,652 721,701 1,375 81 0 0 0 0 29,652 721,701 0 062.5 55.0 575 31,625 737,823 1,283 75 0 0 0 0 31,625 737,823 0 057.5 55.0 721 39,655 858,932 1,191 70 0 0 0 0 39,655 858,932 0 052.5 55.0 685 37,675 753,368 1,100 65 0 0 0 0 37,675 753,368 0 047.5 55.0 752 41,360 968,551 1,288 76 0 0 0 0 41,360 968,551 0 042.5 n/a 0 0 0 0 0 0 0 0 0 0 0 0 037.5 n/a 0 0 0 0 0 0 0 0 0 0 0 0 032.5 n/a 0 0 0 0 0 0 0 0 0 0 0 0 027.5 n/a 0 0 0 0 0 0 0 0 0 0 0 0 022.5 n/a 0 0 0 0 0 0 0 0 0 0 0 0 017.5 n/a 0 0 0 0 0 0 0 0 0 0 0 0 012.5 n/a 0 0 0 0 0 0 0 0 0 0 0 0 0
7.5 n/a 0 0 0 0 0 0 0 0 0 0 0 0 0Totals: 5,070 291,933 6,860,318 0 0 0 0 210,359 4,798,572 81,575 2,061,746Cust Wgt Factors: 0.000 0.000 0.699 0.301Custom Entering Condenser Temperatures (F): n/a n/a 55.7 63.0
Chiller System Optimizer v2.02 Page 3

Custom PLV Factors ReportProject: Weber State University ----- 09/15/2005Prepared By: 04:13 PM
4b. Custom PLV Worksheet for CH-2 (Trane 1250)
Avg DB Cond Temp Total CWH Total Load Load 25% Bin 50% Bin 75% Bin 100% Bin(F) (F) (Hrs) (Ton-hrs) (Tons) (%) (CWH) (Ton-hrs) (CWH) (Ton-hrs) (CWH) (Ton-hrs) (CWH) (Ton-hrs)
97.5 66.3 82 5,435 101,885 1,242 99 0 0 0 0 0 0 5,435 101,88592.5 65.2 245 15,977 289,938 1,183 95 0 0 0 0 0 0 15,977 289,93887.5 64.1 263 16,865 295,641 1,124 90 0 0 0 0 0 0 16,865 295,64182.5 62.5 313 19,569 379,551 1,213 97 0 0 0 0 0 0 19,569 379,55177.5 60.5 392 23,728 448,975 1,145 92 0 0 0 0 0 0 23,728 448,97572.5 58.8 517 30,392 557,498 1,078 86 0 0 0 0 30,392 557,498 0 067.5 56.5 525 29,652 530,663 1,011 81 0 0 0 0 29,652 530,663 0 062.5 55.0 575 31,625 542,517 944 75 0 0 0 0 31,625 542,517 0 057.5 55.0 721 39,655 631,568 876 70 0 0 0 0 39,655 631,568 0 052.5 55.0 685 37,675 553,947 809 65 0 0 0 0 37,675 553,947 0 047.5 55.0 752 41,360 712,170 947 76 0 0 0 0 41,360 712,170 0 042.5 n/a 0 0 0 0 0 0 0 0 0 0 0 0 037.5 n/a 0 0 0 0 0 0 0 0 0 0 0 0 032.5 n/a 0 0 0 0 0 0 0 0 0 0 0 0 027.5 n/a 0 0 0 0 0 0 0 0 0 0 0 0 022.5 n/a 0 0 0 0 0 0 0 0 0 0 0 0 017.5 n/a 0 0 0 0 0 0 0 0 0 0 0 0 012.5 n/a 0 0 0 0 0 0 0 0 0 0 0 0 0
7.5 n/a 0 0 0 0 0 0 0 0 0 0 0 0 0Totals: 5,070 291,933 5,044,351 0 0 0 0 210,359 3,528,362 81,575 1,515,989Cust Wgt Factors: 0.000 0.000 0.699 0.301Custom Entering Condenser Temperatures (F): n/a n/a 55.7 63.0
Chiller System Optimizer v2.02 Page 4

Custom PLV Factors ReportProject: Weber State University ----- 09/15/2005Prepared By: 04:13 PM
4c. Custom PLV Worksheet for CH-3 (Carrier 1700 Ton Constant)
Avg DB Cond Temp Total CWH Total Load Load 25% Bin 50% Bin 75% Bin 100% Bin(F) (F) (Hrs) (Ton-hrs) (Tons) (%) (CWH) (Ton-hrs) (CWH) (Ton-hrs) (CWH) (Ton-hrs) (CWH) (Ton-hrs)
97.5 66.3 82 5,435 141,172 1,722 99 0 0 0 0 0 0 5,435 141,17292.5 65.2 245 15,977 401,738 1,640 95 0 0 0 0 0 0 15,977 401,73887.5 64.1 263 16,865 409,640 1,558 90 0 0 0 0 0 0 16,865 409,64082.5 62.5 313 19,569 525,906 1,680 97 0 0 0 0 0 0 19,569 525,90677.5 60.5 392 23,728 622,100 1,587 92 0 0 0 0 0 0 23,728 622,10072.5 58.8 517 30,392 772,469 1,494 86 0 0 0 0 30,392 772,469 0 067.5 56.5 525 29,652 735,286 1,401 81 0 0 0 0 29,652 735,286 0 062.5 55.0 575 31,625 751,711 1,307 75 0 0 0 0 31,625 751,711 0 057.5 55.0 721 39,655 875,101 1,214 70 0 0 0 0 39,655 875,101 0 052.5 55.0 685 37,675 767,549 1,121 65 0 0 0 0 37,675 767,549 0 047.5 n/a 0 0 0 0 0 0 0 0 0 0 0 0 042.5 n/a 0 0 0 0 0 0 0 0 0 0 0 0 037.5 n/a 0 0 0 0 0 0 0 0 0 0 0 0 032.5 n/a 0 0 0 0 0 0 0 0 0 0 0 0 027.5 n/a 0 0 0 0 0 0 0 0 0 0 0 0 022.5 n/a 0 0 0 0 0 0 0 0 0 0 0 0 017.5 n/a 0 0 0 0 0 0 0 0 0 0 0 0 012.5 n/a 0 0 0 0 0 0 0 0 0 0 0 0 0
7.5 n/a 0 0 0 0 0 0 0 0 0 0 0 0 0Totals: 4,318 250,573 6,002,671 0 0 0 0 168,999 3,902,116 81,575 2,100,555Cust Wgt Factors: 0.000 0.000 0.650 0.350Custom Entering Condenser Temperatures (F): n/a n/a 55.9 63.0
Chiller System Optimizer v2.02 Page 5

Custom PLV Factors ReportProject: Weber State University ----- 09/15/2005Prepared By: 04:13 PM
4d. Custom PLV Worksheet for CH-4 (Trane 650)
Avg DB Cond Temp Total CWH Total Load Load 25% Bin 50% Bin 75% Bin 100% Bin(F) (F) (Hrs) (Ton-hrs) (Tons) (%) (CWH) (Ton-hrs) (CWH) (Ton-hrs) (CWH) (Ton-hrs) (CWH) (Ton-hrs)
97.5 66.3 82 5,435 52,980 646 99 0 0 0 0 0 0 5,435 52,98092.5 65.2 245 15,977 150,768 615 95 0 0 0 0 0 0 15,977 150,76887.5 64.1 263 16,865 153,733 585 90 0 0 0 0 0 0 16,865 153,73382.5 n/a 0 0 0 0 0 0 0 0 0 0 0 0 077.5 n/a 0 0 0 0 0 0 0 0 0 0 0 0 072.5 n/a 0 0 0 0 0 0 0 0 0 0 0 0 067.5 n/a 0 0 0 0 0 0 0 0 0 0 0 0 062.5 n/a 0 0 0 0 0 0 0 0 0 0 0 0 057.5 n/a 0 0 0 0 0 0 0 0 0 0 0 0 052.5 n/a 0 0 0 0 0 0 0 0 0 0 0 0 047.5 n/a 0 0 0 0 0 0 0 0 0 0 0 0 042.5 n/a 0 0 0 0 0 0 0 0 0 0 0 0 037.5 n/a 0 0 0 0 0 0 0 0 0 0 0 0 032.5 n/a 0 0 0 0 0 0 0 0 0 0 0 0 027.5 n/a 0 0 0 0 0 0 0 0 0 0 0 0 022.5 n/a 0 0 0 0 0 0 0 0 0 0 0 0 017.5 n/a 0 0 0 0 0 0 0 0 0 0 0 0 012.5 n/a 0 0 0 0 0 0 0 0 0 0 0 0 0
7.5 n/a 0 0 0 0 0 0 0 0 0 0 0 0 0Totals: 590 38,277 357,481 0 0 0 0 0 0 38,277 357,481Cust Wgt Factors: 0.000 0.000 0.000 1.000Custom Entering Condenser Temperatures (F): n/a n/a n/a 64.9
Chiller System Optimizer v2.02 Page 6

Custom PLV Factors ReportProject: Weber State University ----- 09/15/2005Prepared By: 04:13 PM
KEY for Custom PLV Worksheet table(s):[Avg DB] = Midpoint temperature for bin.[Cond Temp] = Entering condenser temperature for bin. Entering water temperature for water-cooled chillers. Entering air temperature for air-cooled chillers.[Tot Hrs] = Hours of operation in bin.[CWH] = Condenser temperature hours. [Tot Hrs] times [Cond Temp]. Later used to derive the four average entering condenser temperature values for the PLV calculation.[Load] = Chiller load for bin.[Load (%)] = Chiller load as a percentage of full load capacity.[Total (Ton-hrs)] = Chiller [Load] times [Tot Hrs]. Later used to derive the four weighting factors for the PLV calculation.[Bin (CWH)] = [CWH] values separated into the four PLV bins: 25%, 50%, 75% and 100% load according to chiller load for each bin.[Bin (Ton-hrs)] = Values separated into the four PLV bins: 25%, 50%, 75% and 100% load according to the chiller load for each bin.[Cust Wgt Factor] = The four custom PLV weighting factors. [Total (Ton-hrs)] for PLV Bin divided by [Total (Ton-hrs)] for the chiller.[Cust Ent Cond Temps] = The four custom condenser temperature values for the PLV calculation = [Total (CWH)] for PLV bin divided by [Tot Hrs] in the PLV bin.
Chiller System Optimizer v2.02 Page 7

System Load ProfilesProject: Weber State University ----- 09/15/2005Prepared By: 04:13 PM
0
10
20
30
40
50
60
70
80
90
100
0 10 20 30 40 50 60 70 80 90 100
Chi
ller L
oad
(%)
Building Load (%)
CH-1 CH-2 CH-3 CH-4
Note: Individual chiller curves in this graph have been adjusted up or down so the number of chillers operating at each point can be seen. If the curves had not been adjusted, all curves would lie on top of each other. Because of the adjustment each chiller load shown on the graph is only accurate to within a few percentage points plus or minus of the original calculated values.
2. Input Data Summary
WeatherCity Salt Lake City, UtahSchedule On All Day: Weekday
On All Day: SaturdayOn All Day: Sunday
LoadsUser-Defined Load Profile
Chiller SystemName Combination F-1Chillers in Plant 4Plant Control SequencedFull Load LCHWT 44.0 FTower Configuration One Tower for SystemCooling Tower 6 Cell Tower (2)
Detailed Cooling Tower ModelFree Cooling Plate-Frame Heat Exchanger
Sequence Chiller Name FL Capacity (Tons)
Full Load Power
CH-1 Carrier 1700 Ton VFD 1,700 0.490 kW/TonCH-2 Trane 1250 1,250 0.473 kW/TonCH-3 Carrier 1700 Ton Constant 1,732 0.470 kW/TonCH-4 Trane 650 650 0.473 kW/Ton
Chiller System Optimizer v2.02 Page 1

System Performance ProfileProject: Weber State University ----- 09/15/2005Prepared By: 04:13 PM
0
250000
500000
750000
1000000
1250000
1500000
1750000
2000000
2250000
0.275
0.300
0.325
0.350
0.375
0.400
0 10 20 30 40 50 60 70 80 90 100
Coo
ling
Ton-
hrs
Per
Yea
r Chiller S
ystem kW
/Ton
Building Load (%)
Cooling Ton-hrs Chiller System kW/Ton
2. Input Data Summary
WeatherCity Salt Lake City, UtahSchedule On All Day: Weekday
On All Day: SaturdayOn All Day: Sunday
LoadsUser-Defined Load Profile
Chiller SystemName Combination F-1Chillers in Plant 4Plant Control SequencedFull Load LCHWT 44.0 FTower Configuration One Tower for SystemCooling Tower 6 Cell Tower (2)
Detailed Cooling Tower ModelFree Cooling Plate-Frame Heat Exchanger
Sequence Chiller Name FL Capacity (Tons)
Full Load Power
CH-1 Carrier 1700 Ton VFD 1,700 0.490 kW/TonCH-2 Trane 1250 1,250 0.473 kW/TonCH-3 Carrier 1700 Ton Constant 1,732 0.470 kW/TonCH-4 Trane 650 650 0.473 kW/Ton
Chiller System Optimizer v2.02 Page 1

Appendix A.7. Estimates of Service Lives of Various System Components
Equipment Item Median
Years
Equipment Item Median
Years
Equipment Item Median
Years
Air Conditioners Air Terminals Air-cooled condensers . . . . . . 20
Window unit . . . . . . . . . . . . . . . . 10 Diffusers, grilles, registers . . . 27 Evaporative condensers . . . . . 20
Residential single or split package . . . . . . . . . . . . . . . . . . . . . . . .
15 Induction and fan-coil units . . . . . 20 Insulation
Commercial through-the-wall . . . . . . . . . 15 VAV and double-duct boxes . . . . 20 Molded . . . . . . . . . . . . . . . . . 20
Water cooled package . . . . . . . . . . . . . 15 Air Washers . . . . . . . . . . . . . . 17 Blanket . . . . . . . . . . . . . . . . 24
Heat pumps Ductwork . . . . . . . . . . . . . . . . 30 Pumps
Residential air-to-air . . . . . . . . . . . . 15* Dampers . . . . . . . . . . . . . . . . . 20 Base-mounted . . . . . . . . . . . . . . 20
Commercial air-to-air . . . . . . . . . . . 15 Fans Pipe-mounted . . . . . . . . . . . . . . 10
Commercial water-to-air . . . . . . . . . 19 Centrifugal . . . . . . . . . . . . . . . 25 Sump and well . . . . . . . . . . . . 10
Roof-top air conditioners Axial . . . . . . . . . . . . . . . . . . . 20 Condensate . . . . . . . . . . . . . . . 15
Single-zone . . . . . . . . . . . . . . . . . . 15 Propeller . . . . . . . . . . . . . . . . . 15 Reciprocating engines . . . . . . . 20
Mulitzone . . . . . . . . . . . . . . . . . . . 15 Ventilating roof-mounted . . . . . . . . 20 Steam turbines . . . . . . . . . . . . . 30
Boilers steam Coils Electric motors . . . . . . . . . . . . . 18
Steel water-tube . . . . . . . . . . . . . . 24 (30) DX, water, or steam . . . . . . . . . 20 Motor starters . . . . . . . . . . . . . 17
Steel fire-tube . . . . . . . . . . . . . . . 25 (25) Electric . . . . . . . . . . . . . . . 15 Electric transformers . . . . . . . . 30
Cast iron . . . . . . . . . . . . . . . . . . . . 35 (30) Heat Exchangers Controls
Electric . . . . . . . . . . . . . . . . . . . . 15 Shell-and-tube . . . . . . . . . . 24 Pneumatic . . . . . . . . . . . . . . . . 20
Burners . . . . . . . . . . . . . . . . . . . . 21 Reciprocating compressors . . . . . 20 Electric . . . . . . . . . . . . . . . 16
Furnaces Package chillers Electronic . . . . . . . . . . . . . 15
Gas- or oil-fired . . . . . . . . . . . . . 18 Reciprocating . . . . . . . . . . . 20 Valve actuators
Unit heaters Centrifugal . . . . . . . . . . . . . 23 Hydraulic . . . . . . . . . . . . . . . 15
Gas or electric . . . . . . . . . . . . . . 13 Absorption . . . . . . . . . . . . . 23 Pneumatic . . . . . . . . . . . . . . . . 20
Hot water or steam . . . . . . . . . . . . . . 20 Cooling towers Self-contained . . . . . . . . . . . 10
Radiant heaters Galvanized metal . . . . . . . . . . 20
Electric . . . . . . . . . . . . . . . . . . . . . 10 Wood . . . . . . . . . . . . . . . . . 20
Hot-water or steam . . . . . . . . . . . . 25 Ceramic . . . . . . . . . . . . . . . 34
Source: Data obtained from a national survey of the United States by ASHRAE Technical Committee TC 1.8 (Akalin 1978). Data updated by TC 1.8 in 1986.*See Lovvorn and Hiller (1985) and Easton Consultants (1986) for further information.