webmethods trading networks 9.8 on the oracle solaris ... 98 solaris m6_tcm121... · the oracle...
TRANSCRIPT
1/27/2016 ©2015 Software AG. All rights reserved.
webMethods Trading Networks 9.8 on the Oracle Solaris Operating System
Performance Technical Report
webMethods Trading Networks 9.8 on the Oracle Solaris OS March 2016
2 ©2015 Software AG. All rights reserved.
Table of Contents
1.0 Introduction .................................................................................. 3
2.0 Benchmark Goals ............................................................................ 3
2.1 Capacity Planning Needs ................................................................ 3
3.0 Hardware and Software Information ..................................................... 4
3.1 Software Information .................................................................... 4
4.0 Deployment Architecture Diagram ....................................................... 5
5.0 Test Harness .................................................................................. 6
6.0 Test Setup And Test Conditions ........................................................... 7
7.0 Benchmark Results ........................................................................... 8
7.1 Effect of Varying Document Size and Number of Document Types ............... 8
7.1.1 Results .............................................................................. 8
7.1.2 CPU Utilization ..................................................................... 8
7.2 Effect of Varying Document Size and Rules ......................................... 11
7.2.1 Results ............................................................................. 11
7.2.2 CPU Utilization .................................................................... 11
7.3 Throughput Chart with Varying Partners ............................................ 13
7.3.1 Results .............................................................................. 13
7.3.2 CPU Utilization .................................................................... 13
8.0 Conclusion ................................................................................... 15
9.0 Appendix ..................................................................................... 16
9.1 Terminology ............................................................................. 16
9.2 Product Tuning .......................................................................... 17
9.3 OS/ HW Tuning .......................................................................... 17
9.4 Build and fixes. .......................................................................... 17
9.5 What this Report Does Not Cover ..................................................... 17
webMethods Trading Networks 9.8 on the Oracle Solaris OS March 2016
3 ©2015 Software AG. All rights reserved.
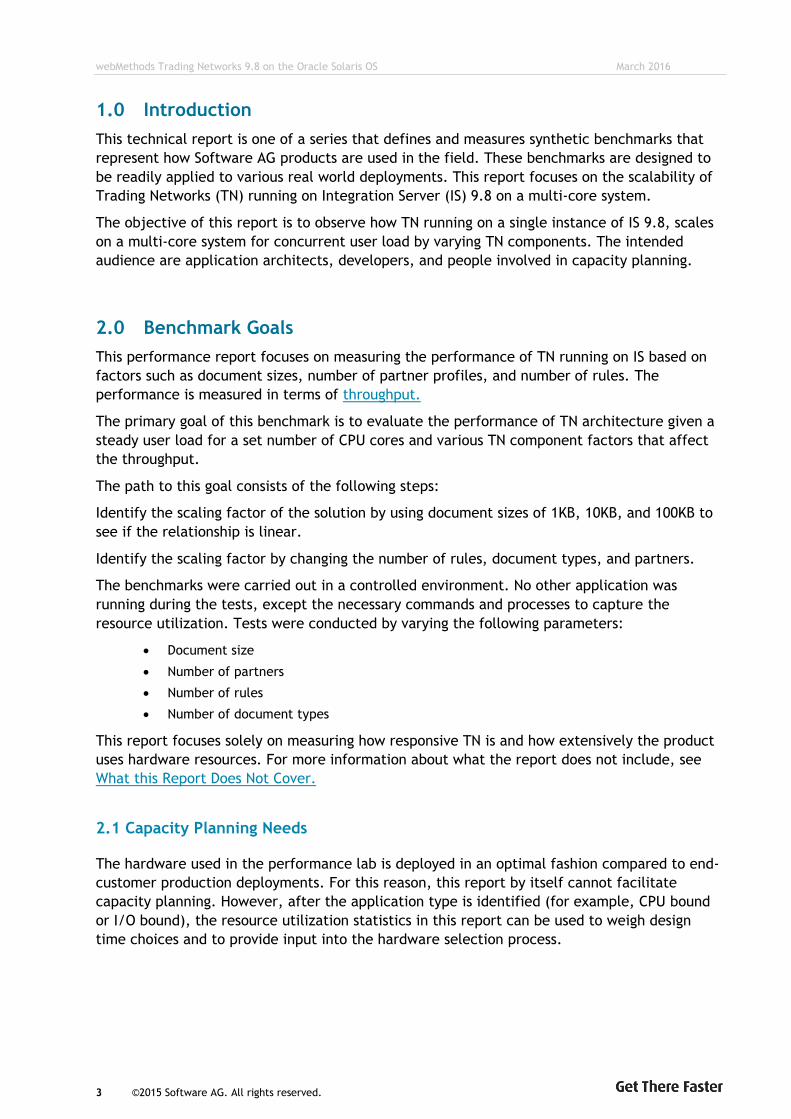
1.0 Introduction
This technical report is one of a series that defines and measures synthetic benchmarks that
represent how Software AG products are used in the field. These benchmarks are designed to
be readily applied to various real world deployments. This report focuses on the scalability of
Trading Networks (TN) running on Integration Server (IS) 9.8 on a multi-core system.
The objective of this report is to observe how TN running on a single instance of IS 9.8, scales
on a multi-core system for concurrent user load by varying TN components. The intended
audience are application architects, developers, and people involved in capacity planning.
2.0 Benchmark Goals
This performance report focuses on measuring the performance of TN running on IS based on
factors such as document sizes, number of partner profiles, and number of rules. The
performance is measured in terms of throughput.
The primary goal of this benchmark is to evaluate the performance of TN architecture given a
steady user load for a set number of CPU cores and various TN component factors that affect
the throughput.
The path to this goal consists of the following steps:
Identify the scaling factor of the solution by using document sizes of 1KB, 10KB, and 100KB to
see if the relationship is linear.
Identify the scaling factor by changing the number of rules, document types, and partners.
The benchmarks were carried out in a controlled environment. No other application was
running during the tests, except the necessary commands and processes to capture the
resource utilization. Tests were conducted by varying the following parameters:
Document size
Number of partners
Number of rules
Number of document types
This report focuses solely on measuring how responsive TN is and how extensively the product
uses hardware resources. For more information about what the report does not include, see
What this Report Does Not Cover.
2.1 Capacity Planning Needs
The hardware used in the performance lab is deployed in an optimal fashion compared to end-
customer production deployments. For this reason, this report by itself cannot facilitate
capacity planning. However, after the application type is identified (for example, CPU bound
or I/O bound), the resource utilization statistics in this report can be used to weigh design
time choices and to provide input into the hardware selection process.
webMethods Trading Networks 9.8 on the Oracle Solaris OS March 2016
4 ©2015 Software AG. All rights reserved.
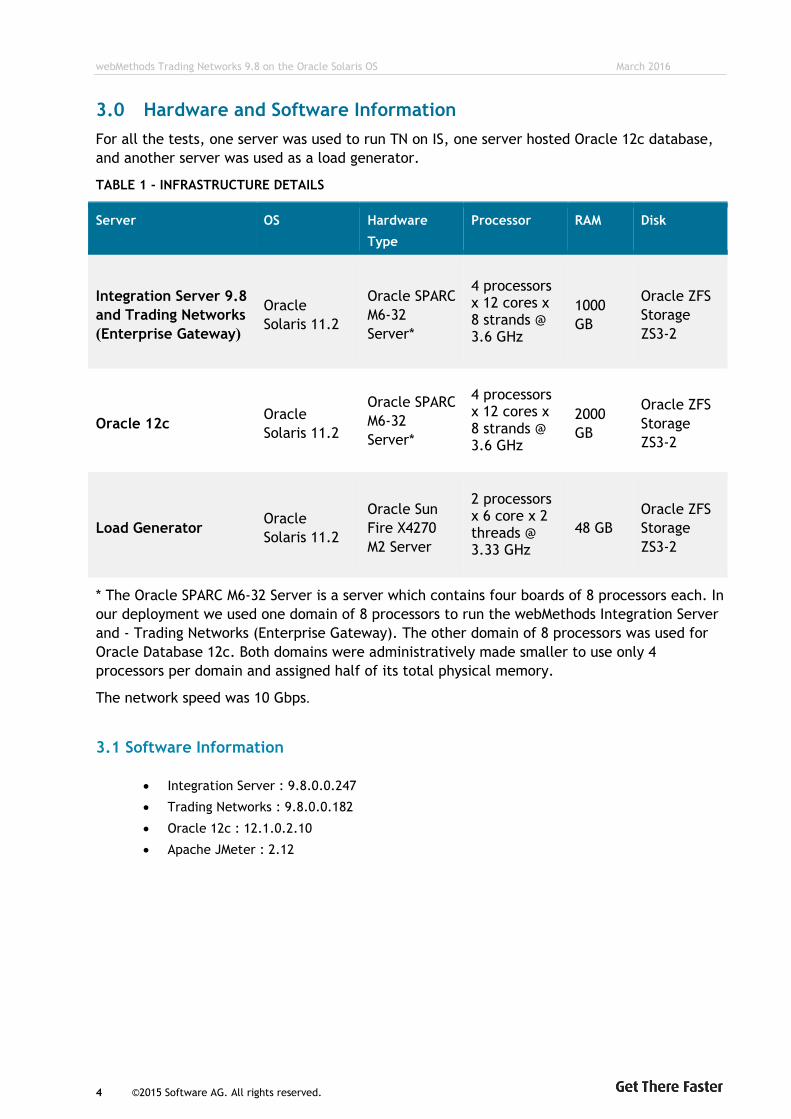
3.0 Hardware and Software Information
For all the tests, one server was used to run TN on IS, one server hosted Oracle 12c database,
and another server was used as a load generator.
TABLE 1 - INFRASTRUCTURE DETAILS
Server OS Hardware
Type
Processor RAM Disk
Integration Server 9.8
and Trading Networks
(Enterprise Gateway)
Oracle
Solaris 11.2
Oracle SPARC
M6-32
Server*
4 processors x 12 cores x 8 strands @ 3.6 GHz
1000
GB
Oracle ZFS
Storage
ZS3-2
Oracle 12c Oracle
Solaris 11.2
Oracle SPARC
M6-32
Server*
4 processors x 12 cores x 8 strands @ 3.6 GHz
2000
GB
Oracle ZFS
Storage
ZS3-2
Load Generator Oracle
Solaris 11.2
Oracle Sun
Fire X4270
M2 Server
2 processors x 6 core x 2 threads @ 3.33 GHz
48 GB
Oracle ZFS
Storage
ZS3-2
* The Oracle SPARC M6-32 Server is a server which contains four boards of 8 processors each. In
our deployment we used one domain of 8 processors to run the webMethods Integration Server
and - Trading Networks (Enterprise Gateway). The other domain of 8 processors was used for
Oracle Database 12c. Both domains were administratively made smaller to use only 4
processors per domain and assigned half of its total physical memory.
The network speed was 10 Gbps.
3.1 Software Information
Integration Server : 9.8.0.0.247
Trading Networks : 9.8.0.0.182
Oracle 12c : 12.1.0.2.10
Apache JMeter : 2.12
webMethods Trading Networks 9.8 on the Oracle Solaris OS March 2016
5 ©2015 Software AG. All rights reserved.
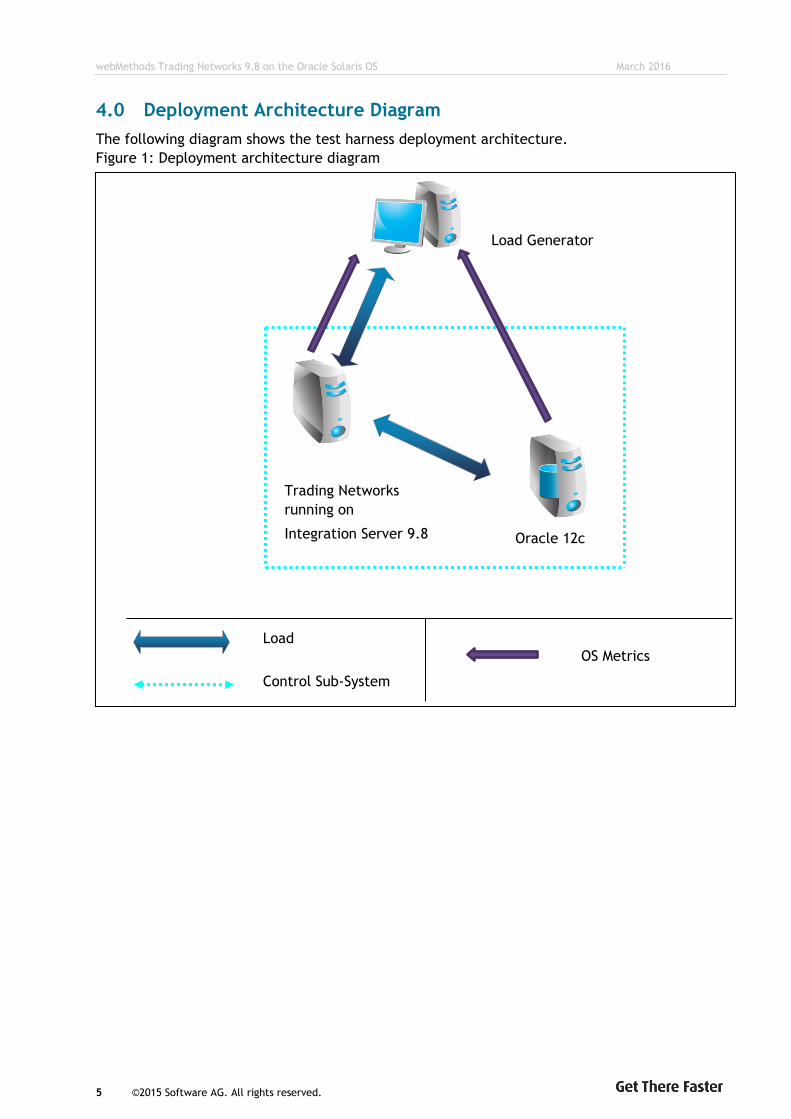
4.0 Deployment Architecture Diagram
The following diagram shows the test harness deployment architecture.
Figure 1: Deployment architecture diagram
OS Metrics
Oracle 12c
Load
Control Sub-System
Trading Networks
running on
Integration Server 9.8
Load Generator
webMethods Trading Networks 9.8 on the Oracle Solaris OS March 2016
6 ©2015 Software AG. All rights reserved.
5.0 Test Harness
The idea of benchmarking is to saturate the system under test by loading it to the maximum
stable state and collecting performance data. A load generator was used to generate the load
in the form of virtual users who perform desirable actions. The load generator‘s state was
constantly monitored and it was observed that the load generator did not create a bottleneck
in the system.
The tools and utilities used to perform the tests and to capture the resource utilization
statistics were:
Apache JMeter 2.13
nicstat, iostat, and vmstat
Multiple instances of Apache JMeter were used to inject numerous requests into the TN Server
to measure the number of transactions per second and the response time. The dstat utility was
used to collect CPU information for the system under test.
The tests were executed in a controlled environment and the systems tested did not run any
other resource consuming applications.
The collected server metrics include statistics about CPU utilization only.
webMethods Trading Networks 9.8 on the Oracle Solaris OS March 2016
7 ©2015 Software AG. All rights reserved.
6.0 Test Setup And Test Conditions
In the test setup, IS ran TN with varying numbers of partners , routing rules, and different
document sizes. The TN wm.tn:receive built-in service was used to trigger the process. The
test was run with a steady load to achieve the maximum throughput. A no-op service was used
to measure the performance of the TN and minimize the effect of any worload. The real-world
usage matching the same processing rules will be relatively slower depending on the actual
service invoked. The numbers listed in the charts should be treated as representing a best-case
scenario, in which only TN related work was performed. However, the numbers were not
obtained under the best possible circumstances, because the rules or data were not skewed to
produce higher throughput.
Apache JMeter load generator submitted an XML document via HTTP POST to the
wm.tn:receive service. Based on the test, documents with size of 1KB, 10KB, and 100KB were
sent. TN recognized the document, and the matching rule saved the document to the database
and synchronously called a no-op service. The service used for the tests was stateless and it
did not reuse sessions. Each request represented a new user submitting a request.
The matching rules were placed at the bottom of the rules list. This means that TN had to
check each rule in the list before it found the matching rule. For each non-matching rule, a
check was made for two attributes that were guaranteed not to exist in the sample data. In
real-world usage, assuming all rules are uniformly chosen, these test cases would be
equivalent to having twice as many processing rules because, on an average, half the rules
would need to be checked to find the result. These tests do not exhaust the variability possible
in TN configuration, but they represent what occurs in many TN deployments. The throughput
and resource utilization statistics were captured for all the tests.
webMethods Trading Networks 9.8 on the Oracle Solaris OS March 2016
8 ©2015 Software AG. All rights reserved.
7.0 Benchmark Results
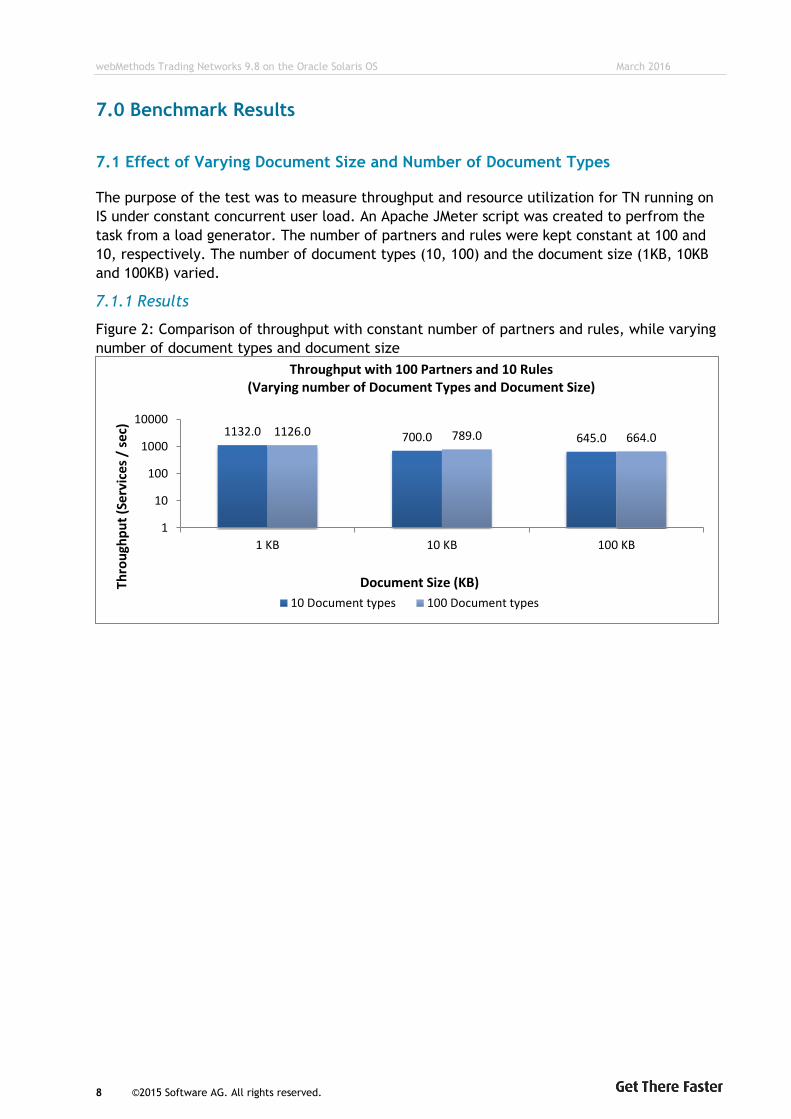
7.1 Effect of Varying Document Size and Number of Document Types
The purpose of the test was to measure throughput and resource utilization for TN running on
IS under constant concurrent user load. An Apache JMeter script was created to perfrom the
task from a load generator. The number of partners and rules were kept constant at 100 and
10, respectively. The number of document types (10, 100) and the document size (1KB, 10KB
and 100KB) varied.
7.1.1 Results
Figure 2: Comparison of throughput with constant number of partners and rules, while varying
number of document types and document size
1132.0 700.0 645.0 1126.0 789.0 664.0
1
10
100
1000
10000
1 KB 10 KB 100 KB
Thro
ugh
pu
t (S
erv
ice
s /
sec)
Document Size (KB)
Throughput with 100 Partners and 10 Rules (Varying number of Document Types and Document Size)
10 Document types 100 Document types
webMethods Trading Networks 9.8 on the Oracle Solaris OS March 2016
9 ©2015 Software AG. All rights reserved.
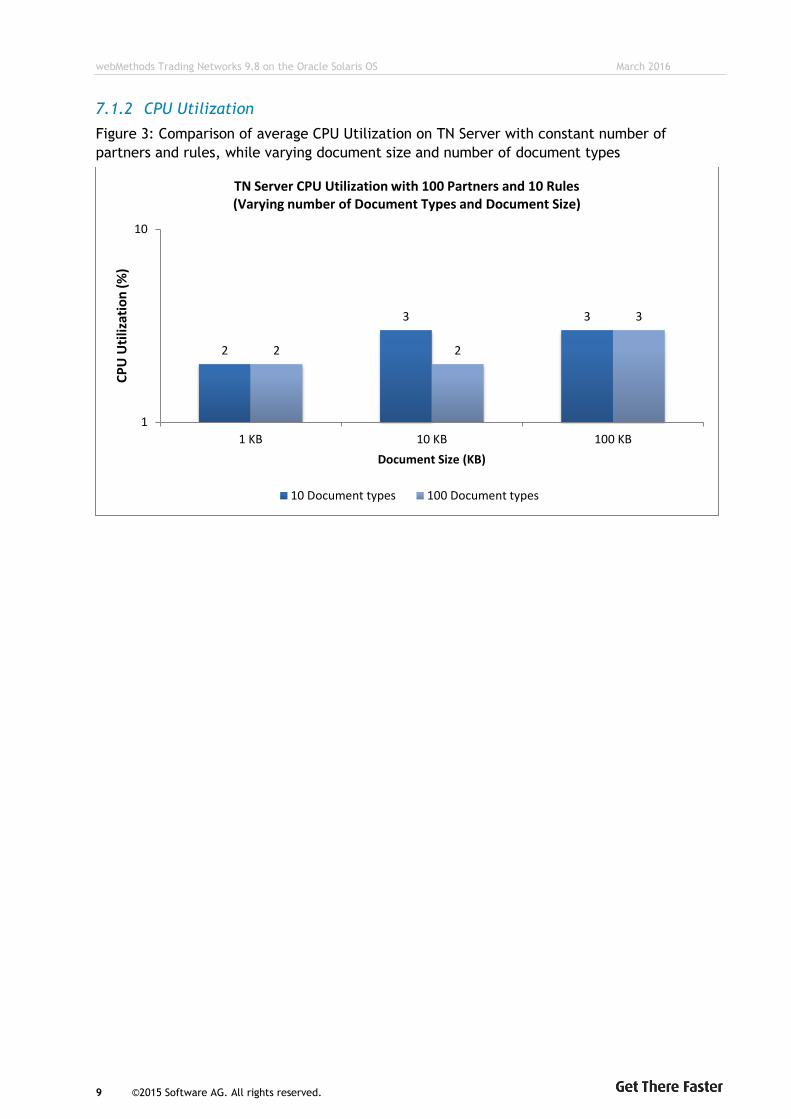
7.1.2 CPU Utilization
Figure 3: Comparison of average CPU Utilization on TN Server with constant number of
partners and rules, while varying document size and number of document types
2
3 3
2 2
3
1
10
1 KB 10 KB 100 KB
CP
U U
tiliz
atio
n (
%)
Document Size (KB)
TN Server CPU Utilization with 100 Partners and 10 Rules (Varying number of Document Types and Document Size)
10 Document types 100 Document types
webMethods Trading Networks 9.8 on the Oracle Solaris OS March 2016
10 ©2015 Software AG. All rights reserved.
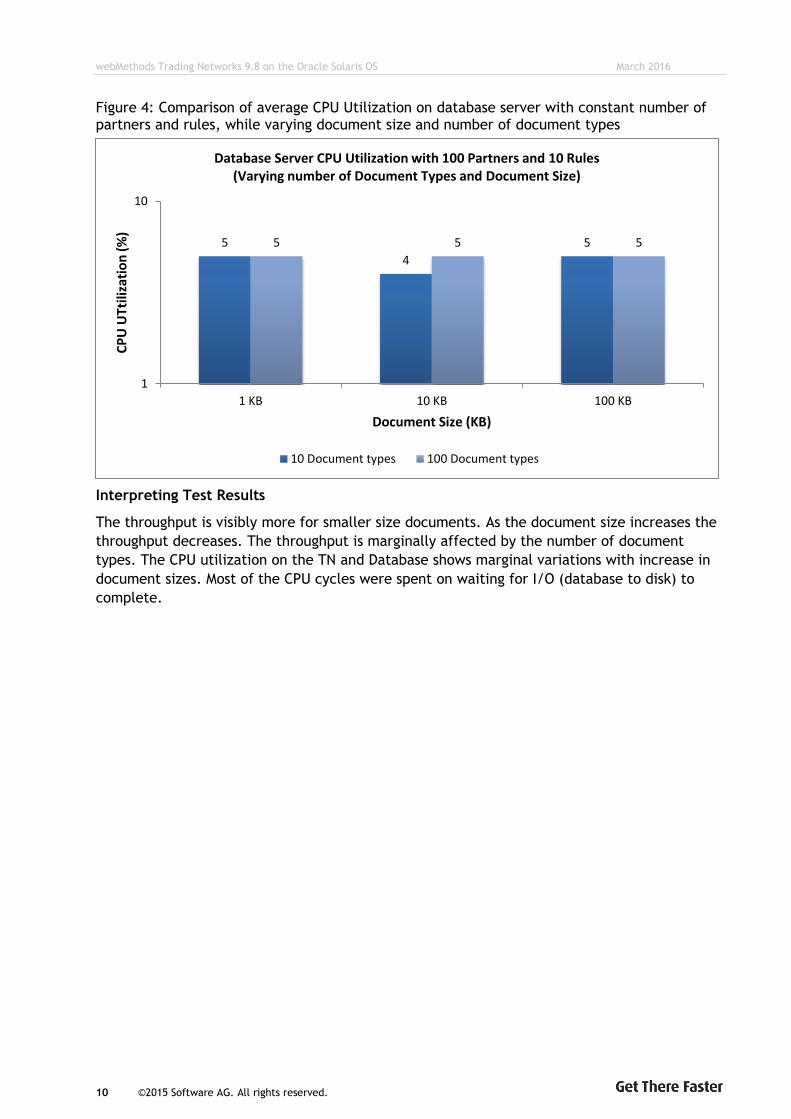
Figure 4: Comparison of average CPU Utilization on database server with constant number of partners and rules, while varying document size and number of document types
Interpreting Test Results
The throughput is visibly more for smaller size documents. As the document size increases the
throughput decreases. The throughput is marginally affected by the number of document
types. The CPU utilization on the TN and Database shows marginal variations with increase in
document sizes. Most of the CPU cycles were spent on waiting for I/O (database to disk) to
complete.
5
4
5 5 5 5
1
10
1 KB 10 KB 100 KB
CP
U U
Ttili
zati
on
(%
)
Document Size (KB)
Database Server CPU Utilization with 100 Partners and 10 Rules (Varying number of Document Types and Document Size)
10 Document types 100 Document types
webMethods Trading Networks 9.8 on the Oracle Solaris OS March 2016
11 ©2015 Software AG. All rights reserved.
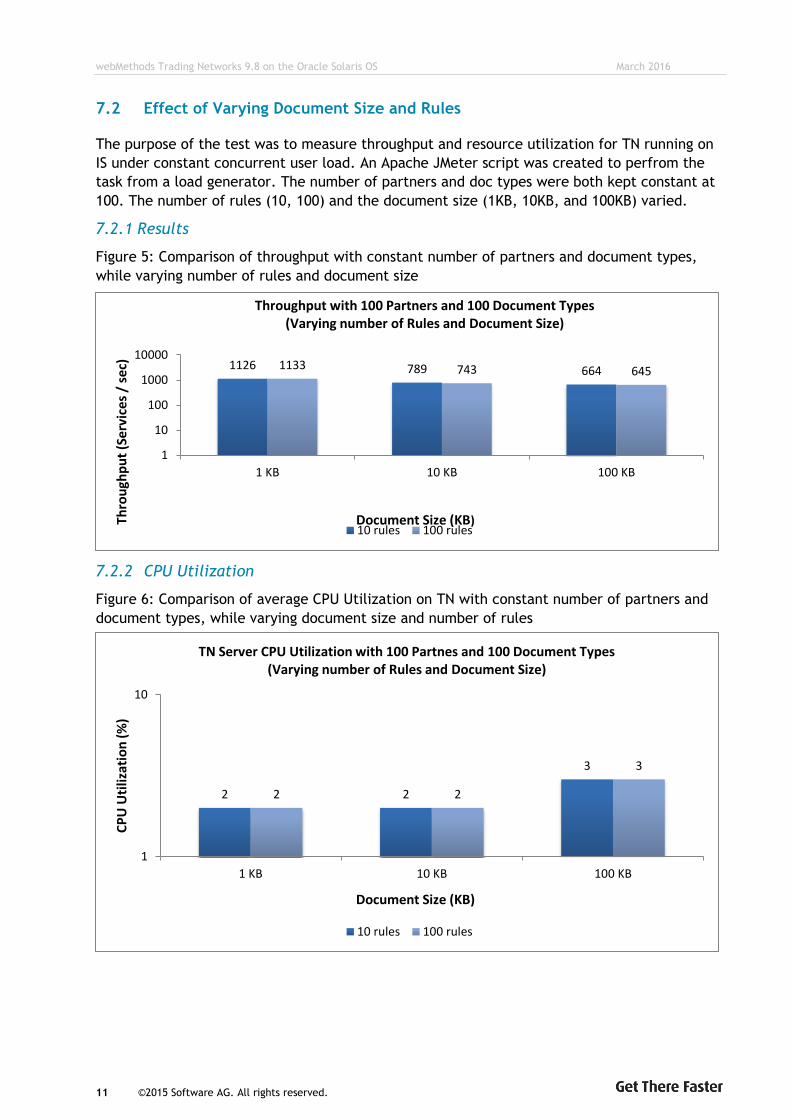
7.2 Effect of Varying Document Size and Rules
The purpose of the test was to measure throughput and resource utilization for TN running on
IS under constant concurrent user load. An Apache JMeter script was created to perfrom the
task from a load generator. The number of partners and doc types were both kept constant at
100. The number of rules (10, 100) and the document size (1KB, 10KB, and 100KB) varied.
7.2.1 Results
Figure 5: Comparison of throughput with constant number of partners and document types,
while varying number of rules and document size
7.2.2 CPU Utilization
Figure 6: Comparison of average CPU Utilization on TN with constant number of partners and
document types, while varying document size and number of rules
1126 789 664 1133 743 645
1
10
100
1000
10000
1 KB 10 KB 100 KB
Thro
ugh
pu
t (S
ervi
ces
/ se
c)
Document Size (KB)
Throughput with 100 Partners and 100 Document Types (Varying number of Rules and Document Size)
10 rules 100 rules
2 2
3
2 2
3
1
10
1 KB 10 KB 100 KB
CP
U U
tiliz
atio
n (
%)
Document Size (KB)
TN Server CPU Utilization with 100 Partnes and 100 Document Types (Varying number of Rules and Document Size)
10 rules 100 rules
webMethods Trading Networks 9.8 on the Oracle Solaris OS March 2016
12 ©2015 Software AG. All rights reserved.
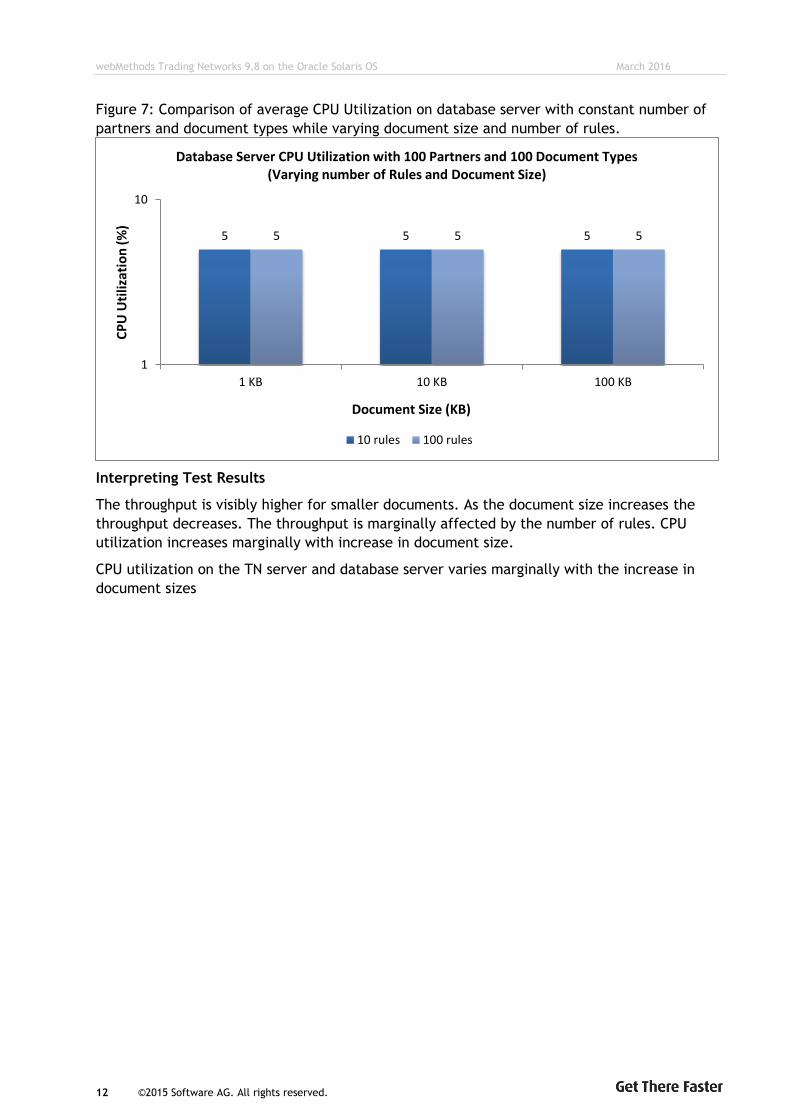
Figure 7: Comparison of average CPU Utilization on database server with constant number of
partners and document types while varying document size and number of rules.
Interpreting Test Results
The throughput is visibly higher for smaller documents. As the document size increases the
throughput decreases. The throughput is marginally affected by the number of rules. CPU
utilization increases marginally with increase in document size.
CPU utilization on the TN server and database server varies marginally with the increase in
document sizes
5 5 5 5 5 5
1
10
1 KB 10 KB 100 KB
CP
U U
tiliz
atio
n (
%)
Document Size (KB)
Database Server CPU Utilization with 100 Partners and 100 Document Types (Varying number of Rules and Document Size)
10 rules 100 rules

webMethods Trading Networks 9.8 on the Oracle Solaris OS March 2016
13 ©2015 Software AG. All rights reserved.
7.3 Throughput Chart with Varying Partners
7.3.1 Results
Figure 8: Comparison of throughput with constant document size, constant number of
document types, constant number of rules, and varying number of partners.
7.3.2 CPU Utilization
Figure 9: Comparison of average CPU Utilization on TN with constant number of document
types, rules, and document size, while varying number of partners
1125.00 1119.00 1132.00
1.00
10.00
100.00
1000.00
10000.00
1 Partner 10 Partners 100 partners
Thro
ugh
pu
t (S
ervi
ce /
sec
)
Number of Partners
Throughtput with 10 Document Types, 10 Rules and 1 KB Document Size (Varying number of Partners)
10 Document Types 10 Rules 1 KB Document Size
2
3 3
1
10
1 Partner 10 Partners 100 partners
CP
U U
tiliz
atio
n (
%)
Number of Partners
TN CPU Utilization with 10 Document Types, 10 Rules and 1 KB Document Size (Varying number of Partners)
10 Document Types 10 Rules 1 KB Document Size
webMethods Trading Networks 9.8 on the Oracle Solaris OS March 2016
14 ©2015 Software AG. All rights reserved.
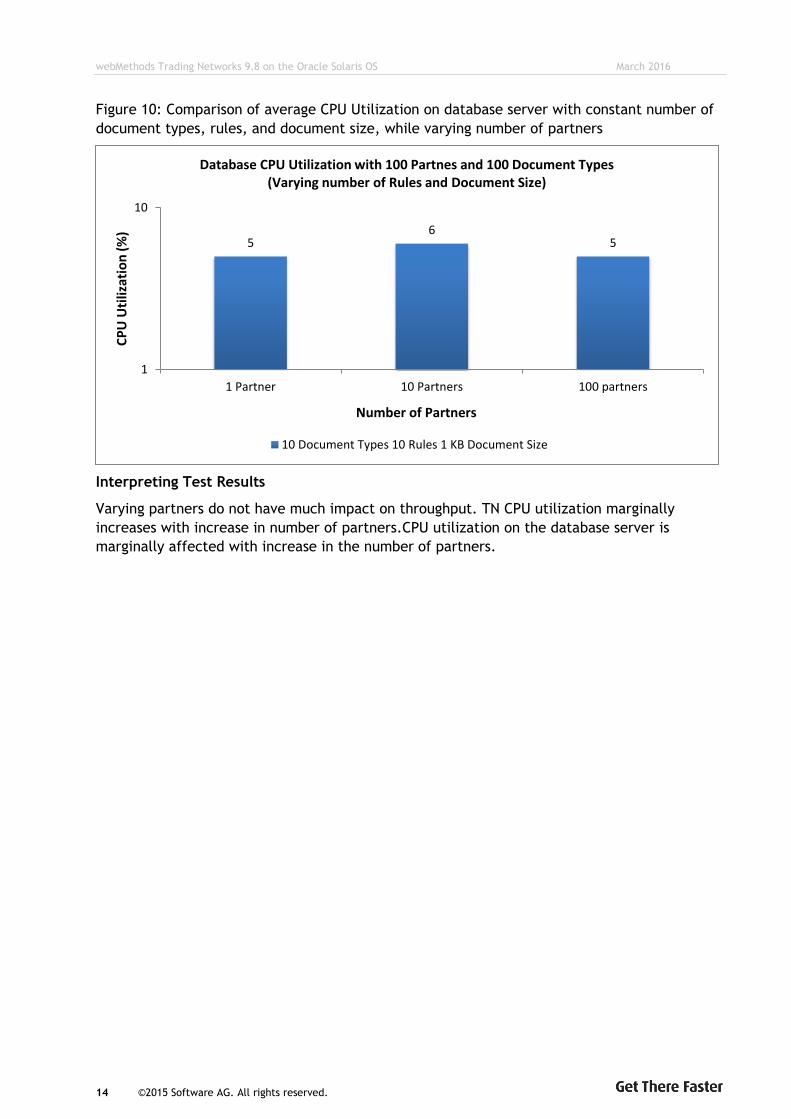
Figure 10: Comparison of average CPU Utilization on database server with constant number of
document types, rules, and document size, while varying number of partners
Interpreting Test Results
Varying partners do not have much impact on throughput. TN CPU utilization marginally
increases with increase in number of partners.CPU utilization on the database server is
marginally affected with increase in the number of partners.
5 6
5
1
10
1 Partner 10 Partners 100 partners
CP
U U
tiliz
atio
n (
%)
Number of Partners
Database CPU Utilization with 100 Partnes and 100 Document Types (Varying number of Rules and Document Size)
10 Document Types 10 Rules 1 KB Document Size
webMethods Trading Networks 9.8 on the Oracle Solaris OS March 2016
15 ©2015 Software AG. All rights reserved.
8.0 Conclusion
Document size is the factor that affects throughput the most. Trading Networks performance is
better for smaller documents, as the document size increases, performance decreases. For the
performance numbers shown in the charts, CPU utilization on the TN server and Database
server remains almost unchanged relative to the document size.
Varying the partners, rules, and document types has little effect on overall throughput. The
bottleneck of the system for all of the tests was the way the database was used. Most of the
executed SQL statements were inserts. Most of the CPU cycles were spent waiting for disk I/O
operations to complete. When one deploys the Oracle Database on the Oracle ZFS Storage
ZS3-2 it is recommended to follow the Oracle Best Practices on how to deploy the Oracle
Database on a Oracle ZFS Storage ZS3-2. When the communication between the
(databse)server and the Oracle ZFS Storage ZS3-2 is NFS it is recommended to use preferably
more then one network link and use Oracle dNFS.
Smaller deployments can probably benefit from creating a hybrid ZFS pool with internal disks
and cache devices like for example Oracle Flash Accelerator F160 PCIe Card.
webMethods Trading Networks 9.8 on the Oracle Solaris OS March 2016
16 ©2015 Software AG. All rights reserved.
9.0 Appendix
9.1 Terminology
Throughput:
The amount of work that a system can do in a given time
period.Throughput can be a measure of the comparative
effectiveness of any service or system that runs many programs
concurrently. In our scenario throughput is the transactions per
second of the Trading Networks receive service.
no_op service:
A dummy service called by any action. The no_op service does not
do anything, so that the actual performance of the action invoking
the service can be measured without any hindrance.
Document type:
An object that enables Trading Networks how to identify incoming
documents. Each document type contains identifying queries that
are applied to incoming documents. Once a document is identified,
the document type definition instructs Trading Networks to extract
certain contents and sets defaults for saving the document,
checking uniqueness, validating the document, and checking digital
signatures.
Processing rules:
Rules that define the actions taken upon receiving an incoming
document. Trading Networks chooses a processing rule based on
criteria such as the sender of the document, the document type,
whether or not Trading Networks has encountered errors in
identifying the document. Once a processing rule has been chosen,
Trading Networks executes the pre-processing options (which may
take advantage of the document type defaults), and then performs
the actions. Processing rule actions include responding with a
message, sending an alert email, setting the user status flag, and
calling a service.
Trading Partner profiles:
Profiles that allow you to capture and store information about the
organizations with which you are communicating in a central
repository, and use that information for security, reporting, and
document routing.
Sender – name of the trading partner that has sender role in
the TPA
Receiver – name of the trading partner that has receiver role
in the TPA
Agreement ID – a required application-specific field that
uniquely identifies the type of agreement between two
partners
webMethods Trading Networks 9.8 on the Oracle Solaris OS March 2016
17 ©2015 Software AG. All rights reserved.
9.2 Product Tuning
1) Integration Server
The server used 64 bit JVM version 8 update 31.
The following JVM parameters were set:
o JAVA_MIN_MEM=4096 MB
o JAVA_MAX_MEM=4096 MB
o MAX_PERM_SIZE=256 MB
The server thread pool was configured with maximum of 500 threads.
All IS loggers except Error and Server logger were disabled.
2) Oracle Database 12c
WEBMDATA and WEBMINDX table spaces with 10 files with MAXSIZE of files set to 4GB were
created.
JDBC pool with Min Connections set to 10 and Max Connections set to 50 was created.
Three redo groups with 2 files each of size 2GB were created.
UNDO table space with 5 files with MAXSIZE of files set to 1GB.
ALTER SYSTEM SET PROCESSES = 1500 SCOPE = SPFILE;
ALTER SYSTEM SET SESSIONS = 1665 SCOPE = SPFILE;
ALTER SYSTEM SET DB_FILES = 1000 SCOPE = SPFILE;
ALTER SYSTEM SET OPEN_CURSORS=1000 SCOPE = SPFILE;
9.3 OS/ HW Tuning
None
9.4 Build and Fixes
Integration Server
o Version – 9.8.0.0
o Build 247
Trading Networks
o Version – 9.8.0.0
o Build 182
Oracle 12c
o Version - 12.1.0.1.0
9.5 What this Report Does Not Cover
Tests to measure the effectiveness of thread contention.
Security implementation.

webMethods Trading Networks 9.8 on the Oracle Solaris OS March 2016