weed or wheel! fmri, behavioural, and toxicological investigations of how cannabis smoking affects...
TRANSCRIPT

7/30/2019 Weed or Wheel! fMRI, Behavioural, and Toxicological Investigations of How Cannabis Smoking Affects Skills Neces…
http://slidepdf.com/reader/full/weed-or-wheel-fmri-behavioural-and-toxicological-investigations-of-how-cannabis 1/15
Weed or Wheel! fMRI, Behavioural, and ToxicologicalInvestigations of How Cannabis Smoking Affects SkillsNecessary for Driving
Giovanni Battistella1., Eleonora Fornari1,2., Aure lien Thomas3, Jean-Fre de ric Mall4, Haithem Chtioui5,
Monique Appenzeller5
, Jean-Marie Annoni6
, Bernard Favrat7
, Philippe Maeder1
*.
, Christian Giroud8.
1 Department of Radiology, Centre Hospitalier Universitaire Vaudois (CHUV), and University of Lausanne, Lausanne, Switzerland, 2 CIBM (Centre d’Imagerie Biomedicale),
Centre Hospitalier Universitaire Vaudois (CHUV) unit, Lausanne, Switzerland, 3 CURML (University Center of Legal Medicine), UTCF (Forensic Toxicology and Chemistry
Unit), Geneva, Switzerland, 4 Department of Psychiatry, SUPAA (Service Universitaire de Psychiatrie de l’Age Avance ), Centre Hospitalier Universitaire Vaudois (CHUV),
Lausanne, Switzerland, 5 Department of Clinical Pharmacology and Toxicology, Centre Hospitalier Universitaire Vaudois (CHUV), Lausanne, Switzerland, 6 Neurology Unit,
Department of Medicine, University of Fribourg, Fribourg, Switzerland, 7 CURML (University Center of Legal Medicine), UMPT (Unit of Psychology and Traffic Medicine),
Lausanne and Geneva, Switzerland, 8 CURML (University Center of Legal Medicine), UTCF (Forensic Toxicology and Chemistry Unit), Lausanne, Switzerland
Abstract
Marijuana is the most widely used illicit drug, however its effects on cognitive functions underling safe driving remainmostly unexplored. Our goal was to evaluate the impact of cannabis on the driving ability of occasional smokers, byinvestigating changes in the brain network involved in a tracking task. The subject characteristics, the percentage of D9-Tetrahydrocannabinol in the joint, and the inhaled dose were in accordance with real-life conditions. Thirty-one malevolunteers were enrolled in this study that includes clinical and toxicological aspects together with functional magneticresonance imaging of the brain and measurements of psychomotor skills. The fMRI paradigm was based on a visuo-motortracking task, alternating active tracking blocks with passive tracking viewing and rest condition. We show that cannabissmoking, even at low D
9-Tetrahydrocannabinol blood concentrations, decreases psychomotor skills and alters the activity of the brain networks involved in cognition. The relative decrease of Blood Oxygen Level Dependent response (BOLD) aftercannabis smoking in the anterior insula, dorsomedial thalamus, and striatum compared to placebo smoking suggests analteration of the network involved in saliency detection. In addition, the decrease of BOLD response in the right superiorparietal cortex and in the dorsolateral prefrontal cortex indicates the involvement of the Control Executive network knownto operate once the saliencies are identified. Furthermore, cannabis increases activity in the rostral anterior cingulate cortexand ventromedial prefrontal cortices, suggesting an increase in self-oriented mental activity. Subjects are more attracted byintrapersonal stimuli (‘‘self’’) and fail to attend to task performance, leading to an insufficient allocation of task-orientedresources and to sub-optimal performance. These effects correlate with the subjective feeling of confusion rather than withthe blood level of D9-Tetrahydrocannabinol. These findings bolster the zero-tolerance policy adopted in several countriesthat prohibits the presence of any amount of drugs in blood while driving.
Citation: Battistella G, Fornari E, Thomas A, Mall J-F, Chtioui H, et al. (2013) Weed or Wheel! fMRI, Behavioural, and Toxicological Investigations of How CannabisSmoking Affects Skills Necessary for Driving. PLoS ONE 8(1): e52545. doi:10.1371/journal.pone.0052545
Editor: Lin Lu, Peking University, China
Received July 3, 2012; Accepted November 20, 2012; Published January 2, 2013
Copyright: ß 2013 Battistella et al. This is an open-access article distributed under the terms of the Creative Commons Attribution License, which permitsunrestricted use, distribution, and reproduction in any medium, provided the original author and source are credited.
Funding: This project was supported by the Swiss National Scientific Research Foundation (grant SNF 320030_127507/1) and the Faculty of Biology andMedicine of the University of Lausanne (multidisciplinary project FBM). The funders had no role in study design, data collection and analysis, decision to publish,or preparation of the manuscript.
Competing Interests: The authors have declared that no competing interests exist.
* E-mail: [email protected]
. These authors contributed equally to this work.
Introduction
Drug use and drug-alcohol combinations increase the risk of
traffic accidents [1,2,3]. However, decrease of perceptual motor
control [4], motor inhibition and cognition [5] under cannabis
intoxication were subtle [6,7] or more prominent [1] and the
correlated risk in driving does not reach a consensus [3]. These
discrepancies can be partially explained by differences in dosage,
experimental setting, and demographic characteristics of the tested
subjects [8,9]. Furthermore, in order to succeed in a task under the
effects of cannabis, a subject can either increase brain activation of
the same network or rely on different supplementary networks –
i.e. integrating different strategies. Demonstration of networks
modification after D9-Tetrahydrocannabinol (THC) inhalation
requires an additional sophisticated imaging approach, such asPET investigation or functional magnetic resonance imaging of
the brain (fMRI) [10]. It has been shown that the impairing effects
of cannabis may happen even with very low blood levels of THC
and that complex concentration-effects relationships and pharma-
cokinetics might preclude using a particular THC blood threshold
to make fair legal determinations of impairment [11].
Taking this into consideration, different prevention/deterrence
strategic initiatives have been adopted to reduce traffic accidents
related to cannabis abuse. Switzerland (in 2005) and several other
European countries have adopted the ‘‘zero tolerance policy’’ that
PLOS ONE | www.plosone.org 1 January 2013 | Volume 8 | Issue 1 | e52545

7/30/2019 Weed or Wheel! fMRI, Behavioural, and Toxicological Investigations of How Cannabis Smoking Affects Skills Neces…
http://slidepdf.com/reader/full/weed-or-wheel-fmri-behavioural-and-toxicological-investigations-of-how-cannabis 2/15
prohibits the presence of any amount of drugs in the blood while
driving [12]. A Swiss nationwide study (2005) carried out on whole
blood samples from drivers suspected of driving under the
influence of drugs pointed to the prevalence and severity of this
problem by revealing that one or more psychoactive drugs were
detected in 89% of all analyzed samples [13]. The same study
showed that the most frequently encountered drugs were
cannabinoids (for 48% of the total number of cases and for a large
majority of young male drivers).The necessity to regulate the consumption of cannabis while
driving is obvious. In this context the European Union established
DRUID (Driving under the Influence of Drugs, Alcohol and
Medicines), a European project with the objective of giving
scientific support to the transport policy to combat impaired
drivers. The mechanism by which the use of cannabis causes
a decrease in the ability to drive is still poorly understood. Recent
brain imaging studies mostly focus on the assessment of long term
consequences of cannabis use and have led to conflicting results
[14]. Some fMRI investigations showed hyperactivation [15,16]
while others showed hypoactivation [17,18] in prefrontal, frontal,
and cerebellar brain areas. An explanation of the discrepancy of
the results could be attributed to test and population character-
istics (cognitive demands required by the task and abstinent/just
intoxicated cannabis users), inter-individual differences linked to
personality (temperament, level of anxiety or arousal), or drug-
related factors such as recency of use or the quantity of drug used
on an everyday basis [14,19]. Despite this, some common features
emerge.
Several studies have shown that cannabis increases global brain
perfusion (CBF) [20,21], and this must be considered in the design
of functional brain studies. PET studies on the immediate effects of
cannabis revealed regional differences in rCBF in the frontal,
insular, and anterior cingulate cortices, as well as in the cerebellum
[22]. However, the investigations of the function of the brain of
just-intoxicated cannabis users remain scarce compared to the
literature devoted to addicted ones [23].
The aim of this study was to investigate the acute effects of
smoking high-potency cannabis joints on psychomotor skillsrelated to driving. To this end, we analysed the mutual effects
and interactions among blood levels of cannabinoids, changes in
brain network activations, psychomotor skills, and clinical and
subjective effects. A standardized experimental setting was of
paramount importance and included a placebo-controlled cross-
over design and a fixed-pace inhalation procedure. We assessed
subjects’ cognitive control abilities crucial for safe driving through
an fMRI experiment during a pursuit tracking task. We also
determined whole blood cannabinoids time profiles.
The brain networks involved in a tracking task are documented
[24,25] and encompass several areas that support cognitive control
for selecting, switching, and attending to salient events in the
environment. We hypothesize that cannabis alters the normal
activity of these circuits and the aim of the study was to map thesemodulations due to drug exposure and assess if these changes are
global or local. We consider the forensic implications of the
observed modifications in brain activations and task performances.
Methods
2.1. Ethics StatementThe study was approved by the Cantonal Research Ethics
Committee (Vaud). The subjects gave written informed consent
and received financial compensation for their participation.
2.2. Subjects and RecruitmentThirty-one healthy male volunteers between eighteen and thirty
years of age, all occasional cannabis smokers, participated in the
study. Subjects were recruited through advertisements in hospitals
and universities. All participants were right-handed with normal or
corrected-to-normal vision, and had no known history of
neurological or psychiatric disorders. Handedness was assessed
using the Edinburgh Handedness Inventory and by visual check
while subjects were performing the tasks. For the Critical Tracking Task (CTT), they all spontaneously used the right hand for
holding the joystick.
The inclusion protocol consisted of several distinct steps: during
a first interview, we gave detailed explanations about the
experimental protocol and we encouraged the subjects to discuss
all the potential positive and negative side-effects of cannabis
smoking. Subjects then underwent a thorough medical examina-
tion and a psychiatric interview.
The psychiatric interview was based on the AMDP system
(Arbeitsgemeinschaft fur Methodik und Dokumentation in der
Psychiatrie) [26] with the DSM-IV-TR diagnostic criteria (Di-
agnostic and statistical manual of mental disorders, fourth edition,
text revision). Subjects with a current (or a history of) psychiatric
disorder on axes I or II were excluded. They were also evaluatedwith the Global Assessment of Functioning scale (GAF) (DSM-IV-
TR), the Montreal Cognitive Assessment (MoCA) screening tool
for mild cognitive impairment [27] (score below 26/30 was the
exclusion criterion), and a modified Cannabis Abuse Screening
test (CAST) [28].
During this inclusion visit, participants provided a detailed
medical history and filled out a questionnaire about their drug use
and habits. The mean consumption of cannabis for the 3 months
preceding inclusion in the study was set to a minimum of one joint
per month and a maximum of less than one joint per week. We
presented the volunteers with a diagram showing various mixtures
of tobacco and cannabis in a cigarette in order to estimate the
amounts of cannabis and tobacco they usually mixed in self-made
joints.
We carried out a breath alcohol test and a Syva RapidTestd.a.u.H 4 immunoassay from Dade Behring for qualitative
detection of opiates, cannabis, cocaine, and amphetamines in
urine as well as an ECG and a spirometry test.
A blood sample was also taken to determine the cannabinoids
concentration and evaluate the volunteers’ rate of smoking (in case
of positive urinary test for cannabis). Concentrations of (-)-11-nor-
D9-THC-carboxylic acid (THCCOOH), the main inactive THC
metabolite in whole blood, higher than 35 ng/ml were pre-
sumptive of regular cannabis smoking (more than 200 occasions
per year) and were a reason for exclusion. Whole blood levels of
cannabinoids were measured by means of fast gas chromatography
and negative-ion chemical ionization tandem mass spectrometry.
The limits of detection (LOD) ranged between 0.1 and 0.2 ng/mL
for all cannabinoids. The limits of quantification were of 0.5 ng/ml for both THC and 11-OH-THC and 2.5 ng/ml for
THCCOOH [29].
The volunteers who used any illegal drug other than cannabis,
had abnormal clinical parameters, or presented a psychiatric
history were excluded from the study.
2.3. Experimental ProtocolSubjects included in the study were requested to abstain from
smoking cannabis and tobacco for at least twelve hours prior to the
experimental days. To exclude exposure to other common drugs
(opiates, cocaine and amphetamines) or alcohol, we performed
Cannabis and Driving
PLOS ONE | www.plosone.org 2 January 2013 | Volume 8 | Issue 1 | e52545

7/30/2019 Weed or Wheel! fMRI, Behavioural, and Toxicological Investigations of How Cannabis Smoking Affects Skills Neces…
http://slidepdf.com/reader/full/weed-or-wheel-fmri-behavioural-and-toxicological-investigations-of-how-cannabis 3/15
a breath alcohol test and a urine immunoassay (Syva RapidTest
d.a.u.H 4) at the beginning of each experimental day.
Volunteers participated in two independent cross-over experi-
mental sessions where they smoked either a joint of pure cannabis
or a placebo. The study was double-blind and the sessions wererandomized, counterbalanced, and spaced one week apart. The
time-schedule of each experimental day consisted of one smoking
session, two fMRI tracking tasks, and two critical tracking task
(CTT) tests performed on either side of the smoking time-window.On six occasions during each experiment day, the volunteers filled
out questionnaires on the subjectively experienced effects of
smoking a joint and their willingness to drive under various
fictitious scenarios. We recorded blood pressure and heart rate and
estimated eye reddening with a visual discontinuous unitary scale
graded from 0 (no reddening) to 4 (bloodshot eyes). Throughout
the day, blood samples were collected. The time schedule is
summarized in figure 1.
Details of cannabis material (Bedrobinol, 11% THC, ,1%
CBD), preparation of the joint (0.7g pure cannabis), inhalation
procedure (fixed paced puffing procedure, about 42 mg THC
inhaled) and toxicological analyses can be found in Doc S1.
2.4. QuestionnairesThe day of the experiment we used a set of visual analogue
scales (ranging from 0 to 100) on six different occasions to assess
subjective measurements of mood, drug effects, and of the
willingness to drive [30]. In addition, after each fMRI session,
volunteers filled a quantitative self report in order to detect any
change in their tactical skills and in the way they performed the
tracking tests (details in Doc S1). After controlling for the
normality of the distribution of the scores, we assessed subjects’
answers under the different experimental conditions using either
a paired t test or a Wilcoxon signed-ranks non-parametric test.
The analysis was performed by subtracting the scores of the post
smoking-THC/placebo sessions from the scores obtained after thecorresponding control sessions.
2.5. Assessment of Psychomotor SkillsPsychomotor skills were evaluated through a Critical Tracking
Task (CTT, Systems technology Inc.). The CTT is a simple,
widely used, and fully validated test of psychomotor functioning,
measuring eye-hand coordination and delays in visual motor
response [31,32]. It was run on a laptop equipped with a joystick,
allowing the lateral control of a schematic representation of
a vehicle. Participants were required to keep their car in the
middle of the roadway despite an increasingly unstable first-order
pseudo-erratic movement of the vehicle laterally with respect to
the middle of the roadway. Each session was preceded by a training period. The CTT score lc in rad/s at the critical point of loss of
control was recorded for five trials and averaged after exclusion of
the lowest and the highest values [30]. The CTT is known to
detect any impairment caused by fatigue, illness, alcohol,
medications, or psychotropic drugs. This test had been widelyused to detect psychomotor impairment after cannabis smoking
[33]. Furthermore, the CTT is one of the few psychomotor tasks
measuring ‘‘skills related to driving’’ that actually has been shown
to possess a moderate correlation to real-life driving as measured
in on-the-road tasks [34].
2.6. fMRI Tracking Task A computerized visuo-motor pursuit tracking test (BigBeCur-
seur 2.2.0 from Ariacom SARL, Plan-Les-Ouates, Geneva,
Switzerland) was adapted to fit an fMRI setting. Stimuli appeared
in the center of a computer screen. An LCD projector equipped
with a photographic zoom lens and with a refresh rate of 75 Hz
displayed the stimuli on a translucent screen positioned in the back
part of the bore. Subjects viewed stimuli through a custom-made
mirror positioned inside the magnet and had a field of view of
620u horizontally and 611u vertically.
The test included three experimental conditions: active, passive,
and rest (Fig. 1b). Each of the three conditions was repeated in
sequence 5 times. In the active and in the passive condition a target
square (size 2.8u
of the field of view) moved along the horizontalmeridian (excursion 616u ) following pseudo-random trajectories
(linear combination of six sinus functions). In the active condition,
subjects were asked to track the target position by keeping it at the
center of a user-controlled square (size 3.6u of the field of view) by
means of an MR compatible joystick (MAG Design & Engineer-
ing, Redwood City, CA), which they all (voluntarily) held in their
right hand. The passive condition was similar to the active one,
with the difference that subjects were instructed only to visually
follow the target square movement. During the rest phase, the
target square was positioned in the center of the screen and
subjects were asked to fixate on it. Continuous behavioural
variables were recorded during the active phase and are detailed in
the section 2.10.
Prior to the scanning session subjects participated in a training
session. They were asked to perform a few cycles of a task similar
to the one that would be performed during the fMRI exam, so as
to familiarize them with the procedure and to strongly diminish
any learning effect during the performance session. During the
training session the trajectories of the target followed a linear
combination of six sinus functions having same period and
amplitude of those used during the fMRI acquisition sessions. The
combination of the functions in time was different in order to
create a different scenario of equal difficulty level.
2.7. fMRI Acquisition ProtocolThe fMRI acquisition was performed in a single run of 7
minutes and 30 seconds, corresponding to the acquisition of 225
volumes. The test was organized in a block-design fashion and the
three experimental conditions (active, passive, and rest, Fig. 1b)constituting the cycle were repeated in this order 5 times. The
baseline is represented by the rest condition. The rest period was
14 s long, whereas active and passive conditions lasted 40 s and
30 s, respectively. At the beginning of each experimental
condition, subjects received a brief visual cue (2 s) regarding the
type of task they were required to perform. A similar paradigm
involving active and passive/watching blocks was used to assess
neural systems in simulated driving [35] and their modification
after alcohol intoxication [36].
FMRI was performed once before and once after each
participant smoked a placebo or a cannabis joint, in order to
have for each participant his own control session. The time period
selected for fMRI was just after the rapid distribution phase of
THC (starting about 45 min after the end of the inhalation), whencannabinoids concentrations change more slowly. This phase was
also supposed to correspond to the time-period when drugged
drivers are generally apprehended by police. Mean cannabinoids
levels during the fMRI session were interpolated from values
determined on both sides of the session.
Scanning was performed on a 3T Siemens Trio scanner
equipped with a 32-channel head-coil. Imaging parameters were
as follows: 1 single run, 225 images, single-shot EPI gradient echo
sequence, repetition time 2000 ms, echo time 30 ms, flip angle
90u, pixel size 363 mm, 32 slices of 3 mm covering the whole
brain (acquired in an ascending order). We prevented head
Cannabis and Driving
PLOS ONE | www.plosone.org 3 January 2013 | Volume 8 | Issue 1 | e52545
7/30/2019 Weed or Wheel! fMRI, Behavioural, and Toxicological Investigations of How Cannabis Smoking Affects Skills Neces…
http://slidepdf.com/reader/full/weed-or-wheel-fmri-behavioural-and-toxicological-investigations-of-how-cannabis 4/15
movements by cushioning the participant’s head in the coil with
padding.
High-resolution T1-weighted 3D gradient-echo sequence
(MPRAGE), 160 slices (16161 mm voxel size), was acquired as
structural basis for brain segmentation and surface reconstruction.
2.8. Hemodynamic Response AssessmentTo ensure that cannabis smoking did not affect the shape of the
Hemodynamic Response Function (HRF), we extracted filtered
time series from four regions of interest (3 mm radius spheres
covering the primary visual cortex, the motor cortex, the insula,
and the Anterior Cingulate Cortex) and used the Inverse Logit
Model [37,38,39] to estimate the HRF as a function of the four
experimental sessions (two control sessions before smoking, one
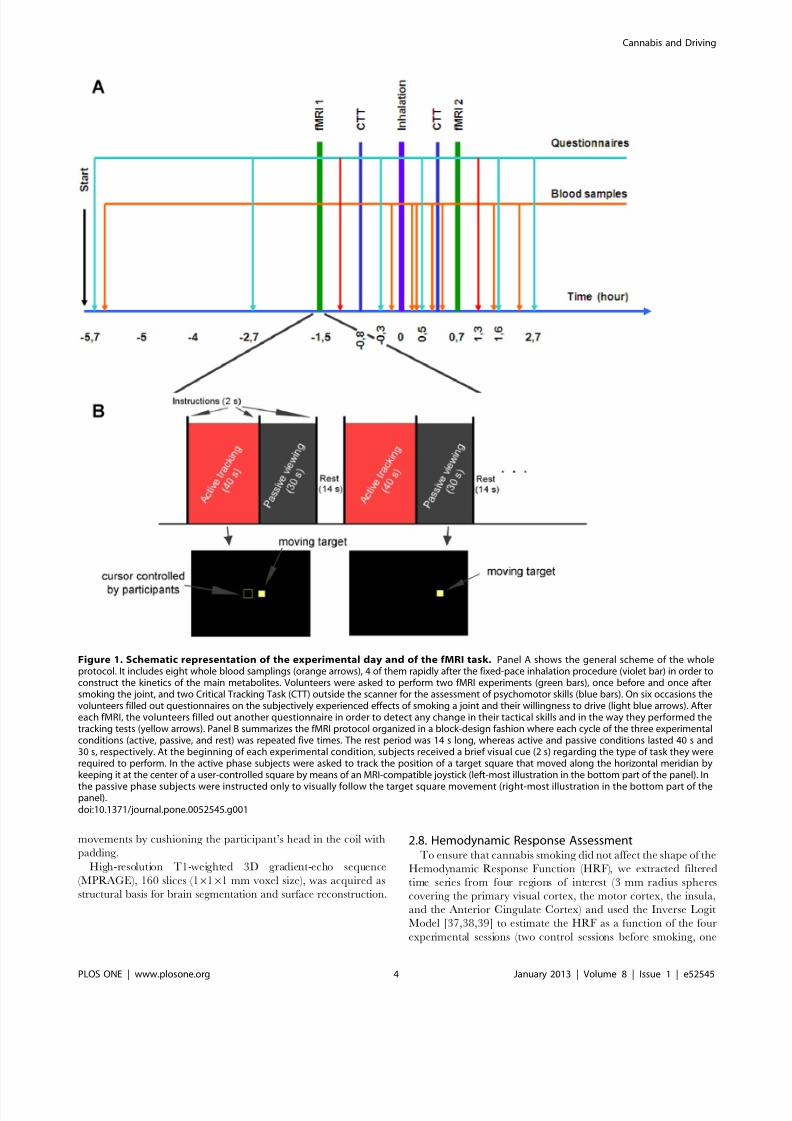
Figure 1. Schematic representation of the experimental day and of the fMRI task. Panel A shows the general scheme of the wholeprotocol. It includes eight whole blood samplings (orange arrows), 4 of them rapidly after the fixed-pace inhalation procedure (violet bar) in order toconstruct the kinetics of the main metabolites. Volunteers were asked to perform two fMRI experiments (green bars), once before and once aftersmoking the joint, and two Critical Tracking Task (CTT) outside the scanner for the assessment of psychomotor skills (blue bars). On six occasions thevolunteers filled out questionnaires on the subjectively experienced effects of smoking a joint and their willingness to drive (light blue arrows). Aftereach fMRI, the volunteers filled out another questionnaire in order to detect any change in their tactical skills and in the way they performed thetracking tests (yellow arrows). Panel B summarizes the fMRI protocol organized in a block-design fashion where each cycle of the three experimentalconditions (active, passive, and rest) was repeated five times. The rest period was 14 s long, whereas active and passive conditions lasted 40 s and30 s, respectively. At the beginning of each experimental condition, subjects received a brief visual cue (2 s) regarding the type of task they wererequired to perform. In the active phase subjects were asked to track the position of a target square that moved along the horizontal meridian bykeeping it at the center of a user-controlled square by means of an MRI-compatible joystick (left-most illustration in the bottom part of the panel). In
the passive phase subjects were instructed only to visually follow the target square movement (right-most illustration in the bottom part of thepanel).doi:10.1371/journal.pone.0052545.g001
Cannabis and Driving
PLOS ONE | www.plosone.org 4 January 2013 | Volume 8 | Issue 1 | e52545

7/30/2019 Weed or Wheel! fMRI, Behavioural, and Toxicological Investigations of How Cannabis Smoking Affects Skills Neces…
http://slidepdf.com/reader/full/weed-or-wheel-fmri-behavioural-and-toxicological-investigations-of-how-cannabis 5/15
session after placebo smoking, and one after cannabis smoking) for
each subject. We did not observe significant differences in time-to-
peak and width of the estimated response in relation to the
experimental sessions. This supports the use of the standard
Hemodynamic Response Function in our analysis.
2.9. Analysis of fMRI DataFMRI data were pre-processed and analyzed using Statistical
Parametric Mapping (SPM8, Wellcome Department of CognitiveNeurology, London, UK). Intra-session acquisitions were re-
aligned to the first scan using a six-parameter rigid-body
transformation. Functional images were then co-registered to the
respective anatomical acquisition and normalized to the Montreal
Neurological Institute template (MNI) using a 12-parameter affine
transformation and a resampled voxel size of 2 mm isotropic.
Images were subsequently spatially smoothed with an isotropic
Gaussian kernel (FWHM = 6 mm) to increase the signal-to-noise
ratio.
Single participant analysis was performed using the General
Linear Model according to our specific block design experiment.
The signal drift across acquisitions was removed with a high-pass
filter. Statistical parametric maps of the contrasts of interest were
computed for each subject modelling the active and the passiveblocks and the 4 experimental conditions in the same design.
Realignment parameters were included in the model as regressors.
Maps were used as input values for the group statistics based on
Random Field Theory. In particular the inferential statistics
included a 262 Repeated Measures ANOVA with 2 levels per
factor (Factor 1: before/after smoking levels, factor 2: Placebo/
THC joint levels), and post-hoc t-tests. We considered significant
only clusters surviving at p,0.05 (Family Wise Error (FWE)
corrected) and for cluster extent of k .40 (greater than the
minimum number of voxels expected per cluster).
Regression analyses were performed on a voxel-by-voxel basis.
2.10. Analysis of Psychomotor DataSubject performance was quantified by measuring the precision
of the behavioural variables, which were continuously recorded
during the active phase of the experiment. Parameters of interest
were the duration of correct tracking (defined as the time during
which the cursor and the target were superposed for at least 50%
of their surfaces) and the mean gap between target and cursor
(measured in % of screen resolution). Results were averaged across
the five active epochs. In order to compensate for any potential
confounding effects related to training, environment, and technical
equipment, we assessed behavioural changes by subtracting the
performance during the post smoking-THC/placebo sessions from
the performance during the corresponding control sessions (before
smoking).
For each variable of interest, we tested the null hypothesis of
whether the group performance followed a normal distribution
using the Shapiro-Wilk test. If the supposition of normality couldbe accepted, changes in group performance were tested by means
of Paired T-tests across sessions. Otherwise, if the null hypothesis
was rejected, we performed the non-parametric Wilcoxon signed-
ranks test.
Results
Twenty-three volunteers were included in the analysis (2463
years). A summary of their sociodemographic characteristics,
history, and patterns of drug use is presented in table 1 (excluded
subjects are described in Doc S1).
3.1. Cannabinoids Elimination Time ProfilesThe mean kinetic profiles of the 3 main cannabinoids measured
in whole blood are displayed in figure 2. The highest THC
concentrations were measured in the blood sampled just after
smoking. They varied considerably among subjects, with a median
value of 87.4 ng/ml (range: 16.8–167.9). The whole-blood THC
levels during the fMRI investigation time-period ranged from 2.9
to 23.7 ng/ml (median value: 9.3 ng/ml). This value was
estimated from the THC levels measured on either side of thefMRI exam. Table 2 lists the individual highest THC, 11-OH-
THC, and THCCOOH levels and their corresponding interpo-
lated concentrations during fMRI. Compared to THC, peak
concentrations for both metabolites were time-delayed (0.5 hour
for THCCOOH and 0.3 hour for 11-OH-THC) and achieved
much lower ranges (median value: 14.7 ng/ml for THCCOOH).
The active metabolite 11-OH-THC exhibited very low peak
concentrations (median value: 2.6 ng/ml, range: 1.1–17.9 ng/ml).
3.2. Self-estimation of Drug Effects with VASSubjects experienced positive and negative feelings for the three
hours following smoking. They reported feelings of intoxication, of
confusion (both shown in figure 3), of a ‘‘high,’’ or of the
environment having changed (the last two not shown in fig. 3).When comparing the elimination time-profile of THC with these
reported sensations, the alteration of these feelings persisted well
beyond the peak of concentration, around three hours after
smoking the joint. During this late phase, while the subjective
effects were still intense, THC levels had dropped to relatively low
concentrations (less than 5 ng/ml). After smoking the placebo,
volunteers reported only a very slight perception of intoxication, of
confusion, and of environmental changes. The ability to drive
showed a similar trend (fig. 3). A considerable and long-lasting
decrease in the subjective feeling of being able to drive was
reported after smoking the joint, while only a tiny decrease was
observed after smoking the placebo.
3.3. Strategy QuestionnairesComparison of differences in time perception assessed before
and after cannabis smoking, immediately after each fMRI session,
indicated that the judgment of time was significantly altered
(p,1023, Wilcoxon signed-rank test). The same comparison
revealed that the scores measuring attention or vigilance
differences were also significantly different after smoking the
cannabis joint than after the placebo (p = 0.04, Wilcoxon signed-
rank test) (fig. 4). On the other hand, the same comparison aimed
at the detection of changes in the way subjects performed the
tracking test did not disclose any significant differences regarding
the anticipation of target movements or the tactical approach
(fig. 4).
3.4. Psychomotor Results, and Correlation with the
Subjective ScoresCTT scores measured before and after smoking a placebo or
a cannabis joint showed a significant impairment of tracking skills
after cannabis smoking (paired T-test, p = 0.01). We observed
a slight increase in performance after smoking the placebo
(p = 0.04). This increase was ascribed to a learning effect that
occurs despite the preliminary training session.
During the fMRI sessions, the duration of correct tracking in
placebo and THC conditions followed a normal distribution.
Concerning this behavioural parameter, the paired t-test showed
a significant decrease in performance after cannabis smoking
compared to the placebo session (p,0.005 corrected). Wilcoxon
Cannabis and Driving
PLOS ONE | www.plosone.org 5 January 2013 | Volume 8 | Issue 1 | e52545

7/30/2019 Weed or Wheel! fMRI, Behavioural, and Toxicological Investigations of How Cannabis Smoking Affects Skills Neces…
http://slidepdf.com/reader/full/weed-or-wheel-fmri-behavioural-and-toxicological-investigations-of-how-cannabis 6/15
signed-ranks test revealed statistically significant increase of the
mean gap between target and cursor after cannabis inhalation. For
this variable, differences between placebo and THC experimental
sessions were significant at p,0.005 after correction for multiple
comparisons (fig. 5).
Linear regression between the subjective feeling of confusion
and the duration of correct tracking revealed a strong negative
correlation (R = - 0.62, p = 0.002). In fact, the time during which
cursor and target were superposed linearly decreased as the
subjective rating of confusion increased. In addition, the gap
between target and cursor was positively correlated with the same
subjective score (R = 0.63, p = 0.001); the gap linearly increased asthe feeling of confusion increased (fig. 5, panel B).
3.5. fMRI ResultsGroup inference was first aimed at assessing brain regions
activated while performing the task without any alterations due to
either THC or placebo inhalation.
To this end, we analyzed brain regions showing an increase of
Blood Oxygen Level Dependent (BOLD) response in the active
compared to the passive block during the control session before
smoking the placebo (p,0.005, k .40, Doc S2). Clusters in the
occipital regions extensively covered primary and higher-order
Table 1. Sociodemographic characteristics, self-rated patterns of cannabis use and subjective feeling of unwanted side-effects.
Number Mean Std Median Maximum Minimum
Age 24.1 3 25 29 19
Ethnicity Caucasian (21), Asian (1), Eurafrican (1)
Education (post-compulsory) 6 2.3 6 10 2
Employed or Student (E)/Jobless (J) 21 E, 2 J
Regular dwelling (D)/Homeless (H) 23 D
Driving license 20 (19 car, 1 motorbike)
Regular sport practice (Yes/No) 19 Y, 3 N
Sociability (0–1–2) 1.3 0.7 1 2 0
Feel healthy (0–1–2) 2 0 2 2 2
Novel experiment seeker (Yes/No) 13 Y, 8 N
X-Sport practitioner (Yes/No) 6 Y, 17 N
Trait anxiety index (0–1–2–3) 0.5 0.8 0 2 0
Number of standard alcohol drinks per week 5 2.8 5 10 1
Age at first cannabis use 16.4 3 17 23 9
Total years of lifetime cannabis use 7.7 3.3 7 15 4
Preferred forms of cannabis Marijuana(20), Haschich (10), Haschich oil (5), Pollen (2)
Preferred methods of consumption Joint (23), Water pipe (bong, bhang) (7), Pipe (chillum, sebsi) (10), Cigar (Blunt) (3), Vaporizer (1)
Assessment of the usual size of a joint (grams) 0.4 0.3 0.4 1 0.1
Estimation of the [%] of cannabis in the cannabis/tobacco mix 48 18 50 70 30
Frequency of use (times/month, 3 last months) 3.7 2.3 3.5 10 1
Number of people with whom the joint is shared 3.3 0.9 3.5 5 2
Prefer light (L) or strong (S) cannabis 13 L, 9 S
Usually inhale deeply (Yes/No) 7 Y, 18 N
Feelings reported after smoking cannabis
Anxiety rarely (7)
Confusion often (2), rarely (7)
Drowsiness often (4), rarely (13)
Palpitations/tachycardia often (3), rarely (7)
doi:10.1371/journal.pone.0052545.t001
Figure 2. Time profiles of the major cannabinoids taken fromwhole blood. Time 0 corresponds to the last blood sample collectedright before the smoking procedure; concentrations are expressed inng/ml. We performed the fMRI when THC blood concentration roughlydrops to one sixth of its maximum value (45 minutes after smoking).Vertical error bars represent standard deviation of the measurements,horizontal bars represent time variability in the collection of samples.doi:10.1371/journal.pone.0052545.g002
Cannabis and Driving
PLOS ONE | www.plosone.org 6 January 2013 | Volume 8 | Issue 1 | e52545

7/30/2019 Weed or Wheel! fMRI, Behavioural, and Toxicological Investigations of How Cannabis Smoking Affects Skills Neces…
http://slidepdf.com/reader/full/weed-or-wheel-fmri-behavioural-and-toxicological-investigations-of-how-cannabis 7/15
visual areas in both hemispheres. Local maxima were located
bilaterally in the middle occipital gyrus, in the inferior occipital
gyrus, and in the lingual gyrus. Additional significant clusters were
located in the left motor cortex, in the Supplementary Motor Area
(SMA), and bilaterally in the cluster extending from the middle
frontal to the inferior frontal gyri. Local maxima were located in
the central sulcus, in the postcentral gyrus, and in the precentral
gyrus. The parietal cortex showed bilateral activation in clusters
located in the superior parietal lobule, in the intraparietal sulcus,
and in the supramarginal gyrus. Furthermore, we found activation
bilaterally in the thalamus, in the insula, and in the left putamen.
Doc S2 summarizes each cluster activated, and the corresponding
T values.
To assess changes in brain activations due to cannabis smoking,
we then contrasted the differential maps (Active-Passive) corre-
sponding to placebo and THC conditions (fig. 6). We observed
a significant increase in BOLD response compared to placebo
smoking in a cluster covering the Anterior Cingulate Cortex and
the ventromedial Prefrontal Cortex (vmPFC). The local maximum
was located in rostral ACC. The left postcentral gyrus and a cluster
covering interhemispherically the SMA showed just a trend
(p,0.005 uncorrected). (Table 3).
The opposite contrast (Placebo.THC) showed decrease of
BOLD signal after cannabis smoking in clusters mainly located in
the anterior insula, dorsomedial thalamus, and in the left middle
frontal gyrus. Additional clusters were located in the left middletemporal gyrus and in the right superior parietal lobule. Thecerebellum showed a trend (p,0.005 uncorrected) (Table 4).
The addition of alcohol consumption (drinks/week) and the
frequency of cannabis use (number of joint/month) as covariatesdid not influence the activation pattern.
3.6. Correlation between BOLD Response and self-estimation of Cannabis Effects
Results of the regression between the BOLD response and the
feeling of confusion showed the involvement of a network that
covers the ACC (rostral and anterior-dorsal), and bilaterally the
insula, thalamus, putamen, caudate, nucleus accumbens, DLPFC,
superior temporal gyrus, frontal, orbitofrontal cortices, and the leftparietal cortex (fig. 7, panel A) that correlates with the subjective
feeling of confusion.
The BOLD response and behavioural scores did not show anylinear correlation with the blood level of THC during the fMRI
assay.
Discussion
Our study showed that smoking cannabis significantly decreases
psychomotor skills and globally alters the activity of the main brain
networks involved in cognition even at low concentrations of THC
in the blood. Performance and BOLD response didn’t show any
correlation with the measured levels of THC but were modulated
by the subjective feeling of confusion.
4.1. Psychomotor Results – CTTThe CTT detects any impairment present, regardless of its
cause, whether from fatigue, alcohol, or cannabis intake.
Consequently and in agreement with the guidelines issued by
Walsh and coworkers [40], the CTT was used in this controlled
study as a reference tracking test. In contrast to the fMRI task
which was characterized by a fixed-length of time, and was
therefore fully compatible with the block-design of the fMRI
experiment, the duration of the CTT depends on the performance
Table 2. Cannabinoids concentrations (ng/ml). Time pointzero is the beginning of the inhalation procedure.
Highest concentratio ns THC 11-O H-THC THCC OOH
Number 23 23 23
Median (ng/ml) 87.4 2.6 14.7
Mean (ng/ml) 81.6 3.5 15.2Standard deviation (ng/ml) 43.7 3.4 7.9
Highest value (ng/ml) 167.9 17.9 38.3
Lowest value (ng/ml) 16.8 1.1 4.7
Time after starting smokingthe joint (hour)
0.3 0.5 0.5
Interpolated concentrations THC 11-OH-THC THCCOOH
Number 23 23 23
Median (ng/ml) 9.3 1.9 11.3
Mean (ng/ml) 9.4 2.3 12.6
Standard deviation (ng/ml) 5 1.8 7.2
Highest value (ng/ml) 23.7 9.2 32.6
Lowest value (ng/ml) 2.9 0.4 3.1
Time after starting smokingthe joint (hour)
1.1 1.1 1.1
doi:10.1371/journal.pone.0052545.t002
Figure 3. Self-evaluation of drug effects. Joint scheme of the subjective estimation of drug effects after cannabis (red curve) and placebo (bluecurve) smoking evaluated by questionnaires answered using a Visual Analog Scale ranging from 0 to 100. The time profile of THC concentrationsmeasured in whole blood (green curve, concentrations on right vertical axe) is given as reference. Subjects ratings and concentrations are averagedacross subjects. Error bars represent standard deviation.doi:10.1371/journal.pone.0052545.g003
Cannabis and Driving
PLOS ONE | www.plosone.org 7 January 2013 | Volume 8 | Issue 1 | e52545

7/30/2019 Weed or Wheel! fMRI, Behavioural, and Toxicological Investigations of How Cannabis Smoking Affects Skills Neces…
http://slidepdf.com/reader/full/weed-or-wheel-fmri-behavioural-and-toxicological-investigations-of-how-cannabis 8/15
of the tested subject. In this experiment, both the critical tracking
task (CTT) and the fMRI task yielded the same results: i.e. that on
average the tracking performance of the volunteers was signifi-
cantly and negatively altered after cannabis smoking. This
impairment in CTT performance was obvious despite a training
effect that tended to conceal its actual full magnitude. Ramaekers
et al [5] found that the decrease in CTT performance only
occurred in occasional cannabis users and that this detrimental
effect extended up to 3–4 hours following cannabis smoking.
4.2. Psychomotor Results - fMRIConsistent with our hypothesis and the validated CTT results,
we found that THC exposure significantly decreases task
performance as revealed by the psychomotor measurements taken
during the active condition of the fMRI. The time period chosen
to perform the fMRI task (45 minutes after smoking) is in
accordance with the time window of significant impairment after
a single dose of THC in occasional cannabis users [4]. The effects
of cannabis on brain functions and behaviour extend widely
Figure 4. Questionnaire regarding the strategy used to perform the fMRI task. Comparison of the answers given by the volunteersbetween two experimental sessions (Placebo/THC). The red central mark is the median, the edges of the box are the 25th and 75th percentiles, thewhiskers extend to the most extreme datapoints that the algorithm considers not to be outliers (1.5 times the interquartile range), and the outliersare plotted individually with red crosses. Parameters of interest were: alteration in time perception (panel A), attention (panel B), anticipation of thetarget movement (panel C), and tactic (panel D). Black stars represent the significant difference of the variables of interest between the experimental
conditions.doi:10.1371/journal.pone.0052545.g004
Cannabis and Driving
PLOS ONE | www.plosone.org 8 January 2013 | Volume 8 | Issue 1 | e52545

7/30/2019 Weed or Wheel! fMRI, Behavioural, and Toxicological Investigations of How Cannabis Smoking Affects Skills Neces…
http://slidepdf.com/reader/full/weed-or-wheel-fmri-behavioural-and-toxicological-investigations-of-how-cannabis 9/15
Figure 5. Behavioural results during fMRI session. (A) Comparison of the main behavioural data between two experimental sessions (Placebo/THC). Effects of THC/placebo inhalation were assessed by subtracting the performance during the second post-THC/placebo sessions from theperformance during the first control sessions. The red central mark is the median, the edges of the box are the 25th and 75th percentiles, thewhiskers extend to the most extreme datapoints that the algorithm considers not to be outliers (1.5 times the interquartile range), and the outliersare plotted individually with red crosses. Black stars represent the significant difference of the variable of interest in the two experimental conditions.(B) Linear correlation between the duration of correct tracking and the feeling of confusion (left panel) and linear correlation between the deviationbetween target and cursor and the feeling of confusion (right panel). Corresponding Pearson’s correlation coefficients (R) and p-values are displayedat the bottom of each plot.doi:10.1371/journal.pone.0052545.g005
Table 3. Local maxima of significant cluster of activation in the marijuana vs placebo contrast.
Region Left hemisphere MNI coordinates (mm) T value Right hemisphere MNI coordinates (mm) T value
x y z x y z
Anterior cingulate cortex 22 36 24 4.6
Postcentral gyrus 228 230 56 3.65
Precentral gyrus/SMA 4 232 60 3.69
doi:10.1371/journal.pone.0052545.t003
Cannabis and Driving
PLOS ONE | www.plosone.org 9 January 2013 | Volume 8 | Issue 1 | e52545

7/30/2019 Weed or Wheel! fMRI, Behavioural, and Toxicological Investigations of How Cannabis Smoking Affects Skills Neces…
http://slidepdf.com/reader/full/weed-or-wheel-fmri-behavioural-and-toxicological-investigations-of-how-cannabis 10/15
beyond the distribution phase of THC. Performance tests
conducted at regular intervals after smoking [5] demonstrated
that a single dose of THC impairs tracking performance, divided
attention, and inhibitory control in occasional cannabis users.
Impairments were maximal during the first hour after smoking
and then gradually declined. During the investigated fMRI time-
period, THC levels ranged between 2.9 and 23.7 ng/ml (median
value 9.4 ng/ml); they were higher than the limits of detection and
quantification of our analytical method and close to the technical
threshold adopted by authorities for the zero tolerance policy (e.g.
1.5 ng/ml whole blood in Switzerland). These relatively low
concentrations, which have detrimental effects on several specific
tasks related to driving, are also similar to those found in a previous
study [5] and are above the lower limit that was suggested for
a significant level of driving impairment (2 to 5 ng THC/ml of
serum, i.e. about 1 to 3 ng THC/ml of whole blood) established in
a recent paper [41].
4.3. fMRI ResultsThe analysis of the active tracking task during the control
session first revealed circuits involved in ocular pursuit, prepara-
tion of action, movement, localization, and pointing at a target.
We confirmed previous results concerning the existence of
polymodal parietal, frontal, and subcortical areas that support
cognitive control for selecting, switching among, and attending to
salient events in the environment. Such complex activations have
Figure 6. Effect of THC smoking on brain function during the visuo-motor tracking task. When comparing the THC and the Placebosessions, fMRI BOLD response changes in the Active tracking task vs Passive condition reveal major alteration of brain networks. Hot colour barrepresents regions showing an increase in BOLD signal after the cannabis smoking. Cold colour bar represents the opposite contrast. Maps arethresholded at p,0.005 and k .40 and superposed on a standard brain in the MNI (Montreal Neurological Institute) space.doi:10.1371/journal.pone.0052545.g006
Table 4. Local maxima of significant cluster of activation in the placebo vs marijuana contrast.
Region Left hemisphere MNI coordinates (mm) T value Right hemisphere MNI coordinates (mm) T value
x y z x y z
Insula 246 10 6 4.42 46 8 2 4.65
Thalamus 210 26 8 4.36 8 218 6 4.27
Middle frontal gyrus 246 26 42 4.47
Middle temporal gyrus 242 262 10 4.35
Superior Parietal lobule 62 238 46 4.23
Cerebellum 28 262 220 3.43 20 258 222 3.66
doi:10.1371/journal.pone.0052545.t004
Cannabis and Driving
PLOS ONE | www.plosone.org 10 January 2013 | Volume 8 | Issue 1 | e52545
7/30/2019 Weed or Wheel! fMRI, Behavioural, and Toxicological Investigations of How Cannabis Smoking Affects Skills Neces…
http://slidepdf.com/reader/full/weed-or-wheel-fmri-behavioural-and-toxicological-investigations-of-how-cannabis 11/15
Cannabis and Driving
PLOS ONE | www.plosone.org 11 January 2013 | Volume 8 | Issue 1 | e52545

7/30/2019 Weed or Wheel! fMRI, Behavioural, and Toxicological Investigations of How Cannabis Smoking Affects Skills Neces…
http://slidepdf.com/reader/full/weed-or-wheel-fmri-behavioural-and-toxicological-investigations-of-how-cannabis 12/15
already been described in active visuomotor pursuit [42].
Moreover, increased externally driven demand has been associ-
ated with increased parietal, pre-motor, and cingular activation
[43] and coactivation of the striatum [44].
Recent research suggests that the human brain is organized in
different, dissociable intrinsic connectivity networks (ICNs)
corresponding to distinct cognitive functions such as vision,
audition, sensory-motor, language, episodic memory, executive
function, and salience detection [45,46,47]. The existence of these
independent networks has been revealed in task-free resting state
condition [47] as well as during task performance [48]. Changes in
BOLD responses are integral to understanding how the activity of
three such ICNs – salience, executive-control, and default mode –
is altered by cannabis.
Compared to the areas activated during the tracking task in the
control condition, cannabis inhalation induced a relative decrease
in activation in the anterior insula, the dorsomedial thalamus, the
striatum, the right dorsolateral prefrontal cortex (DLPFC), the
right superior parietal lobule (RSPL), and the cerebellum. An
intuitive explanation would be that this activation decrease is dueto an acute impairment of systems important for such a task, i.e.
visuo-motor control and motivational striato-frontal dopaminergic
systems. This could be supported by the fact that reward
pathways, including the dorsal thalamus, insula, and anterior
cingulate, are triggered by cannabis cues in addicted people, and
this system is certainly modulated by the level of CNB intake [49].
In addicted people, the hypoactivity of the striatum and insula is
often associated with hypoactivity of the ACC. This pattern of
alteration has been associated with a motivational system wherethe role of dopamine guides its activity [50]. However, in our
study, this relative hypo-activity of the striatum and insula is
associated with ACC hyperactivity, and participants are occasional
smokers and do not present traits and behaviours peculiar to
addiction, as do participants in other cannabis studies. For these
reasons, our study doesn’t support a global motivational modifi-
cation, and orients the interpretation of these alterations toward
other mechanisms.
The relative decrease in activation in the anterior insula,
dorsomedial thalamus, and striatum is suggestive of a general de-
activation of the network implicated in saliency detection. The
Salience Network (SN) is a system that detects pertinent
environmental changes (regardless of the stimulus modality) in
order to guide behaviour. Specific paradigms developed to induce
pertinent analysis and motivational salience have been associatedwith consistent activation of a cortico-subcortical network which
includes not only striato-frontal projections, but also the ventral
tegmental area (VTA) extending to the bilateral MD thalamus,
superior temporal gyrus, posterior insula, and cerebellum [51].
Once the saliencies are identified, the Central Executive Network
[45] starts to operate, directing attention to pertinent stimuli. We
observed a relative decrease of activation in the right parietal
lobule and in the DLPFC that are part of this network [45]. We
have shown that both of these networks (SN and CEN) are altered
after cannabis smoking; we observed these alterations when
participants were performing a demanding visuo-motor task.
These alterations might be due to the subjects’ inability to
discriminate saliencies, to focus attention, and to behave
accordingly.
When looking more closely at the functional role of the discrete
regions composing the two networks, the anterior insula (AI)
represents a key node involved in switching between brain
networks [52]. It has also been shown that the AI has a role in
error processing complementary to the ACC since the ACC
cannot always differentiate between erroneous and correct re-
sponse trials [53,54,55]. Furthermore, evidence exists that AI plays
a crucial role in conscious awareness of errors [17,56]. The
decrease of AI activation under the effect of THC that we
observed might then reflect a decrease of subjects’ awareness of
their own errors and lower performances.
The cluster located in the RSPL showed a decrease in BOLDresponse after cannabis smoking compared to placebo and,
additionally, a strong correlation with the feeling of confusion
(figure 7, panel B). It has been demonstrated that the parietal
cortex represents the locus of the neural representation of spatial
attention [57,58]. Furthermore, evidence exists about the in-
volvement of the right parietal cortex in visual search when
a manual motor response to a stimulus is required [59]. A recent
study also showed greater functional connectivity between pre-
frontal and occipito-parietal cortex in regular cannabis users as
cognitive control demands increased (directing and switching
attention, [60]). We explain our BOLD response decrease within
the executive network by the lack of recruitment of attention
resources.
Cannabis smoking also increased the BOLD signal in the vmPFC and rostral ACC when switching from the passive to the
active task. Anatomically, these regions are heavily interconnected
with limbic structures and receive a wide range of sensory
information from the body and the external environment [61,62].
It has been shown that a greater activity of the rostral ACC can
predict performance errors [63] and that activity with errors
during online motor control can reflect a failure in performance
optimization [64]. Furthermore, evidence exists about the in-
volvement of the ventro medial prefrontal cortex (vmPFC)/rostral
ACC in the judgment of the affective significance of errors and in
self-referential mental activity [65]. In fact, the vmPFC is among
the brain regions with the highest metabolic rate at rest [66] and as
early as 1985 this was attributed to spontaneous self-generated
mental activity [67]. Our data might then suggest that cannabis
intake favours attention to self-relevant incoming informationinstead of allocating resources to task-oriented cognitive proces-
sing.
An alternative interpretation can be based on the evidence that
vmPFC/rostral ACC are parts of the Default Mode Network
(DMN). Though further investigation is necessary to fully
characterize the psychological and physiological significance of
the DMN, it is generally accepted that it represents the baseline
activity of spontaneous mental operations that are suspended
during goal-oriented behaviour [66,68]. DMN usually shows
a decrease of activity during task performance, and our results
show that cannabis seems to impaires DMN inhibition compared
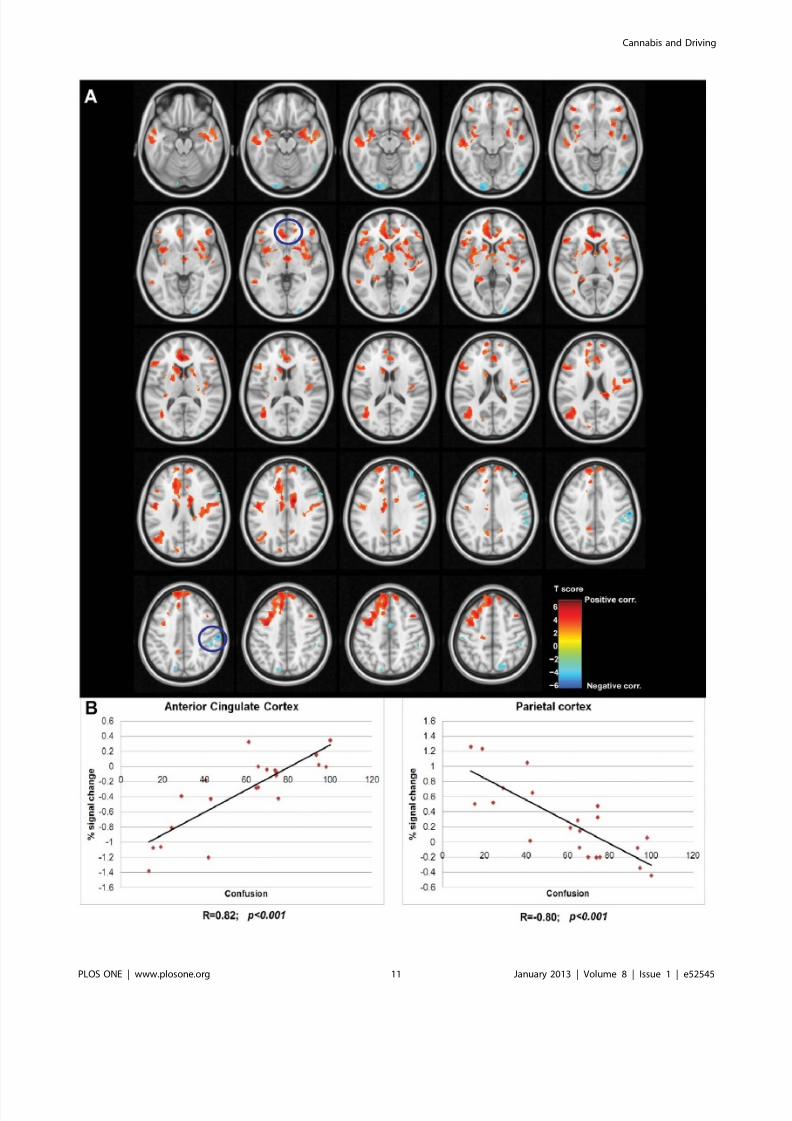
Figure 7. Correlation between BOLD response and the feeling of confusion. (A) Voxel-wise correlation analysis between the BOLD responseand the feeling of confusion. Hot colour bar represents regions showing a positive correlation between these two variables, while cold colour barrepresents the negative correlation. Maps, thresholded at p,0.005 and k .40 are superposed on a standard brain in the MNI (Montreal NeurologicalInstitute) space and visualized in axial view with slices spaced 3 mm in the z axes. Regions highlighted by the blue circles are the ones plotted inpanel B. (B) The left-most plot shows the linear correlation between the mean BOLD response in the cluster located in ACC and the feeling of confusion (p,0.001 corrected). The right-most shows the linear correlation between the BOLD response in the cluster located in the right parietalcortex and the feeling of confusion (p,0.001 corrected). Percent of signal change of BOLD response was averaged across all the voxels belonging tothe cluster. Corresponding Pearson’s correlation coefficients (R) are displayed on the bottom of each plot.doi:10.1371/journal.pone.0052545.g007
Cannabis and Driving
PLOS ONE | www.plosone.org 12 January 2013 | Volume 8 | Issue 1 | e52545

7/30/2019 Weed or Wheel! fMRI, Behavioural, and Toxicological Investigations of How Cannabis Smoking Affects Skills Neces…
http://slidepdf.com/reader/full/weed-or-wheel-fmri-behavioural-and-toxicological-investigations-of-how-cannabis 13/15
to Placebo (Doc S3). Alteration of the functional organization of
the DMN in drug addiction has been demonstrated using Resting
State fMRI, suggesting diminished cognitive control related to
attention and self-monitoring [69,70]. Greater relative activation
(i.e. due to a lack of DMN inhibition) of the vmPFC might also be
the cause of increased ‘‘self-focused’’ behaviour [71]. The
alteration of time perception, the decrease in the level of attention,
and the increase of the subjective feeling of confusion that we
observed are in accordance with the hypothesis that subjects aremore easily distracted by introspection, with the result of an
insufficient allocation of attention resources to task performance.
In this context, the greater activation in clusters located in the
pre-SMA and SMA after cannabis smoking must be explained by
a compensatory behaviour. These compensatory behaviours
require increased motor planning demands and motor regulations,
voluntary processes in which the pre-SMA and the SMA play
a role [72]. Furthermore, in our study the increase in activation in
pre-SMA and SMA is associated with a bilateral decrease of the
anterior part of the cerebellum, a region well known to be
associated with automatic motor control [73]. After cannabis
smoking, subjects need to recruit the SMA more to compensate for
the decrease in activation in the cerebellum.
4.4. Questionnaires Among all the questions posed to volunteers, two seemed to best
describe the intensity of the effects felt after smoking. The first
question concerned the degree of intoxication whereas the second
was related to the feeling of confusion. According to Sacco [74],
a sense of confusion could result from several factors, such as
concentration difficulties possibly triggered by stress and anxiety,
and a feeling of depersonalization/derealisation. Furthermore, we
found a linear correlation of the feeling of confusion with the
BOLD response and the behavioural scores. This has also been
demonstrated in chronic users [75].
On the other hand, we failed to find any correlation between
the subjective rating of drug effect and the THC levels measured
at two time points (right after smoking and levels interpolated
during the fMRI exam). A similar observation was made byToennes [76], and animal studies have shown no correlation of
THC levels measured in blood to those measured in the brain
[77].
4.5. Cannabinoids Elimination Time-profilesThe estimated smoked amount of THC (42 mg) and its
concentration in the joint (11% THC, high-grade cannabis) can
be considered high if one refers to the numerous controlled
administration studies carried out so far with low-grade cannabis
joints. Our decision to use high-grade joints relies on the smoking
habits of the cannabis users in Switzerland and on the THCconcentrations determined in cannabis samples seized by the
police. Although the amount of THC that could be inhaled was
high, it did not result in blood levels above the usual range of
concentrations found in literature. In contrast to serum andplasma, elimination time-profiles of cannabinoids have rarely been
determined in whole blood [78]. For comparison, we should
consider the cannabinoids distribution ratio between plasma/
serum and whole blood [79]. The highest blood concentrations
determined in this experiment (median concentration: 87.4 ng/ml
(range: 16.8–167.9 ng/ml)) were indeed relatively similar to those
typically measured in other experimental controlled studies carriedout with occasional users smoking poor and, more rarely, medium-
grade cannabis joints [78,80,81], where the quality of the joint
refers to the cannabis THC content. For instance, Hunault et al
[81] indicated that for occasional smokers (between two and nine
joints per month), smoking a joint made with a cannabis/tobacco
mix containing 49.1 mg THC (cannabis material: 16.4% THC)
brought about a maximum THC level of 202.96112.4 ng/ml of
serum (i.e. about 127 ng/ml of whole blood). One hour later, the
THC concentration dropped to the 20 ng/ml serum range,
matching the THC concentration determined in our study
(around 9.465.0 ng/ml whole blood (i.e. around 15 ng/ml of
plasma)). Other parameters certainly had more influence on blood
levels of THC than did the inhaled dose and the concentration of THC in the joints. THC absorption by inhalation is known to be
quite variable, with a bioavailability of 2 to 56% through the
smoking route depending on depth of inhalation, puff duration,
breathhold, and sidestream smoke production [82]. Furthermore,
the burning efficiency and vaporization yield of THC contained in
pure cannabis joints used in this experiment is lower than that of
cannabis joints cut with tobacco [83].
4.6. Strengths and LimitationsThe main strength of our study relies in the conception of the
whole experimental protocol. The timing for biological sampling
and psychomotor tests were carefully studied in order to construct
reliable kinetic profiles of the major cannabinoids and to put
subjects in the most realistic experimental conditions. The time-
window chosen for the fMRI experiment is of paramountimportance. Since the peak level of THC largely varies across
subjects, we decided to perform the fMRI after the rapid
distribution phase of THC when cannabinoids concentrations
vary less among subjects and decrease slowly (45 minutes after the
beginning of the inhalation procedure). This phase was also
supposed to correspond to the time-period when drugged drivers
are generally apprehended by police. Alteration of brain perfusion
due to cannabis has been demonstrated in the literature [20,22].
We included the passive viewing phase in the design of our fMRI
paradigm in order to exclude possible vascular effects due to
cannabis intake that are not related to the task. The differential
maps (Active-Passive) allowed us to assess brain changes that are
only related to the effect of cannabis on the task.
The present study, which was not designed to assess the effectsof different doses of THC or the effects on task performances along
the whole time-curve of cannabinoids, failed to indicate a statis-
tically significant linear correlation between THC concentrations
(at peak level and during the fMRI experiment) and effects on task
performances and BOLD signal. A completely different experi-
mental design, including different doses of cannabis and repeated
assessments of psychomotor skills along the kinetics of THC,
would have needed to have been set up to solve this issue. Also, the
visuo-motor pursuit tracking test is not an ecological driving task
and this can be a limitation of this study. However, it is a validated
task and the correlation with the CTT performances allows our
interpretations to be applied to traffic situations.
A limitation of our study is the lack of time-dependent fMRIanalysis that can take into account variations in onset time and
durations of brain activation between different brain areas orfluctuations of BOLD signal within the blocks. Alternative data-
driven methods, with minimal specification of a priori constraints,
could address this question [84,85].
Moreover, our approach cannot determine the causal in-
teraction between brain activity and behavioural performance, or
the influence of cannabis on their relationship. This point could be
addressed only with further investigations, multimodal ap-
proaches, or the technique used by Wen and colleagues [86].
In conclusion, we have shown that in occasional smokers
cannabis globally altered the activity of the main brain networksinvolved in cognition despite the low THC concentrations.
Cannabis and Driving
PLOS ONE | www.plosone.org 13 January 2013 | Volume 8 | Issue 1 | e52545

7/30/2019 Weed or Wheel! fMRI, Behavioural, and Toxicological Investigations of How Cannabis Smoking Affects Skills Neces…
http://slidepdf.com/reader/full/weed-or-wheel-fmri-behavioural-and-toxicological-investigations-of-how-cannabis 14/15
Subjects might be more attracted by intrapersonal stimuli (‘‘self’’)
instead of orienting attention to task performance, and this results
in an insufficient allocation of task-oriented resources. Effects on
BOLD response were associated with the subjective evaluation of
the state of confusion. By contrast, we failed to find any
quantitative correlation between the THC levels measured in
whole blood and either the BOLD signal or the psychomotor
performance. These results bolster the ‘‘zero tolerance policy’’ that
prohibits the presence of any amount of THC in the blood whiledriving.
Supporting Information
Doc S1 Methods: supplementary material: Cannabis
material, Joint preparation and inhalation procedure, Question-
naires. Results: supplementary material: Excluded subjects,
Results of the cannabis puffing procedure.
(DOC)
Doc S2 Control session – Supplementary material.
(DOC)
Doc S3 Default mode network – Supplementary mate-rial.
(DOC)
Acknowledgments
The work was supported by the Centre d’Imagerie BioMedicale (CIBM) of
the University of Lausanne (UNIL), the Swiss Federal Institute of
Technology Lausanne (EPFL), the University of Geneva (UniGe), the
Centre Hospitalier Universitaire Vaudois (CHUV), the Hopitaux Uni-
versitaires de Geneve (HUG), and the L eenaards and Jeantet F oundations.
We thank Prof. Patrice Mangin, Dr. Christian Staub, Dr. Marc Augsburger of the University Center of Forensic Medicine Lausanne-
Geneva, Prof. Thierry Buclin, and the staff of the division of Clinical
Pharmacology and Toxicology at CHUV. We also acknowledge Mrs
Estelle Lauer, CURML Geneva, for her technical assistance and Ms.
Dasha Polzik (University of Chicago) for her assistance in preparing the
manuscript.
Author Contributions
Conceived and designed the experiments: EF CG PM BF JFM HC.
Performed the experiments: GB EF CG PM JFM HC AT MA BF.
Analyzed the data: GB EF PM CG MA JMA. Contributed reagents/
materials/analysis tools: CG MA AT. Wrote the paper: GB EF AT JFM
HC MA JMA BF PM CG.
References
1. Walsh JM, de Gier JJ, Christopherson AS, Verstraete AG (2004) Drugs and
driving. Traffic Inj Prev 5: 241–253.
2. Sewell RA, Poling J, Sofuoglu M (2009) The effect of cannabis compared with
alcohol on driving. Am J Addict 18: 185–193.
3. Asbridge M (2005) Letter to the editor and reply on: ‘‘Drugs and driving,’’
Traffic Injury Prevention, 5: 241–253, 2004. Traffic Inj Prev 6: 197; author
reply 197.
4. Hunault CC, Mensinga TT, Bocker KB, Schipper CM, Kruidenier M, et al.
(2009) Cognitive and psychomotor effects in males after smoking a combination
of tobacco and cannabis containing up to 69 mg delta-9-tetrahydrocannabinol
(THC). Psychopharmacology 204: 85–94.
5. Ramaekers JG, Kauert G, Theunissen EL, Toennes SW, Moeller MR (2009)
Neurocognitive performance during acute THC intoxication in heavy and
occasional cannabis users. Journal of psychopharmacology 23: 266–277.
6. Hart CL, van Gorp W, Haney M, Foltin RW, Fischman MW (2001) Effects of
acute smoked marijuana on complex cognitive performance. Neuropsycho-
pharmacology 25: 757–765.7. Movig KL, Mathijssen MP, Nagel PH, van Egmond T, de Gier JJ, et al. (2004)
Psychoactive substance use and the risk of motor vehicle accidents. Accid Anal
Prev 36: 631–636.
8. Nordstrom BR, Hart CL (2006) Assessing cognitive functioning in cannabis
users: cannabis use history an important consideration. Neuropsychopharma-
cology 31: 2798–2799; author reply 2800–2791.
9. Ramaekers JG, Kauert G, Theunissen EL, Moeller MR (2006) Up in smoke:
comparability of THC dosing across performance studies. Neuropsychophar-
macology 31: 2800–2801.
10. Chang L, Chronicle EP (2007) Functional imaging studies in cannabis users.
Neuroscientist 13: 422–432.
11. Harder S, Rietbrock S (1997) Concentration-effect relationship of delta-9-
tetrahydrocannabiol and prediction of psychotropic effects after smoking
marijuana. Int J Clin Pharmacol Ther 35: 155–159.
12. Steentoft A, Simonsen KW, Linnet K (2010) The frequency of drugs among
Danish drivers before and after the introduction of fixed concentration limits.
Traffic Inj Prev 11: 329–333.
13. Senna MC, Augsburger M, Aebi B, Briellmann TA, Donze N, et al. (2010) Firstnationwide study on driving under the influence of drugs in Switzerland.
Forensic science international 198: 11–16.
14. Martin-Santos R, Fagundo AB, Crippa JA, Atakan Z, Bhattacharyya S, et al.
(2010) Neuroimaging in cannabis use: a systematic review of the literature.
Psychol Med 40: 383–398.
15. Gruber SA, Yurgelun-Todd DA (2005) Neuroimaging of marijuana smokers
during inhibitory processing: a pilot investigation. Brain Res Cogn Brain Res 23:
107–118.
16. Kanayama G, Rogowska J, Pope HG, Gruber SA, Yurgelun-Todd DA (2004)
Spatial working memory in heavy cannabis users: a functional magnetic
resonance imaging study. Psychopharmacology (Berl) 176: 239–247.
17. Hester R, Nestor L, Garavan H (2009) Impaired error awareness and anterior
cingulate cortex hypoactivity in chronic cannabis users. Neuropsychopharma-
cology 34: 2450–2458.
18. Chang L, Yakupov R, Cloak C, Ernst T (2006) Marijuana use is associated with
a reorganized visual-attention network and cerebellar hypoactivation. Brain 129:
1096–1112.
19. Lorenzetti V, Lubman DI, Whittle S, Solowij N, Yucel M (2010) Structural MRIfindings in long-term cannabis users: what do we know? Subst Use Misuse 45:
1787–1808.
20. Mathew RJ, Wilson WH (1993) Acute changes in cerebral blood flow after
smoking marijuana. Life Sci 52: 757–767.
21. Mathew RJ, Wilson WH, Humphreys DF, Lowe JV, Wiethe KE (1992)Regional cerebral blood flow after marijuana smoking. J Cereb Blood Flow
Metab 12: 750–758.
22. Mathew RJ, Wilson WH, Turkington TG, Hawk TC, Coleman RE, et al. (2002)
Time course of tetrahydrocannabinol-induced changes in regional cerebralblood flow measured with positron emission tomography. Psychiatry Res 116:
173–185.
23. Gonzalez R (2007) Acute and non-acute effects of cannabis on brain functioning
and neuropsychological performance. Neuropsychology review 17: 347–361.24. Brown GG, Caligiuri M, Meloy MJ, Eberson SC, Kindermann SS, et al. (2004)
Functional brain asymmetries during visuomotor tracking. J Clin Exp
Neuropsychol 26: 356–368.
25. Corbetta M (1998) Frontoparietal cortical networks for directing attention and
the eye to visual locations: identical, independent, or overlapping neural
systems? Proc Natl Acad Sci U S A 95: 831–838.
26. Bobon D, Woggon B (1986) The AMDP-system in clinical psychopharmacology.
Br J Psychiatry 148: 467–468.
27. Copersino ML, Fals-Stewart W, Fitzmaurice G, Schretlen DJ, Sokoloff J, et al.
(2009) Rapid cognitive screening of patients with substance use disorders. Exp
Clin Psychopharmacol 17: 337–344.
28. Legleye S, Piontek D, Kraus L (2011) Psychometric properties of the Cannabis Abuse Screening Test (CAST) in a French sample of adolescents. Drug Alcohol
Depend 113: 229–235.
29. Thomas A, Widmer C, Hopfgartner G, Staub C (2007) Fast gas chromatog-
raphy and negative-ion chemical ionization tandem mass spectrometry forforensic analysis of cannabinoids in whole blood. J Pharm Biomed Anal 45: 495–
503.
30. Wingen M, Bothmer J, Langer S, Ramaekers JG (2005) Actual driving
performance and psychomotor function in healthy subjects after acute and
subchronic treatment with escitalopram, mirtazapine, and placebo: a crossovertrial. The Journal of clinical psychiatry 66: 436–443.
31. Allen RW, Stein AC, Jex HR. Detecting human operator impairment with
a psychomotor task; 1981; Los Angeles, CA, USA. JPL Publication. 611–625.
32. Burns M, Moskowitz H (1980) Effects of diphenhydramine and alcohol on skills
performance. European journal of clinical pharmacology 17: 259–266.
33. Ramaekers JG, Kauert G, van Ruitenbeek P, Theunissen EL, Schneider E, et al.
(2006) High-potency marijuana impairs executive function and inhibitory motorcontrol. Neuropsychopharmacology: official publication of the American
College of Neuropsychopharmacology 31: 2296–2303.
34. Ramaekers JG (2003) Antidepressants and driver impairment: empirical
evidence from a standard on-the-road test. The Journal of clinical psychiatry64: 20–29.
Cannabis and Driving
PLOS ONE | www.plosone.org 14 January 2013 | Volume 8 | Issue 1 | e52545

7/30/2019 Weed or Wheel! fMRI, Behavioural, and Toxicological Investigations of How Cannabis Smoking Affects Skills Neces…
http://slidepdf.com/reader/full/weed-or-wheel-fmri-behavioural-and-toxicological-investigations-of-how-cannabis 15/15
35. Calhoun VD, Pekar JJ, McGinty VB, Adali T, Watson TD, et al. (2002)Different activation dynamics in multiple neural systems during simulateddriving. Hum Brain Mapp 16: 158–167.
36. Calhoun VD, Pekar JJ, Pearlson GD (2004) Alcohol intoxication effects onsimulated driving: exploring alcohol-dose effects on brain activation using functional MRI. Neuropsychopharmacology 29: 2097–2017.
37. Lindquist MA, Meng Loh J, Atlas LY, Wager TD (2009) Modeling thehemodynamic response function in fMRI: efficiency, bias and mis-modeling.Neuroimage 45: S187–198.
38. Lindquist MA, Wager TD (2007) Validity and power in hemodynamic responsemodeling: a comparison study and a new approach. Hum Brain Mapp 28: 764–
784.39. Atlas LY, Whittington RA, Lindquist MA, Wielgosz J, Sonty N, et al. (2012)Dissociable influences of opiates and expectations on pain. J Neurosci 32: 8053– 8064.
40. Walsh JM, Verstraete AG, Huestis MA, Morland J (2008) Guidelines forresearch on drugged driving. Addiction 103: 1258–1268.
41. Ramaekers JG, Moeller MR, van Ruitenbeek P, Theunissen EL, Schneider E, etal. (2006) Cognition and motor control as a function of Delta9-THCconcentration in serum and oral fluid: limits of impairment. Drug and alcoholdependence 85: 114–122.
42. Culham JC, Brandt SA, Cavanagh P, Kanwisher NG, Dale AM, et al. (1998)Cortical fMRI activation produced by attentive tracking of moving targets.
J Neurophysiol 80: 2657–2670.43. Hamzei F, Dettmers C, Rijntjes M, Glauche V, Kiebel S, et al. (2002)
Visuomotor control within a distributed parieto-frontal network. Exp Brain Res146: 273–281.
44. Koechlin E, Ody C, Kouneiher F (2003) The architecture of cognitive control inthe human prefrontal cortex. Science 302: 1181–1185.
45. Fox MD, Snyder AZ, Vincent JL, Corbetta M, Van Essen DC, et al. (2005) The
human brain is intrinsically organized into dynamic, anticorrelated functionalnetworks. Proc Natl Acad Sci U S A 102: 9673–9678.46. Greicius MD, Krasnow B, Reiss AL, Menon V (2003) Functional connectivity in
the resting brain: a network analysis of the default mode hypothesis. Proc Natl Acad Sci U S A 100: 253–258.
47. Seeley WW, Menon V, Schatzberg AF, Keller J, Glover GH, et al. (2007)Dissociable intrinsic connectivity networks for salience processing and executivecontrol. J Neurosci 27: 2349–2356.
48. Sridharan D, Levitin DJ, Menon V (2008) A critical role for the right fronto-insular cortex in switching between central-executive and default-modenetworks. Proc Natl Acad Sci U S A 105: 12569–12574.
49. Filbey FM, Schacht JP, Myers US, Chavez RS, Hutchison KE (2009) Marijuanacraving in the brain. Proc Natl Acad Sci U S A 106: 13016–13021.
50. Volkow ND, Fowler JS, Wang GJ, Goldstein RZ (2002) Role of dopamine, thefrontal cortex and memory circuits in drug addiction: insight from imaging studies. Neurobiol Learn Mem 78: 610–624.
51. Roiser JP, Stephan KE, den Ouden HE, Friston KJ, Joyce EM (2010) Adaptiveand aberrant reward prediction signals in the human brain. Neuroimage 50:657–664.
52. Menon V, Uddin LQ (2010) Saliency, switching, attention and control:a network model of insula function. Brain Struct Funct 214: 655–667.
53. Brown JW, Braver TS (2005) Learned predictions of error likelihood in theanterior cingulate cortex. Science 307: 1118–1121.
54. Magno E, Foxe JJ, Molholm S, Robertson IH, Garavan H (2006) The anteriorcingulate and error avoidance. J Neurosci 26: 4769–4773.
55. Modirrousta M, Fellows LK (2008) Dorsal medial prefrontal cortex playsa necessary role in rapid error prediction in humans. J Neurosci 28: 14000– 14005.
56. Klein TA, Endrass T, Kathmann N, Neumann J, von Cramon DY, et al. (2007)Neural correlates of error awareness. Neuroimage 34: 1774–1781.
57. Vandenberghe R, Gitelman DR, Parrish TB, Mesulam MM (2001) Functionalspecificity of superior parietal mediation of spatial shifting. Neuroimage 14: 661– 673.
58. Corbetta M, Shulman GL (2002) Control of goal-directed and stimulus-drivenattention in the brain. Nat Rev Neurosci 3: 201–215.
59. Muggleton NG, Kalla R, Juan CH, Walsh V (2011) Dissociating thecontributions of human frontal eye fields and posterior parietal cortex to visualsearch. J Neurophysiol 105: 2891–2896.
60. Harding IH, Solowij N, Harrison BJ, Takagi M, Lorenzetti V, et al. (2012)
Functional connectivity in brain networks underlying cognitive control inchronic cannabis users. Neuropsychopharmacology 37: 1923–1933.
61. Haber SN, Kunishio K, Mizobuchi M, Lynd-Balta E (1995) The orbital andmedial prefrontal circuit through the primate basal ganglia. J Neurosci 15:4851–4867.
62. Carmichael ST, Price JL (1995) Sensory and premotor connections of the orbitaland medial prefrontal cortex of macaque monkeys. J Comp Neurol 363: 642– 664.
63. Li CS, Yan P, Bergquist KL, Sinha R (2007) Greater activation of the ‘‘default’’brain regions predicts stop signal errors. Neuroimage 38: 640–648.
64. Gallea C, Graaf JB, Pailhous J, Bonnard M (2008) Error processing during online motor control depends on the response accuracy. Behav Brain Res 193:117–125.
65. Gusnard DA, Akbudak E, Shulman GL, Raichle ME (2001) Medial prefrontalcortex and self-referential mental activity: relation to a default mode of brainfunction. Proc Natl Acad Sci U S A 98: 4259–4264.
66. Raichle ME, MacLeod AM, Snyder AZ, Powers WJ, Gusnard DA, et al. (2001) A default mode of brain function. Proc Natl Acad Sci U S A 98: 676–682.
67. Ingvar DH (1985) ‘‘Memory of the future’’: an essay on the temporalorganization of conscious awareness. Hum Neurobiol 4: 127–136.
68. Raichle ME, Snyder AZ (2007) A default mode of brain function: a brief historyof an evolving idea. Neuroimage 37: 1083–1090; discussion 1097–1089.
69. Ma N, Liu Y, Fu XM, Li N, Wang CX, et al. (2011) Abnormal brain default-mode network functional connectivity in drug addicts. PLoS One 6: e16560.
70. Ma N, Liu Y, Li N, Wang CX, Zhang H, et al. (2010) Addiction relatedalteration in resting-state brain connectivity. Neuroimage 49: 738–744.
71. Kelley WM, Macrae CN, Wyland CL, Caglar S, Inati S, et al. (2002) Finding the self? An event-related fMRI study. J Cogn Neurosci 14: 785–794.
72. Habas C, Kamdar N, Nguyen D, Prater K, Beckmann CF, et al. (2009) Distinctcerebellar contributions to intrinsic connectivity networks. J Neurosci 29: 8586– 8594.
73. Cattaneo L, Fasanelli M, Andreatta O, Bonifati DM, Barchiesi G, et al. (2012)
Your actions in my cerebellum: subclinical deficits in action observation inpatients with unilateral chronic cerebellar stroke. Cerebellum 11: 264–271.74. Sacco RG (2010) The circumplex structure of depersonalization/derealization.
International J Pschol Studies 2: 26–40.75. Mathew RJ, Wilson WH, Tant SR (1989) Acute changes in cerebral blood flow
associated with marijuana smoking. Acta psychiatrica Scandinavica 79: 118– 128.
76. Toennes SW, Kauert GF, Steinmeyer S, Moeller MR (2005) Driving under theinfluence of drugs – evaluation of analytical data of drugs in oral fluid, serumand urine, and correlation with impairment symptoms. Forensic Sci Int 152:149–155.
77. Duverneuil-Mayer C, Charlier P, Emuri A, Lorin G, Grassin-Delyle S, et al.(2011) Kinetic study of Delta-9-Tetrahydrocannabinol, its metabolites, canna-bidiol, and cannabinol in the blood and brain of mice. Application to humans.
Ann Toxicol Anal 23: 193–204.78. Huestis MA, Henningfield JE, Cone EJ (1992) Blood cannabinoids. I.
Absorption of THC and formation of 11-OH-THC and THCCOOH during and after smoking marijuana. J Anal Toxicol 16: 276–282.
79. Giroud C, Menetrey A, Augsburger M, Buclin T, Sanchez-Mazas P, et al. (2001)Delta(9)-THC, 11-OH-Delta(9)-THC and Delta(9)-THCCOOH plasma orserum to whole blood concentrations distribution ratios in blood samples takenfrom living and dead people. Forensic Sci Int 123: 159–164.
80. Schwope DM, Karschner EL, Gorelick DA, Huestis MA (2011) Identification of recent cannabis use: whole-blood and plasma free and glucuronidatedcannabinoid pharmacokinetics following controlled smoked cannabis adminis-tration. Clin Chem 57: 1406–1414.
81. Hunault CC, Mensinga TT, de Vries I, Kelholt-Dijkman HH, Hoek J, et al.(2008) Delta-9-tetrahydrocannabinol (THC) serum concentrations and pharma-cological effects in males after smoking a combination of tobacco and cannabiscontaining up to 69 mg THC. Psychopharmacology 201: 171–181.
82. Grotenhermen F, Leson G, Berghaus G, Drummer OH, Kruger HP, et al.(2007) Developing limits for driving under cannabis. Addiction 102: 1910–1917.
83. Van der Kooy F, Pomahacova B, Verpoorte R (2009) Cannabis smokecondensate II: influence of tobacco on tetrahydrocannabinol levels. InhalToxicol 21: 87–90.
84. Lindquist MA, Waugh C, Wager TD (2007) Modeling state-related fMRIactivity using change-point theory. Neuroimage 35: 1125–1141.
85. Robinson LF, Wager TD, Lindquist MA (2010) Change point estimation inmulti-subject fMRI studies. Neuroimage 49: 1581–1592.
86. Wen X, Yao L, Liu Y, Ding M (2012) Causal interactions in attention networkspredict behavioral performance. J Neurosci 32: 1284–1292.
Cannabis and Driving
PLOS ONE | www plosone org 15 January 2013 | Volume 8 | Issue 1 | e52545