week 4 economics graded assignment
TRANSCRIPT
8/3/2019 Week 4 Economics Graded Assignment
http://slidepdf.com/reader/full/week-4-economics-graded-assignment 1/14
Chapter 28: The Aggregate Expenditures Model
QUESTIONS and ANSWERS
1. What is an investment schedule and how does it differ from an investment demand curve?
Answer: An investment schedule shows the level of investment spending for a given level of GDP. An
investment demand curve shows how expected rates of profit and real interest rates determine the level of investment spending. In the simple AE model, investment spending is assumed to be independent of the level of real GDP.
2. Why does equilibrium real GDP occur where C + Ig = GDP in a private closed economy?What happens to real GDP when C + Ig exceeds GDP? When C + Ig is less than GDP? What two expenditurecomponents of real GDP are purposely excluded in a private closed economy?
Answer: The reason why equilibrium occurs when real GDP equals C + Ig in a private closed economy is becauseit is at this level output where production creates total spending just sufficient to purchase that output. So theequilibrium level of GDP is the level at which the total quantity of goods produced (GDP) equals the total quantityof goods purchased (C + I g ).
If real GDP (output) exceeds C + I g the economy will accumulate unplanned inventories. If C + I g exceeds realGDP (output) the economy will draw down inventories faster than planned.
In a private closed economy net exports (closed) and the government sector (private) are both excluded from theanalysis.
3. Why is saving called a leakage? Why is planned investment called an injection? Why must saving equal plannedinvestment at equilibrium GDP in the private closed economy? Are unplanned changes in inventories rising,falling, or constant at equilibrium GDP? Explain.
Answer: Saving is like a leakage from the flow of aggregate consumption expenditures because saving representsincome not spent. Planned investment is an injection because it is spending on capital goods that businesses plan
to make regardless of their current level of income. If the two are unequal, there will be a discrepancy betweenspending and production that will result in unplanned inventory changes. Firms, not wanting inventory levels tochange, will change production, implying that equilibrium can only occur when the saving leakage equals theinjection of investment spending in a private closed economy.
At equilibrium GDP there will be no changes in unplanned inventories because expenditures will exactly equalplanned output levels which include consumer goods and services and planned investment. Thus there is nounplanned investment including no unplanned inventory changes.
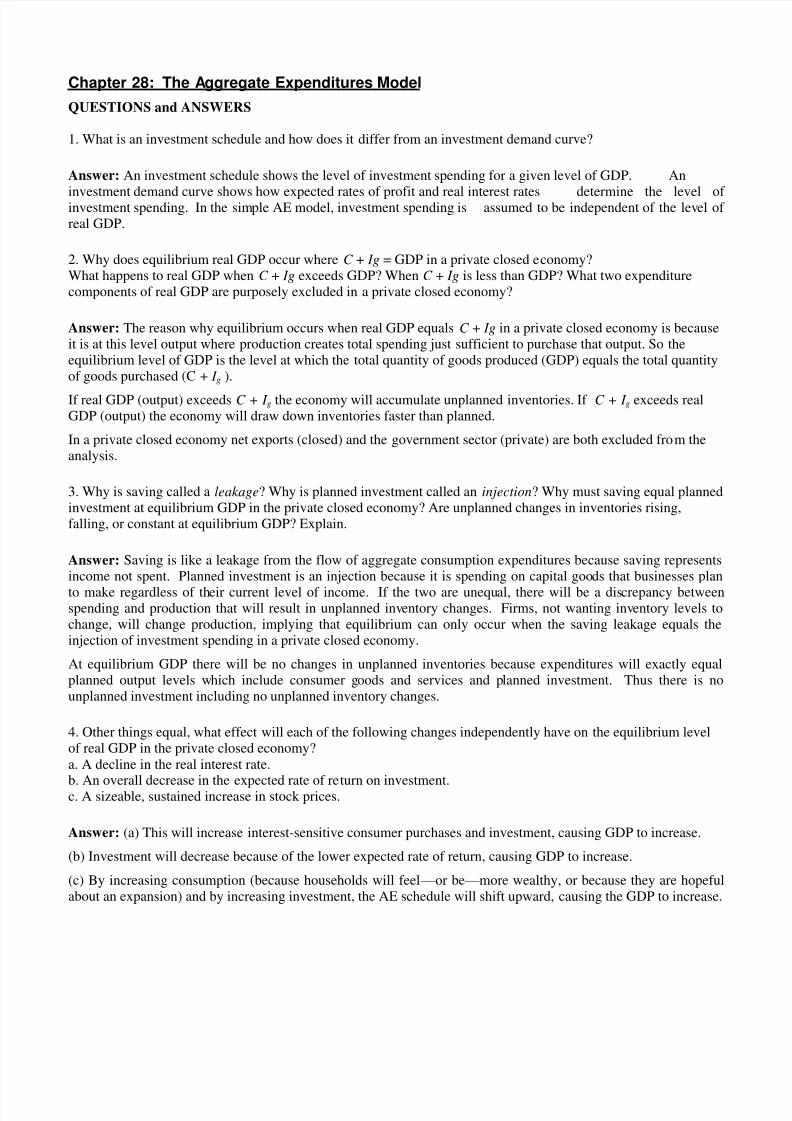
4. Other things equal, what effect will each of the following changes independently have on the equilibrium levelof real GDP in the private closed economy?a. A decline in the real interest rate.
b. An overall decrease in the expected rate of return on investment.c. A sizeable, sustained increase in stock prices.
Answer: (a) This will increase interest-sensitive consumer purchases and investment, causing GDP to increase.
(b) Investment will decrease because of the lower expected rate of return, causing GDP to increase.
(c) By increasing consumption (because households will feel — or be — more wealthy, or because they are hopefulabout an expansion) and by increasing investment, the AE schedule will shift upward, causing the GDP to increase.

8/3/2019 Week 4 Economics Graded Assignment
http://slidepdf.com/reader/full/week-4-economics-graded-assignment 2/14
5. Assuming the economy is operating below its potential output, what is the impact of an increase in net exportson real GDP? Why is it difficult, if not impossible, for a country to boost its net exports by increasing its tariffsduring a global recession?
Answer: Like consumption and investment, exports create domestic production, income, and employment for anation. Although U.S. goods and services produced for export are sent abroad, foreign spending on those goodsand services increases production and creates jobs and incomes in the United States. This implies that an increase
in net exports results in an increase in aggregate expenditures and an increase in real GDP.
However, the use of tariffs to accomplish this goal (boost NET exports) will likely fail because other countries willrespond in-kind. That is, if the United States increased tariffs to reduce imports (boost net exports) foreigncountries will respond with tariffs on U.S. goods reducing exports from the U.S. (decrease in net exports).
6. What is a recessionary expenditure gap? An inflationary expenditure gap? Which is associated with a positiveGDP gap? A negative GDP gap?
Answer: A recessionary expenditure gap is the amount by which aggregate expenditures at the full employment GDP fall short of those required to achieve the full employment GDP. Insufficient total spending contracts ordepresses the economy. This also is referred to as a negative GDP gap.
Economists use the term inflationary expenditure gap to describe the amount by which an economy‘s aggregate expenditures at the full-employment GDP exceed those just necessary to achieve the full-employment level of GDP. This also is referred to as a positive GDP gap.
7. What is Say‘s law? How does it relate to the view held by classical economists that the economy generally willoperate at a position on its production possibilities curve (Chapter 1)? Use production possibilities analysis todemonstrate Keynes‘ view on this matter.
Answer: Say‘s law states ―supply creates its own demand.‖ People work in order to earn income to, and plan to,spend the income on output – why else would they work? Basically, the classical economists would say that theeconomy will operate at full employment or on the production possibilities curve because income earned will be
recycled or spent on output. Thus the spending flow is continuously recycled in production and earning income. If consumers don‘t spend all their income, it would be redirected via saving to investment spending on capital goods.
The Keynesian perspective, on the other hand, suggests that society‘s savings will not necessarily all be channeledinto investment spending. If this occurs, we have a situation in which aggregate demand is less than potentialproduction. Because producers cannot sell all of the output produced at a full employment level, they will reduceoutput and employment to meet the aggregate demand (consumption plus investment) and the equilibrium outputwill be at a point inside the production possibilities curve at less than full employment.

8/3/2019 Week 4 Economics Graded Assignment
http://slidepdf.com/reader/full/week-4-economics-graded-assignment 3/14
Chapter 28: The Aggregate Expenditures Model
PROBLEMS AND SOLUTIONS
1. If the level of investment is $16 billion and independent of the level of total output, complete the table below and determinethe equilibrium levels of output and employment in this private closed economy. What are the sizes of the MPC and MPS?
The savings column is found by subtracting Consumption from Real Domestic Output (disposable income) for each row. Theanswers are reported in the savings column below. We can also find aggregate expenditures by adding consumption andinvestment, which is reported in the last column in the table below. We can find equilibrium two ways. First, we can find thelevel of output and employment where Investment equals Savings. Second, we can find the level of output and employmentwhere aggregate expenditures equal real output. Either of these approaches give us the equilibrium level of output of $340billion and a level of employment 65 million.
The marginal propensity to consume can be found by dividing the change in consumption by the change in real domestic output.
MPC = Δ Consumption/Δ Real Domestic Output = $16/$20 = 0.8
The marginal propensity to save can be found by subtracting the marginal propensity to consume from one.MPS = 1 - MPC = 1 - 0.8 = 0.2
The expenditure multiplier can be found by dividing one by the marginal propensity or by one minus the marginal propensity toconsume.Expenditure multiplier = 1/MPS = 1/(1-MPS) = 1/0.2 = 5
Possible levelsof employment
(millions)
Real domesticoutput
(GDP=DI)(billions)
Consumption(billions)
Saving(billions)
Investment(billions)
AggregateExpenditures
(billions)
404550556065707580
$240260280300320340360380400
$244260276292308324340356372
$ -4048
1216202428
$161616161616161616
$260276292308324340356372388
8/3/2019 Week 4 Economics Graded Assignment
http://slidepdf.com/reader/full/week-4-economics-graded-assignment 4/14
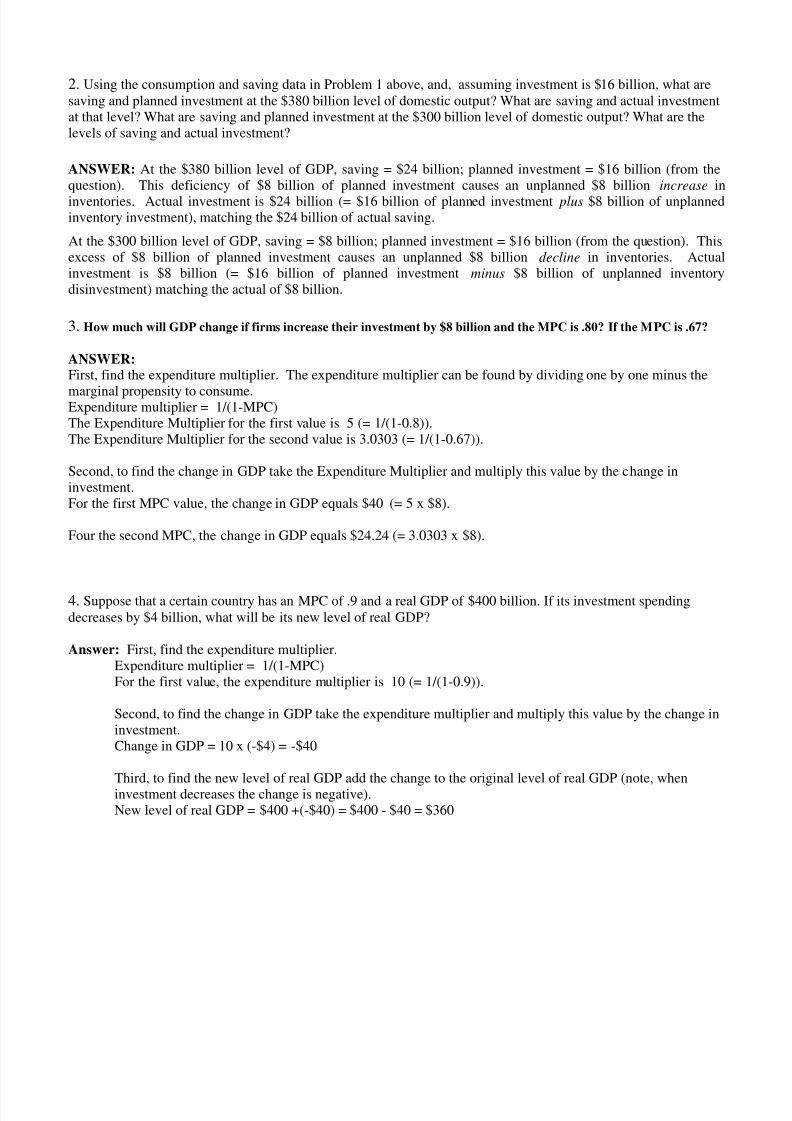
2. Using the consumption and saving data in Problem 1 above, and, assuming investment is $16 billion, what aresaving and planned investment at the $380 billion level of domestic output? What are saving and actual investmentat that level? What are saving and planned investment at the $300 billion level of domestic output? What are thelevels of saving and actual investment?
ANSWER: At the $380 billion level of GDP, saving = $24 billion; planned investment = $16 billion (from thequestion). This deficiency of $8 billion of planned investment causes an unplanned $8 billion increase in
inventories. Actual investment is $24 billion (= $16 billion of planned investment plus $8 billion of unplannedinventory investment), matching the $24 billion of actual saving.
At the $300 billion level of GDP, saving = $8 billion; planned investment = $16 billion (from the question). Thisexcess of $8 billion of planned investment causes an unplanned $8 billion decline in inventories. Actualinvestment is $8 billion (= $16 billion of planned investment minus $8 billion of unplanned inventorydisinvestment) matching the actual of $8 billion.
3. How much will GDP change if firms increase their investment by $8 billion and the MPC is .80? If the MPC is .67?
ANSWER:First, find the expenditure multiplier. The expenditure multiplier can be found by dividing one by one minus the
marginal propensity to consume.Expenditure multiplier = 1/(1-MPC)The Expenditure Multiplier for the first value is 5 (= 1/(1-0.8)).The Expenditure Multiplier for the second value is 3.0303 (= 1/(1-0.67)).
Second, to find the change in GDP take the Expenditure Multiplier and multiply this value by the change ininvestment.For the first MPC value, the change in GDP equals $40 (= 5 x $8).
Four the second MPC, the change in GDP equals $24.24 (= 3.0303 x $8).
4. Suppose that a certain country has an MPC of .9 and a real GDP of $400 billion. If its investment spendingdecreases by $4 billion, what will be its new level of real GDP?
Answer: First, find the expenditure multiplier.Expenditure multiplier = 1/(1-MPC)For the first value, the expenditure multiplier is 10 (= 1/(1-0.9)).
Second, to find the change in GDP take the expenditure multiplier and multiply this value by the change ininvestment.Change in GDP = 10 x (-$4) = -$40
Third, to find the new level of real GDP add the change to the original level of real GDP (note, wheninvestment decreases the change is negative).New level of real GDP = $400 +(-$40) = $400 - $40 = $360

8/3/2019 Week 4 Economics Graded Assignment
http://slidepdf.com/reader/full/week-4-economics-graded-assignment 5/14
5. The data in columns 1 and 2 in the accompanying table are for a private closedeconomy:
a. Use columns 1 and 2 to determine the equilibrium GDP for this hypothetical economy.
b. Now open up this economy to international trade by including the export and importfigures of columns 3 and 4. Fill in columns 5 and 6 and determine the equilibrium GDPfor the open economy. What is the change in equilibrium GDP caused by the addition ofnet exports?
c. Given the original $20 billion level of exports, what would be net exports and theequilibrium GDP if imports were $10 billion greater at each level of GDP?
d. What is the multiplier in this example?
ANSWERS:
Part a:
Use columns 1 and 2 to determine the equilibrium GDP for this hypothetical economy.
ANSWER: Equilibrium for this economy occurs where Aggregate Expenditures for thePrivate Closed Economy equals Real Gross Domestic Product. Thus, equilibrium is $400billion.
Part b:
Now open up this economy to international trade by including the export and importfigures of columns 3 and 4. Fill in columns 5 and 6 and determine the equilibrium GDPfor the open economy. What is the change in equilibrium GDP caused by the addition ofnet exports?

8/3/2019 Week 4 Economics Graded Assignment
http://slidepdf.com/reader/full/week-4-economics-graded-assignment 6/14
ANSWER: To find net exports, subtract imports from exports. These answers arereported in column 5 below. To find aggregate expenditures for the open economy, addnet exports to the aggregate expenditures for the closed economy. These values arereported in column 6.
(1)
Real
domestic
output
(GDP=DI)
billions
(2)
Aggregate
Expenditures,
privateclosed
economy,
billions
(3)
Exports,
billions
(4)
Imports,
billions
(5)
Net
exports,
private
economy
(6)
Aggregate
expenditures,
open
billions
$200
$250
$300
$350
$400
$450
$500
$550
$240
$280
$320
$360
$400
$440
$480
$520
$20
$20
$20
$20
$20
$20
$20
$20
$30
$30
$30
$30
$30
$30
$30
$30
-$ 10
-$ 10
-$ 10
-$ 10
-$ 10
-$ 10
-$ 10
-$ 10
$ 230
$ 270
$ 310
$ 350
$ 390
$ 430
$ 470
$ 510
Equilibrium for this economy occurs where Aggregate Expenditures for the Private Open
Economy equals Real Gross Domestic Product. Thus, equilibrium is $350 billion. Thechange in equilibrium GDP is a decrease of $50.
Part c:
Given the original $20 billion level of exports, what would be net exports and theequilibrium GDP if imports were $10 billion greater at each level of GDP?
8/3/2019 Week 4 Economics Graded Assignment
http://slidepdf.com/reader/full/week-4-economics-graded-assignment 7/14
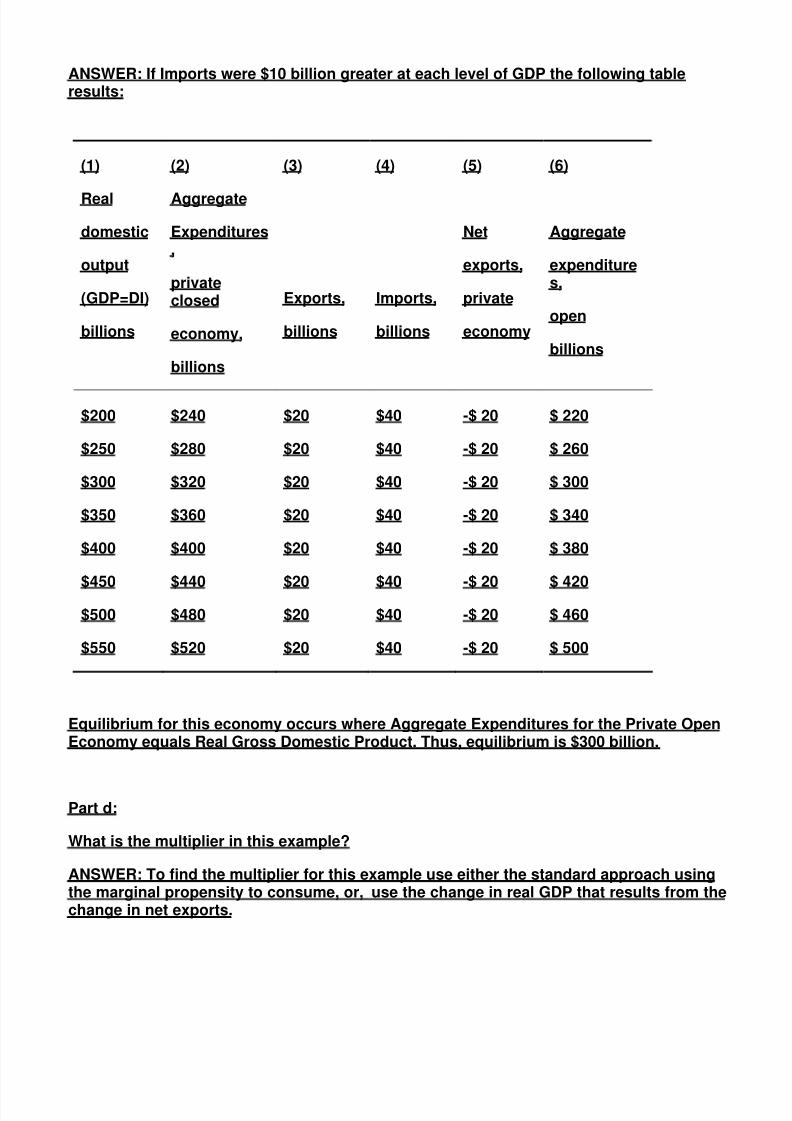
ANSWER: If Imports were $10 billion greater at each level of GDP the following tableresults:
(1)
Real
domestic
output
(GDP=DI)
billions
(2)
Aggregate
Expenditures,
privateclosed
economy,
billions
(3)
Exports,
billions
(4)
Imports,
billions
(5)
Net
exports,
private
economy
(6)
Aggregate
expenditures,
open
billions
$200
$250
$300
$350
$400
$450$500
$550
$240
$280
$320
$360
$400
$440$480
$520
$20
$20
$20
$20
$20
$20$20
$20
$40
$40
$40
$40
$40
$40$40
$40
-$ 20
-$ 20
-$ 20
-$ 20
-$ 20
-$ 20-$ 20
-$ 20
$ 220
$ 260
$ 300
$ 340
$ 380
$ 420$ 460
$ 500
Equilibrium for this economy occurs where Aggregate Expenditures for the Private OpenEconomy equals Real Gross Domestic Product. Thus, equilibrium is $300 billion.
Part d:
What is the multiplier in this example?
ANSWER: To find the multiplier for this example use either the standard approach usingthe marginal propensity to consume, or, use the change in real GDP that results from thechange in net exports.

8/3/2019 Week 4 Economics Graded Assignment
http://slidepdf.com/reader/full/week-4-economics-graded-assignment 8/14
The latter approach is used here. The change in net exports equals -$10 billion. Thechange in real GDP associated with the change in net exports is -$50.
Multiplier = Δ real GDP/ Δ net exports = -$50 billion/-$10 billion = 5
8/3/2019 Week 4 Economics Graded Assignment
http://slidepdf.com/reader/full/week-4-economics-graded-assignment 9/14
Chapter 29: Aggregate Demand and Aggregate Supply
QUESTIONS and ANSWERS
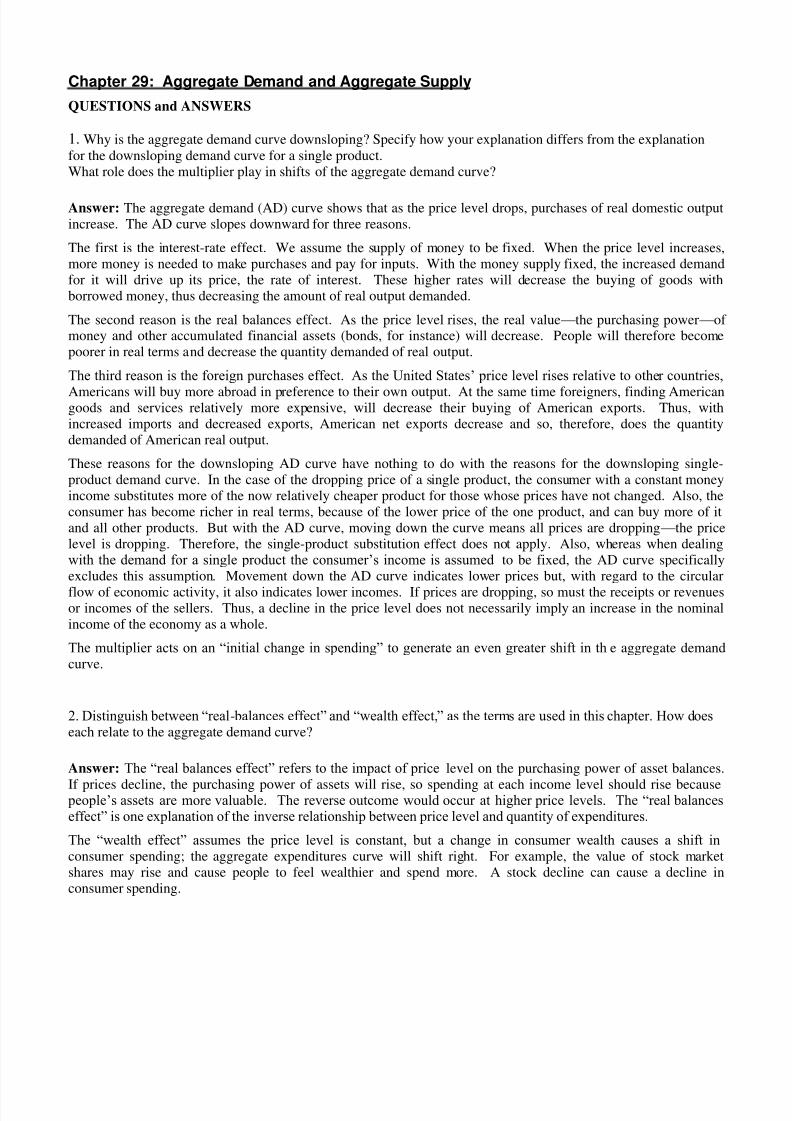
1. Why is the aggregate demand curve downsloping? Specify how your explanation differs from the explanationfor the downsloping demand curve for a single product.What role does the multiplier play in shifts of the aggregate demand curve?
Answer: The aggregate demand (AD) curve shows that as the price level drops, purchases of real domestic outputincrease. The AD curve slopes downward for three reasons.
The first is the interest-rate effect. We assume the supply of money to be fixed. When the price level increases,more money is needed to make purchases and pay for inputs. With the money supply fixed, the increased demandfor it will drive up its price, the rate of interest. These higher rates will decrease the buying of goods withborrowed money, thus decreasing the amount of real output demanded.
The second reason is the real balances effect. As the price level rises, the real value — the purchasing power — of money and other accumulated financial assets (bonds, for instance) will decrease. People will therefore becomepoorer in real terms and decrease the quantity demanded of real output.
The third reason is the foreign purchases effect. As the United States‘ price level rises relative to other countries,
Americans will buy more abroad in preference to their own output. At the same time foreigners, finding Americangoods and services relatively more expensive, will decrease their buying of American exports. Thus, withincreased imports and decreased exports, American net exports decrease and so, therefore, does the quantitydemanded of American real output.
These reasons for the downsloping AD curve have nothing to do with the reasons for the downsloping single-product demand curve. In the case of the dropping price of a single product, the consumer with a constant moneyincome substitutes more of the now relatively cheaper product for those whose prices have not changed. Also, theconsumer has become richer in real terms, because of the lower price of the one product, and can buy more of itand all other products. But with the AD curve, moving down the curve means all prices are dropping — the pricelevel is dropping. Therefore, the single-product substitution effect does not apply. Also, whereas when dealingwith the demand for a single product the consumer‘s income is assumed to be fixed, the AD curve specificallyexcludes this assumption. Movement down the AD curve indicates lower prices but, with regard to the circular
flow of economic activity, it also indicates lower incomes. If prices are dropping, so must the receipts or revenuesor incomes of the sellers. Thus, a decline in the price level does not necessarily imply an increase in the nominalincome of the economy as a whole.
The multiplier acts on an ―initial change in spending‖ to generate an even greater shift in th e aggregate demandcurve.
2. Distinguish between ―real- balances effect‖ and ―wealth effect,‖ as the terms are used in this chapter. How doeseach relate to the aggregate demand curve?
Answer: The ―real balances effect‖ refers to the impact of price level on the purchasing power of asset balances.
If prices decline, the purchasing power of assets will rise, so spending at each income level should rise because people‘s assets are more valuable. The reverse outcome would occur at higher price levels. The ―real balanceseffect‖ is one explanation of the inverse relationship between price level and quantity of expenditures.
The ―wealth effect‖ assumes the price level is constant, but a change in consumer wealth causes a shift inconsumer spending; the aggregate expenditures curve will shift right. For example, the value of stock marketshares may rise and cause people to feel wealthier and spend more. A stock decline can cause a decline inconsumer spending.
8/3/2019 Week 4 Economics Graded Assignment
http://slidepdf.com/reader/full/week-4-economics-graded-assignment 10/14
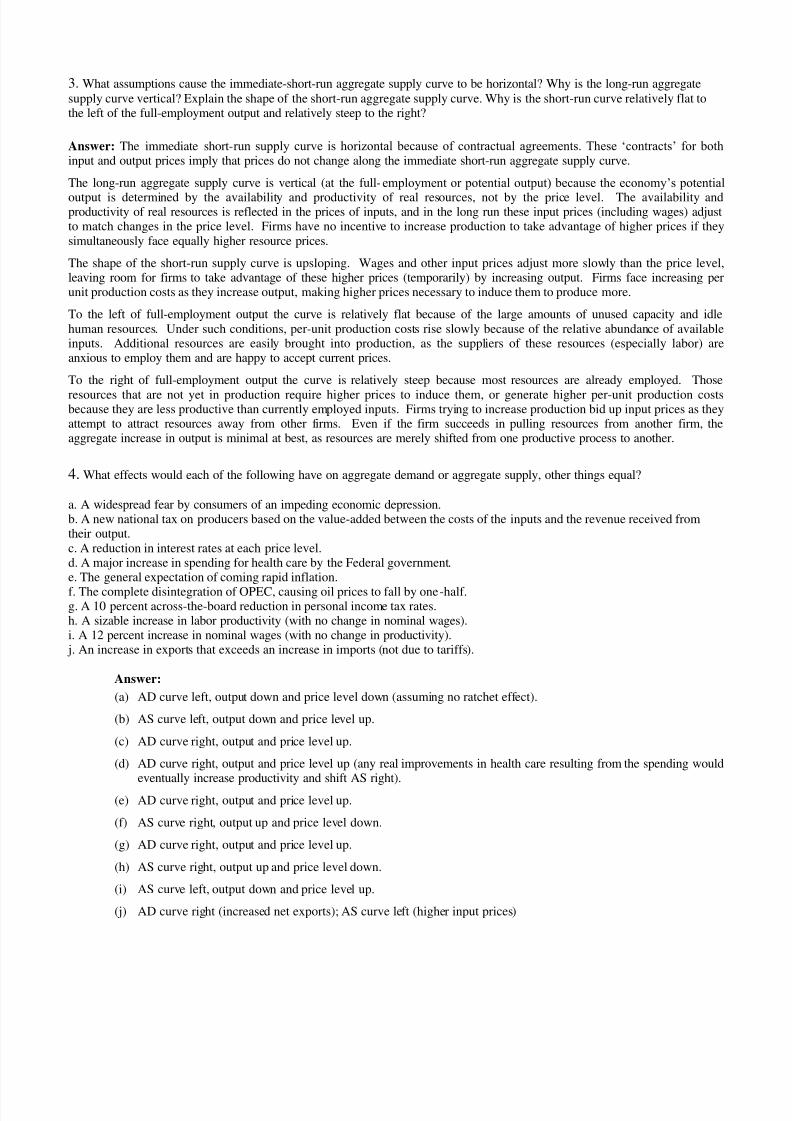
3. What assumptions cause the immediate-short-run aggregate supply curve to be horizontal? Why is the long-run aggregatesupply curve vertical? Explain the shape of the short-run aggregate supply curve. Why is the short-run curve relatively flat tothe left of the full-employment output and relatively steep to the right?
Answer: The immediate short-run supply curve is horizontal because of contractual agreements. These ‗contracts‘ for bothinput and output prices imply that prices do not change along the immediate short-run aggregate supply curve.
The long-run aggregate supply curve is vertical (at the full-employment or potential output) because the economy‘s potential
output is determined by the availability and productivity of real resources, not by the price level. The availability andproductivity of real resources is reflected in the prices of inputs, and in the long run these input prices (including wages) adjustto match changes in the price level. Firms have no incentive to increase production to take advantage of higher prices if theysimultaneously face equally higher resource prices.
The shape of the short-run supply curve is upsloping. Wages and other input prices adjust more slowly than the price level,leaving room for firms to take advantage of these higher prices (temporarily) by increasing output. Firms face increasing perunit production costs as they increase output, making higher prices necessary to induce them to produce more.
To the left of full-employment output the curve is relatively flat because of the large amounts of unused capacity and idlehuman resources. Under such conditions, per-unit production costs rise slowly because of the relative abundance of availableinputs. Additional resources are easily brought into production, as the suppliers of these resources (especially labor) areanxious to employ them and are happy to accept current prices.
To the right of full-employment output the curve is relatively steep because most resources are already employed. Those
resources that are not yet in production require higher prices to induce them, or generate higher per-unit production costsbecause they are less productive than currently employed inputs. Firms trying to increase production bid up input prices as theyattempt to attract resources away from other firms. Even if the firm succeeds in pulling resources from another firm, theaggregate increase in output is minimal at best, as resources are merely shifted from one productive process to another.
4. What effects would each of the following have on aggregate demand or aggregate supply, other things equal?
a. A widespread fear by consumers of an impeding economic depression.b. A new national tax on producers based on the value-added between the costs of the inputs and the revenue received fromtheir output.c. A reduction in interest rates at each price level.d. A major increase in spending for health care by the Federal government.e. The general expectation of coming rapid inflation.
f. The complete disintegration of OPEC, causing oil prices to fall by one-half.g. A 10 percent across-the-board reduction in personal income tax rates.h. A sizable increase in labor productivity (with no change in nominal wages).i. A 12 percent increase in nominal wages (with no change in productivity). j. An increase in exports that exceeds an increase in imports (not due to tariffs).
Answer:
(a) AD curve left, output down and price level down (assuming no ratchet effect).
(b) AS curve left, output down and price level up.
(c) AD curve right, output and price level up.
(d) AD curve right, output and price level up (any real improvements in health care resulting from the spending wouldeventually increase productivity and shift AS right).
(e) AD curve right, output and price level up.
(f) AS curve right, output up and price level down.
(g) AD curve right, output and price level up.
(h) AS curve right, output up and price level down.
(i) AS curve left, output down and price level up.
(j) AD curve right (increased net exports); AS curve left (higher input prices)
8/3/2019 Week 4 Economics Graded Assignment
http://slidepdf.com/reader/full/week-4-economics-graded-assignment 11/14
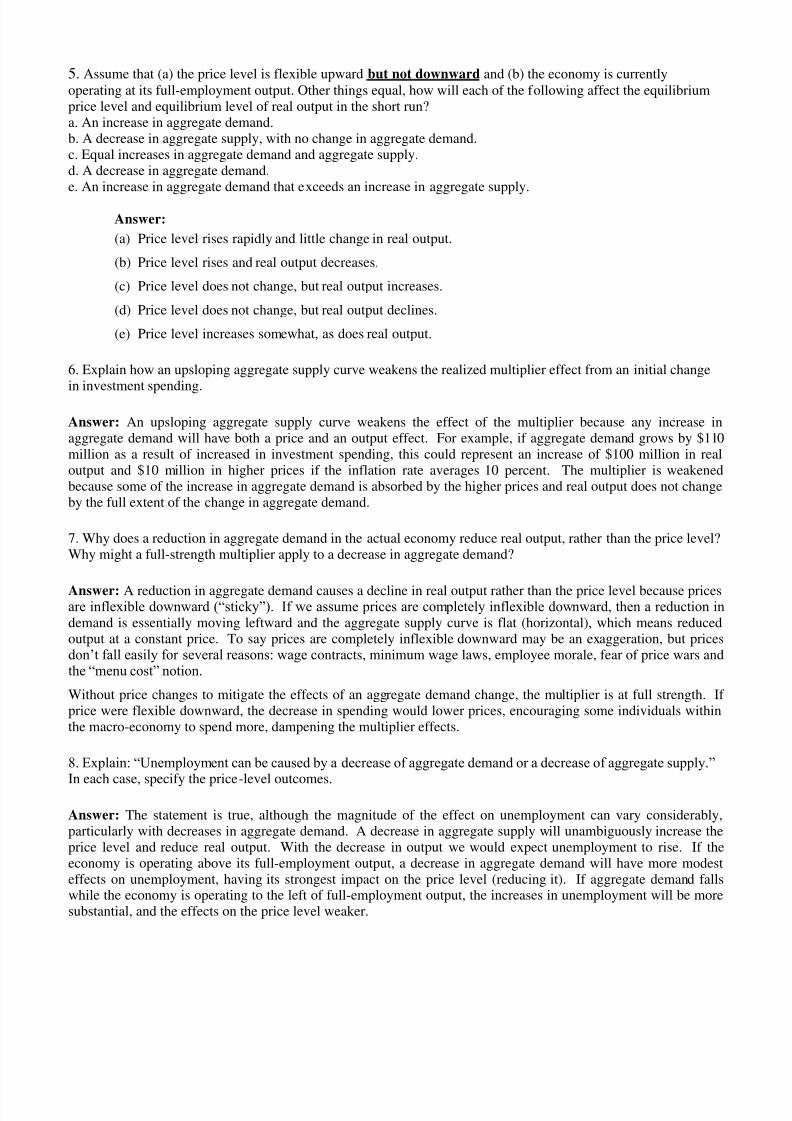
5. Assume that (a) the price level is flexible upward but not downward and (b) the economy is currentlyoperating at its full-employment output. Other things equal, how will each of the following affect the equilibriumprice level and equilibrium level of real output in the short run?a. An increase in aggregate demand.b. A decrease in aggregate supply, with no change in aggregate demand.c. Equal increases in aggregate demand and aggregate supply.d. A decrease in aggregate demand.e. An increase in aggregate demand that exceeds an increase in aggregate supply.
Answer:
(a) Price level rises rapidly and little change in real output.
(b) Price level rises and real output decreases.
(c) Price level does not change, but real output increases.
(d) Price level does not change, but real output declines.
(e) Price level increases somewhat, as does real output.
6. Explain how an upsloping aggregate supply curve weakens the realized multiplier effect from an initial change
in investment spending.
Answer: An upsloping aggregate supply curve weakens the effect of the multiplier because any increase inaggregate demand will have both a price and an output effect. For example, if aggregate demand grows by $110million as a result of increased in investment spending, this could represent an increase of $100 million in realoutput and $10 million in higher prices if the inflation rate averages 10 percent. The multiplier is weakenedbecause some of the increase in aggregate demand is absorbed by the higher prices and real output does not changeby the full extent of the change in aggregate demand.
7. Why does a reduction in aggregate demand in the actual economy reduce real output, rather than the price level?Why might a full-strength multiplier apply to a decrease in aggregate demand?
Answer: A reduction in aggregate demand causes a decline in real output rather than the price level because pricesare inflexible downward (―sticky‖). If we assume prices are completely inflexible downward, then a reduction indemand is essentially moving leftward and the aggregate supply curve is flat (horizontal), which means reducedoutput at a constant price. To say prices are completely inflexible downward may be an exaggeration, but pricesdon‘t fall easily for several reasons: wage contracts, minimum wage laws, employee morale, fear of price wars andthe ―menu cost‖ notion.
Without price changes to mitigate the effects of an aggregate demand change, the multiplier is at full strength. If price were flexible downward, the decrease in spending would lower prices, encouraging some individuals withinthe macro-economy to spend more, dampening the multiplier effects.
8. Explain: ―Unemployment can be caused by a decrease of aggregate demand or a decrease of aggregate supply.‖
In each case, specify the price-level outcomes.
Answer: The statement is true, although the magnitude of the effect on unemployment can vary considerably,particularly with decreases in aggregate demand. A decrease in aggregate supply will unambiguously increase theprice level and reduce real output. With the decrease in output we would expect unemployment to rise. If theeconomy is operating above its full-employment output, a decrease in aggregate demand will have more modesteffects on unemployment, having its strongest impact on the price level (reducing it). If aggregate demand fallswhile the economy is operating to the left of full-employment output, the increases in unemployment will be moresubstantial, and the effects on the price level weaker.
8/3/2019 Week 4 Economics Graded Assignment
http://slidepdf.com/reader/full/week-4-economics-graded-assignment 12/14
Chapter 29: Aggregate Demand and Aggregate Supply
PROBLEMS AND SOLUTIONS
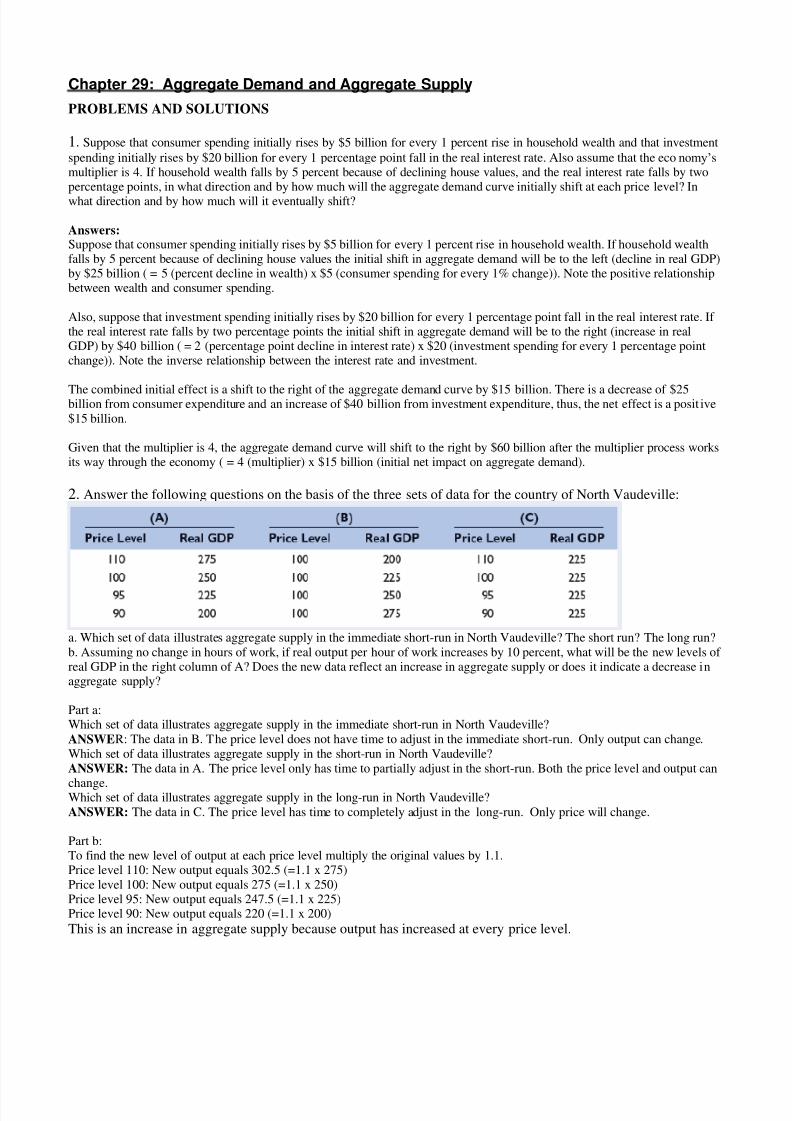
1. Suppose that consumer spending initially rises by $5 billion for every 1 percent rise in household wealth and that investmentspending initially rises by $20 billion for every 1 percentage point fall in the real interest rate. Also assume that the economy‘smultiplier is 4. If household wealth falls by 5 percent because of declining house values, and the real interest rate falls by twopercentage points, in what direction and by how much will the aggregate demand curve initially shift at each price level? Inwhat direction and by how much will it eventually shift?
Answers:Suppose that consumer spending initially rises by $5 billion for every 1 percent rise in household wealth. If household wealthfalls by 5 percent because of declining house values the initial shift in aggregate demand will be to the left (decline in real GDP)by $25 billion ( = 5 (percent decline in wealth) x $5 (consumer spending for every 1% change)). Note the positive relationshipbetween wealth and consumer spending.
Also, suppose that investment spending initially rises by $20 billion for every 1 percentage point fall in the real interest rate. If the real interest rate falls by two percentage points the initial shift in aggregate demand will be to the right (increase in realGDP) by $40 billion ( = 2 (percentage point decline in interest rate) x $20 (investment spending for every 1 percentage pointchange)). Note the inverse relationship between the interest rate and investment.
The combined initial effect is a shift to the right of the aggregate demand curve by $15 billion. There is a decrease of $25billion from consumer expenditure and an increase of $40 billion from investment expenditure, thus, the net effect is a posit ive$15 billion.
Given that the multiplier is 4, the aggregate demand curve will shift to the right by $60 billion after the multiplier process worksits way through the economy ( = 4 (multiplier) x $15 billion (initial net impact on aggregate demand).
2. Answer the following questions on the basis of the three sets of data for the country of North Vaudeville:
a. Which set of data illustrates aggregate supply in the immediate short-run in North Vaudeville? The short run? The long run?b. Assuming no change in hours of work, if real output per hour of work increases by 10 percent, what will be the new levels of real GDP in the right column of A? Does the new data reflect an increase in aggregate supply or does it indicate a decrease inaggregate supply?
Part a:Which set of data illustrates aggregate supply in the immediate short-run in North Vaudeville?ANSWER: The data in B. The price level does not have time to adjust in the immediate short-run. Only output can change.Which set of data illustrates aggregate supply in the short-run in North Vaudeville?ANSWER: The data in A. The price level only has time to partially adjust in the short-run. Both the price level and output can
change.Which set of data illustrates aggregate supply in the long-run in North Vaudeville?ANSWER: The data in C. The price level has time to completely adjust in the long-run. Only price will change.
Part b:To find the new level of output at each price level multiply the original values by 1.1.Price level 110: New output equals 302.5 (=1.1 x 275)Price level 100: New output equals 275 (=1.1 x 250)Price level 95: New output equals 247.5 (=1.1 x 225)Price level 90: New output equals 220 (=1.1 x 200)
This is an increase in aggregate supply because output has increased at every price level.

8/3/2019 Week 4 Economics Graded Assignment
http://slidepdf.com/reader/full/week-4-economics-graded-assignment 13/14
3. If the aggregate demand and aggregate supply schedules for a hypothetical economy are as shown below:
a. Use these sets of data to graph the aggregate demand and aggregate supply curves. What is the equilibrium price level and theequilibrium level of real output in this hypothetical economy? Is the equilibrium real output also necessarily the full-employment real output?b. If the price level in this economy is 150, will quantity demanded equal, exceed, or fall short of quantity supplied? By whatamount? If the price level is 250, will quantity demanded equal, exceed, or fall short of quantity supplied? By what amount?c. Suppose that buyers desire to purchase $200 billion of extra real output at each price level. Sketch in the new aggregatedemand curve as AD1. What is the new equilibrium price level and level of real output?
Answer:(a) See the graph. Equilibrium price level = 200, which occurs where aggregate supply equals aggregate demand, Thus the
equilibrium real output = $300 billion. No, the full-capacity level of GDP cannot be determined without more information.
(b) At a price level of 150, real GDP supplied is a maximum of $200 billion, less than the real GDP demanded of $400 billion.Thus, quantity demanded exceeds the quantity supplied by $200 billion. At a price level of 250, real GDP supplied is $400billion, which is more than the real GDP demanded of $200 billion. Thus, quantity demanded falls short of the quantitysupplied by $200 billion.
(c) See the graph from part a. Increases in consumer, investment, government, or net export spending might shift the AD curverightward. The new values for the aggregate demand schedule are:
Amount of Real GDP Demanded,
Billions
Price Level
(Price Index)
Amount of Real GDP Supplied,
Billions
$300 (=$100 + $200) 300 $450
$400 (=$200 + $200) 250 400
$500 (=$300 + $200) 200 300
$600 (=$400 + $200) 150 200
$700 (=$500 + $200) 100 100
The new equilibrium price level = 250 where aggregate supply equals aggregate demand. The new equilibrium GDP = $400billion.
8/3/2019 Week 4 Economics Graded Assignment
http://slidepdf.com/reader/full/week-4-economics-graded-assignment 14/14
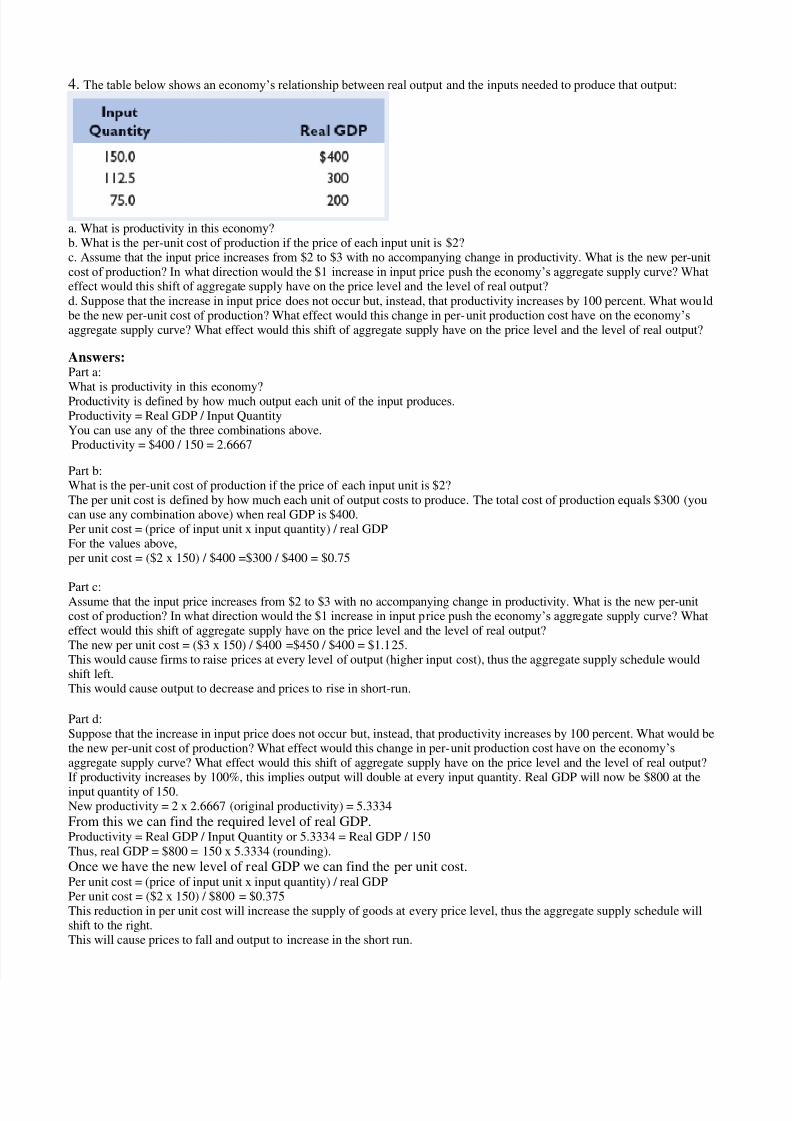
4. The table below shows an economy‘s relationship between real output and the inputs needed to produce that output:
a. What is productivity in this economy?b. What is the per-unit cost of production if the price of each input unit is $2?c. Assume that the input price increases from $2 to $3 with no accompanying change in productivity. What is the new per-unitcost of production? In what direction would the $1 increase in input price push the economy‘s aggregate supply curve? Whateffect would this shift of aggregate supply have on the price level and the level of real output?d. Suppose that the increase in input price does not occur but, instead, that productivity increases by 100 percent. What wouldbe the new per-unit cost of production? What effect would this change in per-unit production cost have on the economy‘saggregate supply curve? What effect would this shift of aggregate supply have on the price level and the level of real output?
Answers:Part a:
What is productivity in this economy?Productivity is defined by how much output each unit of the input produces.Productivity = Real GDP / Input QuantityYou can use any of the three combinations above.Productivity = $400 / 150 = 2.6667
Part b:What is the per-unit cost of production if the price of each input unit is $2?The per unit cost is defined by how much each unit of output costs to produce. The total cost of production equals $300 (youcan use any combination above) when real GDP is $400.Per unit cost = (price of input unit x input quantity) / real GDPFor the values above,per unit cost = ($2 x 150) / $400 =$300 / $400 = $0.75
Part c:Assume that the input price increases from $2 to $3 with no accompanying change in productivity. What is the new per-unitcost of production? In what direction would the $1 increase in input price push the economy‘s aggregate supply curve? Whateffect would this shift of aggregate supply have on the price level and the level of real output?The new per unit cost = ($3 x 150) / $400 =$450 / $400 = $1.125.This would cause firms to raise prices at every level of output (higher input cost), thus the aggregate supply schedule wouldshift left.This would cause output to decrease and prices to rise in short-run.
Part d:Suppose that the increase in input price does not occur but, instead, that productivity increases by 100 percent. What would bethe new per-unit cost of production? What effect would this change in per-unit production cost have on the economy‘saggregate supply curve? What effect would this shift of aggregate supply have on the price level and the level of real output?If productivity increases by 100%, this implies output will double at every input quantity. Real GDP will now be $800 at theinput quantity of 150.New productivity = 2 x 2.6667 (original productivity) = 5.3334
From this we can find the required level of real GDP.Productivity = Real GDP / Input Quantity or 5.3334 = Real GDP / 150Thus, real GDP = $800 = 150 x 5.3334 (rounding).
Once we have the new level of real GDP we can find the per unit cost.Per unit cost = (price of input unit x input quantity) / real GDPPer unit cost = ($2 x 150) / $800 = $0.375This reduction in per unit cost will increase the supply of goods at every price level, thus the aggregate supply schedule willshift to the right.This will cause prices to fall and output to increase in the short run.