week10 for holiday - rofantasyhomework.rofantasy.com/system_analysis/week10.pdf · document a...
TRANSCRIPT

1
Process Modeling
Based on Chapter 9 of Whitten, Bentley, andDittman:Systems Analysis and Design for the GlobalEnterprise (7th Ed). McGraw Hill. 2007
Wei-Tsong WangIIM, NCKU
2
3
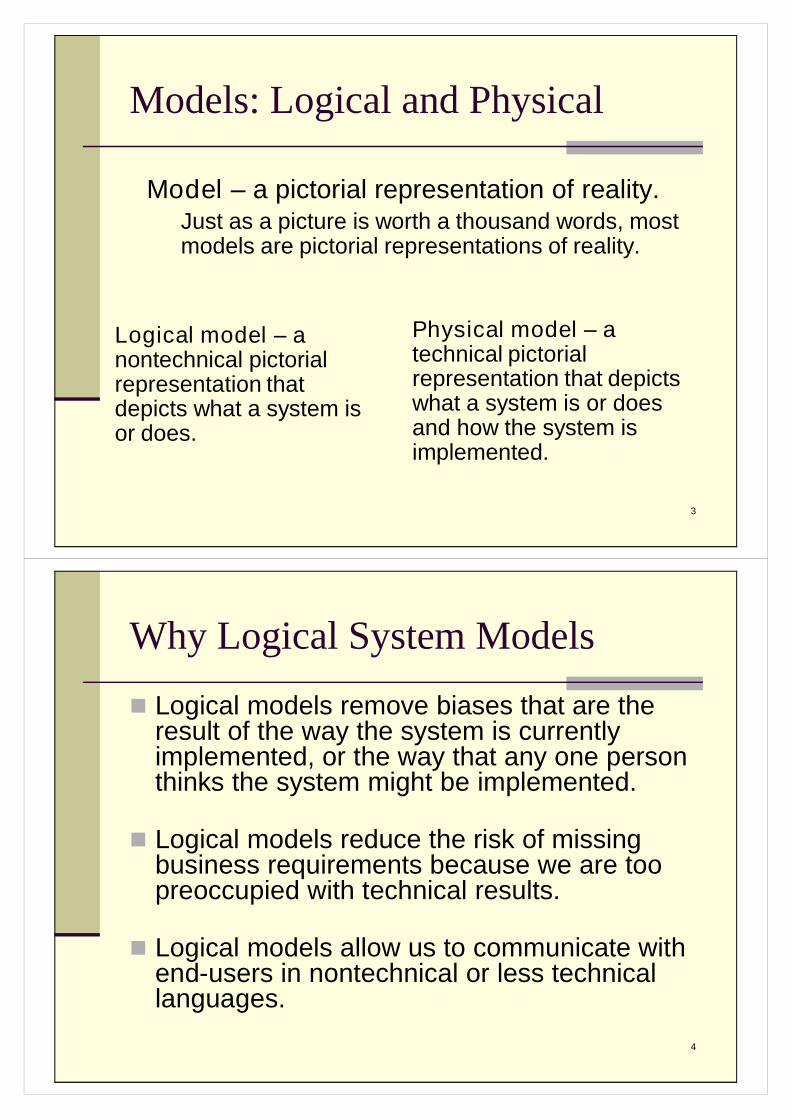
Models: Logical and Physical
Logical model –anontechnical pictorialrepresentation thatdepicts what a system isor does.
Physical model –atechnical pictorialrepresentation that depictswhat a system is or doesand how the system isimplemented.
Model –a pictorial representation of reality.Just as a picture is worth a thousand words, mostmodels are pictorial representations of reality.
4
Why Logical System Models
Logical models remove biases that are theresult of the way the system is currentlyimplemented, or the way that any one personthinks the system might be implemented.
Logical models reduce the risk of missingbusiness requirements because we are toopreoccupied with technical results.
Logical models allow us to communicate withend-users in nontechnical or less technicallanguages.
5
Process Modeling and DFDs
Process modeling –a technique used to organize anddocument a system’s processes.
Flow of data through processes LogicPoliciesProcedures
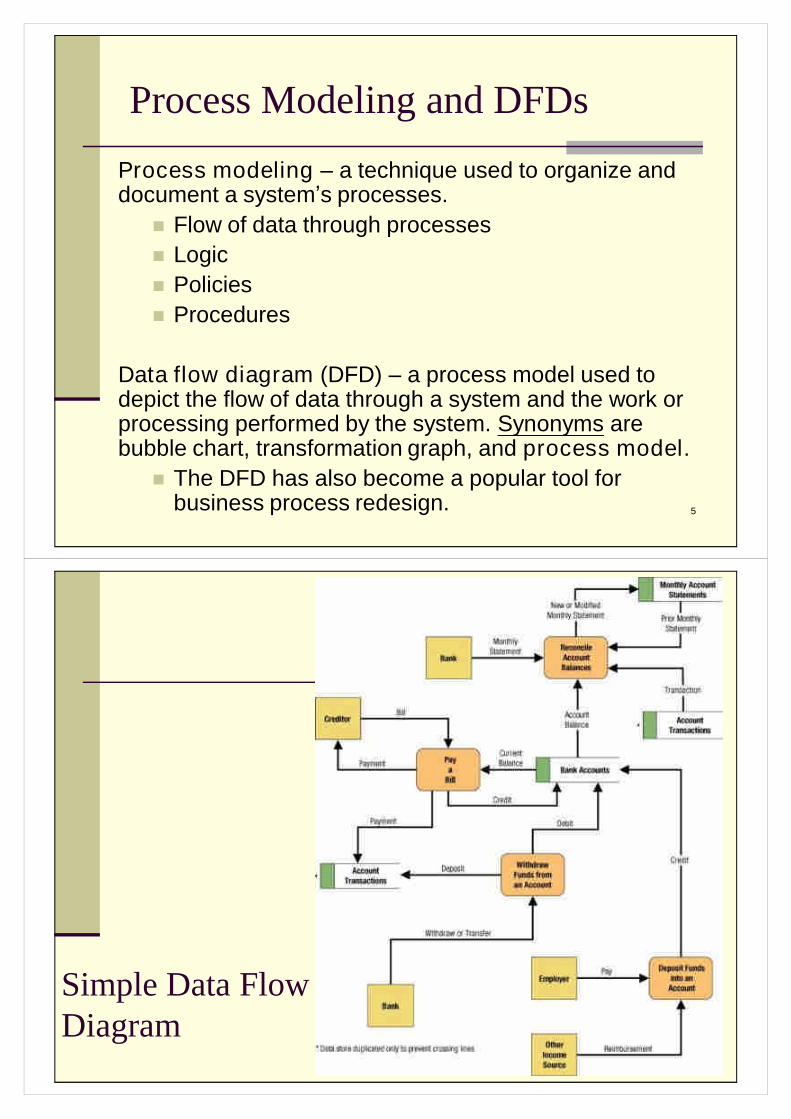
Data flow diagram (DFD) –a process model used todepict the flow of data through a system and the work orprocessing performed by the system. Synonyms arebubble chart, transformation graph, and process model.
The DFD has also become a popular tool forbusiness process redesign.
6
Simple Data FlowDiagram
7
Differences Between DFDsand FlowchartsProcesses on DFDs can operate in parallel
(at-the-same-time)Processes on flowcharts execute one at a time
DFDs show the flow of data through a system Flowcharts show the flow of control (sequence
and transfer of control)
Processes on a DFD can have dramaticallydifferent timing (daily, weekly, on demand)Processes on flowcharts are part of a single
program with consistent timing
8
Symbols in DFDs
Many set of symbols are used in theindustry
Generally, there are three commonlyused symbols as follows:External AgentsData StoresProcesses
There is one connection as below:Data Flows
9
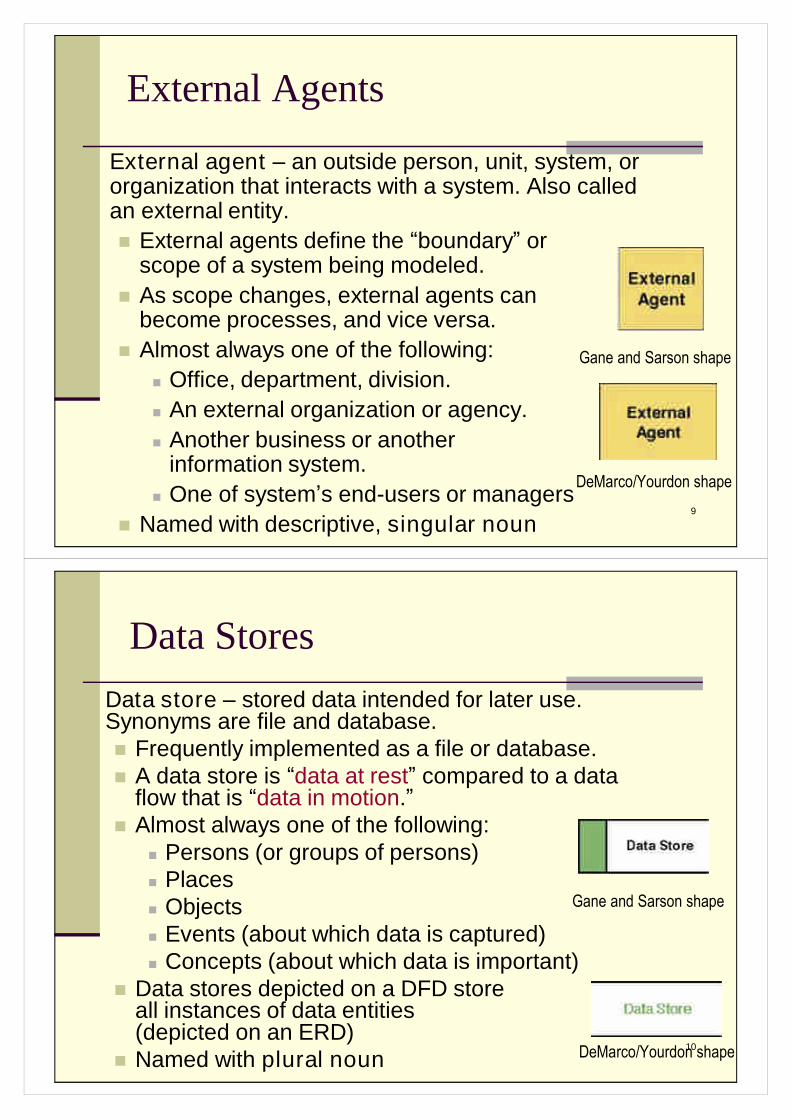
External Agents
External agent –an outside person, unit, system, ororganization that interacts with a system. Also calledan external entity.External agents define the “boundary”or
scope of a system being modeled.As scope changes, external agents can
become processes, and vice versa.Almost always one of the following:
Office, department, division. An external organization or agency. Another business or another
information system. One of system’s end-users or managers
Named with descriptive, singular noun
Gane and Sarson shape
DeMarco/Yourdon shape
10
Data StoresData store –stored data intended for later use.Synonyms are file and database.Frequently implemented as a file or database.A data store is “data at rest”compared to a data
flow that is “data in motion.”Almost always one of the following:
Persons (or groups of persons) Places Objects Events (about which data is captured) Concepts (about which data is important)
Data stores depicted on a DFD storeall instances of data entities(depicted on an ERD)
Named with plural noun
Gane and Sarson shape
DeMarco/Yourdon shape
11
Process Concepts
Process –work performed by a system inresponse to incoming data flows or conditions. Asynonym is transform.
All information systems includeprocesses - usually many of them
Processes respond to businessevents and conditions and transformdata into useful information
Modeling processes helps us to understand theinteractions with the system's environment, othersystems, and other processes.
Named with a strong action verb followed by objectclause describing what the work is performed on/for .
Gane and Sarson shape
12
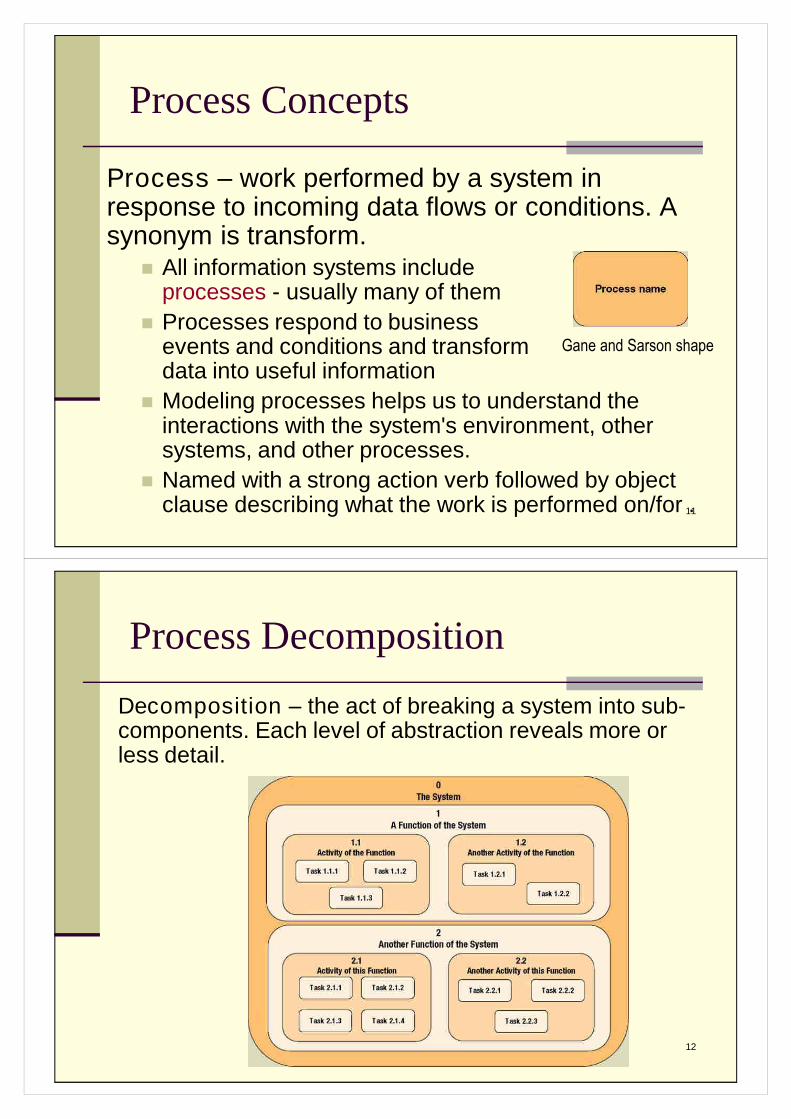
Process Decomposition
Decomposition –the act of breaking a system into sub-components. Each level of abstraction reveals more orless detail.
13
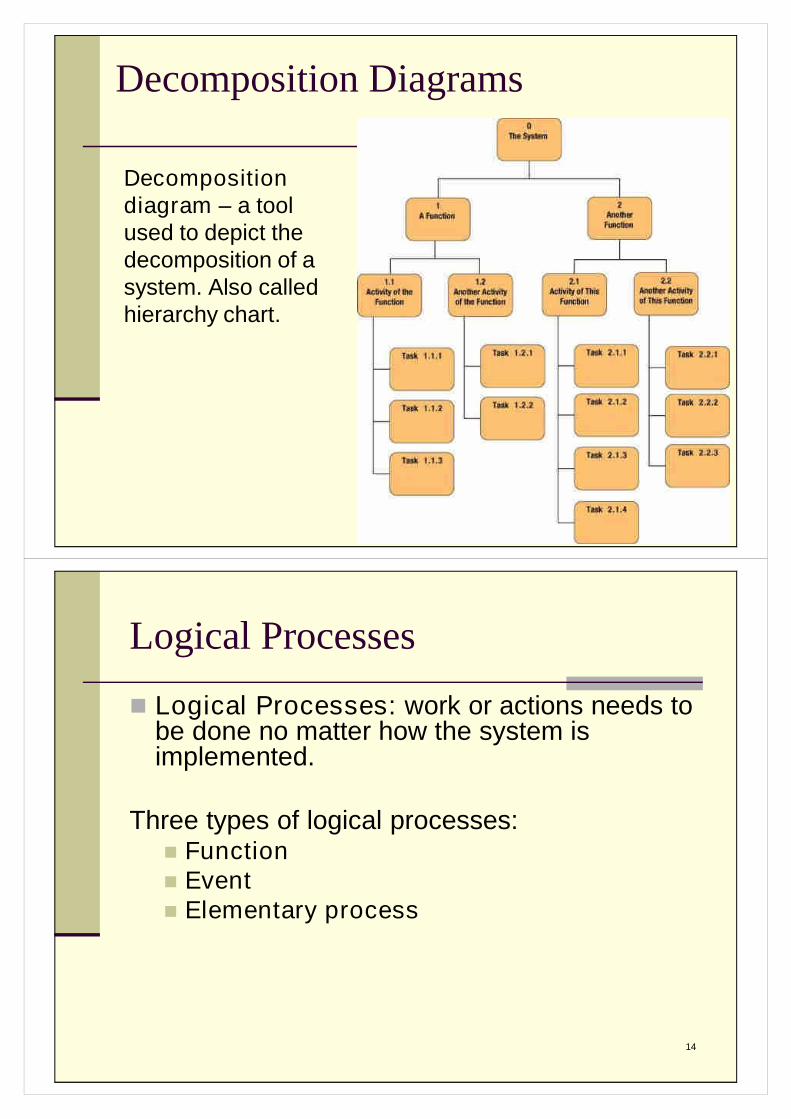
Decomposition Diagrams
Decompositiondiagram –a toolused to depict thedecomposition of asystem. Also calledhierarchy chart.
14
Logical Processes
Logical Processes: work or actions needs tobe done no matter how the system isimplemented.
Three types of logical processes:FunctionEventElementary process
15
Types of Logical Processes
Function –a set of related and ongoing activities of abusiness. A function has no start or end.
Event –a logical unit of work that must be completedas a whole. Sometimes called a transaction. Triggered by a discrete input and is completed
when process has responded with appropriateoutputs.
Functions consist of processes that respond toevents.
Elementary process –a discrete, detailed activity ortask required to complete the response to an event.Also called a primitive process. The lowest level of detail depicted in a process
model.
16
Data flow –data that is input to oroutput from a process.A data flow is data in motionA data flow may also be used to
represent the creation, reading,deletion, or updating of data in afile or database (called a datastore).
Composite data flow –a data flowthat consists of other data flows.Control flow –a condition ornondata event (e.g. time) that triggersa process.Used sparingly on DFDs.
Data Flows & Control Flows
Data flow name
Control flow name
17
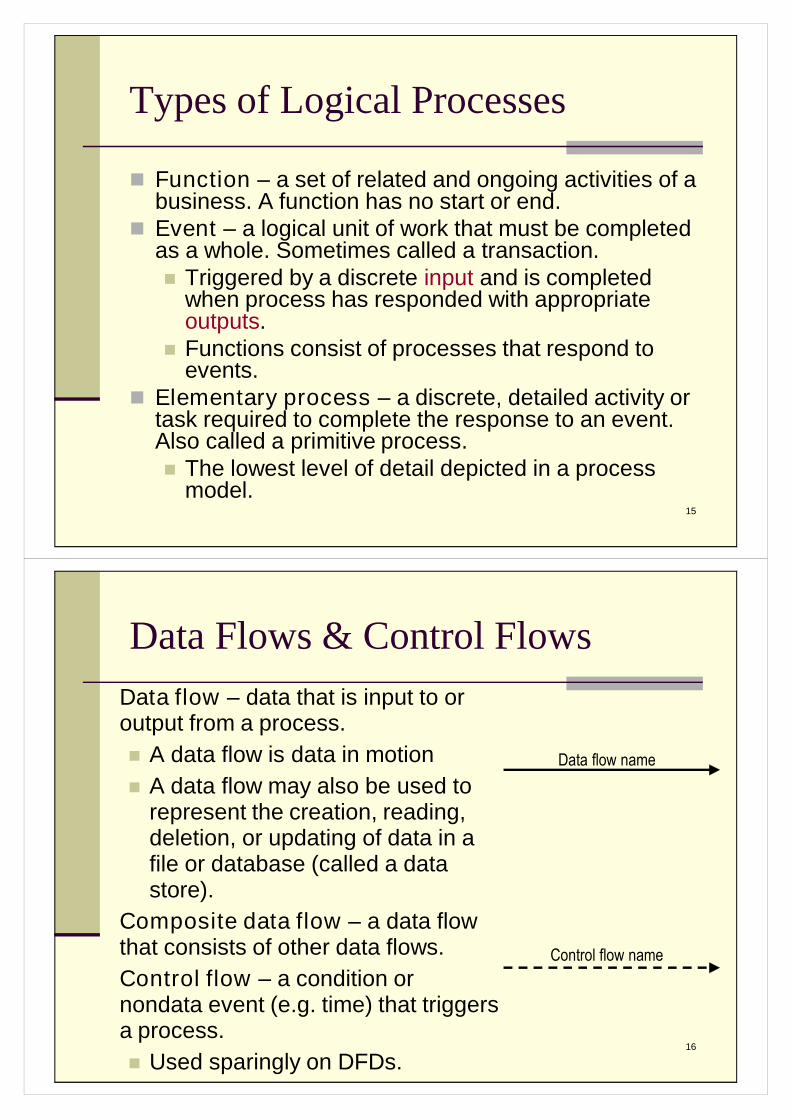
Data Flow Packet Concept
Data that should travel together should be shown asa single data flow, no matter how many physicaldocuments might be included.
18
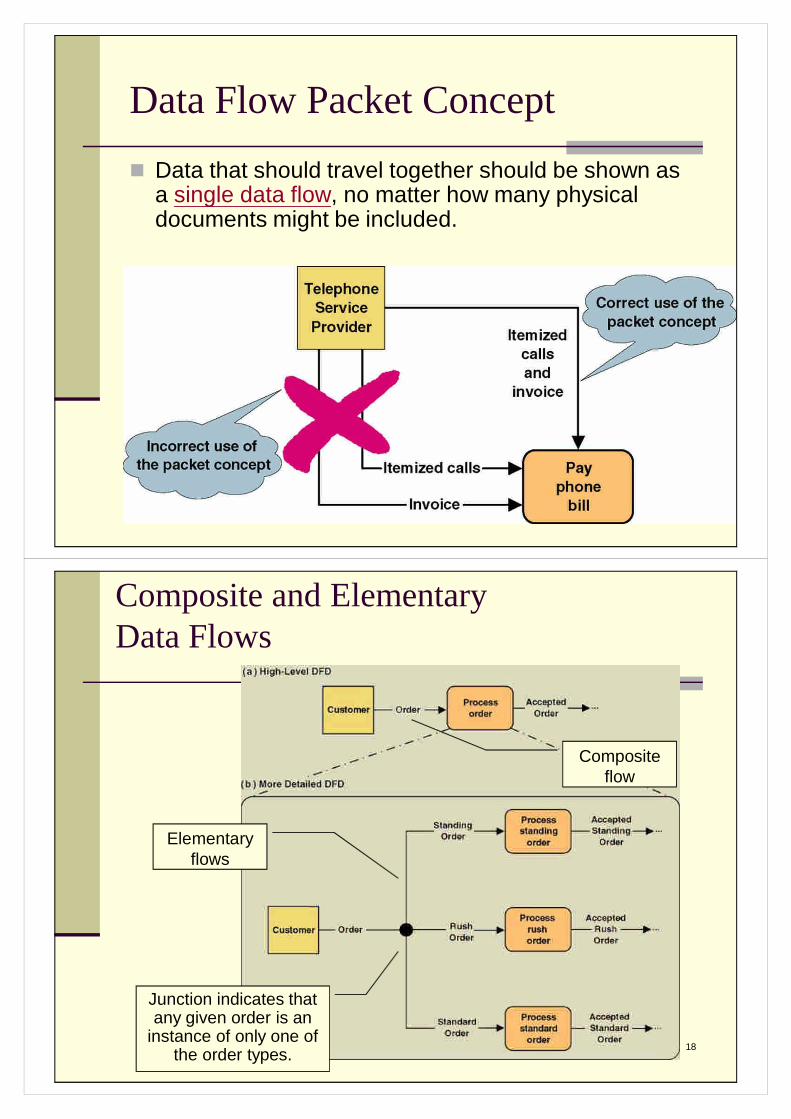
Composite and ElementaryData Flows
Junction indicates thatany given order is an
instance of only one ofthe order types.
Elementaryflows
Compositeflow
19
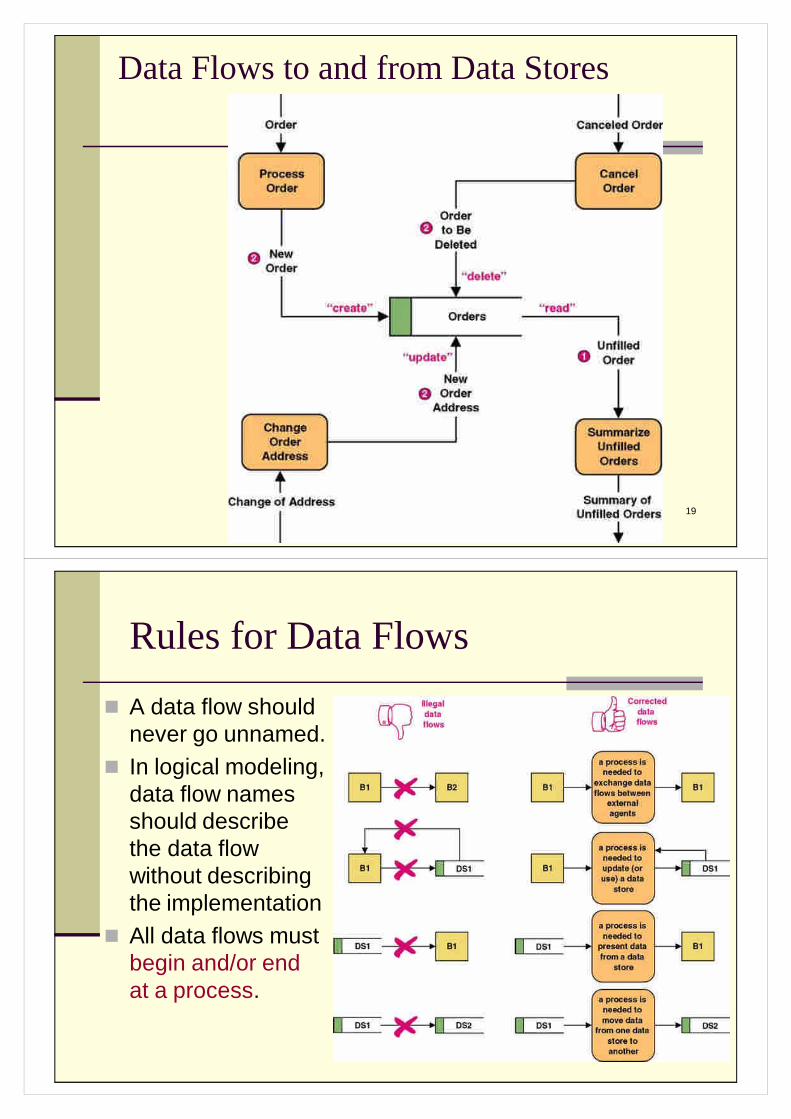
Data Flows to and from Data Stores
20
Rules for Data Flows
A data flow shouldnever go unnamed.
In logical modeling,data flow namesshould describethe data flowwithout describingthe implementation
All data flows mustbegin and/or endat a process.
21
Data Structures
The data attributes that comprise a data flow areorganized into data structures.
Data flows can be described in terms of the followingtypes of data structures:A sequence or group of data attributes that occur
one after another (e.g. Address).The selection of one or more attributes from a set
of attributes.The repetition of one or more attributes.
Data attribute –the smallest piece of data thathas meaning to the users and the business.
Data structure –a specific arrangement of dataattributes that defines an instance of a data flow.
22
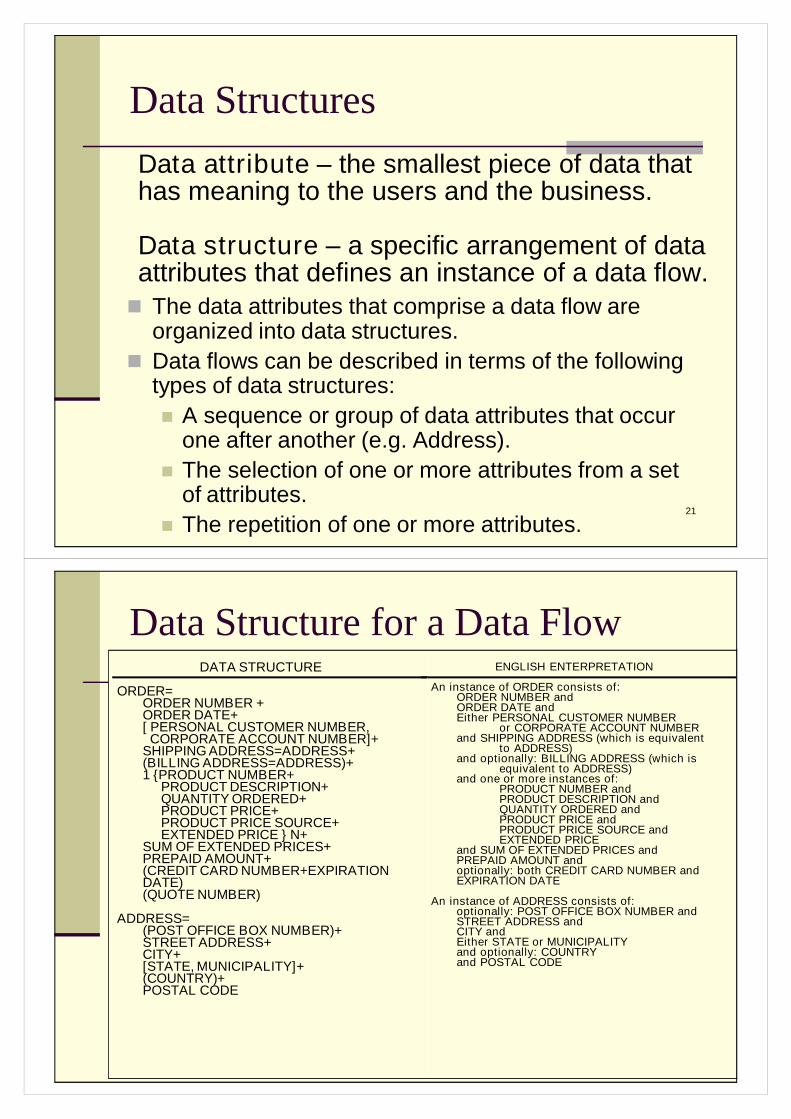
Data Structure for a Data FlowDATA STRUCTURE
ORDER=ORDER NUMBER +ORDER DATE+[ PERSONAL CUSTOMER NUMBER,CORPORATE ACCOUNT NUMBER]+
SHIPPING ADDRESS=ADDRESS+(BILLING ADDRESS=ADDRESS)+1 {PRODUCT NUMBER+
PRODUCT DESCRIPTION+QUANTITY ORDERED+PRODUCT PRICE+PRODUCT PRICE SOURCE+EXTENDED PRICE } N+
SUM OF EXTENDED PRICES+PREPAID AMOUNT+(CREDIT CARD NUMBER+EXPIRATIONDATE)(QUOTE NUMBER)
ADDRESS=(POST OFFICE BOX NUMBER)+STREET ADDRESS+CITY+[STATE, MUNICIPALITY]+(COUNTRY)+POSTAL CODE
ENGLISH ENTERPRETATION
An instance of ORDER consists of:ORDER NUMBER andORDER DATE andEither PERSONAL CUSTOMER NUMBER
or CORPORATE ACCOUNT NUMBERand SHIPPING ADDRESS (which is equivalent
to ADDRESS)and optionally: BILLING ADDRESS (which is
equivalent to ADDRESS)and one or more instances of:
PRODUCT NUMBER andPRODUCT DESCRIPTION andQUANTITY ORDERED andPRODUCT PRICE andPRODUCT PRICE SOURCE andEXTENDED PRICE
and SUM OF EXTENDED PRICES andPREPAID AMOUNT andoptionally: both CREDIT CARD NUMBER andEXPIRATION DATE
An instance of ADDRESS consists of:optionally: POST OFFICE BOX NUMBER andSTREET ADDRESS andCITY andEither STATE or MUNICIPALITYand optionally: COUNTRYand POSTAL CODE
23
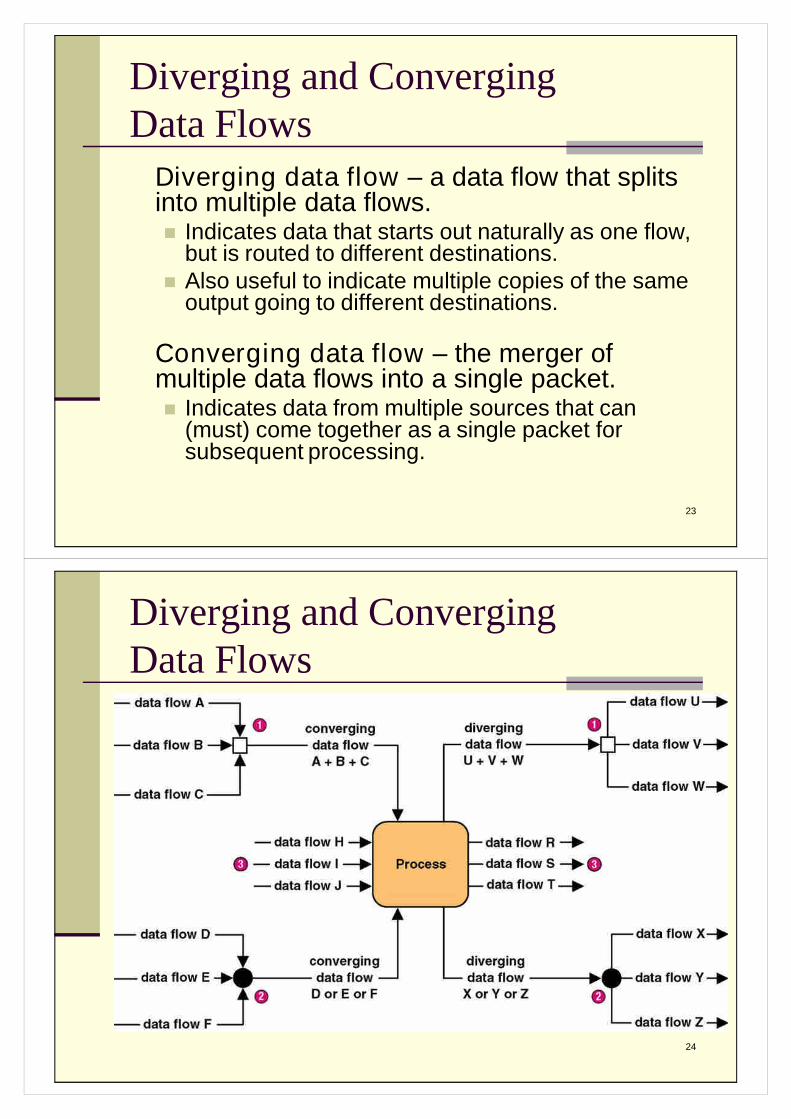
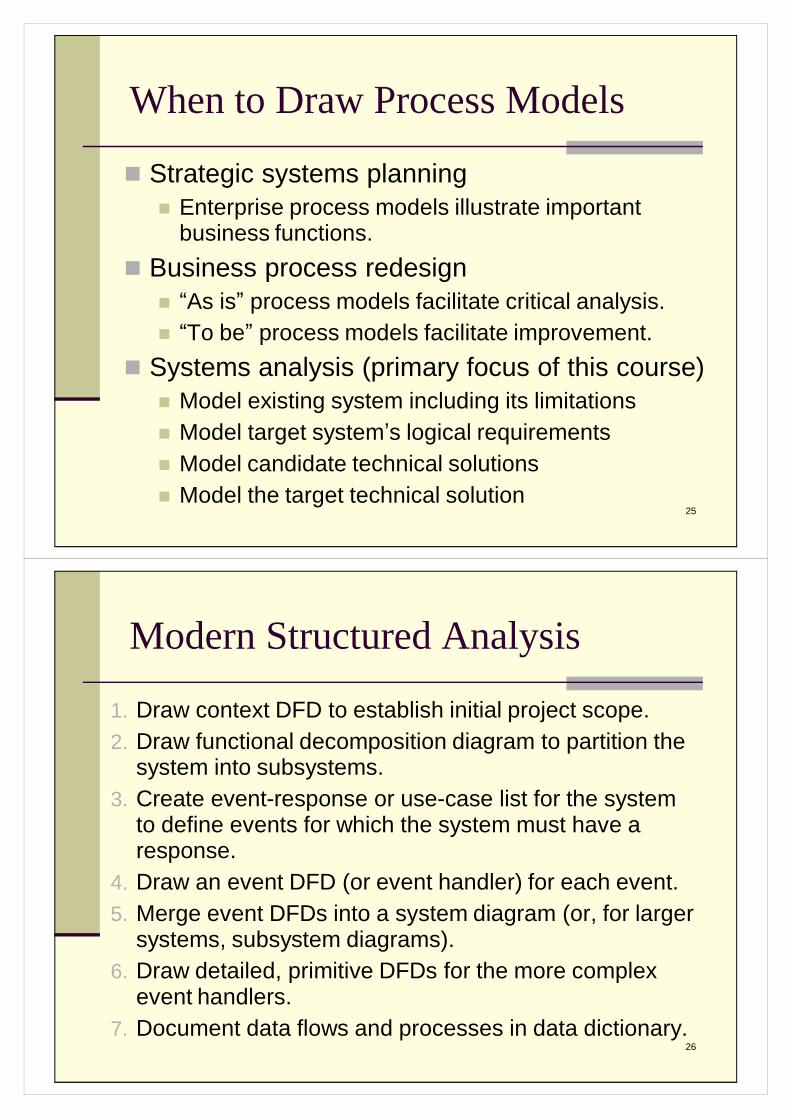
Diverging and ConvergingData Flows
Diverging data flow –a data flow that splitsinto multiple data flows. Indicates data that starts out naturally as one flow,
but is routed to different destinations.Also useful to indicate multiple copies of the same
output going to different destinations.
Converging data flow –the merger ofmultiple data flows into a single packet. Indicates data from multiple sources that can
(must) come together as a single packet forsubsequent processing.
24
Diverging and ConvergingData Flows
25
When to Draw Process Models
Strategic systems planningEnterprise process models illustrate important
business functions.
Business process redesign“As is”process models facilitate critical analysis.“To be”process models facilitate improvement.
Systems analysis (primary focus of this course)Model existing system including its limitationsModel target system’s logical requirementsModel candidate technical solutionsModel the target technical solution
26
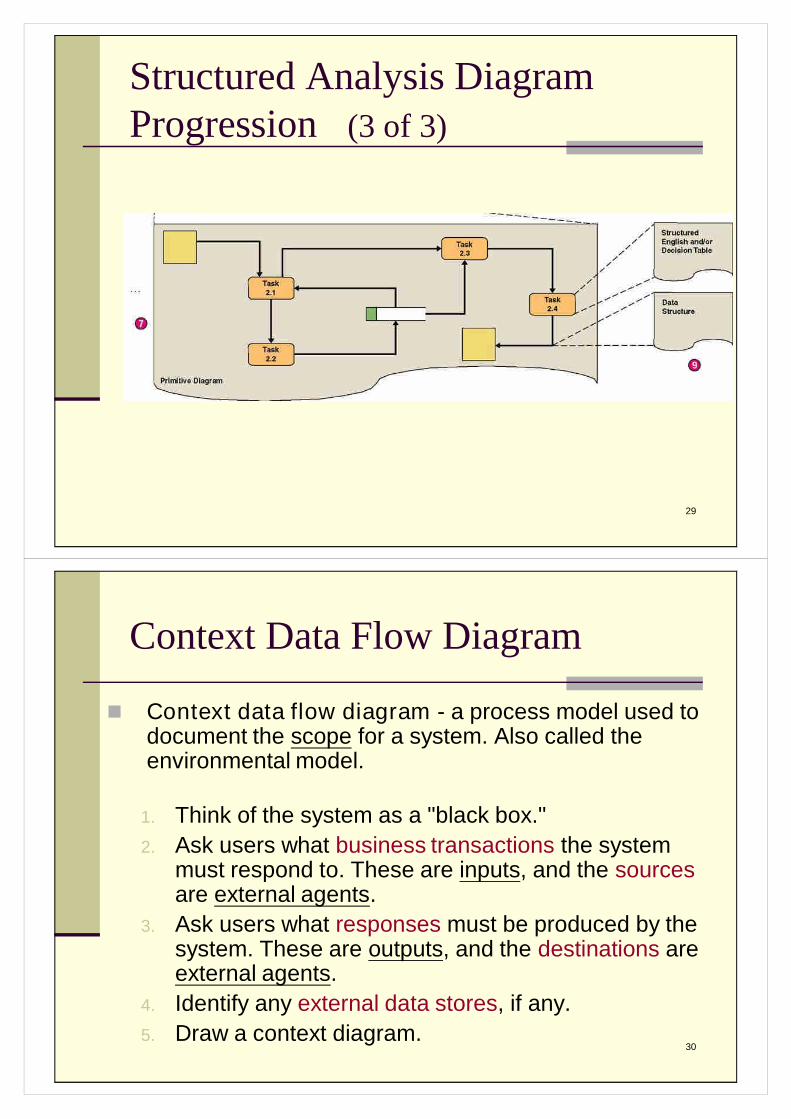
Modern Structured Analysis
1. Draw context DFD to establish initial project scope.2. Draw functional decomposition diagram to partition the
system into subsystems.3. Create event-response or use-case list for the system
to define events for which the system must have aresponse.
4. Draw an event DFD (or event handler) for each event.5. Merge event DFDs into a system diagram (or, for larger
systems, subsystem diagrams).6. Draw detailed, primitive DFDs for the more complex
event handlers.7. Document data flows and processes in data dictionary.

27
Structured Analysis DiagramProgression (1 of 3)
28
Structured Analysis DiagramProgression (2 of 3)
29
Structured Analysis DiagramProgression (3 of 3)
30
Context Data Flow Diagram
Context data flow diagram - a process model used todocument the scope for a system. Also called theenvironmental model.
1. Think of the system as a "black box."2. Ask users what business transactions the system
must respond to. These are inputs, and the sourcesare external agents.
3. Ask users what responses must be produced by thesystem. These are outputs, and the destinations areexternal agents.
4. Identify any external data stores, if any.5. Draw a context diagram.
31
Events and Use Cases
External events are initiated by external agents. Theyresult in an input transaction or data flow.
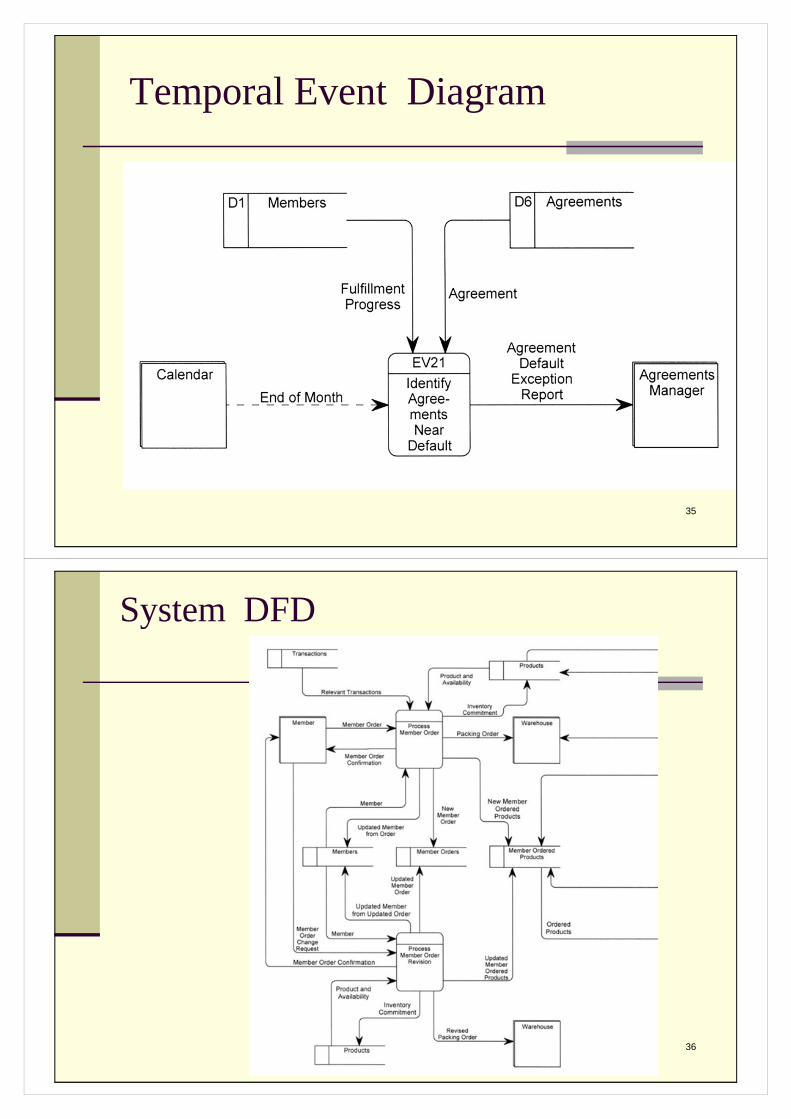
Temporal events are triggered on the basis of time, orsomething that merely happens. They are indicated by acontrol flow.
State events trigger processes based on a system’schange from one state or condition to another. They areindicated by a control flow.
Use case –an analysis tool for finding and identifyingbusiness events and responses.
Actor –anything that interacts with a system.
32
Event Diagrams
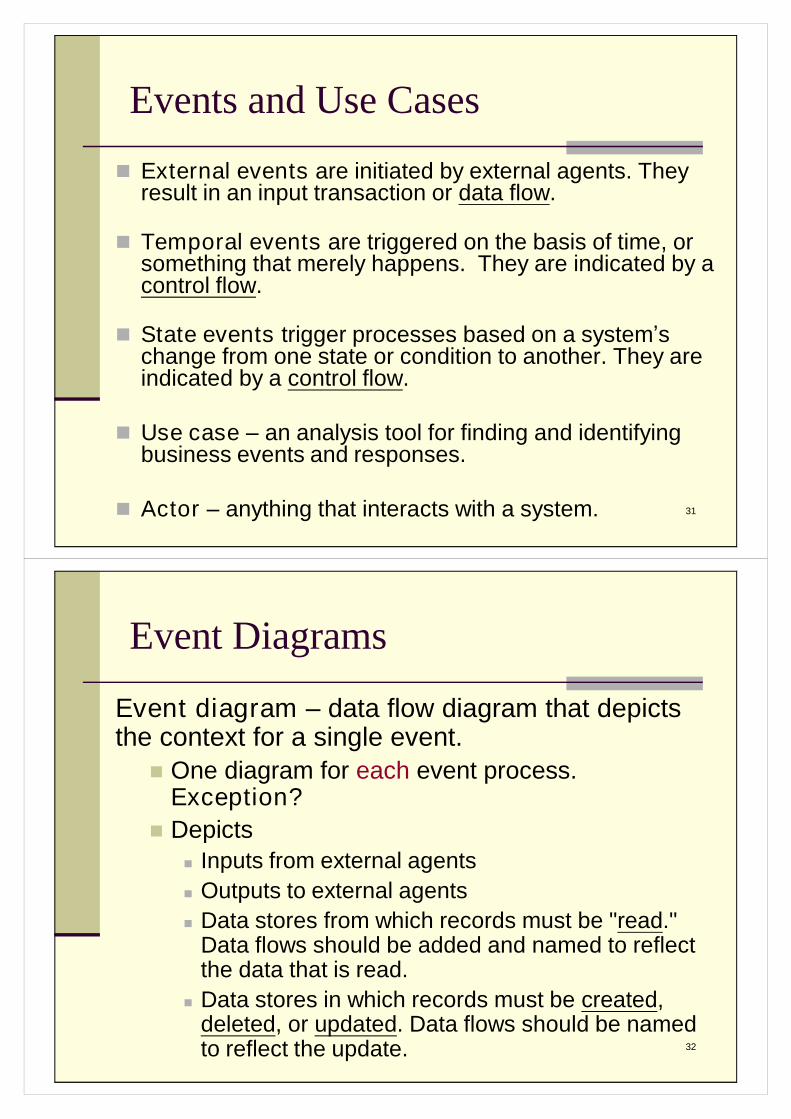
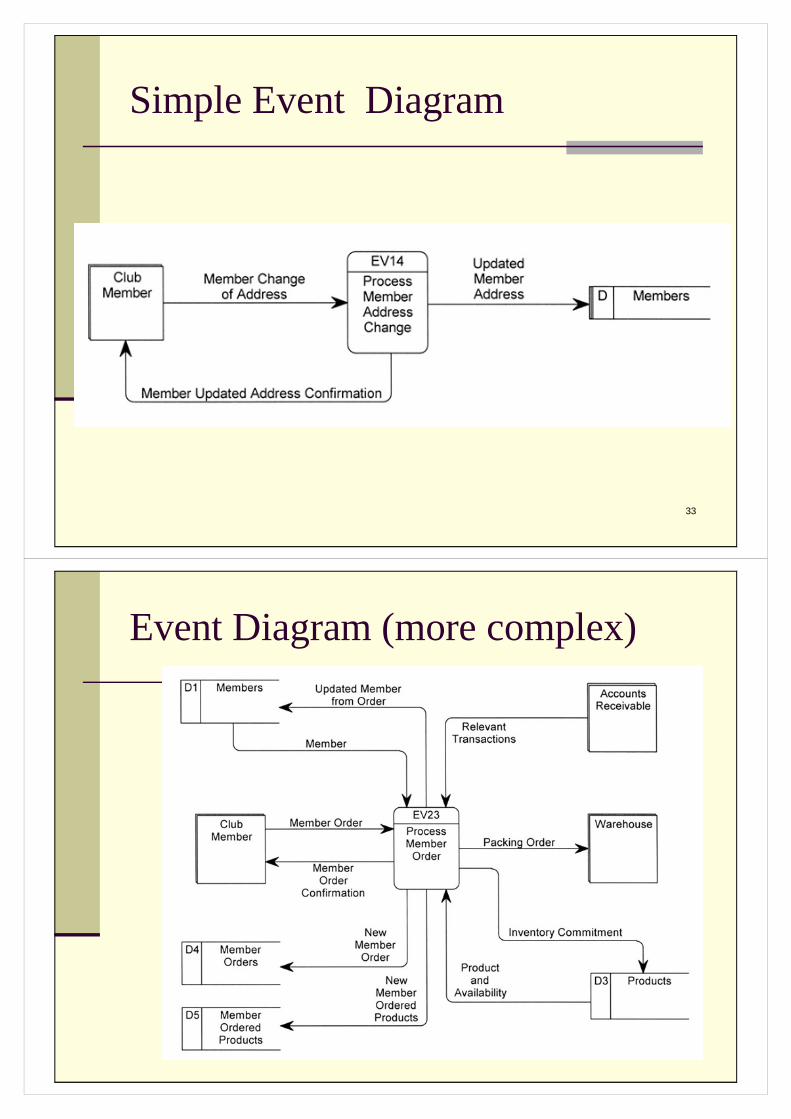
Event diagram –data flow diagram that depictsthe context for a single event.
One diagram for each event process.Exception?
Depicts Inputs from external agents Outputs to external agents Data stores from which records must be "read."
Data flows should be added and named to reflectthe data that is read.
Data stores in which records must be created,deleted, or updated. Data flows should be namedto reflect the update.
33
Simple Event Diagram
34
Event Diagram (more complex)
35
Temporal Event Diagram
36
System DFD
37
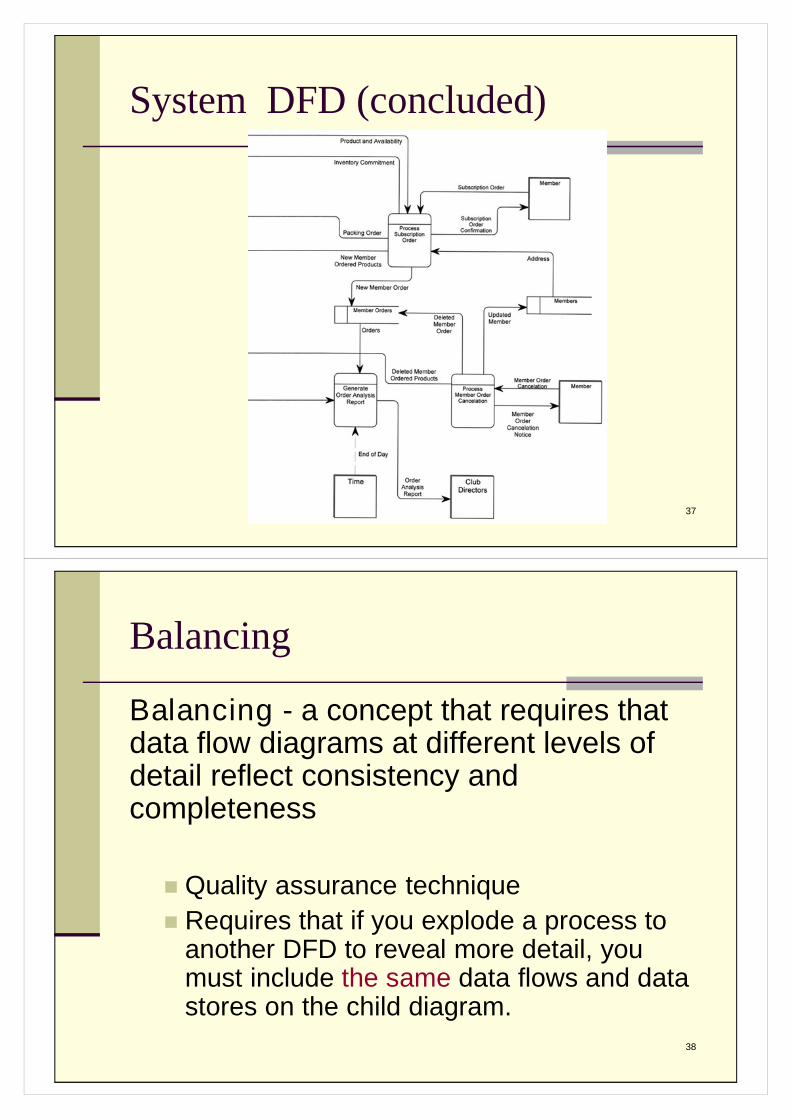
System DFD (concluded)
38
Balancing
Balancing - a concept that requires thatdata flow diagrams at different levels ofdetail reflect consistency andcompleteness
Quality assurance techniqueRequires that if you explode a process to
another DFD to reveal more detail, youmust include the same data flows and datastores on the child diagram.

39
Process Logic
Data Flow Diagrams good for identifying anddescribing processes
Not good at showing logic inside processesNeed to specify detailed instructions for
elementary processes
40
Data & Process Model SynchronizationCRUD Matrix

41
Process Distribution