weekly flow report mf study
TRANSCRIPT
8/8/2019 Weekly Flow Report MF Study
http://slidepdf.com/reader/full/weekly-flow-report-mf-study 1/23
Copyright © 2010 TrimTabs Investment Research. All rights reserved.
WEEKLY FLOW R EPORT
CHARLES BIDERMAN
C HIEF E XECUTIVE OFFICER
VINCENT DELUARD
JERRY VIGIL
AUGUST 18, 201
VOLUME 3, NUMBER 3
+1 (415) 331-440
When Will Joe and Jane Six-Pack Return?
TrimTabs Demand Index Closes at Four-Month HighThe hate retail investors have for U.S. equities runs deep. U.S. equity mutual funds posted an outflow in 42 of the past 5weeks even though the S&P 500 returned 9.8% in the past year. These outflows do not owe to a secular shift away froequities, as global equity mutual funds posted an inflow of $44 billion in the same period. Also, ETF investors are ditchiU.S. stocks to buy emerging markets equities and (to a lesser extent) gold and commodities.
We believe Joe and Jane six-pack are disgusted with the stock market for two reasons. First, beefy rallies, robust profits, anrecord cash stashes on Wall Street stand in sharp contrast to foreclosures, declining incomes, and job losses on Main StreeSecond, retail investors are increasingly convinced that the stock market has morphed into a casino designed to transfassets away from them and toward high-frequency traders, hedge funds, and bank trading desks.
If policymakers want to bring retail investors back into the fold, they should focus on creating jobs rather than inflating ass prices. They should also increase transparency so that retail investors do not fear their nest eggs will evaporate at the hanof flash crashes and Ponzi schemes.
The TrimTabs Demand Index (TTDI), which uses the relationship between equity prices and 21 flow and sentiment variablto time the market, closed at a four-month high of 90.2 on August 17 (readings above 50 are bullish). Recent increases in tTTDI owe to heavy equity mutual fund and ETF outflows, which are bullish from a contrarian perspective.
Retail Investors Disgusted with U.S. Equities. Long-Term Treasury Funds Remain Frightfully Popular. Leveraged Equity ETF Investors Loading Up on Longs and Abandoning Shorts.
We estimate that U.S. equity funds redeemed $2.9 billion in the past week, the sixteenth straight weekly outflow. Uequity mutual funds posted an outflow in 42 of the past 52 weeks, an unprecedented string. The outflows do not owe
poor performance, as the S&P 500 is up 9.8% since August 19, 2009. Nor do they owe to a fundamental shift in asallocation away from stocks, as global equity mutual funds received $44 billion in the past year.
Bond mutual funds have already received $17.4 billion in August after hauling in $30.2 billion in July. Long-TerTreasuries remain a favorite — these funds took in 1.1% of assets in the past week and 2.8% of assets in the past month.
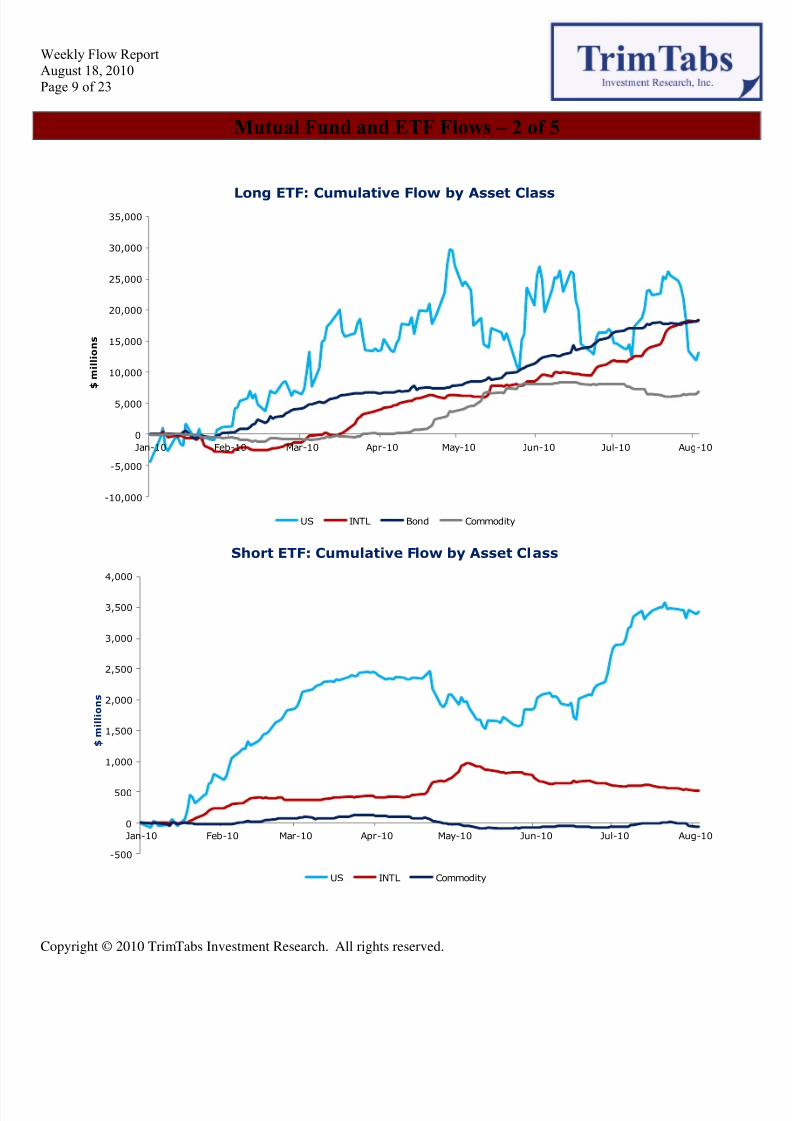
ETF investors are equally disgusted with U.S. stocks. The six most popular ETFs in the past week were GLD (SpideGold), ACWX (iShares MSCI World ex-U.S.), VWO (Vipers Emerging Markets), EFA (MSCI EAFE Index), EE(iShares MSCI Emerging Markets), and SH (Proshares Short S&P 500).
In contrast, day traders are growing more bullish. 3X leveraged long equity ETFs posted an inflow of $365 million in t past week, while 3X leveraged short equity ETFs redeemed $264 million. Leveraged equity ETF flows are one of the becontrary indicators in our dataset, so this activity is bearish.
This week’s study shows that investors can earn significant excess returns by betting on the mutual fund categories that amost overbought on a short-term basis and most oversold on a long-term basis. Our model’s best bets at present aGlobal Real Estate funds and Mid-Cap Value funds.
NYSE Short Interest Decreases Only 1.7% in July. Apple Short Interest Decreases $747 Million.
Short interest at NYSE member firms decreased 0.5% to 13.7 billion shares (3.6% of market cap) in the second half July. Short interest decreased only 1.7% for the month, which is light given the market’s increase.
There was net short covering in six of the 10 major sectors. Information Technology and Consumer Discretionary postthe largest short interest outflows — $1.4 billion and $831 million respectively. AAPL (2.9 million shares, $747 millioand MSFT (8.2 million shares, $209 million) led the short covering in Information Technology, while MCD (2.2 millio
8/8/2019 Weekly Flow Report MF Study
http://slidepdf.com/reader/full/weekly-flow-report-mf-study 2/23
Weekly Flow ReportAugust 18, 2010Page 2 of 23
Copyright © 2010 TrimTabs Investment Research. All rights reserved.
shares, $155 million) and AZO (721,000 shares, $153 million) led the short covering in Consumer DiscretionarMeanwhile, Financials and Utilities posted the largest short interest inflows — $629 million and $165 million respectively
Hedge Funds Post Estimated Outflow of $2.1 Billion in July. Managers Turn Extremely Bearish on Equities.
Based on a survey of 691 funds, we estimate that hedge funds posted an outflow of $2.1 billion (0.1% of assets) in JulPreliminary data showed an inflow of $1.5 billion (0.1% of assets). The July redemption does not surprise because hedfunds posted a combined negative return of 4.0% in May and June.
Funds of hedge funds posted an estimated inflow of $4.5 billion (0.9% of assets) in July, a sharp revision from o preliminary estimate of an outflow of $7.5 billion (1.5% of assets). The inflow is surprising in that funds of funds hasuffered larger redemptions than hedge funds since the onset of the credit crisis and performance has been poor. While tindustry is up 1.6% on the year, funds of funds show a modest loss after underperforming by 13% in 2009. Note thJuly’s estimates are based on only 174 funds and could be significantly revised as more funds report.
The industry failed to capitalize on July’s rebound. The hedge funds in our survey returned 1.2% and funds of funreturned 0.4%, nowhere near the S&P 500 increase of 6.9%. We attribute underperformance to extreme caution followithe May/June sell-off, as the hedge fund managers we survey monthly revealed bearishness on equities and the economAlso, margin debt decreased 12% in May and June, suggesting managers levered down dramatically.
Hedge fund investors are risk averse. Emerging Markets funds redeemed $2.4 billion (1.2% of assets) in July followi
outflows of $1.9 billion in June and $2.0 billion in May. These outflows seem harsh in light of recent performancEmerging Markets hedge funds are up 3.4% for the year, while most emerging market equity indices are still in the red.
Preliminary results from our August survey of hedge fund managers reveal that managers are extremely bearish on tS&P 500 and bullish on 10-year Treasuries. We will release final results next week.
Spec Traders Turn Bullish on Treasuries and Maintain Somewhat Contradictory Currency Positions.
Spec traders are now neutral on two-year Treasuries, net long five-year Treasuries (with a long/short ratio of 2 to 1), anneutral on 10-year Treasuries. This is a big shift from their persistent (losing) bet on a steeper yield curve — they had a nshort position of 4 to 1 on 10-year Treasuries on April 13.
What drove the reversal — a shift in economic expectations or margin calls and stop-losses? Probably both. The dolvalue of long positions on 10-year Treasuries has increased $9.9 billion since April 13 (a shift in expectations), while thdollar value of short positions on 10-Year Treasuries has decreased $12.3 billion (short covering).
Speculative traders are holding somewhat contradictory currency positions. They are short the U.S. dollar in most patrades (especially against the Canadian dollar, the Mexican peso, the Swiss franc, and the yen). At the same time, thmaintained a net long position of 3.2 to 1 on U.S. dollar index futures in the past week.
ContentsTopical Study: Capitalizing on Retail Exuberance and Misery……………..……..……………...…..…...………………
Dataset and Methodology. Residual Flows of Small Growth Funds Soar at Peak of Internet Bubble……………………….…........4Generating Alpha by Combining a Short-Term Momentum Portfolio with a Long-Term Contrarian Portfolio………………….…..5Model Recommendations: Global Real Estate and Mid-Cap Value……………………………………….…………….………………7
Data Tables and Graphs ...........................................................................................................................................................Mutual Fund and Exchange-Traded Fund Flows .............................................................................................................................................Futures Flows ................................................................................................................................................................................................
Hedge Fund Flows ......................................................................................................................................................................................... Short Interest ..................................................................................................................................................................................................Demand Index ................................................................................................................................................................................................
Datasets and Research Notes ......................................................................................................................................................................... 2

8/8/2019 Weekly Flow Report MF Study
http://slidepdf.com/reader/full/weekly-flow-report-mf-study 3/23
Weekly Flow ReportAugust 18, 2010Page 3 of 23
Copyright © 2010 TrimTabs Investment Research. All rights reserved.
Capitalizing on Retail Exuberance and Misery
Equity mutual fund flows and returns
Last week’s research note showed that mutual fund flows are a good leading contrary indicator of returns for roughly half fund categories. This week’s note expands on the concept and introduces trading strategies designed to capitalize on bouts retail exuberance and misery.
Our intuition was that sophisticated investors should separate mutual fund flows into a “return-chasing” component and
“residual” component, as the latter contains the most valuable information about retail sentiment. We suspect residual flow
are a good short-term momentum indicator and a good long-term contrary indicator. Most academic studies suggest retflows boost asset prices in the short term but are generally ill timed in the long term.
This study is based on 10 years of daily fund flows at the Morningstar level. We restricted the universe to equities becauthey are the most speculative asset class. Our findings:
The relationship between residual flows and returns has the expected shape. Strategies with positive residual flowdeliver excess returns in the short term but underperform in the long term, while strategies with negative residuflows underperform in the short term but outperform in the long term.
A portfolio investing in the mutual fund categories with the largest positive (or least negative) residual flows in th
past 30 days — our short-term momentum portfolio — delivered an excess return of 76% in the past decade.
A portfolio investing in the strategies with the largest negative (or least positive) residual flows in the past 27days — our long-term contrarian portfolio — delivered an excess return of 82% in the past decade.
Sophisticated investors should combined the two approaches. A portfolio split evenly between the momentum ancontrarian models delivered an excess return of 90% in the past decade. Additionally, the combo portfolio exhiblower volatility.
Global Real Estate funds are currently the short-term momentum model’s best bet. These funds posted an inflow 3.0% of assets in the past 30 days.
Mid-Cap Value funds are currently the long-term contrarian model’s best bet. These funds posted an inflow of on2.1% of assets in the past 270 days even though they returned 26.4%.
8/8/2019 Weekly Flow Report MF Study
http://slidepdf.com/reader/full/weekly-flow-report-mf-study 4/23
Weekly Flow ReportAugust 18, 2010Page 4 of 23
Copyright © 2010 TrimTabs Investment Research. All rights reserved.
Dataset and Methodology. Residual Flows of Small Growth Funds Soar at Peak of Internet Bubble.
This study is based on the TrimTabs mutual fund dataset (which reaches back to February 1998). TrimTabs tracks the flowassets, and net asset values (NAVs, or returns) of more than 5,700 mutual funds with combined assets of $1 trillion on a daibasis. Our hypothesis is that sophisticated investors can use mutual fund flows as an indicator of irrational retail sentiment identify mispriced asset classes.
We made several transformation to the raw (ticker-level) data:
We used Morningstar categories because they provide a great deal of detail (including the famous three-by-thrstyle/size box) without introducing the risk of a single fund dominating a category.
We used only equity funds for two reasons. First, NAV changes are a highly imperfect measure of investor return fincome-generating securities, but they correlate very well with total returns for equities. Second, as the mospeculative asset class, equities are likelier to exhibit large sentiment-induced swings. TrimTabs currently trac3,301 equity funds across 22 Morningstar categories with assets of $577 billion.
We dropped flow and NAV data for all categories with fewer than five funds to avoid fund-specific assets.
We use flows as a percentage of assets in order to adjust for increases in our sample over time.
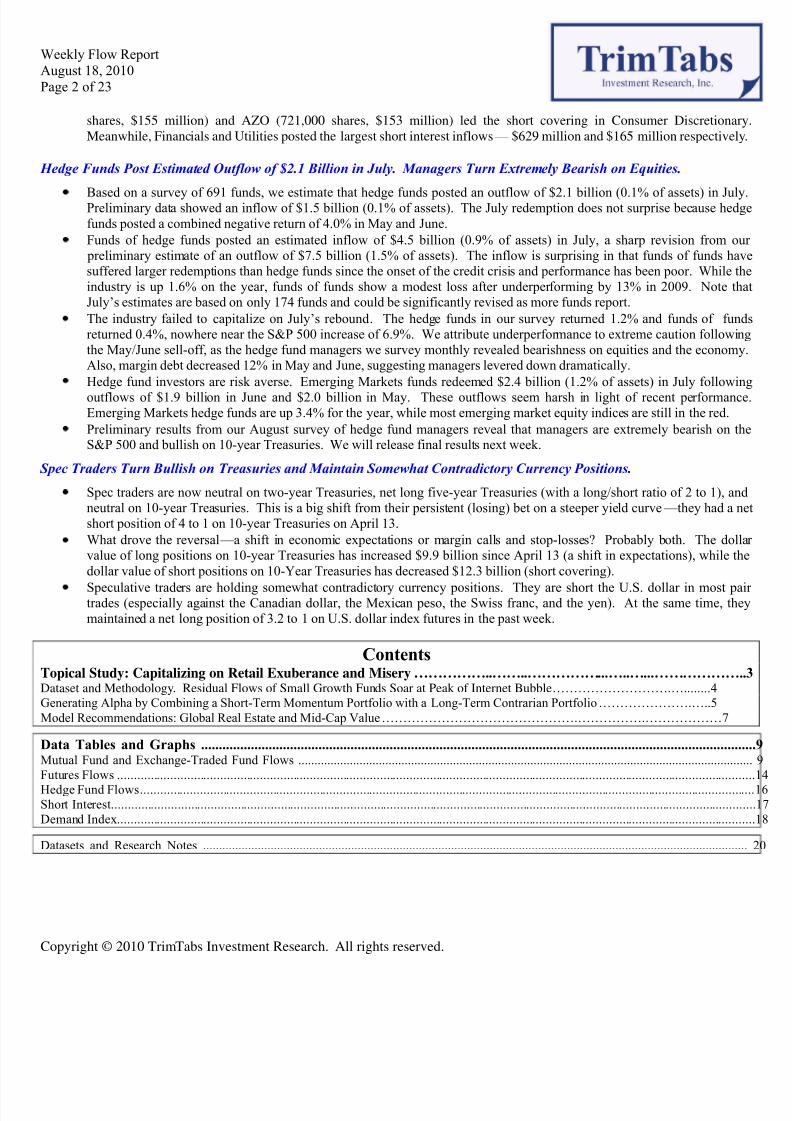
Our research and previous academic studies show that mutual fund flows chase returns. In a prior research note, we founthat returns in the past two months explain more than 30% of the flows of the most speculative fund strategies. Our intuitiwas to strip flow data of this noise. If investors want to trade based on momentum, they should use widely-available pridata rather than going through the effort of collecting mutual fund flow data.
We believe “abnormal” fund flows are the best measure of retail sentiment. Euphoria and misery surface once we stripfund flow of its return-chasing component. We ran the following regression for all 22 equity mutual fund categori
(strategies):
Flow/Assets it = β0 + β1 * NAV Changeit + uit
We then measured “residual” flows with the following equation:
Residual Flow/Assets it = Flow/Assets it - β0 - β1 * NAV Changeit
69.4%
62.8%
58.6%
57.9%
55.9%
50.4%
50.0%
0% 10% 20% 30% 40% 50% 60% 70% 80%
World Allocation
Latin America Stock
High Yield Bond
Pacific/Asia ex-Japan
Europe Stock
Diversified Emerging Mkts
High Yield Muni
Correlation between Mutual Fund Flows and Returns
8/8/2019 Weekly Flow Report MF Study
http://slidepdf.com/reader/full/weekly-flow-report-mf-study 5/23
Weekly Flow ReportAugust 18, 2010Page 5 of 23
Copyright © 2010 TrimTabs Investment Research. All rights reserved.
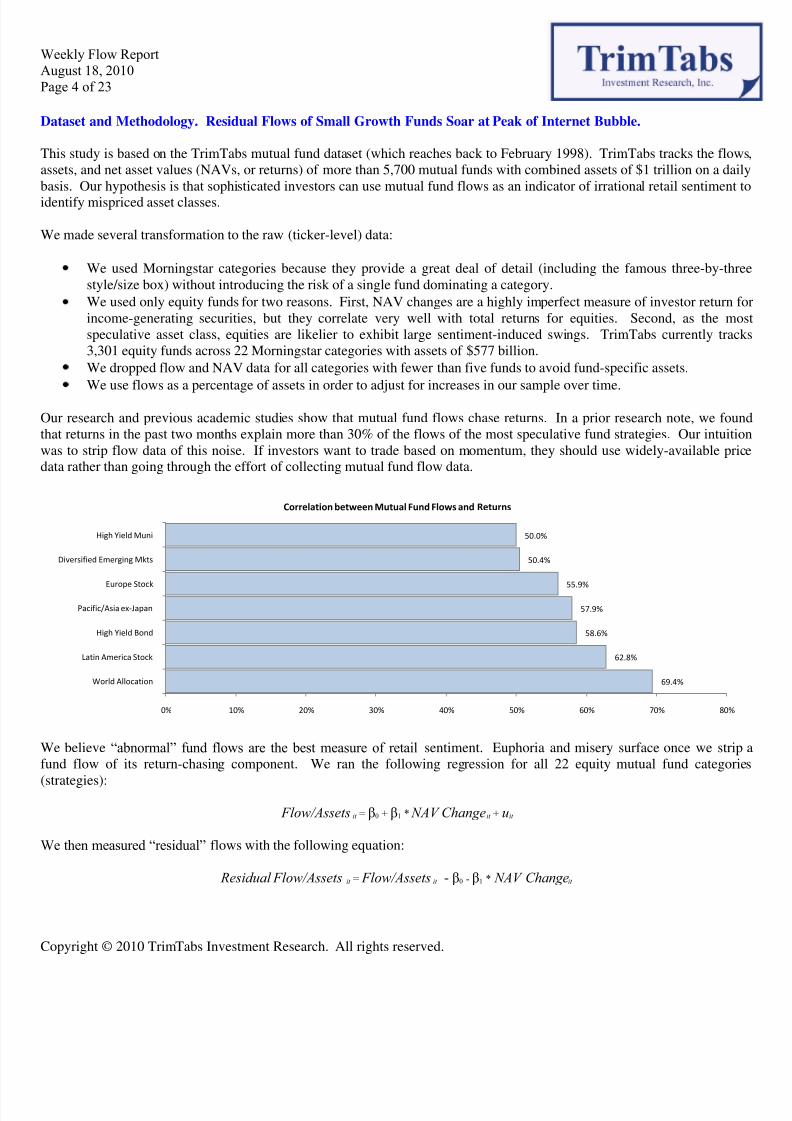
The chart below plots the residual flows and net asset values of Small Growth funds. These residual flows were strongpositive during the late stages of the Internet bubble and turned sharply negative in 2002-2003, signaling a good buyinopportunity. Small Growth residual flows have mapped a mildly positive trajectory since the start of 2004.
Active Investors Can Generate Alpha by Combining a Short-Term Momentum Portfolio with a Long-Ter
Contrarian Portfolio.
We then built two model portfolios:
The momentum portfolio invests in the funds with the largest positive (or least negative) residual flows. The strateghere is to go with the flow in the short term.
The contrarian portfolio invests in the strategies with the largest negative (or least positive) residual flows. Tstrategy here is to fade the crowd in the long term.
The model portfolios allocate capital based on the magnitude of residual flows. For example, if Small Blend, DiversifiEmerging Markets, and Japan Stock are the only fund strategies with positive residual flows of 0.3%, 0.6%, and 0.1%respectively, the momentum model is 30% invested in Small Blend funds, 60% invested in Diversified Emerging Markefunds, and 10% invested in Japan Stock funds.
If Specialty-Financials and Large Value are the only fund categories with negative residual flows of 0.2% and 0.4%respectively, the contrarian model is 66% invested in Specialty-Financials funds and 33% invested in Large Value funds.
We looked at the returns of only long portfolios because mutual funds cannot easily be shorted. The following chart showthe excess returns1 of both portfolios for different time periods (smoothing lengths). For example, the momentum moddelivered an excess return of 4.8% by investing in the funds with the largest positive (or least negative) residual flows in thpast 40 days. As expected, the excess returns of the momentum strategy die off quickly. In contrast, the excess returns of t
contrarian strategy (which embraces the most unloved funds) grow steadily with time. These results confirm our hypothesthat although retail flows can juice stock prices in the short term, they generally signal market tops.
1 Excess returns are the difference between the average annualized return of the model portfolio and the average annualized return of a portfolio investing equally in the 22 equity categories.
-4%
-3%
-2%
-1%
0%
1%
2%
3%
4%
5%
30
50
70
90
110
130
150
170
1998 1999 2000 2001 2002 2003 2004 2005 2006 2007 2008 2009 2010
R e s i d u a l F l o w / A s s e t s
N A V ( 1 0 0 = F e b 1 9 9 8 )
Residual Flows and NAV of Small Growth Funds
NAV (LS)
Residual Flows (RS)
8/8/2019 Weekly Flow Report MF Study
http://slidepdf.com/reader/full/weekly-flow-report-mf-study 6/23
Weekly Flow ReportAugust 18, 2010Page 6 of 23
Copyright © 2010 TrimTabs Investment Research. All rights reserved.
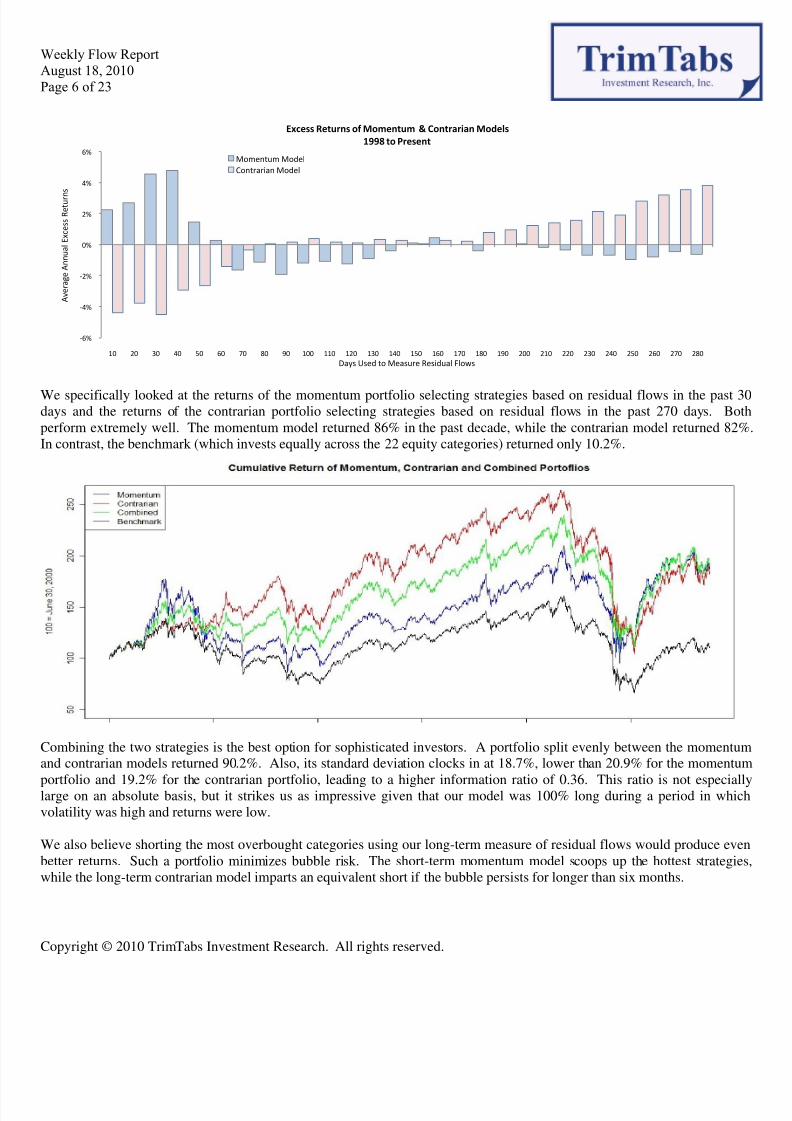
We specifically looked at the returns of the momentum portfolio selecting strategies based on residual flows in the past 3days and the returns of the contrarian portfolio selecting strategies based on residual flows in the past 270 days. Boperform extremely well. The momentum model returned 86% in the past decade, while the contrarian model returned 82%In contrast, the benchmark (which invests equally across the 22 equity categories) returned only 10.2%.
Combining the two strategies is the best option for sophisticated investors. A portfolio split evenly between the momentuand contrarian models returned 90.2%. Also, its standard deviation clocks in at 18.7%, lower than 20.9% for the momentu
portfolio and 19.2% for the contrarian portfolio, leading to a higher information ratio of 0.36. This ratio is not especiallarge on an absolute basis, but it strikes us as impressive given that our model was 100% long during a period in whicvolatility was high and returns were low.
We also believe shorting the most overbought categories using our long-term measure of residual flows would produce evebetter returns. Such a portfolio minimizes bubble risk. The short-term momentum model scoops up the hottest strategiewhile the long-term contrarian model imparts an equivalent short if the bubble persists for longer than six months.
-6%
-4%
-2%
0%
2%
4%
6%
10 20 30 40 50 60 70 80 90 100 110 120 130 140 150 160 170 180 190 200 210 220 230 240 250 260 270 280
A v e r a g e A n n u a l E x c e s s R e t u r n
s
Days Used to Measure Residual Flows
Excess Returns of Momentum & Contrarian Models
1998 to Present
Momentum Model
Contrarian Model
8/8/2019 Weekly Flow Report MF Study
http://slidepdf.com/reader/full/weekly-flow-report-mf-study 7/23
Weekly Flow ReportAugust 18, 2010Page 7 of 23
Copyright © 2010 TrimTabs Investment Research. All rights reserved.
Annualized Returns June 2000 to July 2010
Contrarian Momentum Combined Benchmark
Average Return 6.3% 7.4% 6.8% 2.4%
Standard Deviation 19.2% 20.9% 18.7% 18.6%
Information Ratio 0.33 0.35 0.36 0.13
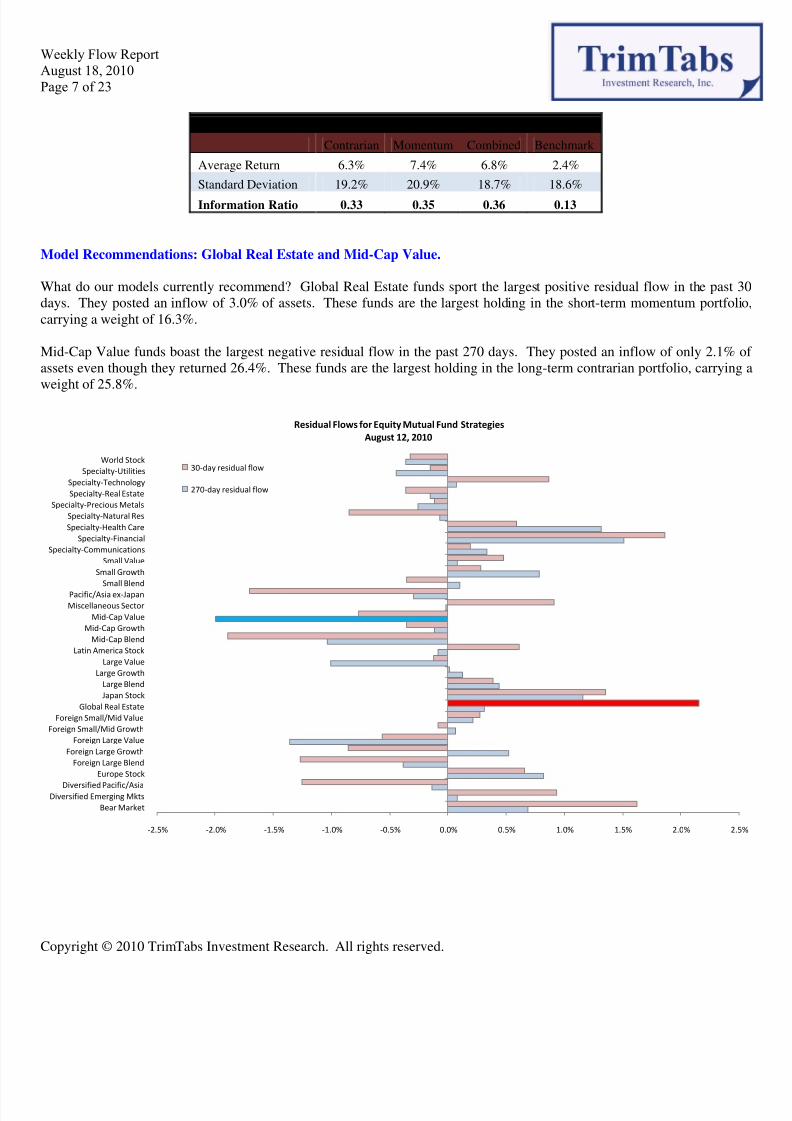
Model Recommendations: Global Real Estate and Mid-Cap Value.
What do our models currently recommend? Global Real Estate funds sport the largest positive residual flow in the past 3days. They posted an inflow of 3.0% of assets. These funds are the largest holding in the short-term momentum portfolcarrying a weight of 16.3%.
Mid-Cap Value funds boast the largest negative residual flow in the past 270 days. They posted an inflow of only 2.1% assets even though they returned 26.4%. These funds are the largest holding in the long-term contrarian portfolio, carryingweight of 25.8%.
-2.5% -2.0% -1.5% -1.0% -0.5% 0.0% 0.5% 1.0% 1.5% 2.0% 2.5
Bear Market
Diversified Emerging MktsDiversified Pacific/Asia
Europe Stock
Foreign Large Blend
Foreign Large Growth
Foreign Large Value
Foreign Small/Mid Growth
Foreign Small/Mid Value
Global Real Estate
Japan Stock
Large Blend
Large Growth
Large Value
Latin America Stock
Mid-Cap Blend
Mid-Cap Growth
Mid-Cap Value
Miscellaneous Sector
Pacific/Asia ex-Japan
Small Blend
Small Growth
Small Value
Specialty-Communications
Specialty-Financial
Specialty-Health Care
Specialty-Natural Res
Specialty-Precious Metals
Specialty-Real Estate
Specialty-Technology
Specialty-Utilities
World Stock
Residual Flows for Equity Mutual Fund Strategies
August 12, 2010
30-day residual flow
270-day residual flow

8/8/2019 Weekly Flow Report MF Study
http://slidepdf.com/reader/full/weekly-flow-report-mf-study 8/23
Weekly Flow ReportAugust 18, 2010Page 8 of 23
Copyright © 2010 TrimTabs Investment Research. All rights reserved.
Mutual Fund and ETF Flows – 1 of 5
All data are as of Tuesday, August17, 2010
MF Flow ETF Flow MF Flow ETF Flow MF Flow ETF Flow MF Flow ETF Flow
2005 135.6 49.6 30.8 26.4 104.8 23.2 31.3 6.8
2006 159.5 54.3 11.0 29.8 148.5 24.5 60.6 5.1
2007 94.5 125.5 -43.4 81.6 137.9 43.9 111.6 12.6
2008 -245.1 140.1 -162.4 120.8 -82.7 19.4 33.8 20.6
2009 17.3 22.0 -32.5 -13.5 49.8 35.5 467.2 48.5
2010 YTD -8.8 7.6 -35.8 -8.6 27.0 16.2 202.0 21.4
Last Twelve Months -33.0 41.4 -79.6 7.0 46.7 34.4 357.7 34.4
Aug-09 3.9 2.9 -2.0 3.8 5.9 -0.9 42.9 2.8
Sep-09 -10.5 0.5 -11.3 -2.2 0.7 2.7 47.5 3.6
Oct-09 -7.1 3.3 -14.9 -4.1 7.8 7.4 45.9 2.5
Nov-09 -2.8 6.0 -8.8 1.6 6.0 4.4 36.2 4.5
Dec-09 -3.8 23.9 -8.9 20.3 5.1 3.7 26.1 2.5
Jan-10 16.9 -19.2 6.8 -19.9 10.1 0.7 27.3 2.6
Feb-10 0.7 1.6 -4.5 4.3 5.1 -2.7 26.6 2.2
Mar-10 11.5 12.7 3.1 11.0 8.4 1.7 37.2 4.0
Apr-10 13.2 7.1 5.0 2.3 8.2 4.8 28.1 1.3
May-10 -24.8 1.0 -19.1 -0.5 -5.7 1.5 14.5 1.4
Jun-10 -5.4 5.6 -7.4 3.8 2.0 1.8 20.7 4.8
Jul-10 -13.7 4.4 -14.0 0.3 0.3 4.2 30.2 4.6
Aug-10 MTD -7.2 -5.6 -5.9 -9.8 -1.3 4.2 17.4 0.5
Last Week (Est.) -4.7 -9.8 -2.9 -10.6 -1.8 0.8 6.7 0.5
Notes:
Mutural Fund Flow (est) is a TrimTabs estimate based on i) flows tracked via TrimTabs dai ly s urvey, ii) market returns,
Flow = (Assets(t))-(Ass et(t-1)*(NAV(t)/NAV(t-1))).
All Equities US Equities Int. Equities Bonds$ billions
-30%
-25%
-20%
-15%
-10%
-5%
0%
5%
10%
15%
20%
% o
f A s s e t s
Trackable Mutual Funds: Cumulative Flows to Total AssetsQ3 2008 to Date
US INTL BOND
8/8/2019 Weekly Flow Report MF Study
http://slidepdf.com/reader/full/weekly-flow-report-mf-study 9/23
Weekly Flow ReportAugust 18, 2010Page 9 of 23
Copyright © 2010 TrimTabs Investment Research. All rights reserved.
Mutual Fund and ETF Flows – 2 of 5
-10,000
-5,000
0
5,000
10,000
15,000
20,000
25,000
30,000
35,000
Jan-10 Feb-10 Mar-10 Apr-10 May-10 Jun-10 Jul-10 Aug-10
$ m i l l i o n s
Long ETF: Cumulative Flow by Asset Class
US INTL Bond Commodity
-500
0
500
1,000
1,500
2,000
2,500
3,000
3,500
4,000
Jan-10 Feb-10 Mar-10 Apr-10 May-10 Jun-10 Jul-10 Aug-10
$ m i l l i o n s
Short ETF: Cumulative Flow by Asset Class
US INTL Commodity
8/8/2019 Weekly Flow Report MF Study
http://slidepdf.com/reader/full/weekly-flow-report-mf-study 10/23
Weekly Flow ReportAugust 18, 2010Page 10 of 23
Copyright © 2010 TrimTabs Investment Research. All rights reserved.
Mutual Fund and ETF Flows – 3 of 5
All data are as of Tuesday, August 17, 2010
Daily Trackable Survey Flows Last Week 2 Wks Ago 3 Wks Ago 4 Wks Ago 5 Wks Ago 6 Wks Ag
From - 21-Jul 10-Aug 2-Aug 23-Jul 15-Jul 7-Jul 28-Jun
To - 17-Aug 17-Aug 9-Aug 30-Jul 22-Jul 14-Jul 6-Jul-10
($millions) # of Funds TNA Flow Flow/TNA Flow Flow Flow Flow Flow Flow
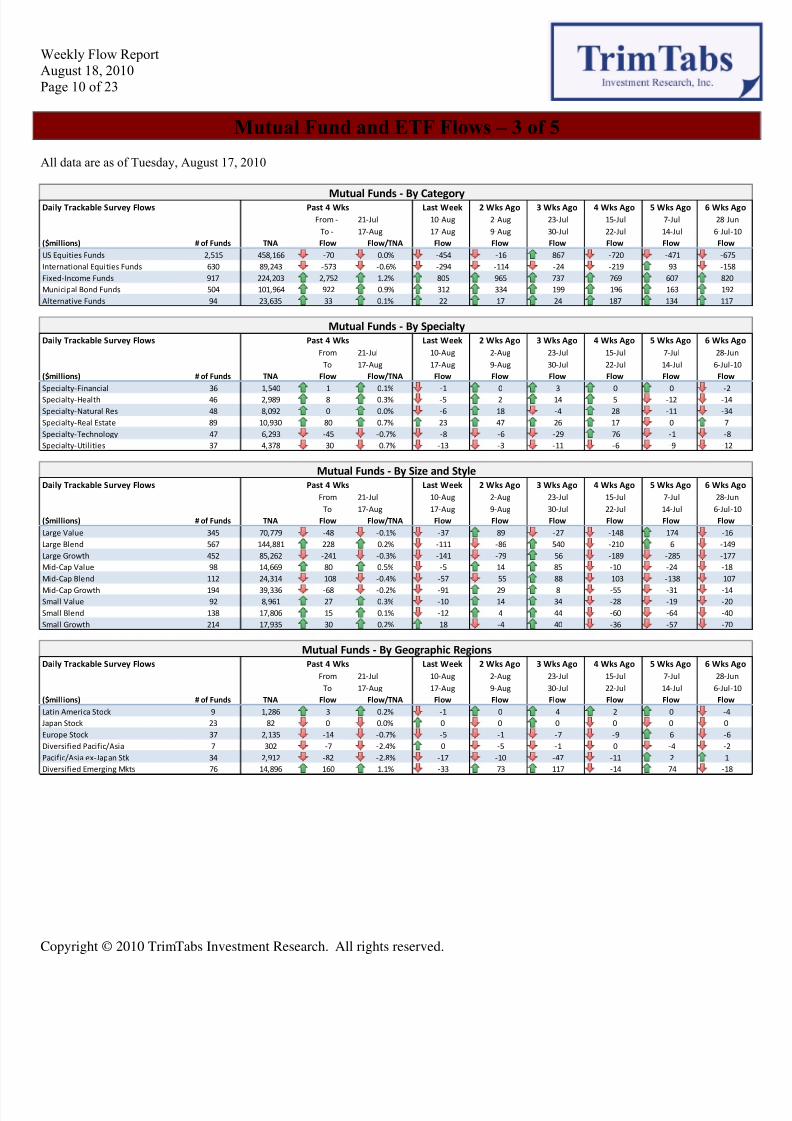
US Equities Funds 2,515 458,166 -70 0.0% -454 -16 867 -720 -471 -675
International Equities Funds 630 89,243 -573 -0.6% -294 -114 -24 -219 93 -158
Fixed-Income Funds 917 224,203 2,752 1.2% 805 965 737 769 607 820
Municipal Bond Funds 504 101,964 922 0.9% 312 334 199 196 163 192
Alternative Funds 94 23,635 33 0.1% 22 17 24 187 134 117
Daily Trackable Survey Flows Last Week 2 Wks Ago 3 Wks Ago 4 Wks Ago 5 Wks Ago 6 Wks Ag
From 21-Jul 10-Aug 2-Aug 23-Jul 15-Jul 7-Jul 28-Jun
To 17-Aug 17-Aug 9-Aug 30-Jul 22-Jul 14-Jul 6-Jul-10
($millions) # of Funds TNA Flow Flow/TNA Flow Flow Flow Flow Flow Flow
Specialty-Financial 36 1,540 1 0.1% -1 0 3 0 0 -2
Specialty-Health 46 2,989 8 0.3% -5 2 14 5 -12 -14
Specialty-Natural Res 48 8,092 0 0.0% -6 18 -4 28 -11 -34
Specialty-Real Estate 89 10,930 80 0.7% 23 47 26 17 0 7
Specialty-Technology 47 6,293 -45 -0.7% -8 -6 -29 76 -1 -8
Specialty-Utilities 37 4,378 -30 -0.7% -13 -3 -11 -6 -9 -12
Daily Trackable Survey Flows Last Week 2 Wks Ago 3 Wks Ago 4 Wks Ago 5 Wks Ago 6 Wks Ag
From 21-Jul 10-Aug 2-Aug 23-Jul 15-Jul 7-Jul 28-Jun
To 17-Aug 17-Aug 9-Aug 30-Jul 22-Jul 14-Jul 6-Jul-10
($millions) # of Funds TNA Flow Flow/TNA Flow Flow Flow Flow Flow Flow
Large Value 345 70,779 -48 -0.1% -37 89 -27 -148 174 -16
Large Blend 567 144,881 228 0.2% -111 -86 540 -210 6 -149
Large Growth 452 85,262 -241 -0.3% -141 -79 56 -189 -285 -177
Mid-Cap Value 98 14,669 80 0.5% -5 14 85 -10 -24 -18
Mid-Cap Blend 112 24,314 -108 -0.4% -57 -55 88 -103 -138 -107
Mid-Cap Growth 194 39,336 -68 -0.2% -91 29 8 -55 -31 -14Small Value 92 8,961 27 0.3% -10 14 34 -28 -19 -20
Small Blend 138 17,806 15 0.1% -12 4 44 -60 -64 -40
Small Growth 214 17,935 30 0.2% 18 -4 40 -36 -57 -70
Daily Trackable Survey Flows Last Week 2 Wks Ago 3 Wks Ago 4 Wks Ago 5 Wks Ago 6 Wks Ag
From 21-Jul 10-Aug 2-Aug 23-Jul 15-Jul 7-Jul 28-Jun
To 17-Aug 17-Aug 9-Aug 30-Jul 22-Jul 14-Jul 6-Jul-10
($millions) # of Funds TNA Flow Flow/TNA Flow Flow Flow Flow Flow Flow
Latin America Stock 9 1,286 3 0.2% -1 0 4 2 0 -4
Japan Stock 23 82 0 0.0% 0 0 0 0 0 0
Europe Stock 37 2,135 -14 -0.7% -5 -1 -7 -9 6 -6
Diversified Pacific/Asia 7 302 -7 -2.4% 0 -5 -1 0 -4 -2
Pacific/Asia ex-Japan Stk 34 2,912 -82 -2.8% -17 -10 -47 -11 2 1
Diversified Emerging Mkts 76 14,896 160 1.1% -33 73 117 -14 74 -18
Past 4 WksMutual Funds - By Category
Mutual Funds - By SpecialtyPast 4 Wks
Mutual Funds - By Size and StylePast 4 Wks
Mutual Funds - By Geographic RegionsPast 4 Wks

8/8/2019 Weekly Flow Report MF Study
http://slidepdf.com/reader/full/weekly-flow-report-mf-study 11/23
Weekly Flow ReportAugust 18, 2010Page 11 of 23
Copyright © 2010 TrimTabs Investment Research. All rights reserved.
Mutual Fund and Mutual Fund and ETF Flows – 4 of 5
ETF Flows – 4 of 5 All data are as of Tuesday, August 17, 2010
Daily Trackable Survey Flows Last Week 2 Wks Ago 3 Wks Ago 4 Wks Ago 5 Wks Ago 6 Wks Ag
From 21-Jul 10-Aug 2-Aug 23-Jul 15-Jul 7-Jul 28-Jun
To 17-Aug 17-Aug 9-Aug 30-Jul 22-Jul 14-Jul 6-Jul-10
($millions) # of Funds TNA Flow Flow/TNA Flow Flow Flow Flow Flow Flow
Emerging Markets Bond 23 1,516 20 1.3% 6 2 11 3 6 -10
Long-Term Bond 13 1,230 -3 -0.3% 4 -1 -11 12 1 2
Short-Term Bond 104 28,456 703 2.5% 229 256 199 169 167 338
Intermediate-Term Bond 297 87,611 1,150 1.3% 392 399 241 296 158 291
High Yield Bond 132 32,820 519 1.6% 87 239 143 197 239 37
Daily Trackable Survey Flows Last Week 2 Wks Ago 3 Wks Ago 4 Wks Ago 5 Wks Ago 6 Wks Ag
From 21-Jul 10-Aug 2-Aug 23-Jul 15-Jul 7-Jul 28-Jun
To 17-Aug 17-Aug 9-Aug 30-Jul 22-Jul 14-Jul 6-Jul-10
($millions) # of Funds TNA Flow Flow/TNA Flow Flow Flow Flow Flow Flow
Bear Market 33 1,489 -21 -1.4% -8 -5 -10 228 25 0
Long-Short 37 13,258 31 0.2% 11 13 39 18 89 118
Specialty-Precious Metals 24 8,889 23 0.3% 19 8 -6 -59 20 -1
Daily Trackable Survey Flows Last Week 2 Wks Ago 3 Wks Ago 4 Wks Ago 5 Wks Ago 6 Wks Ag
From 21-Jul 10-Aug 2-Aug 23-Jul 15-Jul 7-Jul 28-Jun
To 17-Aug 17-Aug 9-Aug 30-Jul 22-Jul 14-Jul 6-Jul-10
($millions) # of Funds TNA Flow Flow/TNA Flow Flow Flow Flow Flow Flow
US Equities Funds 538 476,703 -1,273 -0.3% -11,575 1,801 10,030 -4,393 2,759 -9,978
International Equities Funds 150 204,928 6,517 3.2% 636 3,527 1,827 463 2,101 -548
Fixed-Income Funds 87 134,476 1,540 1.1% 552 -82 949 869 2,353 1,108
Alternative Funds 80 78,236 -410 -0.5% 493 -226 -787 -410 150 394
Daily Trackable Survey Flows Last Week 2 Wks Ago 3 Wks Ago 4 Wks Ago 5 Wks Ago 6 Wks Ag
From 21-Jul 10-Aug 2-Aug 23-Jul 15-Jul 7-Jul 28-Jun
To 17-Aug 17-Aug 9-Aug 30-Jul 22-Jul 14-Jul 6-Jul-10
($millions) # of Funds TNA Flow Flow/TNA Flow Flow Flow Flow Flow Flow
Consumer Discretionary 14 3,929 434 11.0% 190 -43 39 434 -300 -126
Consumer Staples 11 6,213 351 5.6% -52 -66 323 351 243 -72
Energy 29 14,843 -401 -2.7% -204 -287 119 -401 187 165
Financials 41 28,157 -191 -0.7% -80 -446 510 -191 55 -429
Health Care 22 8,428 191 2.3% -179 -53 -1 191 -107 63
Industrials 16 6,775 389 5.7% -651 447 82 389 -189 -233
Information Technology 33 10,295 -58 -0.6% 79 -330 94 -58 108 -26
Materials 15 13,842 -519 -3.8% -308 -343 163 -519 -221 -36
Telecommunications 6 1,241 86 6.9% 36 0 50 86 5 18
Utilities 14 5,804 522 9.0% 134 22 335 522 211 20
Mutual Funds - By Fixed-Income TypePast 4 Wks
Mutual Funds - Alternative Mutual FundPast 4 Wks
ETFs - By Category (Excluding Short ETFs)Past 4 Wks
ETF: By Industry
Past 4 Wks

8/8/2019 Weekly Flow Report MF Study
http://slidepdf.com/reader/full/weekly-flow-report-mf-study 12/23
Weekly Flow ReportAugust 18, 2010Page 12 of 23
Copyright © 2010 TrimTabs Investment Research. All rights reserved.
Mutual Fund and ETF Flows – 5 of 5
All data are as of Tuesday, August 17, 2010
Fund and ETF Flows – 4 of 5
Daily Trackable Survey Flows Last Week 2 Wks Ago 3 Wks Ago 4 Wks Ago 5 Wks Ago 6 Wks Ag
From 21-Jul 10-Aug 2-Aug 23-Jul 15-Jul 7-Jul 28-Jun
To 17-Aug 17-Aug 9-Aug 30-Jul 22-Jul 14-Jul 6-Jul-10
($millions) # of Funds TNA Flow Flow/TNA Flow Flow Flow Flow Flow Flow
Large Value 23 23,671 -268 -1.1% -413 34 82 -268 58 -116
Large Blend 110 191,363 -1,568 -0.8% -9,615 -949 3,376 -1,568 -3,511 4,257
Large Growth 26 24,532 184 0.7% -43 109 57 184 -116 -136
Mid-Cap Value 10 5,588 37 0.7% -15 -4 -41 37 -17 65
Mid-Cap Blend 25 26,481 599 2.3% -340 397 272 599 -148 -28
Mid-Cap Growth 11 6,176 5 0.1% -55 -24 -31 5 -10 -60
Small Value 7 3,431 -45 -1.3% -24 -9 -13 -45 -25 -60
Small Blend 23 11,448 159 1.4% 109 -84 105 159 -91 -118
Small Growth 7 2,942 -27 -0.9% -44 5 14 -27 -9 -23
Daily Trackable Survey Flows Last Week 2 Wks Ago 3 Wks Ago 4 Wks Ago 5 Wks Ago 6 Wks AgFrom 21-Jul 10-Aug 2-Aug 23-Jul 15-Jul 7-Jul 28-Jun
To 17-Aug 17-Aug 9-Aug 30-Jul 22-Jul 14-Jul 6-Jul-10
($millions) # of Funds TNA Flow Flow/TNA Flow Flow Flow Flow Flow Flow
Latin America Stock 6 14,549 336 2.3% 3 171 136 336 -16 8
Japan Stock 10 4,690 -441 -9.4% -125 -179 -64 -441 -62 17
Europe Stock 25 9,176 321 3.5% -85 141 89 321 -92 -47
Diversified Pacific/Asia 5 952 -17 -1.7% 8 -24 0 -17 0 0
Pacific/Asia ex-Japan Stk 29 32,529 1,126 3.5% 18 277 405 1,126 157 91
Diversified Emerging Mkts 21 76,891 4,580 6.0% 459 1,583 1,533 4,580 248 1,805
Daily Trackable Survey Flows Last Week 2 Wks Ago 3 Wks Ago 4 Wks Ago 5 Wks Ago 6 Wks Ag
From 21-Jul 10-Aug 2-Aug 23-Jul 15-Jul 7-Jul 28-Jun
To 17-Aug 17-Aug 9-Aug 30-Jul 22-Jul 14-Jul 6-Jul-10
($millions) # of Funds TNA Flow Flow/TNA Flow Flow Flow Flow Flow Flow
Long-Term Bond 11 29,096 165 0.6% 48 -75 32 165 325 129
Short-Term Bond 7 17,536 -209 -1.2% 95 -24 -90 -209 186 308
Intermediate-Term Bond 13 17,908 528 2.9% 121 201 84 528 208 253
High Yield Bond 5 11,969 1,015 8.5% 64 343 358 1,015 230 382
Daily Trackable Survey Flows Last Week 2 Wks Ago 3 Wks Ago 4 Wks Ago 5 Wks Ago 6 Wks Ag
From 21-Jul 10-Aug 2-Aug 23-Jul 15-Jul 7-Jul 28-Jun
To 17-Aug 17-Aug 9-Aug 30-Jul 22-Jul 14-Jul 6-Jul-10
($millions) # of Funds TNA Flow Flow/TNA Flow Flow Flow Flow Flow Flow
Bear Market 66 15,825 375 2.4% -96 -51 101 375 514 352
Specialty-Precious Metals 14 62,412 -785 -1.3% 589 -175 -888 -785 -364 42
ETFs - By Size and Style
ETFs - Alternative ETFPast 4 Wks
Past 4 Wks
ETFs - By Geographic Regions
Past 4 Wks
ETFs - By Fixed-Income TypePast 4 Wks
8/8/2019 Weekly Flow Report MF Study
http://slidepdf.com/reader/full/weekly-flow-report-mf-study 13/23
Weekly Flow ReportAugust 18, 2010Page 13 of 23
Copyright © 2010 TrimTabs Investment Research. All rights reserved.
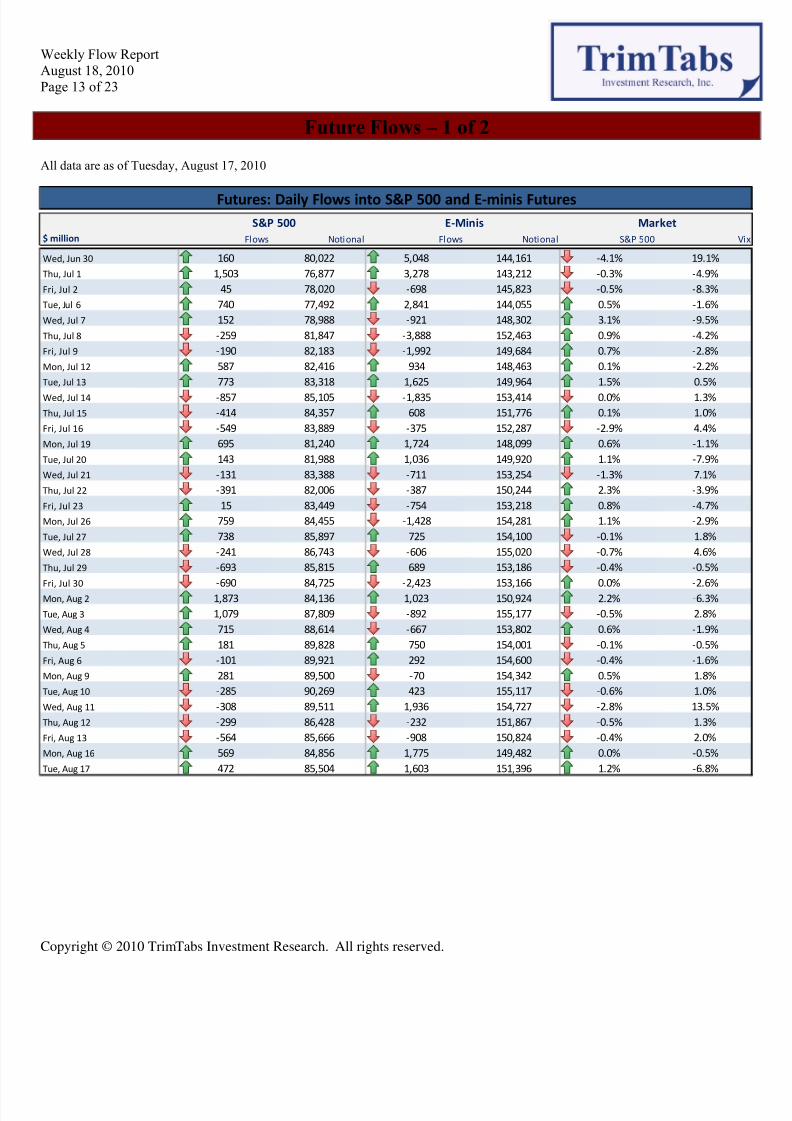
Future Flows – 1 of 2
All data are as of Tuesday, August 17, 2010
$ million Flows Notional Flows Notional S&P 500 V
Wed, Jun 30 160 80,022 5,048 144,161 -4.1% 19.1%
Thu, Jul 1 1,503 76,877 3,278 143,212 -0.3% -4.9%
Fri, Jul 2 45 78,020 -698 145,823 -0.5% -8.3%
Tue, Jul 6 740 77,492 2,841 144,055 0.5% -1.6%
Wed, Jul 7 152 78,988 -921 148,302 3.1% -9.5%
Thu, Jul 8 -259 81,847 -3,888 152,463 0.9% -4.2%
Fri, Jul 9 -190 82,183 -1,992 149,684 0.7% -2.8%
Mon, Jul 12 587 82,416 934 148,463 0.1% -2.2%
Tue, Jul 13 773 83,318 1,625 149,964 1.5% 0.5%
Wed, Jul 14 -857 85,105 -1,835 153,414 0.0% 1.3%
Thu, Jul 15 -414 84,357 608 151,776 0.1% 1.0%
Fri, Jul 16 -549 83,889 -375 152,287 -2.9% 4.4%
Mon, Jul 19 695 81,240 1,724 148,099 0.6% -1.1%
Tue, Jul 20 143 81,988 1,036 149,920 1.1% -7.9%
Wed, Jul 21 -131 83,388 -711 153,254 -1.3% 7.1%
Thu, Jul 22 -391 82,006 -387 150,244 2.3% -3.9%
Fri, Jul 23 15 83,449 -754 153,218 0.8% -4.7%
Mon, Jul 26 759 84,455 -1,428 154,281 1.1% -2.9%
Tue, Jul 27 738 85,897 725 154,100 -0.1% 1.8%
Wed, Jul 28 -241 86,743 -606 155,020 -0.7% 4.6%
Thu, Jul 29 -693 85,815 689 153,186 -0.4% -0.5%
Fri, Jul 30 -690 84,725 -2,423 153,166 0.0% -2.6%
Mon, Aug 2 1,873 84,136 1,023 150,924 2.2% -6.3%
Tue, Aug 3 1,079 87,809 -892 155,177 -0.5% 2.8%
Wed, Aug 4 715 88,614 -667 153,802 0.6% -1.9%
Thu, Aug 5 181 89,828 750 154,001 -0.1% -0.5%
Fri, Aug 6 -101 89,921 292 154,600 -0.4% -1.6%
Mon, Aug 9 281 89,500 -70 154,342 0.5% 1.8%
Tue, Aug 10 -285 90,269 423 155,117 -0.6% 1.0%
Wed, Aug 11 -308 89,511 1,936 154,727 -2.8% 13.5%
Thu, Aug 12 -299 86,428 -232 151,867 -0.5% 1.3%
Fri, Aug 13 -564 85,666 -908 150,824 -0.4% 2.0%
Mon, Aug 16 569 84,856 1,775 149,482 0.0% -0.5%
Tue, Aug 17 472 85,504 1,603 151,396 1.2% -6.8%
S&P 500 E-Minis Market
Futures: Daily Flows into S&P 500 and E-minis Futures

8/8/2019 Weekly Flow Report MF Study
http://slidepdf.com/reader/full/weekly-flow-report-mf-study 14/23
Weekly Flow ReportAugust 18, 2010Page 14 of 23
Copyright © 2010 TrimTabs Investment Research. All rights reserved.
Future Flows – 2 of 2
-5.0
0.0
5.0
10.0
15.0
20.0
25.0
0 1 2 3 4 5 6 7 8 9 10 11 12 13 14 15 16 17 18 19 20 21 22 23 24 25 26 27 28 29 30 31 32 33 34 35 36 37 38 39 40
$ b
i l l i o n
Number of Days Since Last Expiration
Futures: Cumulative Flows into S&P 500 and E-Minis Futures Contracts
All Maturities, Quarter-to-Date
Fl ow s i nto "O n- th e- Ru n" Co ntr ac ts L ast Qu ar te r Fl ow s L ast Ye ar Fl ow s
March 22 Aug 17
Last Week Two Weeks Ago Three Weeks Ago Four Weeks Ago Five Weeks Ago Six Weeks Ago
10-Aug 4-Aug 28-Jul 21-Jul 14-Jul 7-Jul
$ million 17-Aug 10-Aug 4-Aug 28-Jul 21-Jul 14-Jul
S&P 500 -2.5% -0.5% 1.9% 3.4% -2.3% 3.3%Vix Index 8.8% 0.7% -8.4% -5.4% 3.0% -7.3%
Expiration Month
June 2010 0 0 0 0 0 0
September 20 10 3,564 756 -2,584 -1,746 1,327 -5,181
December 2010 479 719 2,601 128 625 83
March 2011 1 0 -7 13 78 1
June 2011 0 0 5 36 0 0
All Maturities 4,044 1,475 15 -1,569 2,029 -5,098
10-Aug 3-Aug 27-Jul 20-Jul 13-Jul 6-Jul
S&P 500 Futures
Speculative Long 6.5% 6.3% 6.5% 6.0% 7.4% 7.0%Speculative Short 12.9% 11.6% 13.3% 16.1% 13.9% 15.6%
Hedging Long 69.2% 69.4% 69.7% 69.8% 69.5% 69.8%
Hedging Short 66.5% 65.7% 62.9% 60.4% 58.6% 59.2%
E-minis Futures
Speculative Long 11.1% 10.4% 11.1% 12.6% 11.0% 11.7%
Speculative Short 11.9% 12.0% 12.1% 12.3% 13.6% 10.7%
Hedging Long 76.9% 76.0% 75.4% 74.4% 74.5% 72.4%
Hedging Short 78.9% 78.4% 77.5% 77.0% 75.8% 78.4%
Data are a vail able on a weekly basi s. All numbers a re the ratios of futures over total open interest.
Futures: Commitments of Traders
Futures: Flow into S&P 500 and E-minis Futures
8/8/2019 Weekly Flow Report MF Study
http://slidepdf.com/reader/full/weekly-flow-report-mf-study 15/23
Weekly Flow ReportAugust 18, 2010Page 15 of 23
Copyright © 2010 TrimTabs Investment Research. All rights reserved.
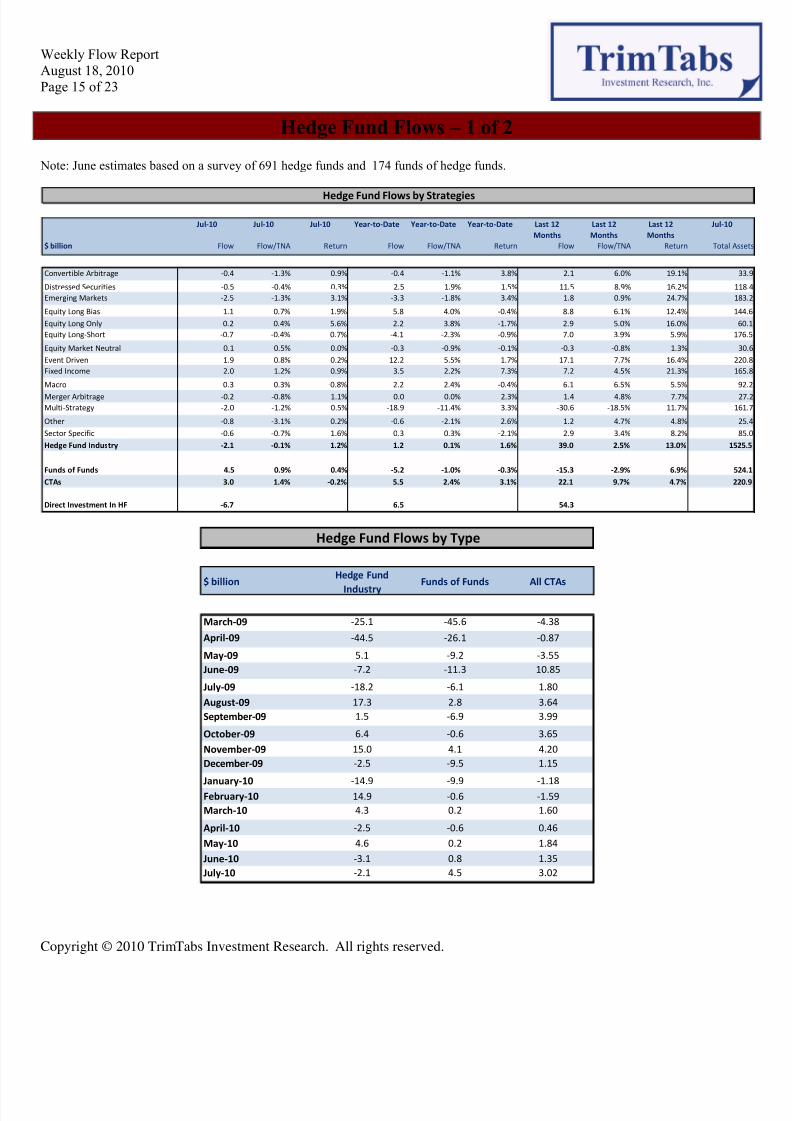
Hedge Fund Flows – 1 of 2
Note: June estimates based on a survey of 691 hedge funds and 174 funds of hedge funds.
Hedge Fund Flows by Strategies
Jul-10 Jul-10 Jul-10 Year-to-Date Year-to-Date Year-to-Date Last 12
Months
Last 12
Months
Last 12
Months
Jul-10
$ billion Flow Flow/TNA Return Flow Flow/TNA Return Flow Flow/TNA Return Total As
Convertible Arbitrage -0.4 -1.3% 0.9% -0.4 -1.1% 3.8% 2.1 6.0% 19.1% 3
Distressed Securities -0.5 -0.4% 0.3% 2.5 1.9% 1.5% 11.5 8.9% 16.2% 11
Emerging Markets -2.5 -1.3% 3.1% -3.3 -1.8% 3.4% 1.8 0.9% 24.7% 18
Equity Long Bias 1.1 0.7% 1.9% 5.8 4.0% -0.4% 8.8 6.1% 12.4% 14
Equity Long Only 0.2 0.4% 5.6% 2.2 3.8% -1.7% 2.9 5.0% 16.0% 6
Equity Long-Short -0.7 -0.4% 0.7% -4.1 -2.3% -0.9% 7.0 3.9% 5.9% 17
Equity Market Neutral 0.1 0.5% 0.0% -0.3 -0.9% -0.1% -0.3 -0.8% 1.3% 3
Event Driven 1.9 0.8% 0.2% 12.2 5.5% 1.7% 17.1 7.7% 16.4% 22
Fixed Income 2.0 1.2% 0.9% 3.5 2.2% 7.3% 7.2 4.5% 21.3% 16
Macro 0.3 0.3% -0.8% 2.2 2.4% -0.4% 6.1 6.5% 5.5% 9
Merger Arbitrage -0.2 -0.8% 1.1% 0.0 0.0% 2.3% 1.4 4.8% 7.7% 2
Multi-Strategy -2.0 -1.2% 0.5% -18.9 -11.4% 3.3% -30.6 -18.5% 11.7% 16
Other -0.8 -3.1% 0.2% -0.6 -2.1% 2.6% 1.2 4.7% 4.8% 2
Sector Specific -0.6 -0.7% 1.6% 0.3 0.3% -2.1% 2.9 3.4% 8.2% 8
Hedge Fund Industry -2.1 -0.1% 1.2% 1.2 0.1% 1.6% 39.0 2.5% 13.0% 152
Funds of Funds 4.5 0.9% 0.4% -5.2 -1.0% -0.3% -15.3 -2.9% 6.9% 52
CTAs 3.0 1.4% -0.2% 5.5 2.4% 3.1% 22.1 9.7% 4.7% 22
Direct Investment In HF -6.7 6.5 54.3
$ billionHedge Fund
IndustryFunds of Funds All CTAs
March-09 -25.1 -45.6 -4.38
April-09 -44.5 -26.1 -0.87
May-09 5.1 -9.2 -3.55
June-09 -7.2 -11.3 10.85
July-09 -18.2 -6.1 1.80
August-09 17.3 2.8 3.64
September-09 1.5 -6.9 3.99
October-09 6.4 -0.6 3.65
November-09 15.0 4.1 4.20
December-09 -2.5 -9.5 1.15
January-10 -14.9 -9.9 -1.18February-10 14.9 -0.6 -1.59
March-10 4.3 0.2 1.60
April-10 -2.5 -0.6 0.46
May-10 4.6 0.2 1.84
June-10 -3.1 0.8 1.35
July-10 -2.1 4.5 3.02
Hedge Fund Flows by Type

8/8/2019 Weekly Flow Report MF Study
http://slidepdf.com/reader/full/weekly-flow-report-mf-study 16/23
Weekly Flow ReportAugust 18, 2010Page 16 of 23
Copyright © 2010 TrimTabs Investment Research. All rights reserved.
Short Interest Flows – 1 of 1
All data are as of July 30, 2010
Short Interest Flow
$ billions Russell 3000 S&P 500 Large Core Large Growth Large Value Mid-Cap Core Mid-Cap Growth Mid-Cap Value Small Core Small Growth Small Va
2000 N/A 45.68 N/A N/A N/A N/A N/A N/A N/A N/A
2001 N/A 41.09 N/A N/A N/A N/A N/A N/A N/A N/A
2002 N/A 25.83 N/A N/A N/A N/A N/A N/A N/A N/A
2003 N/A -22.42 N/A N/A N/A N/A N/A N/A N/A N/A
2004 N/A -11.49 N/A N/A N/A N/A N/A N/A N/A N/A
2005 N/A 13.60 N/A N/A N/A N/A N/A N/A N/A N/A
2006 N/A 8.44 N/A N/A N/A N/A N/A N/A N/A N/A
2007 40.47 32.20 9.66 -9.59 6.82 12.50 1.69 11.65 0.98 1.36 6
2008 89.33 56.42 6.27 6.30 24.69 5.31 12.79 15.32 3.55 11.40 3
2009 -49.46 -32.62 -13.24 -8.95 -3.32 -4.88 -6.71 -2.82 -2.99 -3.44 -2
2010 9.46 4.92 1.98 2.96 1.44 -1.74 0.44 -2.09 3.12 3.00 0
Aug-09 -18.68 -11.26 -5.15 -2.81 -0.14 -2.74 -2.47 -1.58 -1.25 -1.37 -1
Sep-09 -7.87 -3.78 -2.20 1.27 -1.03 -1.18 -0.98 -1.37 -0.56 -0.99 -0
Oct-09 -9.44 -10.06 -2.46 -0.87 -4.60 -0.37 -0.99 -0.06 -0.55 -0.32 0
Nov-09 -2.37 -8.40 -0.34 -3.18 -4.31 -0.20 -0.33 1.26 1.44 1.75 1
Dec-09 -9.04 -4.30 -1.66 -2.13 3.63 -1.90 -0.77 -3.26 -0.69 -0.29 -1
Jan-10 0.96 -3.63 -3.25 -0.90 1.19 -0.05 -0.88 0.56 1.76 1.38 1
Feb-10 10.02 4.67 0.88 3.01 -1.60 1.25 1.45 1.14 0.73 1.84 1Mar-10 -6.16 -2.76 0.13 -3.13 1.43 0.10 -0.29 -2.19 -0.37 -0.67 -1
Apr-10 -11.00 -5.85 -0.84 -0.33 -0.83 -2.34 -2.53 -2.75 -0.60 -0.43 -0
May-10 -0.28 0.17 0.69 0.24 -0.18 -0.45 0.39 -0.11 0.06 0.33 -0
Jun-10 14.51 11.94 3.95 3.56 1.84 1.34 1.79 0.74 0.61 0.39 -0
Jul-10 1.41 0.38 0.42 0.51 -0.42 -1.59 0.50 0.52 0.93 0.16 0
3/31/2010 -8.16 -4.24 0.81 -3.32 0.16 -0.57 -1.59 -2.30 0.01 -0.64 -0
4/15/2010 0.05 -0.20 -0.07 0.27 0.00 0.07 -0.22 -0.14 0.13 0.16 0
4/30/2010 -11.05 -5.65 -0.77 -0.60 -0.83 -2.40 -2.31 -2.61 -0.72 -0.59 -0
5/14/2010 0.38 0.21 -0.14 0.09 0.00 -0.35 0.08 -0.01 0.47 0.57 -0
5/31/2010 -0.66 -0.04 0.83 0.15 -0.18 -0.10 0.32 -0.10 -0.42 -0.24 -0
6/15/2010 15.99 12.90 4.10 3.62 1.84 1.28 1.76 0.87 0.44 0.78 0
6/30/2010 -1.48 -0.96 -0.15 -0.06 0.00 0.06 0.03 -0.13 0.17 -0.40 -0
7/15/2010 3.08 0.64 1.11 0.65 -0.57 -1.01 0.98 0.20 0.85 0.47 0
7/30/2010 -1.67 -0.26 -0.69 -0.14 0.15 -0.58 -0.48 0.32 0.08 -0.31 0
Short interest data are available on a bi-weekly basis. All dates reflect the settlement date. Data becomes available around two weeks after settlement date.
Except for S&P 500, data starts from November 2007
$ billions Dollar Short Days to Cover Flow-Volume Dollar Short Days to Cover Flow-Volume Dollar Short Days to Cover Flow-Volume Dollar Short Days to Cover Flow-Vol
Consumer Discretionary 65.84 3.30 0.26% 65.51 3.05 0.33% 60.60 2.56 -0.20% 69.42 2.86 -0
Consumer Staples 21.92 2.66 0.10% 21.96 2.47 0.67% 20.94 2.18 0.62% 22.32 2.38 0
Energy 30.61 1.93 -0.56% 30.12 1.76 -0.56% 34.17 1.75 0.19% 38.76 1.96 0
Financials 67.61 2.88 -0.16% 66.17 2.62 -0.09% 64.20 2.22 -0.15% 70.19 2.14 -0
Health Care 39.34 2.97 0.44% 40.73 2.95 0.62% 41.42 2.72 0.66% 43.56 2.74 0
Industrials 43.38 3.28 0.13% 42.09 2.99 0.10% 39.85 2.56 -0.11% 44.24 2.76 -0
Information Technology 62.42 1.94 0.37% 65.13 1.90 0.46% 59.55 1.63 0.28% 66.08 1.76 0
Materials 16.13 2.19 -0.10% 15.82 1.94 -0.33% 14.94 1.63 -0.36% 16.67 1.74 -0
Telecommunications 6.02 2.36 0.23% 5.88 2.20 0.27% 5.64 1.98 0.21% 5.98 2.02 0
Utilities 11.83 3.59 0.71% 11.62 3.33 0.79% 10.69 2.79 0.62% 11.66 2.96 0
Short interest data are available on a bi-weekly basis. All dates reflect the settlement date. Data becomes available around two weeks after settlement date.
6/15/20106/30/20107/15/20107/30/2010
Short Interest by Sector
Ticker Name Ticker Name Ticker Name Ticker Name
FRX FOREST LABORATORIES INC FRX FOREST LABORATORIES INC GENZ GENZYME CORP MCK MCKESSON CORP
FIS FIDELITY NATIONAL INFORMATIO FIS FIDELITY NATIONAL INFORMATIO MCK MCKESSON CORP ESRX EXPRESS SCRIPTS INC
TIF TIFFANY & CO CEG CONSTELLATION ENERGY GROUP FRX FOREST LABORATORIES INC WPO WASHINGTON POST -CL BCEG CONSTELLATION ENERGY GROUP TIF TIFFANY & CO DHR DANAHER CORP FRX FOREST LABORATORIES INC
WPO WASHINGTON POST -CL B ESRX EXPRESS SCRIPTS INC JNS JANUS CAPITAL GROUP INC BDX BECTON DICKINSON & CO
PNW PINNACLE WEST CAPITAL VAR VARIAN MEDICAL SYSTEMS INC ESRX EXPRESS SCRIPTS INC CEG CONSTELLATION ENERGY GROUP
CPB CAMPBELL SOUP CO WPO WASHINGTON POST -CL B MDP MEREDITH CORP DHR DANAHER CORP
VAR VARIAN MEDICAL SYSTEMS INC CMA COMERICA INC SWY SAFEWAY INC TIF TIFFANY & CO
SVU SUPERVALU INC JCP J.C. PENNEY CO INC WPO WASHINGTON POST -CL B FIS FIDELITY NATIONAL INFORMATIO
CMS CMS ENERGY CORP AEP AMERICAN ELECTRIC POWER CTL CENTURYTEL INC CTL CENTURYTEL INC
Short interest data are available on a bi-weekly basis. All dates reflect the settlement date. Data becomes available around two weeks after settlement date.
Top 10 Highest Shorted Stocks by Flow-Volume Ratio6/15/20106/30/20107/15/20107/30/2010
8/8/2019 Weekly Flow Report MF Study
http://slidepdf.com/reader/full/weekly-flow-report-mf-study 17/23
Weekly Flow ReportAugust 18, 2010Page 17 of 23
Copyright © 2010 TrimTabs Investment Research. All rights reserved.
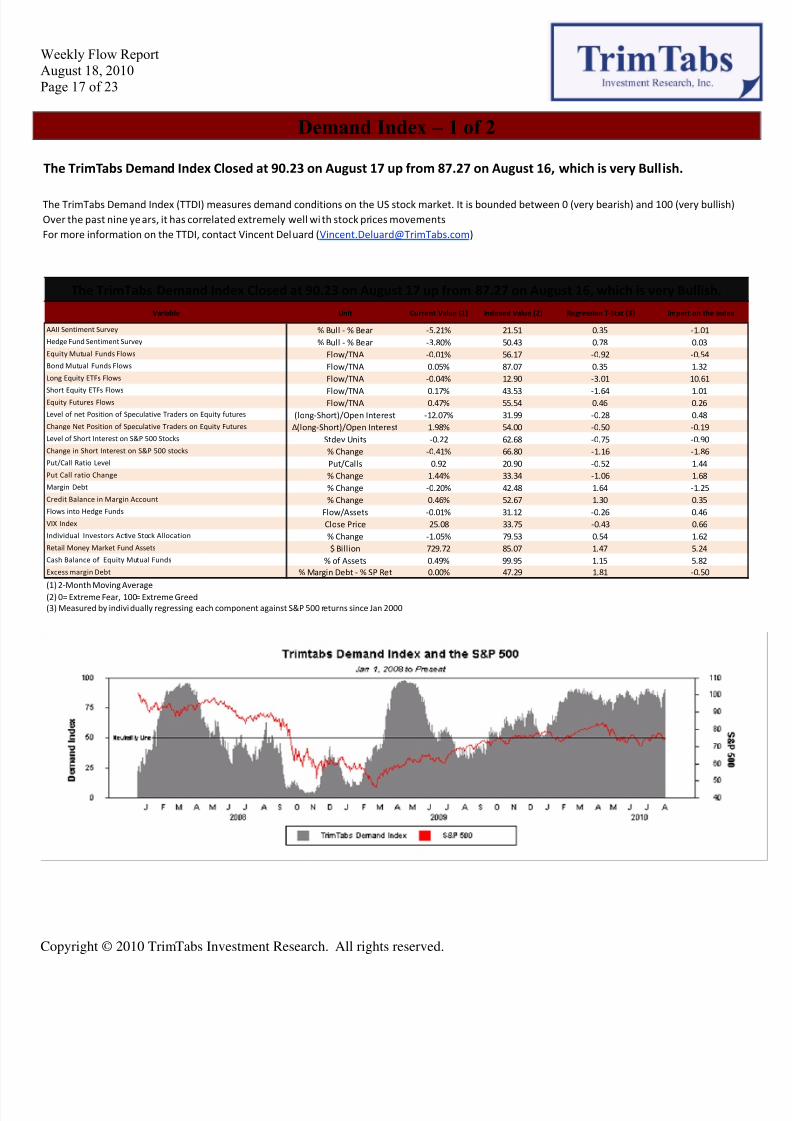
Demand Index – 1 of 2
The TrimTabs Demand Index Closed at 90.23 on August 17 up from 87.27 on August 16, which is very Bullish.
The TrimTabs Demand Index (TTDI) measures demand conditions on the US stock market. It is bounded between 0 (very bearish) and 100 (very bullish)
Over the past nine years, it has correlated extremely well wi th stock prices movements
For more information on the TTDI, contact Vincent Deluard ([email protected])
AAII Sentiment Survey % Bull - % Bear -5.21% 21.51 0.35 -1.01
Hedge Fund Sentiment Survey % Bull - % Bear -3.80% 50.43 0.78 0.03
Equity Mutual Funds Flows Flow/TNA -0.01% 56.17 -0.92 -0.54
Bond Mutual Funds Flows Flow/TNA 0.05% 87.07 0.35 1.32
Long Equity ETFs Flows Flow/TNA -0.04% 12.90 -3.01 10.61
Short Equity ETFs Flows Flow/TNA 0.17% 43.53 -1.64 1.01Equity Futures Flows Flow/TNA 0.47% 55.54 0.46 0.26
Level of net Position of Speculative Traders on Equity futures (long-Short)/Open Interest -12.07% 31.99 -0.28 0.48
Change Net Position of Speculative Traders on Equity Futures Δ(long-Short)/Open Interest 1.98% 54.00 -0.50 -0.19
Level of Short Interest on S&P 500 Stocks Stdev Units -0.22 62.68 -0.75 -0.90
Change in Short Interest on S&P 500 stocks % Change -0.41% 66.80 -1.16 -1.86
Put/Call Ratio Level Put/Calls 0.92 20.90 -0.52 1.44
Put Call ratio Change % Change 1.44% 33.34 -1.06 1.68
Margin Debt % Change -0.20% 42.48 1.64 -1.25
Credit Balance in Margin Account % Change 0.46% 52.67 1.30 0.35
Flows into Hedge Funds Flow/Assets -0.01% 31.12 -0.26 0.46
VIX Index Close Price 25.08 33.75 -0.43 0.66
Individual Investors Active Stock Allocation % Change -1.05% 79.53 0.54 1.62
Retail Money Market Fund Assets $ Billion 729.72 85.07 1.47 5.24
Cash Balance of Equity Mutual Funds % of Assets 0.49% 99.95 1.15 5.82
Excess margin Debt % Margin Debt - % SP Ret 0.00% 47.29 1.81 -0.50
(1) 2-Month Moving Average(2) 0= Extreme Fear, 100= Extreme Greed
(3) Measured by individually regressing each component against S&P 500 returns since Jan 2000
The TrimTabs Demand Index Closed at 90.23 on August 17 up from 87.27 on August 16, which is very Bullish.
Variable Unit Current Value (1) Indexed Value (2) Regression T-Stat (3) Impact on the Index
8/8/2019 Weekly Flow Report MF Study
http://slidepdf.com/reader/full/weekly-flow-report-mf-study 18/23
Weekly Flow ReportAugust 18, 2010Page 18 of 23
Copyright © 2010 TrimTabs Investment Research. All rights reserved.
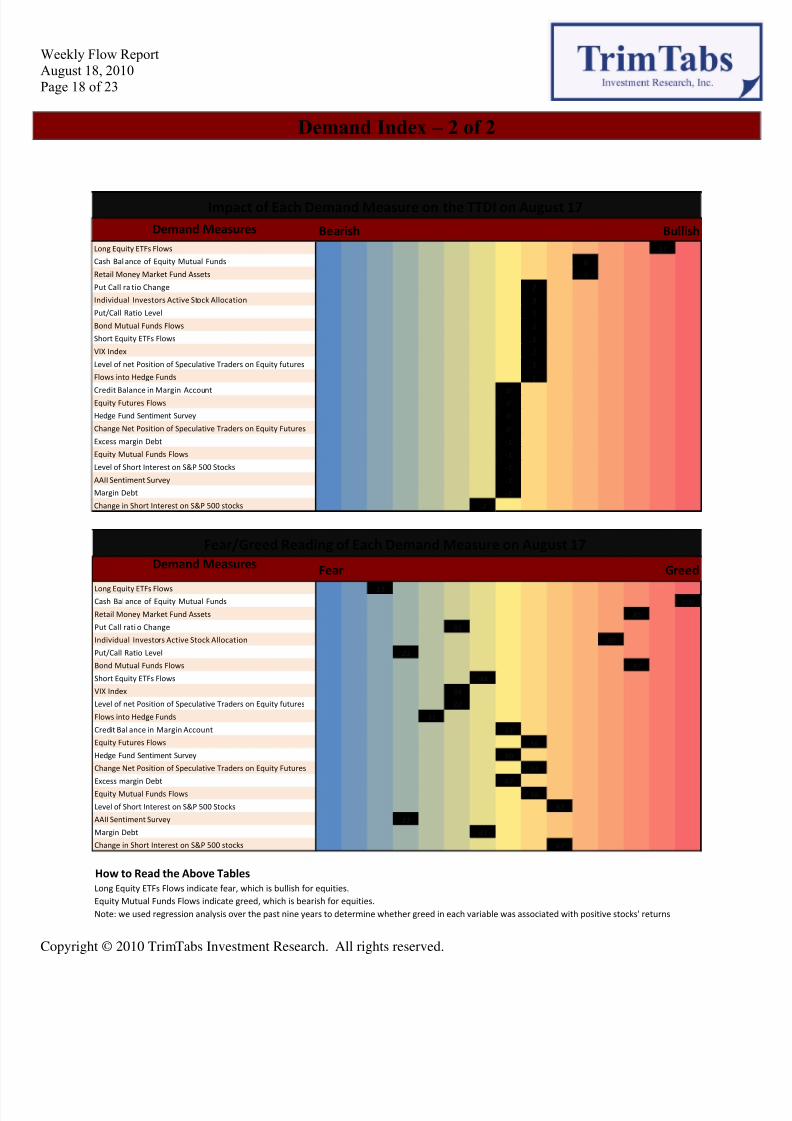
Demand Index – 2 of 2
Long Equity ETFs Flows 11
Cash Bal ance of Equity Mutual Funds 6
Retail Money Market Fund Assets 5
Put Call ra tio Change 2
Individual Investors Active Stock Allocation 2
Put/Call Ratio Level 1
Bond Mutual Funds Flows 1
Short Equity ETFs Flows 1
VIX Index 1
Level of net Position of Speculative Traders on Equity futures 1
Flows into Hedge Funds 1
Credit Balance in Margin Account 0
Equity Futures Flows 0
Hedge Fund Sentiment Survey 0
Change Net Position of Speculative Traders on Equity Futures 0
Excess margin Debt -1
Equity Mutual Funds Flows -1
Level of Short Interest on S&P 500 Stocks -1
AAII Sentiment Survey -1
Margin Debt -1
Change in Short Interest on S&P 500 stocks -2
Impact of Each Demand Measure on the TTDI on August 17
Demand Measures Bearish Bullish
Long Equity ETFs Flows 13
Cash Bal ance of Equity Mutual Funds 100
Retail Money Market Fund Assets 85
Put Call rati o Change 33
Individual Investors Active Stock Allocation 80
Put/Call Ratio Level 21
Bond Mutual Funds Flows 87
Short Equity ETFs Flows 44
VIX Index 34
Level of net Position of Speculative Traders on Equity futures 32
Flows into Hedge Funds 31
Credit Bal ance in Margin Account 53
Equity Futures Flows 56
Hedge Fund Sentiment Survey 50
Change Net Position of Speculative Traders on Equity Futures 54
Excess margin Debt 47
Equity Mutual Funds Flows 56
Level of Short Interest on S&P 500 Stocks 63
AAII Sentiment Survey 22
Margin Debt 43
Change in Short Interest on S&P 500 stocks 67
How to Read the Above TablesLong Equity ETFs Flows indicate fear, which is bullish for equities.
Equity Mutual Funds Flows indicate greed, which is bearish for equities.
Note: we used regression analysis over the past nine years to determine whether greed in each variable was associated with positive stocks' returns
Fear/Greed Reading of Each Demand Measure on August 17
Demand MeasuresFear Greed
8/8/2019 Weekly Flow Report MF Study
http://slidepdf.com/reader/full/weekly-flow-report-mf-study 19/23
Weekly Flow ReportAugust 18, 2010Page 19 of 23
Copyright © 2010 TrimTabs Investment Research. All rights reserved.
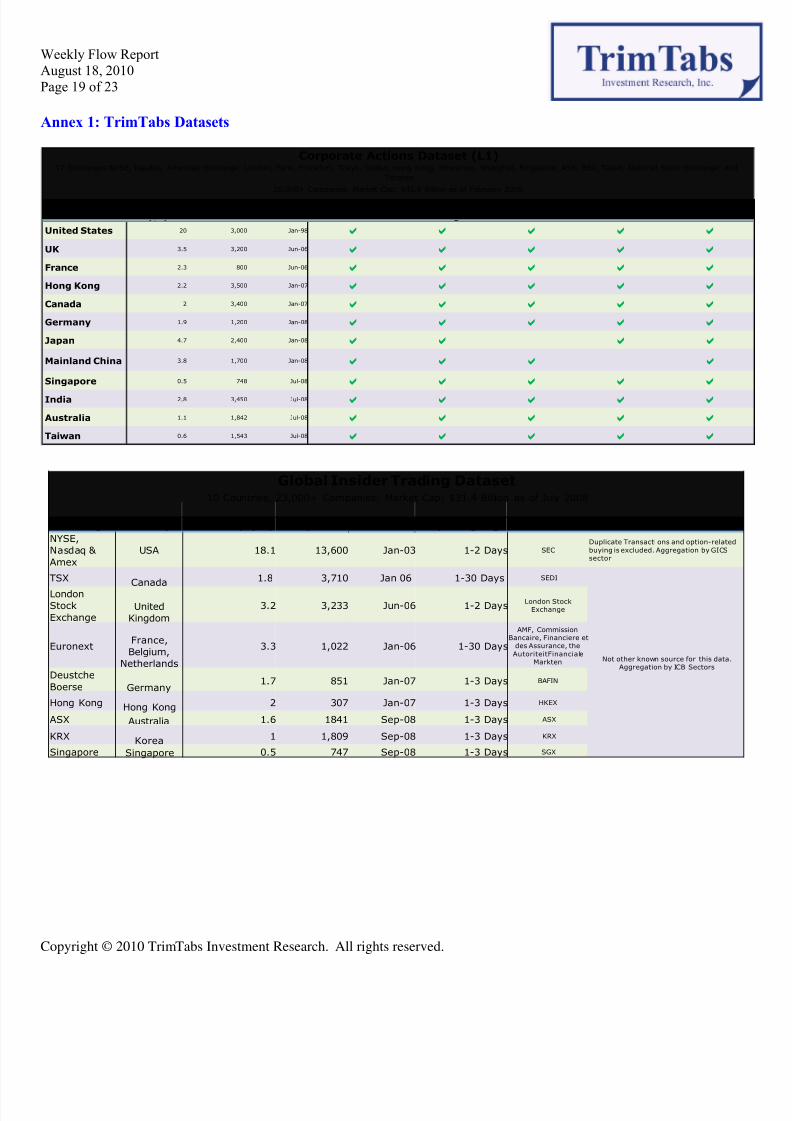
Annex 1: TrimTabs Datasets
CountryMarket Cap
($T)Companies Start Date IPOs
Secondary Equity
OfferingsInsider Selling Stock Buybacks Takeovers
United States 20 3,000 Jan-98 a a a a a
UK 3.5 3,200 Jun-06 a a a a a
France 2.3 800 Jun-06 a a a a a
Hong Kong 2.2 3,500 Jan-07 a a a a a
Canada 2 3,400 Jan-07 a a a a a
Germany 1.9 1,200 Jan-08 a a a a a
Japan 4.7 2,400 Jan-08 a a a a
Mainland China 3.8 1,700 Jan-08 a a a a
Singapore 0.5 748 Jul-08 a a a a a
India 2.8 3,450 Jul-08 a a a a a
Australia 1.1 1,842 Jul-08 a a a a a
Taiwan 0.6 1,543 Jul-08 a a a a a
Corporate Actions Dataset (L1)17 Exchanges:NYSE, Nasdaq, American Exchange, London, Paris, Frankfurt, Tokyo, Osaka, Hong Kong, Shenzhen, Shanghai, Singapore, ASX, BSX, Taipei, National Stock Exchange and
Toronto
26,000+ Companies, Market Cap: $45.4 Billion as of February 2008
Global Insider Trading Dataset10 Countries, 23,000+ Companies, Market Cap: $31.4 Billion as of July 2008
Exchange Country Market Cap ($T) Companies Start Date Reporting Lag Source Benefits of the Dataset
NYSE,
Nasdaq &
Amex
USA 18.1 13,600 Jan-03 1-2 Days SEC
Duplicate Transacti ons and option-related
buying is excluded. Aggregation by GICSsector
TSX Canada 1.8 3,710 Jan 06 1-30 Days SEDI
Not other known source for this data.Aggregation by ICB Sectors
London
Stock
ExchangeUnited
Kingdom
3.2 3,233 Jun-06 1-2 DaysLondon Stock
Exchange
EuronextFrance,
Belgium,
Netherlands
3.3 1,022 Jan-06 1-30 Days
AMF, CommissionBancaire, Financiere et
des Assurance, the
AutoriteitFinancialeMarkten
Deustche
Boerse Germany1.7 851 Jan-07 1-3 Days BAFIN
Hong Kong Hong Kong 2 307 Jan-07 1-3 Days HKEX
ASX Australia 1.6 1841 Sep-08 1-3 Days ASX
KRX Korea 1 1,809 Sep-08 1-3 Days KRX
Singapore Singapore 0.5 747 Sep-08 1-3 Days SGX

8/8/2019 Weekly Flow Report MF Study
http://slidepdf.com/reader/full/weekly-flow-report-mf-study 20/23
Weekly Flow ReportAugust 18, 2010Page 20 of 23
Copyright © 2010 TrimTabs Investment Research. All rights reserved.
*ICI tracks 7,280 funds with total net asset value of $8,057 billion on a monthly basis.
Fund Flows Dataset
Assets of $1.3 Tril. Daily and $13.2 Tril. Monthly
Fund Type Periodicity AUM ($ Billion) Fund Count Start Date Categorization Source Benefits of the Dataset
Mutual Funds Daily 6858% of total
2,168 Jan-98 Asset Class,Morningstar
Category
Daily SurveyOnly daily survey of mutual funds.Adjusted for dividends anddistribution. Smart categori zation
Mutual Funds Monthly11,900
80% of total15,163 Aug-07
Asset Class, Style,Industry, Retail vs
Insitiutional,Geographical Focus
Monthly Survey
Covers almost all US-listed mutualfunds. Predic ts the ICI number one
week in advance. Full transparencyand smart categorization
(breakdonw between retai l and
instituti onal funds)
ETFs Daily592
95% of total714 Jan-00
Asset Class, Style,Industry,
MorningstarCategory
Daily Survey
Covers almost all US-listed ETFs.
Regular updates for new ETFslistings. Smart ca tegoriza tion: GICS
industry, short vs long ETFs,futures-related, etc
Hedge FundsMonthly, one
month inarrear
61133% of total
4,313 Jan-0013 Strategies and
SizeBarclayHedge
Database
Covers one thi rd of the hedge funduniverse. Monthly update while
indusrtry generally providesstatistics on an annual basis.
Funds of Funds
Monthly, onemonth in
arrear
36736% of total
2,570 Jan-00 SizeBarclaHedge
Database
Covers one thi rd of the hedge fund
universe. Monthly update whileindusrtry generally provides
statistics on an annual basis.
Commodity-Traded
Advisors
Monthly, onemonth in
arrear
36180% of total
2,134 Jan-00 Strategy and SizeBarclayHedge
database
Covers one thi rd of the hedge fund
universe. Monthly update whileindusrtry generall y provides
statistics on an annual basis.
Futures and Short Interest DatasetAssets of $323 Bn Daily
Data Type Periodicity AUM ($ Billion) Start Date Categorization Source Benefits of the Dataset
S&P 500Futures
Daily 184 Jan-84 Maturity CMEData Aggregated over All Contracts."Money flows" are adjusted for roll-over between contracts
E-Minis Daily 139 Jan 96 Maturity CMEData Aggregated over All Contracts."Money flows" are adjusted for roll-over between contracts
Crude OilFutures
Daily 270 Jul-08 NYMEX, ICE,DME
Data Aggregated over All Contracts.
"Money flows" are adjusted for roll-over between contracts
Commitmentof Traders
Bi-Weekly 611 Jan-00
Currency, Equity,
Commodity,
Interest Rates
CFTC
Covers 4,313 contracts.Aggregation over relevant contractgroups. Can be crossed-matched withmoney flows into equity contracts.
Short Interest Bi-Weekly 21,000 Jan-00
GICS Sector, Style
and Size, Major
Indices
Nasdaq &
NYSE
Aggregation over equity indices andETFs. Covers all US-listed stocks.

8/8/2019 Weekly Flow Report MF Study
http://slidepdf.com/reader/full/weekly-flow-report-mf-study 21/23
Weekly Flow ReportAugust 18, 2010Page 21 of 23
Copyright © 2010 TrimTabs Investment Research. All rights reserved.
Annex 2: Library of Research Notes
Library of Research NotesTopic Variable Market Title Summary Date Updated
Corporate Liquidity
L1 USRegression Analysis Confirms L1
Can Predict the Direction of the S&P500
Regression Analysis shows thatweekly L1 is a statistical lysignificant determinant of market returns since 1999
January 2008
Buybacks USTo What Extent Do Buybacks Benefit
Shareholders?
Companies with large buybacks
tend to outperfrom in the yearfollowing the buybackannounncement. The
outperformance is greatest for
companies which do shrink the
float.
September 2008
L1 US Introducing the TrimTabs L1 Index
TrimTabs introduces a newproprietary L1 Index to hel p
more easily interpret L1, thekey indicator of supply sideequity market liquidity.
January 2008
Sector Rotation
L1 / Insider Transactions USUsing L1 and Insider Trading Data
to Rotate Between Industries (GICS1)
L1 and insider transaction dataaggregated at the GICS 1 levelcan help ide ntify outperformingsectors. Investors can achieve
alpha on both the long and
short side.
May 2008
L1 / Insider Transactions USUsing L1 and Insider Trading Datato Rotate Between Industry groups
(GICS 2)
L1 and insider transaction dataaggregated at the GICS 2 levelcan help identi fy outperformingsectors. Investors can achieve
alpha on both the long and
short side.
September 2008
Buybacks / InsiderTransaction
United Kingdom Sector Rotation Models on the LSE
Buybacks a nd insidertransactions can be using to
identify ooutperforming sectorson the London stock Exchange
July 2008
Flows
Flows into Equity Futures US Futures Flows PresentationFlows into equity futures havebeen highly correlated tomarket volatility since 1986
July 2008
Short Interest US
Deve lopment and portfolio levelbacktesting of a short interest flow
based indicator for the S&P 500stocks
Definition and backtesting of the short interest flow volumeratio indicator for constructing
portfolios of heavily shortedequity assets at the stock,
GICS I, and GICS II levels.
August 2008
8/8/2019 Weekly Flow Report MF Study
http://slidepdf.com/reader/full/weekly-flow-report-mf-study 22/23
Weekly Flow ReportAugust 18, 2010Page 22 of 23
Copyright © 2010 TrimTabs Investment Research. All rights reserved.
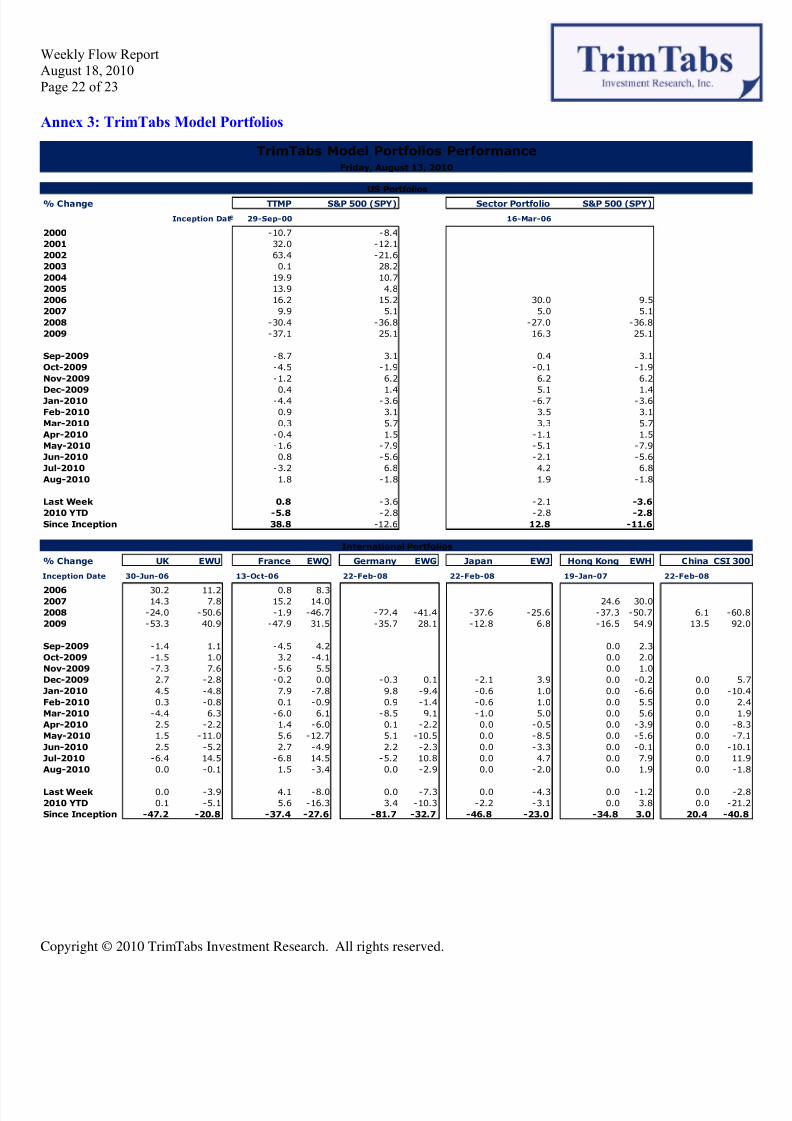
Annex 3: TrimTabs Model Portfolios
TrimTabs Model Portfolios Performance
US Portfolios
% Change TTMP S&P 500 (SPY) Sector Portfolio S&P 500 (SPY)
Inception Dat 29-Sep-00 16-Mar-06
2000 -10.7 -8.4
2001 32.0 -12.1
2002 63.4 -21.6
2003 0.1 28.2
2004 19.9 10.7
2005 13.9 4.8
2006 16.2 15.2 30.0 9.5
2007 9.9 5.1 5.0 5.1
2008 -30.4 -36.8 -27.0 -36.8
2009 -37.1 25.1 16.3 25.1
Sep-2009 -8.7 3.1 0.4 3.1
Oct-2009 -4.5 -1.9 -0.1 -1.9
Nov-2009 -1.2 6.2 6.2 6.2
Dec-2009 0.4 1.4 5.1 1.4Jan-2010 -4.4 -3.6 -6.7 -3.6
Feb-2010 0.9 3.1 3.5 3.1
Mar-2010 0.3 5.7 3.3 5.7
Apr-2010 -0.4 1.5 -1.1 1.5
May-2010 -1.6 -7.9 -5.1 -7.9
Jun-2010 0.8 -5.6 -2.1 -5.6
Jul-2010 -3.2 6.8 4.2 6.8
Aug-2010 1.8 -1.8 1.9 -1.8
Last Week 0.8 -3.6 -2.1 -3.6
2010 YTD -5.8 -2.8 -2.8 -2.8
Since Inception 38.8 -12.6 12.8 -11.6
International Portfolios
% Change UK EWU France EWQ Germany EWG Japan EWJ Hong Kong EWH China CSI 30
Inception Date 30-Jun-06 13-Oct-06 22-Feb-08 22-Feb-08 19-Jan-07 22-Feb-08
2006 30.2 11.2 0.8 8.32007 14.3 7.8 15.2 14.0 24.6 30.0
2008 -24.0 -50.6 -1.9 -46.7 -72.4 -41.4 -37.6 -25.6 -37.3 -50.7 6.1 -60
2009 -53.3 40.9 -47.9 31.5 -35.7 28.1 -12.8 6.8 -16.5 54.9 13.5 92
Sep-2009 -1.4 1.1 -4.5 4.2 0.0 2.3
Oct-2009 -1.5 1.0 3.2 -4.1 0.0 2.0
Nov-2009 -7.3 7.6 -5.6 5.5 0.0 1.0
Dec-2009 2.7 -2.8 -0.2 0.0 -0.3 0.1 -2.1 3.9 0.0 -0.2 0.0 5
Jan-2010 4.5 -4.8 7.9 -7.8 9.8 -9.4 -0.6 1.0 0.0 -6.6 0.0 -10
Feb-2010 0.3 -0.8 0.1 -0.9 0.9 -1.4 -0.6 1.0 0.0 5.5 0.0 2
Mar-2010 -4.4 6.3 -6.0 6.1 -8.5 9.1 -1.0 5.0 0.0 5.6 0.0 1
Apr-2010 2.5 -2.2 1.4 -6.0 0.1 -2.2 0.0 -0.5 0.0 -3.9 0.0 -8
May-2010 1.5 -11.0 5.6 -12.7 5.1 -10.5 0.0 -8.5 0.0 -5.6 0.0 -7
Jun-2010 2.5 -5.2 2.7 -4.9 2.2 -2.3 0.0 -3.3 0.0 -0.1 0.0 -10
Jul-2010 -6.4 14.5 -6.8 14.5 -5.2 10.8 0.0 4.7 0.0 7.9 0.0 11
Aug-2010 0.0 -0.1 1.5 -3.4 0.0 -2.9 0.0 -2.0 0.0 1.9 0.0 -1
Last Week 0.0 -3.9 4.1 -8.0 0.0 -7.3 0.0 -4.3 0.0 -1.2 0.0 -2
2010 YTD 0.1 -5.1 5.6 -16.3 3.4 -10.3 -2.2 -3.1 0.0 3.8 0.0 -21
Since Inception -47.2 -20.8 -37.4 -27.6 -81.7 -32.7 -46.8 -23.0 -34.8 3.0 20.4 -40
Friday, August 13, 2010

8/8/2019 Weekly Flow Report MF Study
http://slidepdf.com/reader/full/weekly-flow-report-mf-study 23/23
Weekly Flow ReportAugust 18, 2010Page 23 of 23
Copyright © 2010 TrimTabs Investment Research All rights reserved
The TrimTabs Family of Products
Forfurther coverage of liquidity and macroeconomic trends, please refer to the following TrimTabs products:
- Daily Liquidity Report (Monday through Friday)- Overnight Liquidity Update (Monday through Thursday)- Weekly International Liquidity Review (Monday)- Weekly Macro Analysis (Tuesday)- Weekly Flow Report (Wednesday)- Sector Liquidity (every other Thursday)
Legal DisclaimerThe data and analysis contained herein are provided "as is" and without warranty of any kind, either expressed or implieTrimTabs Investment Research (TTIR) any affiliates or employees, or any third party data provider, shall not have anliability for any loss sustained by anyone who has relied on the information contained in any TTIR publication. All opinionexpressed herein are subject to change without notice, and you should always obtain current information and perform du
diligence before trading. TTIR accounts that TTIR or its affiliated companies manage, or their respective shareholdedirectors, officers and/or employees, may have long or short positions in the securities discussed herein and may purchase osell such securities without notice. TTIR uses various methods to evaluate investments, which may, at times, producontradictory recommendations with respect to the same securities. When evaluating the results of prior TTIrecommendations or TTIR performance rankings, one should also consider that TTIR may modify the methods it uses tevaluate investment opportunities from time to time. For this and for many other reasons, the performance of TTIR's parecommendations is not a guarantee of future results. The securities mentioned in this document may not be eligible for salin some states or countries, nor be suitable for all types of investors; their value and income they produce may fluctuaand/or be adversely affected by exchange rates, interest rates or other factors. TTIR has an investment management affiliaTrimTabs Asset Management (TTAM) which actively invests in highly liquid ETF securities which are sometimes similar identical to those tracked in the TTIR model portfolio and sometimes different. The portfolio trades held by TTAM will nalways be the same as those recommended by TTIR, primarily because the TTIR trade recommendations are updated week
while TTAM portfolios are managed on a daily basis as conditions change. Due to the highly liquid nature of ETF securititracked by TTIR, TrimTabs does not believe there is the potential for conflicts of interest. Further distribution prohibitwithout prior permission. Copyright 2009 © TrimTabs Investment Research. All rights reserved.