weekly market report - files.irwebpage.comfiles.irwebpage.com/reports/shipping/0ygu35tu0z/intermodal...
TRANSCRIPT

Broker’s insight by Nikos Papantonopoulos
Elabora�ng further on last week's report regarding game theory in shipping
and how it can affect the shipping market according to the decisions made by
ship owners, it’s interes�ng to examine the influence of shipping pools on
the market with par�cular focus on the VLCC market because as it comprises
of more limited number of vessels and charterers, the results are more than
conspicuous.
Over the past two years there has been a growth of demand in the AG mar-
ket which has varied between 25% - 30%, while the total growth of supply
has been around 10%. It looks like a booming market but numbers don't
always reveal all. The 10% fleet growth was achieved thanks to a heavy
scrapping programming which has been undertaken since 2009, culmina�ng
in 2011 were we even started to see as young as 16 years old vessels exi�ng
the market. At the same �me, on the demand side we have only just man-
aged to see global crude oil trade volume match and surpass its pre-crisis
levels. Nevertheless, the TCE for early February fixtures was at around 17k-
18k USD per day while today it is almost 3 �mes that. We have even started
to see fixtures in the WS 70’s range for Eastbound voyages. What could have
possibly lead to such a sudden recovery in freight rates?
As you may have guessed, the Nova Tankers pool started its opera�ons. This
new VLCC pool has collected vessels from its partners Mitsui O.S.K. lines,
Phoenix tankers, Maersk tankers, Samco Shipholding and Ocean Tankers.
They are opera�ng less than 10% of the total fleet but we are observing that
the impact of their ac�on had a appreciable change on market levels. We
fully understand the argument that the start of the pool's opera�ons is not
the only reason for this improvement in rates; however nobody can deny
that the pool created a balance between orders and spot vessels in the AG.
As you know, the key factor for this rise is that the pool is able to provide
owners with extra bargaining power by “hiding” some spot vessels as well as
“presen�ng” fewer in each main trading area (i.e AG and USG). On the other
hand, if more and more owners put their vessels in pools, then they will fail
to secure as aErac�ve a return because in order to fix a tanker on a higher
rate they also need to simultaneously cover 3 or 4 hidden spot vessels. As
such it could prove to be more beneficiary for an owner to be in a market
where there is a pool but he himself is outside it.
The rela�onship therefore between owners and pools is reversely correlated
with shipping market's cycle because reaching the upper side of a cycle, own-
ers will be keen to leave the pool in order to maximize their return from the
firm spot market. Their exit from the pool will increase the compe��on, as
owners are no longer working coopera�vely, and as such freight rates will
drop. It is usually during the downturns of the shipping cycle were owners
will be distressed again due to low rates and keen to operate within a pool in
an effort to survive.
In conclusion, I would like to men�on that pools are not enough to correct
the market but they help beEer organize the efforts of owners and keep
freight rates at more manageable levels during downturns. It’s not like own-
ers rediscovered the wheel....but at the end of the day its one more arrow
leH in one's quiver..
Chartering (Wet: Stable+ / Dry: Stable- )
With The Atlan�c being fairly subdued this week due to the Catholic
Easter Holidays, much of the Dry Bulk market started to slide considera-
bly as the Pacific proved incapable of dealing with the task of fully sup-
por�ng the current market. The only excep�on was seen in the Capesize
sector were we saw a slight firming of rates thanks to a renewed inter-
est and fairly �ghter tonnage lists all around. The BDI closed today
(10/04/2012) at 928 points, on par with its closure on Thursday
(05/04/2012) and a decrease of 6 points compared to the previous Fri-
day’s levels (30/03/2012). Crude Oil Carriers have proven to s�ll be on a
firm recovery path this week, with some gains noted on freight earnings
despite the notable pressure brought about by the s�ll increasing bun-
ker prices. The BDTI Thursday (05/04/2012), was at 820, 1 point up and
the BCTI at 639, a decrease of 6 points compared to the previous Mon-
day’s levels (02/04/2012).
Sale & Purchase (Wet: So"er- / Dry: So"er- )
As expected ac�vity dropped further this past week as few buyers had
keen interest to close any units in haste over the Easter holidays, while
many are s�ll delaying any investment decisions in an effort as it seems
to get beEer clarity with regards to market direc�on and prospects. On
the Tankers side, we saw the sale of the Aframax “Morning Glo-
ry” (98,743dwt-blt 96 Japan) which reportedly went to Malaysian con-
version buyers for a price of $ 16.6m. This is equivalent to around $
27.5m each. While on the dry bulker of interest was the reported sale of
the Handymax “Ocean Sunrise” (48,203dwt-blt 99 Japan) which went to
Middle Eastern buyers for a price of $ 13.4m basis Dry Dock surveys
freshly passed.
Newbuilding (Wet: Stable- / Dry: Stable- )
Not much reported ac�vity this week, with most of the surfaced deals
being under nego�a�ons from a while back. What's more, is that we are
likely to see slow ac�vity up un �ll and including next Monday
(16/04/2012) as the Greek Orthodox Easter falls one week aHer the
Catholic one this year. This means that many of the Greek Owners which
could poten�ally be contempla�ng a new building order, are likely to
hold back and refrain any further nego�a�ons un�l aHer the holydays.
In terms of reported deals this week, most notable was the reported
order placed by Israeli Ray Shipping for four firm Supramax (56,000dwt)
bulkers at S.Korea’s Hyundai Mipo for a reported price of $ 25.0m each.
Demoli&on (Wet: Stable- / Dry: Stable- )
Things con�nue to be under pressure as overall demand from the Indian
Sub-con�nent s�ll lags behind the excessive supply of demo candidates
in the market. Things could soHen further as steel prices show liEle
promise of rapidly firming up over the next couple of days. Chinese
breakers are s�ll lagging behind, though recent bids have been looking
fairly promising and buyers have been taking a more compe��ve ap-
proach. Prices overall held stable this week, with wet tonnages reaching
levels of around 435-485$/ldt and dry units falling to about 420-465$/
ldt.
Weekly Market Report
Week 14|Tuesday 10th April 2012
© Intermodal Research 10/04/2012 2
6080
100120140160180200220240260
WS poin
ts
CLEAN - WS RATESTC2 TC4 TC6 TC1
20
40
60
80
100
120
140
160
WS poin
ts
DIRTY - WS RATESTD3 TD5 TD8 TD4
Apr-12 Mar-12 ±% 2012 2011 2010
300KT DH 63.0 63.0 0.0% 64.0 77.6 87.2
150KT DH 44.5 44.5 0.0% 46.4 54.4 62.6
105KT DH 30.0 32.0 -6.3% 34.2 39.1 44.7
70KT DH 26.0 27.6 -5.8% 29.4 35.2 38.8
45KT DH 25.4 25.4 0.0% 25.8 28.4 26.5
Aframax
Panamax
VLCC
Suezmax
Indicative Market Values ($ Million) - Tankers
Vessel 5yrs old
MR
Week 14 Week 13 ±% Diff 2012 2011
300k 1yr TC 22,500 21,500 4.7% 1000 20,536 25,197
300k 3yr TC 29,000 29,000 0.0% 0 26,361 31,681
150k 1yr TC 17,500 17,000 2.9% 500 16,464 19,837
150k 3yr TC 21,500 19,500 10.3% 2000 19,986 23,830
105k 1yr TC 14,250 14,250 0.0% 0 13,982 15,707
105k 3yr TC 16,500 16,500 0.0% 0 16,200 18,335
70k 1yr TC 13,000 13,500 -3.7% -500 13,214 14,995
70k 3yr TC 14,500 14,750 -1.7% -250 14,432 16,263
45k 1yr TC 14,750 14,750 0.0% 0 14,429 13,918
45k 3yr TC 15,250 15,250 0.0% 0 14,879 14,738
36k 1yr TC 13,000 13,000 0.0% 0 12,482 12,471
36k 3yr TC 13,500 13,500 0.0% 0 13,200 13,412
Panamax
MR
Handy
size
TC Rates
$/day
VLCC
Suezmax
Aframax
2012 2011
WS
points$/day
WS
points$/day $/day $/day
265k AG-JAPAN 70 51,111 70 54,593 0% 33,278 18,217
280k AG-USG 43 11,931 40 10,964 6% 4,529 2,504
260k WAF-USG 70 43,460 65 45,719 8% 43,794 25,714
130k MED-MED 80 20,244 80 24,001 0% 31,447 25,125
130k WAF-USAC 75 13,215 75 14,144 0% 19,815 13,373
130k AG-CHINA 80 18,275 80 19,666 0% 23,188 14,815
80k AG-EAST 100 10,625 100 11,987 0% 13,877 12,726
80k MED-MED 90 15,329 90 12,230 0% 15,431 13,577
80k UKC-UKC 100 20,930 90 14,841 11% 19,446 18,604
70k CARIBS-USG 95 2,698 100 7,658 -5% 14,753 8,240
75k AG-JAPAN 85 1,279 85 1,679 0% 2,882 10,467
55k AG-JAPAN 105 3,175 105 3,573 0% 2,592 7,768
37K UKC-USAC 135 6,800 135 7,115 0% 12,189 11,022
30K MED-MED 140 10,396 143 14,574 -2% 18,409 18,458
55K UKC-USG 125 13,590 120 12,226 4% 13,605 11,266
55K MED-USG 118 9,268 120 10,416 -2% 11,037 9,676
50k CARIBS-USAC 135 9,208 145 17,015 -7% 13,018 10,700
Spot Rates
Vessel Routes
Week 14 Week 13
±%
Dir
tyA
fram
axC
lean
VLC
CS
ue
zmax
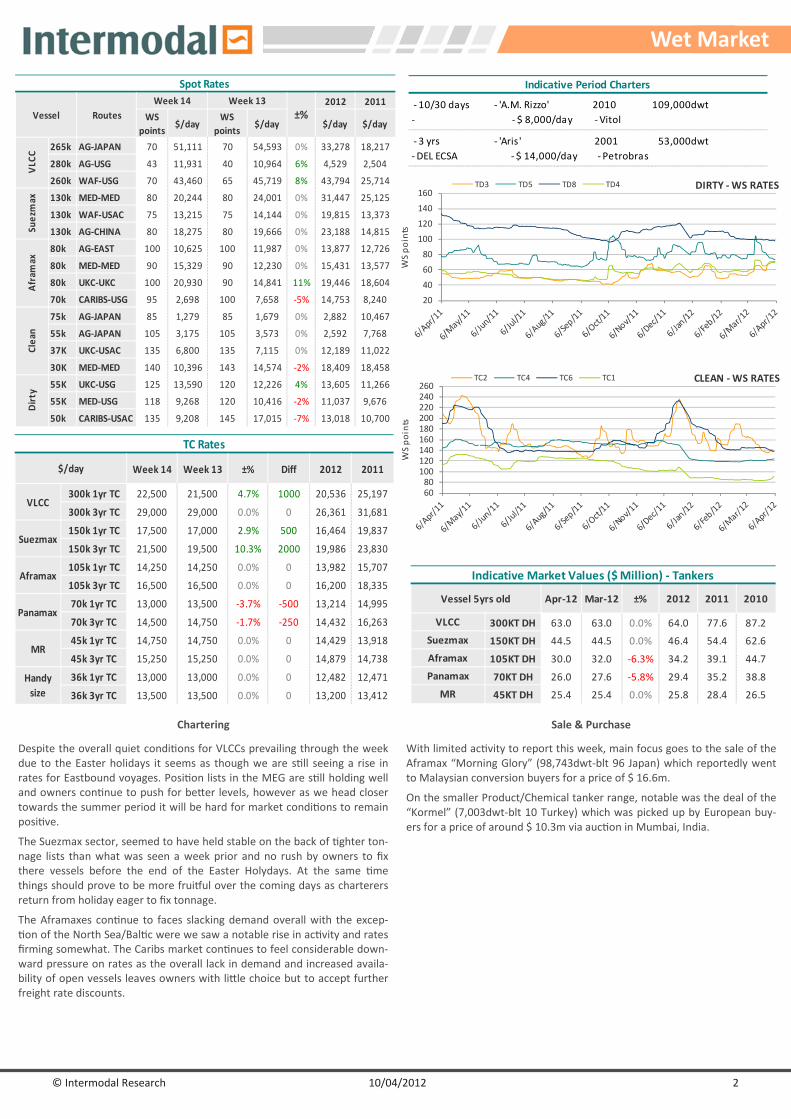
Chartering
Despite the overall quiet condi�ons for VLCCs prevailing through the week
due to the Easter holidays it seems as though we are s�ll seeing a rise in
rates for Eastbound voyages. Posi�on lists in the MEG are s�ll holding well
and owners con�nue to push for beEer levels, however as we head closer
towards the summer period it will be hard for market condi�ons to remain
posi�ve.
The Suezmax sector, seemed to have held stable on the back of �ghter ton-
nage lists than what was seen a week prior and no rush by owners to fix
there vessels before the end of the Easter Holydays. At the same �me
things should prove to be more fruiRul over the coming days as charterers
return from holiday eager to fix tonnage.
The Aframaxes con�nue to faces slacking demand overall with the excep-
�on of the North Sea/Bal�c were we saw a notable rise in ac�vity and rates
firming somewhat. The Caribs market con�nues to feel considerable down-
ward pressure on rates as the overall lack in demand and increased availa-
bility of open vessels leaves owners with liEle choice but to accept further
freight rate discounts.
Sale & Purchase
With limited ac�vity to report this week, main focus goes to the sale of the
Aframax “Morning Glory” (98,743dwt-blt 96 Japan) which reportedly went
to Malaysian conversion buyers for a price of $ 16.6m.
On the smaller Product/Chemical tanker range, notable was the deal of the
“Kormel” (7,003dwt-blt 10 Turkey) which was picked up by European buy-
ers for a price of around $ 10.3m via auc�on in Mumbai, India.
Wet Market
Indicative Period Charters
- 10/30 days - 'A.M. Rizzo' 2010 109,000dwt
- - $ 8,000/day - Vitol
- 3 yrs - 'Aris' 2001 53,000dwt
- DEL ECSA - $ 14,000/day - Petrobras
© Intermodal Research 10/04/2012 3
Index $/day Index $/day Index Index
BDI 928 934 -0.6% -6 871 1,549
BCI 1,507 $6,205 1,412 $5,188 6.7% 95 1,578 2,237
BPI 1,036 $8,277 1,051 $8,398 -1.4% -15 1,002 1,749
BSI 949 $9,928 1,030 $10,767 -7.9% -81 840 1,377
BHSI 547 $8,305 565 $8,572 -3.2% -18 471 718
30/03/12
Baltic IndicesWeek 14
06/04/12
Week 13
±%2012 2011Point
Diff
0
1,000
2,000
3,000
4,000
5,000
Index
Baltic Indices
BCI BPI BSI BHSI BDI
170K 6mnt TC 13,750 12,500 10% 1,250 14,280 18,474
170K 1yr TC 15,000 14,750 2% 250 16,343 17,138
170K 3yr TC 16,250 16,250 0% 0 17,200 17,599
70K 6mnt TC 13,125 13,250 -1% -125 12,566 17,238
70K 1yr TC 11,000 11,250 -2% -250 11,245 14,863
70K 3yr TC 12,375 12,250 1% 125 11,986 14,500
52K 6mnt TC 12,500 13,000 -4% -500 11,361 15,587
52K 1yr TC 11,750 12,000 -2% -250 11,093 14,308
52K 3yr TC 12,500 12,500 0% 0 12,164 14,046
45k 6mnt TC 11,250 11,250 0% 0 9,468 13,416
45k 1yr TC 10,500 11,000 -5% -500 9,218 12,450
45k 3yr TC 10,500 10,500 0% 0 10,218 12,403
30K 6mnt TC 9,000 9,000 0% 0 8,111 11,712
30K 1yr TC 9,250 9,250 0% 0 8,450 11,787
30K 3yr TC 10,000 10,000 0% 0 10,236 12,044
Ha
nd
yma
xH
an
dy
size
Period
2011
Pa
nam
axSu
pra
ma
x
Week
14
Week
13
Cap
esi
ze
2012$/day ±% Diff
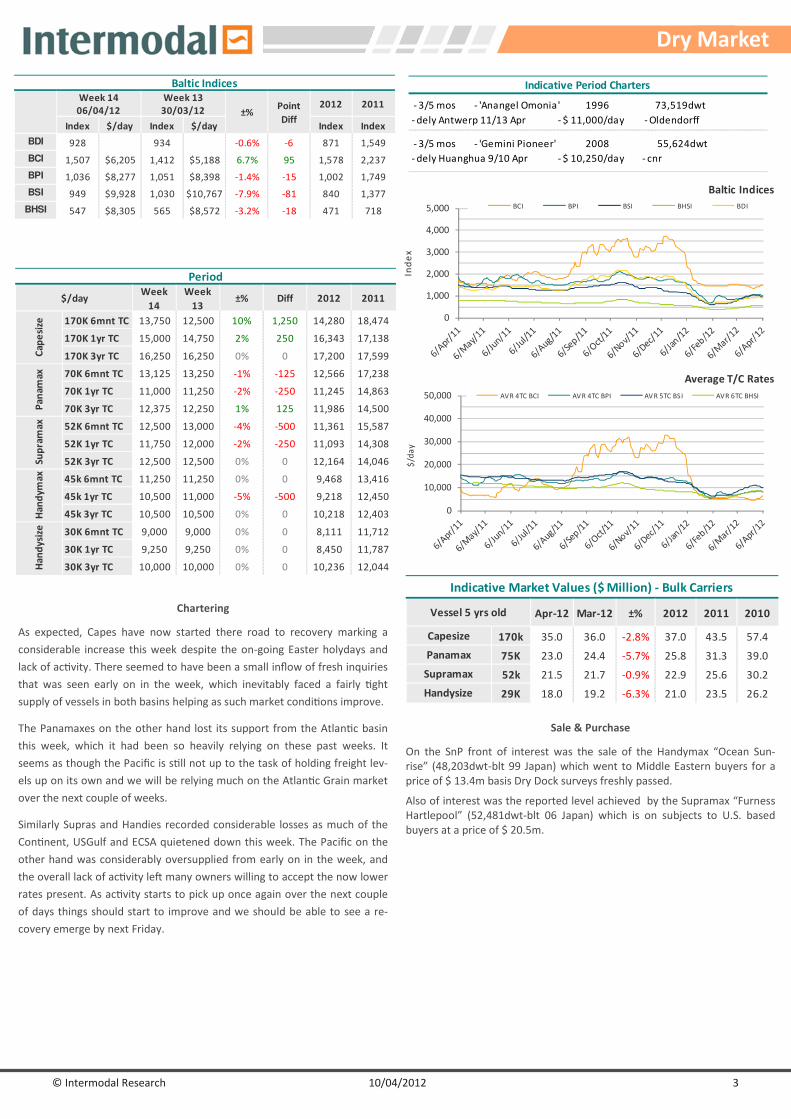
Chartering
As expected, Capes have now started there road to recovery marking a
considerable increase this week despite the on-going Easter holydays and
lack of ac�vity. There seemed to have been a small inflow of fresh inquiries
that was seen early on in the week, which inevitably faced a fairly �ght
supply of vessels in both basins helping as such market condi�ons improve.
The Panamaxes on the other hand lost its support from the Atlan�c basin
this week, which it had been so heavily relying on these past weeks. It
seems as though the Pacific is s�ll not up to the task of holding freight lev-
els up on its own and we will be relying much on the Atlan�c Grain market
over the next couple of weeks.
Similarly Supras and Handies recorded considerable losses as much of the
Con�nent, USGulf and ECSA quietened down this week. The Pacific on the
other hand was considerably oversupplied from early on in the week, and
the overall lack of ac�vity leH many owners willing to accept the now lower
rates present. As ac�vity starts to pick up once again over the next couple
of days things should start to improve and we should be able to see a re-
covery emerge by next Friday.
Sale & Purchase
On the SnP front of interest was the sale of the Handymax “Ocean Sun-
rise” (48,203dwt-blt 99 Japan) which went to Middle Eastern buyers for a
price of $ 13.4m basis Dry Dock surveys freshly passed.
Also of interest was the reported level achieved by the Supramax “Furness
Hartlepool” (52,481dwt-blt 06 Japan) which is on subjects to U.S. based
buyers at a price of $ 20.5m.
0
10,000
20,000
30,000
40,000
50,000
$/d
ay
Average T/C Rates
AVR 4TC BCI AVR 4TC BPI AVR 5TC BSI AVR 6TC BHSI
Apr-12 Mar-12 ±% 2012 2011 2010
170k 35.0 36.0 -2.8% 37.0 43.5 57.4
75K 23.0 24.4 -5.7% 25.8 31.3 39.0
52k 21.5 21.7 -0.9% 22.9 25.6 30.2
29K 18.0 19.2 -6.3% 21.0 23.5 26.2Handysize
Capesize
Panamax
Supramax
Indicative Market Values ($ Million) - Bulk Carriers
Vessel 5 yrs old
Dry Market
Indicative Period Charters
- 3/5 mos - 'Anangel Omonia' 1996 73,519dwt
- dely Antwerp 11/13 Apr - $ 11,000/day - Oldendorff
- 3/5 mos - 'Gemini Pioneer' 2008 55,624dwt
- dely Huanghua 9/10 Apr - $ 10,250/day - cnr
© Intermodal Research 10/04/2012 4
Secondhand Sales
Size Name Dwt Built Yard M/E SS due Hull Price Buyers Comments
AFRA MORNING GLORY 98,743 1996 ONOMICHI, Japan B&W Mar-16 DH $ 16.6m Malays ian for convers ion
PROD/
CHEMARISTOFANIS 12,000 2005
PLA 4807 SHIPYARD,
ChinaMAN-B&W May-15 DH $ 10.0m undisclosed Epoxy coated
PROD/
CHEMKORMEL 7,003 2010
UMO GEMI SANAYI
VE TIC, TurkeyMaK Jun-15 DH $ 10.3m European
via auction in
Mumbai ,
Marinel ine coated
Tankers
Size Name Dwt Built Yard M/E SS due Gear Price Buyers Comments
PMAX HELLENIC SKY 68,591 1994SASEBO SASEBO,
JapanB&W Nov-14 $ 10.1m undisclosed
PMAX SEA VALOUR 66,734 1985
CHINA
SHIPBUILDING,
Chinese Ta ipei
Sulzer - $ 5.1m undisclosed
SMAXFURNESS
HARTLEPOOL52,481 2006
TSUNEISHI HEAVY
CEBU, Phi l ippinesMAN-B&W Jun-16
4 X 30t
CRANES$ 20.5m U.S based on subs
HMAX OCEAN SUNRISE 48,203 1999
OSHIMA
SHIPBUILDING,
Japan
Mitsubishi Jul -144 X 25t
CRANES$ 13.4m Middle Eastern
bss DD freshly
passed
HANDY DINA G 37,725 1984SASEBO SASEBO,
JapanSulzer Jun-13
4 X 25t
CRANES$ 3.5m Chinese a lready del ivered
HANDY LIVADIA 32,662 2003SHIN KOCHI,
JapanMitsubishi Sep-13
4 X 30.5t
CRANES$ 14.5m
Chi lean
(NACHIPA)
HANDYORIENTAL
FINDER32,395 2003
KANDA KAWAJIRI,
JapanMitsubishi Jan-13
4 X 30.5t
CRANES$ 13.0m S. Korean bank dea l
Bulk Carriers
Name Dwt Built Yard M/E SS due Gear Price Buyers Comments
MAASDIEP 6,853 1997
ALBLAS HENDRIK-
IDO-AMB,
Netherlands
MaK Jun-122 X 40t
CRANES$ 3.7m Indones ian with SS due 06/2012
BALSA 71 6,687 1999SASEBO SASEBO,
JapanB&W Mar-14
2X15t CRS,
1X15t CRS$ 3.1m Turki sh
MPP/General Cargo
Size Name Teu Built Yard M/E SS due Gear Price Buyers Comments
FEEDER NIENSTEDTEN 1,730 2002
SZCZECINSKA
PORTA HOLD,
Poland
Sulzer Jan-173 X 40t
CRANES$ 12.0m
U.S. based
(Seachange)
Containers
Name Loa(m) Cars Built Yard M/E SS due Price Buyers Comments
TAISHUN 144.42 1,450 1997NAIKAI ZOSEN -
SETODA, JapanB&W Jul-12 $ 9.5m Chinese
PCCs
© Intermodal Research 10/04/2012 5
Week
14
Week
13±% 2012 2011 2010
Bangladesh 485 485 0.0% 487 523 422
India 480 485 -1.0% 493 511 427
Pakistan 480 480 0.0% 491 504 425
China 435 435 0.0% 435 451 383
Bangladesh 465 455 0.0% 459 498 375
India 460 455 1.1% 466 484 394
Pakistan 455 450 1.1% 463 477 388
China 420 420 0.0% 418 432 364
Dry
Indicative Demolition Prices ($/ldt)
Markets
We
t
350
400
450
500
550
600
$/ldt
Dry Demolition Prices
Bangladesh India Pakistan China
350
400
450
500
550
600
$/ldt
Wet Demolition Prices
Bangladesh India Pakistan China
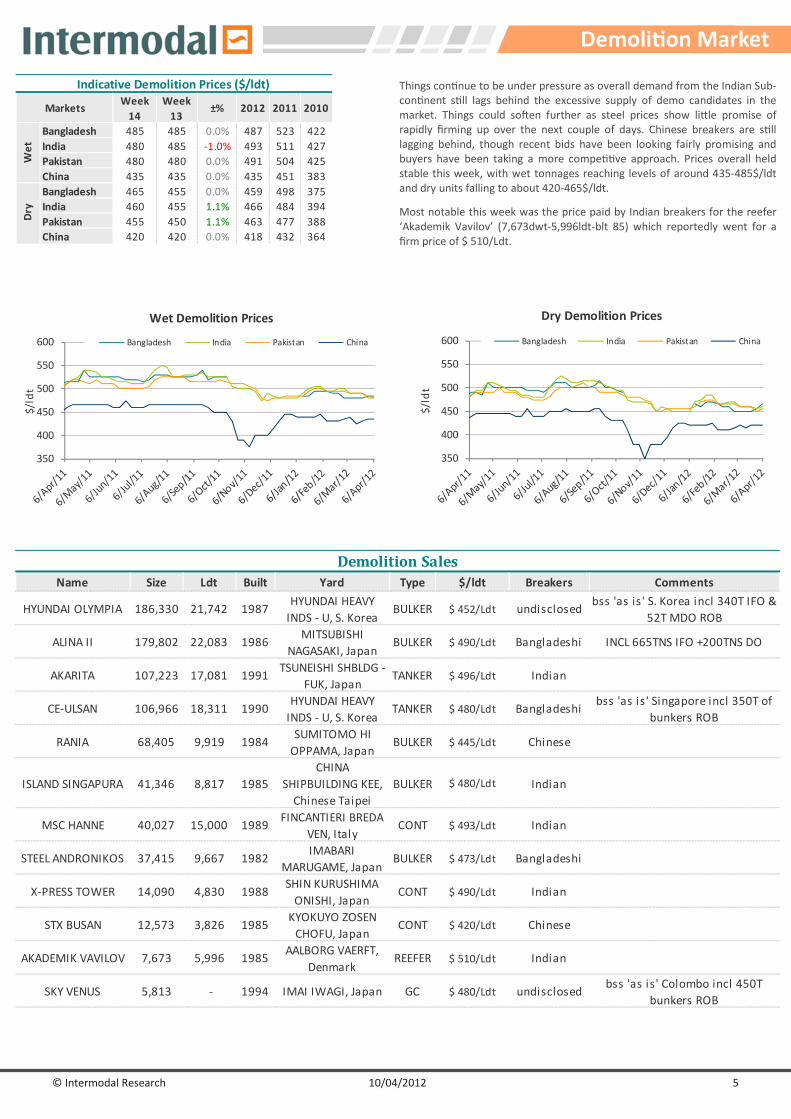
Things con�nue to be under pressure as overall demand from the Indian Sub-
con�nent s�ll lags behind the excessive supply of demo candidates in the
market. Things could soHen further as steel prices show liEle promise of
rapidly firming up over the next couple of days. Chinese breakers are s�ll
lagging behind, though recent bids have been looking fairly promising and
buyers have been taking a more compe��ve approach. Prices overall held
stable this week, with wet tonnages reaching levels of around 435-485$/ldt
and dry units falling to about 420-465$/ldt.
Most notable this week was the price paid by Indian breakers for the reefer
‘Akademik Vavilov’ (7,673dwt-5,996ldt-blt 85) which reportedly went for a
firm price of $ 510/Ldt.
Demoli&on Market
Name Size Ldt Built Yard Type $/ldt Breakers Comments
HYUNDAI OLYMPIA 186,330 21,742 1987HYUNDAI HEAVY
INDS - U, S. KoreaBULKER $ 452/Ldt undisclosed
bss 'as is' S. Korea incl 340T IFO &
52T MDO ROB
ALINA II 179,802 22,083 1986MITSUBISHI
NAGASAKI, JapanBULKER $ 490/Ldt Bangladeshi INCL 665TNS IFO +200TNS DO
AKARITA 107,223 17,081 1991TSUNEISHI SHBLDG -
FUK, JapanTANKER $ 496/Ldt Indian
CE-ULSAN 106,966 18,311 1990HYUNDAI HEAVY
INDS - U, S. KoreaTANKER $ 480/Ldt Bangladeshi
bss 'as is' Singapore incl 350T of
bunkers ROB
RANIA 68,405 9,919 1984SUMITOMO HI
OPPAMA, JapanBULKER $ 445/Ldt Chinese
ISLAND SINGAPURA 41,346 8,817 1985
CHINA
SHIPBUILDING KEE,
Chinese Taipei
BULKER $ 480/Ldt Indian
MSC HANNE 40,027 15,000 1989FINCANTIERI BREDA
VEN, ItalyCONT $ 493/Ldt Indian
STEEL ANDRONIKOS 37,415 9,667 1982IMABARI
MARUGAME, JapanBULKER $ 473/Ldt Bangladeshi
X-PRESS TOWER 14,090 4,830 1988SHIN KURUSHIMA
ONISHI, JapanCONT $ 490/Ldt Indian
STX BUSAN 12,573 3,826 1985KYOKUYO ZOSEN
CHOFU, JapanCONT $ 420/Ldt Chinese
AKADEMIK VAVILOV 7,673 5,996 1985AALBORG VAERFT,
DenmarkREEFER $ 510/Ldt Indian
SKY VENUS 5,813 - 1994 IMAI IWAGI, Japan GC $ 480/Ldt undisclosedbss 'as is' Colombo incl 450T
bunkers ROB
Demolition Sales
© Intermodal Research 10/04/2012 6
Week
14
Week
13±% 2012 2011 2010
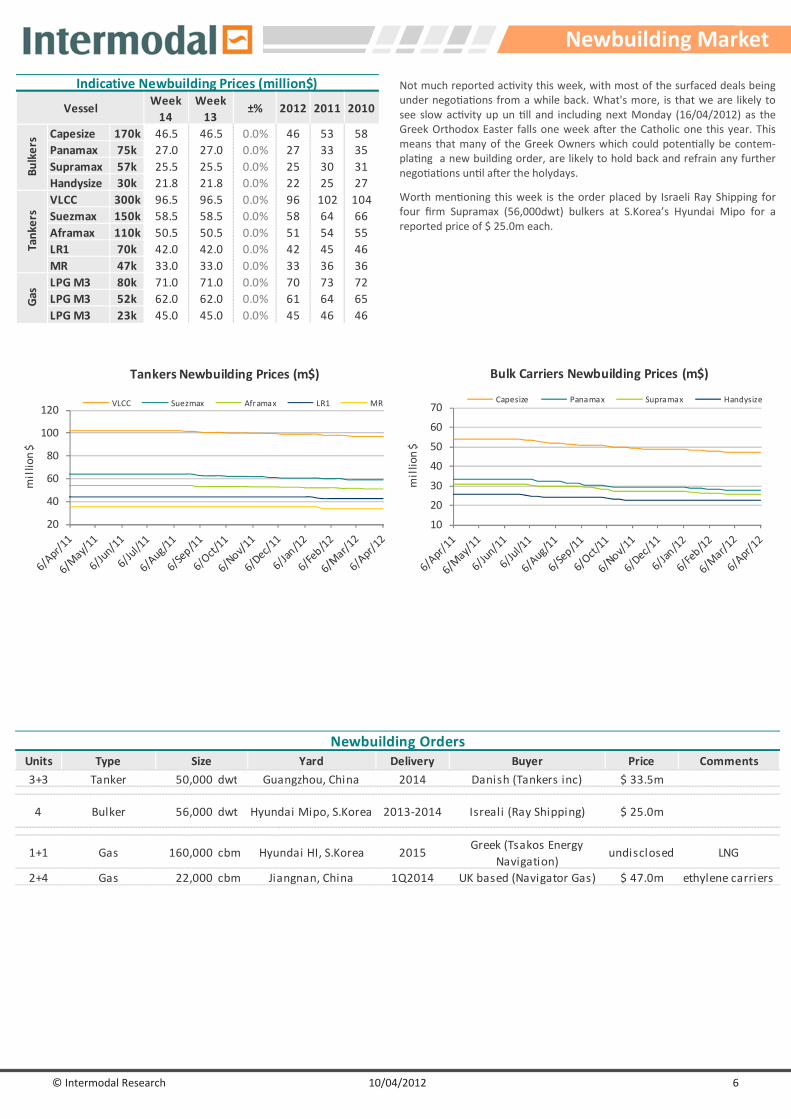
Capesize 170k 46.5 46.5 0.0% 46 53 58
Panamax 75k 27.0 27.0 0.0% 27 33 35
Supramax 57k 25.5 25.5 0.0% 25 30 31
Handysize 30k 21.8 21.8 0.0% 22 25 27
VLCC 300k 96.5 96.5 0.0% 96 102 104
Suezmax 150k 58.5 58.5 0.0% 58 64 66
Aframax 110k 50.5 50.5 0.0% 51 54 55
LR1 70k 42.0 42.0 0.0% 42 45 46
MR 47k 33.0 33.0 0.0% 33 36 36
LPG M3 80k 71.0 71.0 0.0% 70 73 72
LPG M3 52k 62.0 62.0 0.0% 61 64 65
LPG M3 23k 45.0 45.0 0.0% 45 46 46
Indicative Newbuilding Prices (million$)
Ga
s
Vessel
Bu
lke
rsTa
nk
ers
Not much reported ac�vity this week, with most of the surfaced deals being
under nego�a�ons from a while back. What's more, is that we are likely to
see slow ac�vity up un �ll and including next Monday (16/04/2012) as the
Greek Orthodox Easter falls one week aHer the Catholic one this year. This
means that many of the Greek Owners which could poten�ally be contem-
pla�ng a new building order, are likely to hold back and refrain any further
nego�a�ons un�l aHer the holydays.
Worth men�oning this week is the order placed by Israeli Ray Shipping for
four firm Supramax (56,000dwt) bulkers at S.Korea’s Hyundai Mipo for a
reported price of $ 25.0m each.
10
20
30
40
50
60
70million $
Bulk Carriers Newbuilding Prices (m$)
Capesize Panamax Supramax Handysize
20
40
60
80
100
120
million $
Tankers Newbuilding Prices (m$)
VLCC Suezmax Aframax LR1 MR
Newbuilding Market
Units Type Yard Delivery Buyer Price Comments
3+3 Tanker 50,000 dwt Guangzhou, China 2014 Danish (Tankers inc) $ 33.5m
4 Bulker 56,000 dwt Hyundai Mipo, S.Korea 2013-2014 Isreali (Ray Shipping) $ 25.0m
1+1 Gas 160,000 cbm Hyundai HI, S.Korea 2015Greek (Tsakos Energy
Navigation)undisclosed LNG
2+4 Gas 22,000 cbm Jiangnan, China 1Q2014 UK based (Navigator Gas) $ 47.0m ethylene carriers
Size
Newbuilding Orders
The informa�on contained in this report has been obtained from various sources, as reported in the market. Intermodal Shipbrokers Co. believes such informa�on to be factual and reliable without mak-
ing guarantees regarding its accuracy or completeness. Whilst every care has been taken in the produc�on of the above review, no liability can be accepted for any loss or damage incurred in any way
whatsoever by any person who may seek to rely on the informa�on and views contained in this material. This report is being produced for the internal use of the intended recipients only and no re-
producing is allowed, without the prior wriEen authoriza�on of Intermodal Shipbrokers Co.
Compiled by Intermodal Research & Valua�ons Department | Mr George Lazaridis
E-mail: [email protected]
On behalf of Intermodal Sale & Purchase, Newbuilding and Chartering Departments
E-mail: [email protected], [email protected], [email protected]
1,600
1,620
1,640
1,660
1,680
1,700
90
100
110
120
130
140
goldoil
Basic Commodities Weekly Summary
Oil WTI $ Oil Brent $ Gold $
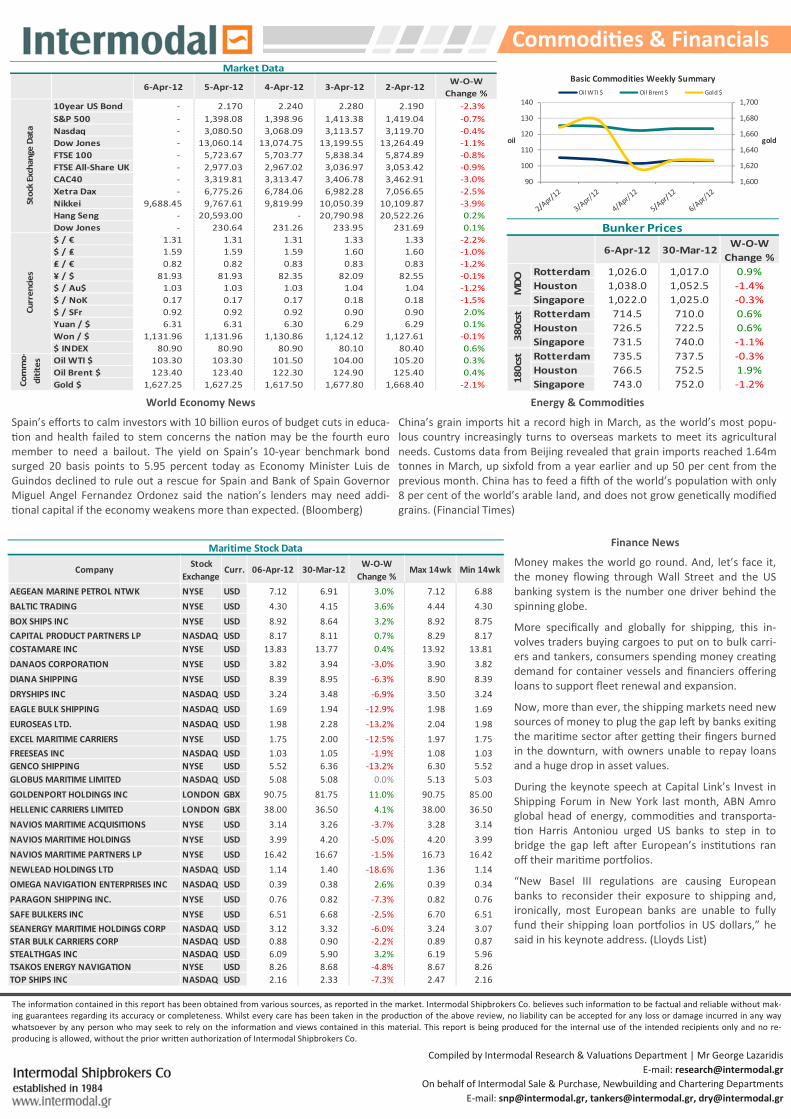
6-Apr-12 30-Mar-12W-O-W
Change %
Rotterdam 1,026.0 1,017.0 0.9%
Houston 1,038.0 1,052.5 -1.4%
Singapore 1,022.0 1,025.0 -0.3%
Rotterdam 714.5 710.0 0.6%
Houston 726.5 722.5 0.6%
Singapore 731.5 740.0 -1.1%
Rotterdam 735.5 737.5 -0.3%
Houston 766.5 752.5 1.9%
Singapore 743.0 752.0 -1.2%
Bunker Prices
MD
O3
80
cst
18
0cs
t
World Economy News
Spain’s efforts to calm investors with 10 billion euros of budget cuts in educa-
�on and health failed to stem concerns the na�on may be the fourth euro
member to need a bailout. The yield on Spain’s 10-year benchmark bond
surged 20 basis points to 5.95 percent today as Economy Minister Luis de
Guindos declined to rule out a rescue for Spain and Bank of Spain Governor
Miguel Angel Fernandez Ordonez said the na�on’s lenders may need addi-
�onal capital if the economy weakens more than expected. (Bloomberg)
Energy & Commodi&es
China’s grain imports hit a record high in March, as the world’s most popu-
lous country increasingly turns to overseas markets to meet its agricultural
needs. Customs data from Beijing revealed that grain imports reached 1.64m
tonnes in March, up sixfold from a year earlier and up 50 per cent from the
previous month. China has to feed a fiHh of the world’s popula�on with only
8 per cent of the world’s arable land, and does not grow gene�cally modified
grains. (Financial Times)
Finance News
Money makes the world go round. And, let’s face it,
the money flowing through Wall Street and the US
banking system is the number one driver behind the
spinning globe.
More specifically and globally for shipping, this in-
volves traders buying cargoes to put on to bulk carri-
ers and tankers, consumers spending money crea�ng
demand for container vessels and financiers offering
loans to support fleet renewal and expansion.
Now, more than ever, the shipping markets need new
sources of money to plug the gap leH by banks exi�ng
the mari�me sector aHer ge[ng their fingers burned
in the downturn, with owners unable to repay loans
and a huge drop in asset values.
During the keynote speech at Capital Link’s Invest in
Shipping Forum in New York last month, ABN Amro
global head of energy, commodi�es and transporta-
�on Harris Antoniou urged US banks to step in to
bridge the gap leH aHer European’s ins�tu�ons ran
off their mari�me porRolios.
“New Basel III regula�ons are causing European
banks to reconsider their exposure to shipping and,
ironically, most European banks are unable to fully
fund their shipping loan porRolios in US dollars,” he
said in his keynote address. (Lloyds List)
CompanyStock
ExchangeCurr. 06-Apr-12 30-Mar-12
W-O-W
Change %Max 14wk Min 14wk
AEGEAN MARINE PETROL NTWK NYSE USD 7.12 6.91 3.0% 7.12 6.88
BALTIC TRADING NYSE USD 4.30 4.15 3.6% 4.44 4.30
BOX SHIPS INC NYSE USD 8.92 8.64 3.2% 8.92 8.75
CAPITAL PRODUCT PARTNERS LP NASDAQ USD 8.17 8.11 0.7% 8.29 8.17
COSTAMARE INC NYSE USD 13.83 13.77 0.4% 13.92 13.81
DANAOS CORPORATION NYSE USD 3.82 3.94 -3.0% 3.90 3.82
DIANA SHIPPING NYSE USD 8.39 8.95 -6.3% 8.90 8.39
DRYSHIPS INC NASDAQ USD 3.24 3.48 -6.9% 3.50 3.24
EAGLE BULK SHIPPING NASDAQ USD 1.69 1.94 -12.9% 1.98 1.69
EUROSEAS LTD. NASDAQ USD 1.98 2.28 -13.2% 2.04 1.98
EXCEL MARITIME CARRIERS NYSE USD 1.75 2.00 -12.5% 1.97 1.75
FREESEAS INC NASDAQ USD 1.03 1.05 -1.9% 1.08 1.03
GENCO SHIPPING NYSE USD 5.52 6.36 -13.2% 6.30 5.52
GLOBUS MARITIME LIMITED NASDAQ USD 5.08 5.08 0.0% 5.13 5.03
GOLDENPORT HOLDINGS INC LONDON GBX 90.75 81.75 11.0% 90.75 85.00
HELLENIC CARRIERS LIMITED LONDON GBX 38.00 36.50 4.1% 38.00 36.50
NAVIOS MARITIME ACQUISITIONS NYSE USD 3.14 3.26 -3.7% 3.28 3.14
NAVIOS MARITIME HOLDINGS NYSE USD 3.99 4.20 -5.0% 4.20 3.99
NAVIOS MARITIME PARTNERS LP NYSE USD 16.42 16.67 -1.5% 16.73 16.42
NEWLEAD HOLDINGS LTD NASDAQ USD 1.14 1.40 -18.6% 1.36 1.14
OMEGA NAVIGATION ENTERPRISES INC NASDAQ USD 0.39 0.38 2.6% 0.39 0.34
PARAGON SHIPPING INC. NYSE USD 0.76 0.82 -7.3% 0.82 0.76
SAFE BULKERS INC NYSE USD 6.51 6.68 -2.5% 6.70 6.51
SEANERGY MARITIME HOLDINGS CORP NASDAQ USD 3.12 3.32 -6.0% 3.24 3.07
STAR BULK CARRIERS CORP NASDAQ USD 0.88 0.90 -2.2% 0.89 0.87
STEALTHGAS INC NASDAQ USD 6.09 5.90 3.2% 6.19 5.96
TSAKOS ENERGY NAVIGATION NYSE USD 8.26 8.68 -4.8% 8.67 8.26
TOP SHIPS INC NASDAQ USD 2.16 2.33 -7.3% 2.47 2.16
Maritime Stock Data
6-Apr-12 5-Apr-12 4-Apr-12 3-Apr-12 2-Apr-12W-O-W
Change %
10year US Bond - 2.170 2.240 2.280 2.190 -2.3%
S&P 500 - 1,398.08 1,398.96 1,413.38 1,419.04 -0.7%
Nasdaq - 3,080.50 3,068.09 3,113.57 3,119.70 -0.4%
Dow Jones - 13,060.14 13,074.75 13,199.55 13,264.49 -1.1%
FTSE 100 - 5,723.67 5,703.77 5,838.34 5,874.89 -0.8%
FTSE All-Share UK - 2,977.03 2,967.02 3,036.97 3,053.42 -0.9%
CAC40 - 3,319.81 3,313.47 3,406.78 3,462.91 -3.0%
Xetra Dax - 6,775.26 6,784.06 6,982.28 7,056.65 -2.5%
Nikkei 9,688.45 9,767.61 9,819.99 10,050.39 10,109.87 -3.9%
Hang Seng - 20,593.00 - 20,790.98 20,522.26 0.2%
Dow Jones - 230.64 231.26 233.95 231.69 0.1%
$ / € 1.31 1.31 1.31 1.33 1.33 -2.2%
$ / ₤ 1.59 1.59 1.59 1.60 1.60 -1.0%
₤ / € 0.82 0.82 0.83 0.83 0.83 -1.2%
¥ / $ 81.93 81.93 82.35 82.09 82.55 -0.1%
$ / Au$ 1.03 1.03 1.03 1.04 1.04 -1.2%
$ / NoK 0.17 0.17 0.17 0.18 0.18 -1.5%
$ / SFr 0.92 0.92 0.92 0.90 0.90 2.0%
Yuan / $ 6.31 6.31 6.30 6.29 6.29 0.1%
Won / $ 1,131.96 1,131.96 1,130.86 1,124.12 1,127.61 -0.1%
$ INDEX 80.90 80.90 80.90 80.10 80.40 0.6%
Oil WTI $ 103.30 103.30 101.50 104.00 105.20 0.3%
Oil Brent $ 123.40 123.40 122.30 124.90 125.40 0.4%
Gold $ 1,627.25 1,627.25 1,617.50 1,677.80 1,668.40 -2.1%
Market Data
Cu
rre
nci
es
Co
mm
o-
dit
ite
sSt
ock
Exch
an
ge
Dat
a
Commodi&es & Financials