weekly work search review trial · this report presents methodology and results from a trial of...
TRANSCRIPT

Weekly Work Search Review Trial
July 2018

2
DWP ad hoc research report no. 59
A report of research carried out by the Department for Work and Pensions.
© Crown copyright 2018. You may re-use this information (not including logos) free of charge in any format or medium, under the terms of the Open Government Licence. To view this licence, visit http://www.nationalarchives.gov.uk/doc/open-government-licence/or write to the Information Policy Team, The National Archives, Kew, London TW9 4DU,or email: [email protected]. This document/publication is also available on our website at: https://www.gov.uk/government/collections/research-reports If you would like to know more about DWP research, please email: [email protected] First published 2018. ISBN 978-1-78425-986-0
Views expressed in this report are not necessarily those of the Department for Work and Pensions or any other Government Department.

3
Executive summary The Work Search Review (WSR) is a key component of the Jobseeker’s Allowance (JSA) regime. The majority of claimants attend WSRs fortnightly or weekly (a few attend daily or are excused entirely), where the actions they have taken and might take towards gaining employment are discussed and agreed with a Work Coach.
This report presents the results of a Randomised Control Trial investigating the impact of weekly, rather than fortnightly, Work Search Reviews (WSR) on around 24,800 Jobseeker’s Allowance claimants. The trial shows that those on the weekly WSR regime spent on average (6.4 ± 2.6) days fewer on benefit and (7.3 ± 2.7) days more in employment over the year following claim.
Information from a questionnaire given to the claimants and from DWP administrative systems was used to attempt to segment the trial participants, that is, to identify groups who respond more strongly to the different WSR regimes. The best approach to segmentation achieved (8.1 ± 5.5) days reduction in benefit and (10.1 ± 6.3) days extra in employment from weekly WSRs. This appears to be a modest (but not statistically significant) improvement over random assignment.

4
Contents
1 Introduction .......................................................................................................... 5
1.1 Background .................................................................................................. 5
1.2 Methodology ................................................................................................. 5
2 Trial results .......................................................................................................... 7
2.1 Impact of weekly Work Search Reviews ...................................................... 7
2.2 Subgroup analysis ...................................................................................... 10
3 Segmentation .................................................................................................... 11
3.1 Segmentation approach ............................................................................. 11
Annex A – Variables for segmentation ..................................................................... 15
Annex B – ROC curves ............................................................................................ 20
List of Figures and Tables Figure 2.1 The percentage of weekly and fortnightly WSR groups on
any income replacement benefit before and after claim ………… …… 6
Figure 2.2 The difference in the percentage of the weekly and fortnightly WSR groups on any income replacement benefit before and after their entry into the trial…………………………. 6
Figure 2.3 The difference in the percentage of the weekly and
fortnightly WSR groups in employment before and after their entry into the trial ………………………………………………. 7
Figure 2.4 Change in percentage on benefit from switching to
weekly WSRs for males and females. . ………………………………… 9 Figure 2.5 Estimate of change from switching to weekly work
search in days on benefit and days in work …………………………… 9 Figure 3.1 Median days off benefit with 95% confidence limits for
various variable selection and logistic regression schemes …………. 14 Figure 3.2 Mean extra days in work with 95% confidence limits for
various variable selection and logistic regression schemes ………. . 15

5
1 Introduction
1.1 Background The Work Search Review (WSR) is a key component of the Jobseeker’s Allowance (JSA) regime. The majority of claimants attend WSRs fortnightly or weekly (a few attend daily or are excused entirely), where the actions they have taken and might take towards gaining employment are discussed and agreed with a Work Coach.
This report presents methodology and results from a trial of weekly, rather than fortnightly, WSRs for claimants from the start of their claim. The trial was a Randomised Control Trial (RCT) carried out in twenty districts from 22nd September 2014 to 24th February 2015, with all claimants who were eligible for the normal WSR regime and who started a claim in those districts in that period being assigned randomly to either weekly or fortnightly WSRs based on their National Insurance Number (NINO) for the first 13 weeks of their claim. Administrative data on moves off benefits and into work were used to determine the impact of the intervention.
The focus of the trial is to discover whether there is a group of claimants, identifiable at the time of claim, for whom weekly WSRs are particularly effective. Splitting a population into such groups is called segmentation. We looked at administrative data and the results of a questionnaire, completed by the claimant and Work Coach at the time of claim, to attempt to identify factors that affected the responsiveness to weekly WSRs.
1.2 Methodology There were 26,006 claims to JSA made by 24,844 distinct individuals recorded in the trial districts in the trial period. For individuals who had made multiple claims in the trial period, the date of the first claim was treated as the date of entry into the trial. 22,542 individuals were successfully matched to individuals recorded in the administrative data as making claims in the trial period. These successfully matched individuals were randomly divided into 11,079 cases on fortnightly WSRs and 11,463 on weekly WSRs. An examination of the distributions of the information we have about the individuals put into the two groups suggests that they are well balanced. The difference between the mean values found for each group was less than 4 per cent of the standard deviation for all variables.
By matching claimants’ NINOs to Department for Work and Pensions (DWP) systems, their history of claims to benefit can be tracked.
6
2 Trial results
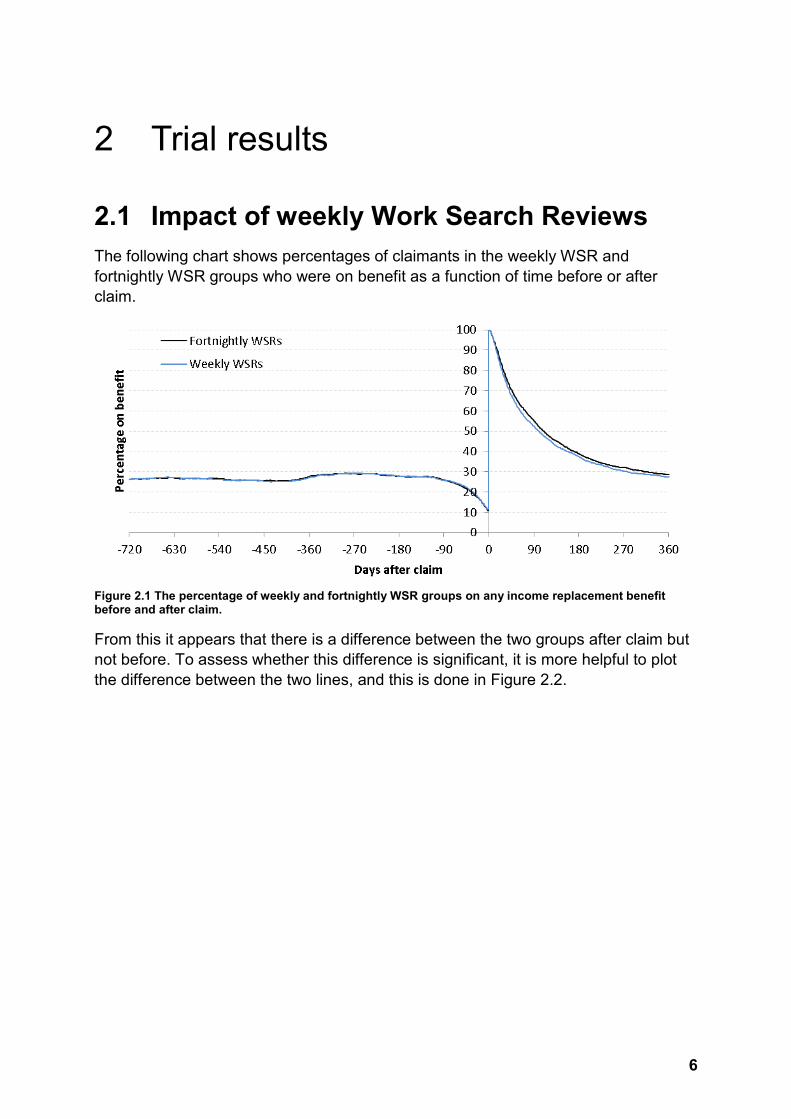
2.1 Impact of weekly Work Search Reviews The following chart shows percentages of claimants in the weekly WSR and fortnightly WSR groups who were on benefit as a function of time before or after claim.
Figure 2.1 The percentage of weekly and fortnightly WSR groups on any income replacement benefit before and after claim.
From this it appears that there is a difference between the two groups after claim but not before. To assess whether this difference is significant, it is more helpful to plot the difference between the two lines, and this is done in Figure 2.2.

7
Figure 2.2 The difference in the percentage of the weekly and fortnightly WSR groups on any income replacement benefit before and after their entry into the trial.
Notes:
(i) Central estimate and confidence limits are shown.
(ii) There is no significant difference before the date of claim, but there are significantly fewer claimants on benefit in the weekly WSR group after claim.
Figure 2.2 shows that the weekly and fortnightly WSR groups did not have significantly different likelihood of being on benefit before joining the trial. However, after joining the trial, individuals in the weekly WSR group were significantly less likely to be on an income replacement benefit than those in the fortnightly WSR group. The difference is significant approximately two weeks after claimants joined the trial, and peaks at around ninety days (around the end of the trialled intervention) with around a 3 percentage point difference. The difference dies away to around 1 to 1.5 percentage points around 180 days after claim, but does not appear to drop further after that, remaining on the edge of significance for the remainder of the year.1
It was also possible to track the employment history of individuals in the trial using P45 records supplied by Her Majesty’s Revenue and Customs (HMRC). In the same way as for the percentage of trial participants on benefit, the percentage of trial participants in employment can be determined for the weekly and fortnightly WSR groups, and the difference can be plotted (figure 3). Since employment data is derived from tax records relating to employment it does not cover self-employment and un-reported working. There is no reason to expect this to be different for the two trial arms, however, so any effect on the difference between the trial arms should be minimal.
1 Note that these confidence limits are based on simple point in time estimates at each day.

8
Figure 2.3 The difference in the percentage of the weekly and fortnightly WSR groups in employment before and after their entry into the trial.
Notes:
(i) Central estimate and confidence limits are shown.
(ii) There is no significant difference before the date of claim, but there are significantly more claimants in work in the weekly WSR group after claim.
As with the benefit histories, the weekly and fortnightly WSR groups did not have significantly different likelihoods of being in employment prior to joining the trial. However, after joining the trial, individuals in the weekly WSR group were significantly more likely to be in work than those in the fortnightly WSR group. The difference is significant from two weeks after claim, rising to around 2 percentage points after sixty days and remaining stable at around that level for the remainder of the year after claim. The trial intervention only lasted for 13 weeks, but claimants may have remained on weekly or fortnightly WSRs if they did not leave benefit in that time. It is possible that the intervention continued to affect moves into work beyond that period, or simply that higher numbers finding work during the intervention led to a persistent gap.
That the two graphs do not exactly mirror each other suggests that there are some trial participants who are neither on benefit nor in work. In fact, long before and long after the claim the “background” seems to be that around 30 per cent of claimants are on benefit and around 50 per cent are in employment. This leaves around 20 per cent of claimants who were neither (perhaps in self-employment, training, education, or caring for a home), which is sufficiently large to accommodate the differences in the benefit and employment impacts.
It is also possible to obtain an estimate of the difference in the number of days on benefit and in work between the weekly and fortnightly WSR groups. This is a metric that cannot easily be read off the graphs shown earlier in this report. The number of days that an individual spends on benefit or in employment in the year following claim can be determined from administrative data. The mean value for the weekly and fortnightly WSR groups can be calculated and the difference is an estimate of the

9
effect of the trial. Results, with confidence limits obtained by bootstrapping, are shown in Table 2.1 below.
Change from switching to weekly WSRs in…
Best estimate of change in days
95% confidence interval
…days on benefit in the year after claim
-6.4 (-9.1 – -3.8)
…days in work in the year after claim
7.3 (4.6 – 10.0)
Table 2.1 Estimate in change in days on benefit and days in work from switching to weekly WSRs The number of days on benefit is significantly reduced by the switch to weekly WSRs, and the number of days in employment is significantly increased. Since the effect of the weekly WSR regime appears not to have died away completely, it is reasonable to think that the difference would be larger if the tracking were continued for a longer period.
2.2 Subgroup analysis From the administrative data we are able to identify demographic information about claimants, such as their age, sex, ethnicity, disability, any partner that we are aware of, number of children, age of youngest child, benefit and employment history, and sought occupation. We can then split the population by these characteristics and see if the trial had a stronger effect on one group than another. Figure 2.4 shows the effect of the trial on two such groups.
None of the variables we studied showed a significant difference in the effect of the trial once the multiple testing was accounted for2.
2 For a single statistical test, rejecting a hypothesis (such as “men respond more strongly than women to weekly signing”) with 95% confidence means that there is a 5% chance, given the data, that we were wrong to reject it. If many tests are performed naively on the same data, each one has a 5% chance of being wrong and, the more tests are performed, the more likely it becomes that one of the 5% chances will turn up. Multiple test corrections are methods to adjust the thresholds used in the individual tests to reflect that multiple tests were performed.

10
Figure 2.4 Change in percentage on benefit from switching to weekly WSRs for males and females.
Notes:
(1) This figure shows that for both males and females there is a significant decrease, but they are not significantly different from one another.
We also asked Work Coaches what impact they felt that the weekly WSRs would have on the claimant – strongly positive, weakly positive, weakly negative or strongly negative. The results showed Work Coaches believed that most claimants would benefit from weekly WSRs. However, following their recommendations did not lead to a significant improvement in outcomes. We cannot dismiss the possibility that Work Coaches can do better than a random assignment, but the evidence gained from this trial was not enough to do so.

11
3 Segmentation
3.1 Segmentation approach The results of the trial presented in the previous section show that there is a reduction in the time on benefit and an increase in the time in employment related to moving to weekly WSRs. However, if it were possible to identify certain groups who were more responsive to this change then it would be possible for Work Coaches to assign claimants to weekly WSRs if they are expected to respond most strongly to this regime. Segmentation is the name given to this process of segmenting a population into subgroups who have difference responses to an intervention.
DWP administrative data systems provide information on the claimants, including age, number of children, age of youngest child, any partner of which we are aware, disabilities, ethnicity, sought occupation, as well as history of benefit claims and employment, and Index of Multiple Deprivation (IMD) scores. As part of this trial, claimants were asked to complete a questionnaire regarding their personal circumstances (access to technology, living arrangements etc.) and attitudes to job seeking. Additionally, Work Coaches provided some of their impressions of the claimant. All of this information can be examined to determine if it is predictive of a strong response to the weekly WSR regime.
We tried using a technique called Chi-square Automatic Interaction Detector (CHAID), which automatically builds decision trees. It works by using statistical testing to group together claimants who are not significantly different in their reaction to weekly WSRs, and to split them up in different ways to construct a tree of questions that identify those who are most strongly or least strongly affected. This technique has the advantage of being easy to deploy operationally, since a decision tree is easy to explain to Work Coaches and can be implemented in a spread sheet or even on paper. However, we were not able to find a stable tree that was predictive of claimants it was not trained on.
There are techniques that can be used to handle this, such as constructing families of trees and letting the trees “vote” on the outcome for a claimant. However, the operational simplicity is lost.
An alternative approach used logistic regression to model the likelihood that an individual was off benefit after ninety days, the time when there was the largest difference in likelihood of being on benefit between the weekly and fortnightly WSR groups (and the approximate time at which the extra WSRs ceased). Three different modelling approaches were tried:
Two model approach: The chances that claimants were off benefit after ninety days were modelled separately for the groups assigned to weekly and fortnightly WSRs. New claimants were run through both models, and the difference in predicted probability was calculated. Claimants with the largest predicted increase in

12
probability associated with choosing the weekly WSR model would be recommended for weekly WSRs.
One model approach: The chance that claimants were off benefit at ninety days was modelled, including an indicator for the random assignment to weekly or fortnightly WSRs as an interaction term in the model3. New claimants were run through the model once assigned to weekly WSRs and once assigned to fortnightly. Claimants with the largest predicted increase in probability associated with weekly WSRs rather than fortnightly would be recommended for weekly WSRs.
Cadit4: The interaction between the probability of being off benefit after ninety days and the indicator for weekly or fortnightly WSRs was modelled. The predicted probability of the Cadit function taking the value 1 is directly related to the increase in probability of being off benefit due to moving to weekly WSRs. Claimants with the highest predicted probabilities would be recommended for weekly WSRs.
The variables available to the model are listed in Annex A. If all of the variables available are included in the model, the predictions tend not to generalise well. The model is said to be “over fitted” – since it had so many variables to work with it could become too specific to the data it was trained on. To prevent this, a process called stepwise selection was used to identify, in sequence, the most important variables, using the minimum value of the Akaike Information Criterion5 as the condition to stop adding variables.
There could be some variation in the variables selected by this method, so the variable selection process was run twenty times on random subsets of half of the cases. The results for these were combined in four different ways:
First random selection: the variables chosen by the first run were included in the model.
All repeated variables: any variable that appeared in more than one of the runs was included in the model.
All variables appearing half the time: any variable that appeared in ten or more of the runs was included in the model.
Minimal set: variables were arranged in decreasing order of the number of times they were selected. Working down the list, each variable was included and any models not including it were rejected, until no variable could be added without rejecting the last model.
To get an estimate of whether the models were predictive in general, the data was repeatedly split into two halves; the model was fitted to one half and tested on the other half to make recommendations for weekly WSRs – that is, to identify which
3 That is, the model included both an effect of each variable and an effect multiplied by a binary variable indicating assignment to weekly or fortnightly WSRs. In this way, the effect of a variable on outcome is measured, and also the additional effect of the variable on those in the weekly WSR group. 4 Weisberg & Pontes, Post hoc subgroups in clinical trials: Anathema or analytics? Clin Trials. 2015 Aug;12(4):357-64 5 Shtatland et al, The perils of stepwise logistic regression and how to escape them using information criteria and the output delivery system SUGI 26 http://www2.sas.com/proceedings/sugi26/p222-26.pdf

13
claimants would have been selected for weekly WSRs if the model had been used on claimants it had not encountered before. The results of the trial can then be used to estimate the impact of weekly rather than fortnightly WSRs for these claimants.
In all cases, half of the claimants were assigned to weekly WSRs, reflecting the policy assumptions that were in existence at the start of the trial. The final results are shown below. Receiver Operating Characteristic (ROC) curves, which summarise the classification power of a model, are shown for the various models in Annex B.
Figure 3.1 Median days off benefit with 95% confidence limits for various variable selection and logistic regression schemes.
Notes:
(i) The days off benefit figure from the trial (no segmentation) and upper and lower 95% confidence limits are marked as black dotted lines.
(ii) A minimal set of variables could not be constructed for the Cadit method.

14
Figure 3.2 Mean extra days in work with 95% confidence limits for various variable selection and logistic regression schemes
All of these approaches have similar performances, with larger ranges of random variation between results of a particular approach than between different approaches. The best performing approach produces (8.1 ± 5.5) days off benefit in the year following claim, and (10.1 ± 6.3) days extra in work in the same period.
None of the schemes seems to be a significant improvement over simple random assignment in terms of either days off benefit or extra days in work; although comparison with random assignments suggests that the segmentation would reduce days on benefit in 88 per cent of cases. The model does appear to make a modest improvement over random assignment, but there is no strong evidence that it works well.
Variables that were important to the Cadit model (the best model overall) were the time in employment and one of the attitudinal questions regarding having made a commitment to find a job by a certain date. Feeling that caring responsibilities for children affected the ability to look for work was also a factor.
15
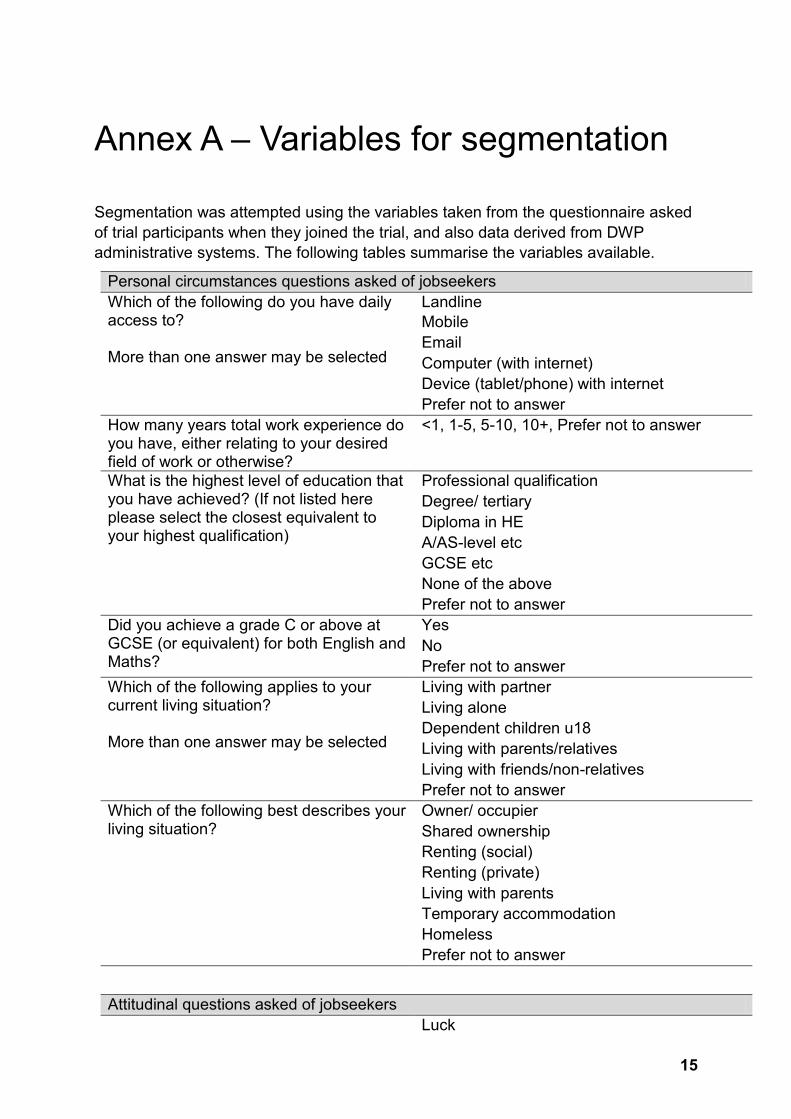
Annex A – Variables for segmentation
Segmentation was attempted using the variables taken from the questionnaire asked of trial participants when they joined the trial, and also data derived from DWP administrative systems. The following tables summarise the variables available.
Personal circumstances questions asked of jobseekers Which of the following do you have daily access to? More than one answer may be selected
Landline Mobile Email Computer (with internet) Device (tablet/phone) with internet Prefer not to answer
How many years total work experience do you have, either relating to your desired field of work or otherwise?
<1, 1-5, 5-10, 10+, Prefer not to answer
What is the highest level of education that you have achieved? (If not listed here please select the closest equivalent to your highest qualification)
Professional qualification Degree/ tertiary Diploma in HE A/AS-level etc GCSE etc None of the above Prefer not to answer
Did you achieve a grade C or above at GCSE (or equivalent) for both English and Maths?
Yes No Prefer not to answer
Which of the following applies to your current living situation? More than one answer may be selected
Living with partner Living alone Dependent children u18 Living with parents/relatives Living with friends/non-relatives Prefer not to answer
Which of the following best describes your living situation?
Owner/ occupier Shared ownership Renting (social) Renting (private) Living with parents Temporary accommodation Homeless Prefer not to answer
Attitudinal questions asked of jobseekers Luck

16
In your opinion, which of the following plays the greatest role in securing a job placement?
Who you know Educational background Previous work experience Number of jobs applied for Effort put into each application Prefer not to answer
Which of the following statements best describes your confidence in getting a job within 13 weeks?
Certain I will find a job Likely I will find a job Unlikely I will find a job Certain I will not find a job Prefer not to answer
Which of the following would you say is currently affecting your ability to find or keep work? More than one answer may be selected
None Care responsibilities (elderly/disabled) Health/disability Employment record Lack of local vacancies Care responsibilities (children) Criminal record Qualifications Lack of motivation/confidence Transport difficulties Drugs/alcohol Lack of skills Language Challenges with literacy/numeracy Prefer not to answer
The types of jobs I can get do not pay enough to make it worthwhile for me to work
Strongly agree Slightly agree Neither agree nor disagree Slightly disagree Strongly disagree
The thought of moving into new work makes me nervous There isn't enough advice and support available to help me get paid work It would be difficult for me to accept paid work now, even if I was offered it I have made a commitment to myself to find a job by a certain date I wouldn't be able to find someone to replace my role at home

17
Questions asked of Work Coaches Which of the following best describes the claimant's level of spoken English?
Native fluent Non-native fluent Good (conversational) Basic (communication possible) Poor (communication challenging/not possible)
Based on your assessment, which of the following best describes the relevance of the candidate's work experience to their target field of work?
Very relevant Relevant Limited relevance No relevance
Based on your assessment, how likely do you think it is that the claimant will find a job placement within 13 weeks?
Certain they will find a job Likely they will find a job Unlikely that they will find a job Certain they won't find a job
Which of the following best describes the impact on the claimant you expect to see from more regular job-search review meetings?
Strong positive impact Mild positive impact Mild negative impact Strong negative impact
Based on your assessment, which broad category do you think best describes the claimant?
Willing but nervous job-seekers Eager job-seekers Ambivalent claimants with few barriers Other job-seekers
Variables obtained from DWP administrative systems Any illness BA disease code Gender Male / Female Age 16-17, 18-24, 25-29, 30-39, 40-49, 50+ Ethnic group White, Black, Asian, Mixed, Chinese/other,
Prefer not to say Disabled Yes / no Any mental health condition Yes / no Partner Is there a partner recorded on DWP systems Number of dependent children 0, 1, 2, 3, or 4+ Age of youngest child 0, 1-2, 3-4, 5-10, 11-15, 16-18 Percentage of time in last two years: - on JSA - on ESA - on another income replacement benefit - in employment (four variables)
0 <25% 25-50% 50-75% 75%-99.95% 99.95-100%

18
Variables obtained from DWP administrative systems Spells in the last two years: - JSA - on ESA - on another income replacement benefit - in employment (four variables)
0 1 2-4 5-8 9+
Standard Occupational Classification First digit only, for up to three jobs sought. Index of Multiple Deprivation Overall score IMD housing Housing component of IMD IMD population density Population density component of IMD IMD income Income component of IMD IMD employment Employment component of IMD
Not all of these variables are used in every model. As an example, the variables used in the best Cadit approach (using all variables that were selected more than once by the variable selection process) are shown in the table below, in decreasing order of the frequency with which they were chosen.
Care responsibilities (children) currently affecting your ability to find or keep work Percentage of time on another income replacement benefit in the last two years I have made a commitment to myself to find a job by a certain date Which of the following best describes the claimant's level of spoken English? Standard Occupational Classification – Associate Professional and Technical Occupations Standard Occupational Classification – Administrative and Secretarial Occupations Standard Occupational Classification – Managers and Senior Officials What is the highest level of education that you have achieved? Ethnic group Gender IMD housing Lack of skills currently affecting your ability to find or keep work There isn't enough advice and support available to help me get paid work Current living situation – with dependent children under 18 Language currently affecting your ability to find or keep work Number of spells on another income replacement benefit in the last two years Daily access to a mobile Daily access to a computer (with internet) Lack of motivation/confidence currently affecting your ability to find or keep work Standard Occupational Classification – Process, Plant and Machine Operatives IMD income The types of jobs I can get do not pay enough to make it worthwhile for me to work Which of the following best describes the impact on the claimant you expect to see from more regular job-search review meetings?

19
Daily access to email How many years total work experience do you have, either relating to your desired field of work or otherwise? Current living situation – with a partner Current living situation – alone Current living situation –living with parents/relatives Confidence in getting a job within 13 weeks Drugs/alcohol currently affecting your ability to find or keep work. Criminal record currently affecting your ability to find or keep work. Standard Occupational Classification – Professional Occupations Standard Occupational Classification – Personal Service Occupations

20
Annex B – ROC curves
The following are Receiver Operating Characteristic (ROC) curves for the various logistic regression models used in this report.

21