weight ofevidence cheat sheet - · pdf fileweight ofevidence cheat sheet 1. data quality...
TRANSCRIPT

.'
Weight of EvidenceCheat Sheet
1. Data Quality (QAPP) - Whether data is considered adequate or inadequate? Wasthere a QAPP associated with the data gathering process?
2.. Linkage - Extent to which measurement endpoint links to possible BU impacts.
• High linkage example: direct measurement of a constituent concentrationexceeding established water quality objective designed to protect a specific BU.Measurements that can be used to be compared with CTR, NTR, and TIE values.
• Medium linkage - measurements that can be used to indirectly link to BU impactsuch as MTRLs for human fish consumption.
• Low Linkage - The link of the measurement is weak such as using biomakers toassess biological impact to biological communities.
3. Utility ofmeasurement- Extent to which a well-accepted standards, criteria,guidelines or other objective measurements determining if a narrative water qualityobjective is met and a BU is attained.
• High utility measurements - NAS values, FDA action levels, U.S.EPA screeningvalues, Maximum contaminant levels (MCLs), fish advisories, BPTCPapproaches, beach closures, and postings, published temperature thresholds,published sedimentation thresholds, Federal agency and other state sedimentquality guidelines, DHS bacteria standards, DG guidelines. Any adoptednumerical WQO, CTR or NTR values for a narrative objective.
• Medium utility - Accepted measurement to determine if a narrative is being metbut the applicability is limited and the scientific basis is weak or insensitive.These include Sediment apparent Effects thresholds from other states. MTRLs.
• Low utility - Measure is limited and has limited applicability and certainty.
4. Water Body Specific Information -factors associated with the measurement atWater body segment of interest which increases the confidence of the monitoringdata. These include age of data (10 years or less), environmental data measured at thesite, Species or indicator present, environmental conditions at site: seasonality,storms, land use practice, etc.
• High - 4 factors reflect the site.• Medium - 2 factors reflect the site.• Low - one factor reflect the site.
5. Spatial representativness - Relates to the degree of compatibility or overlapbetween the study area, locations of measurement or samples, locations of stressors,and locations of ecological receptors and their potential exposure.
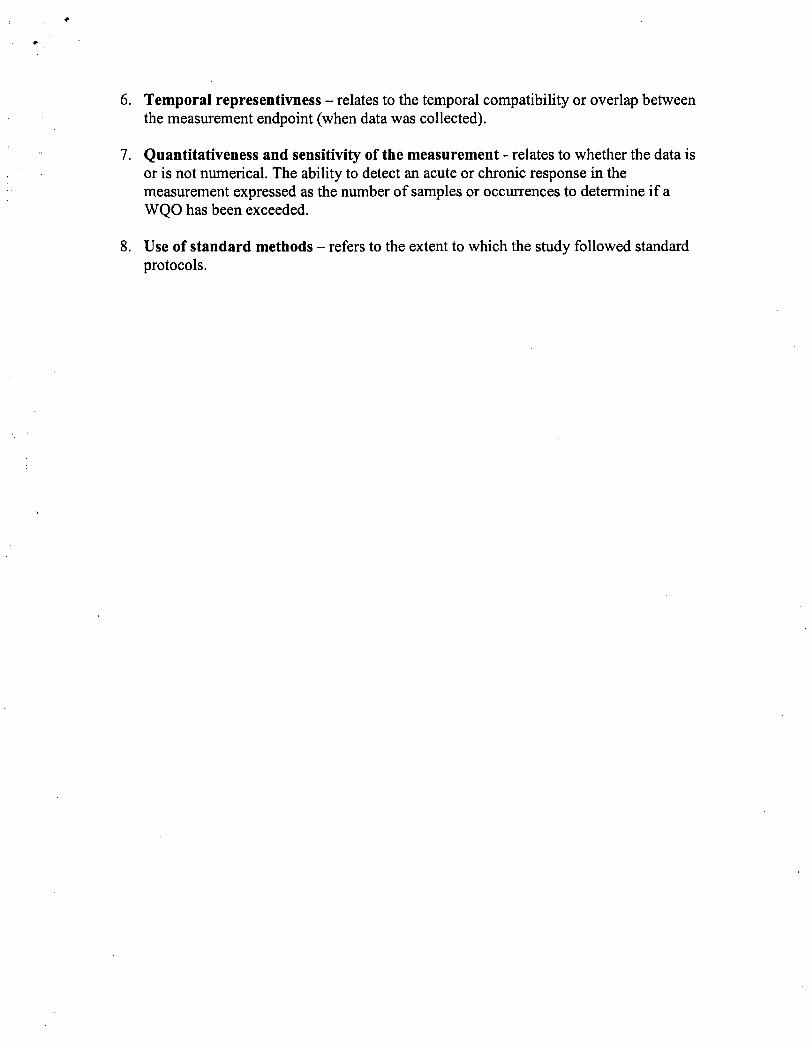
6. Temporal representivness - relates to the temporal compatibility or overlap betweenthe measurement endpoint (when data was collected).
7. Quantitativeness and sensitivity of the measurement - relates to whether the data isor is not numerical. The ability to detect an acute or chronic response in themeasurement expressed as the number of samples or occurrences to determine if aWQO has been exceeded.
8. Use of standard methods - refers to the extent to which the study followed standardprotocols.
33 uses § 1362
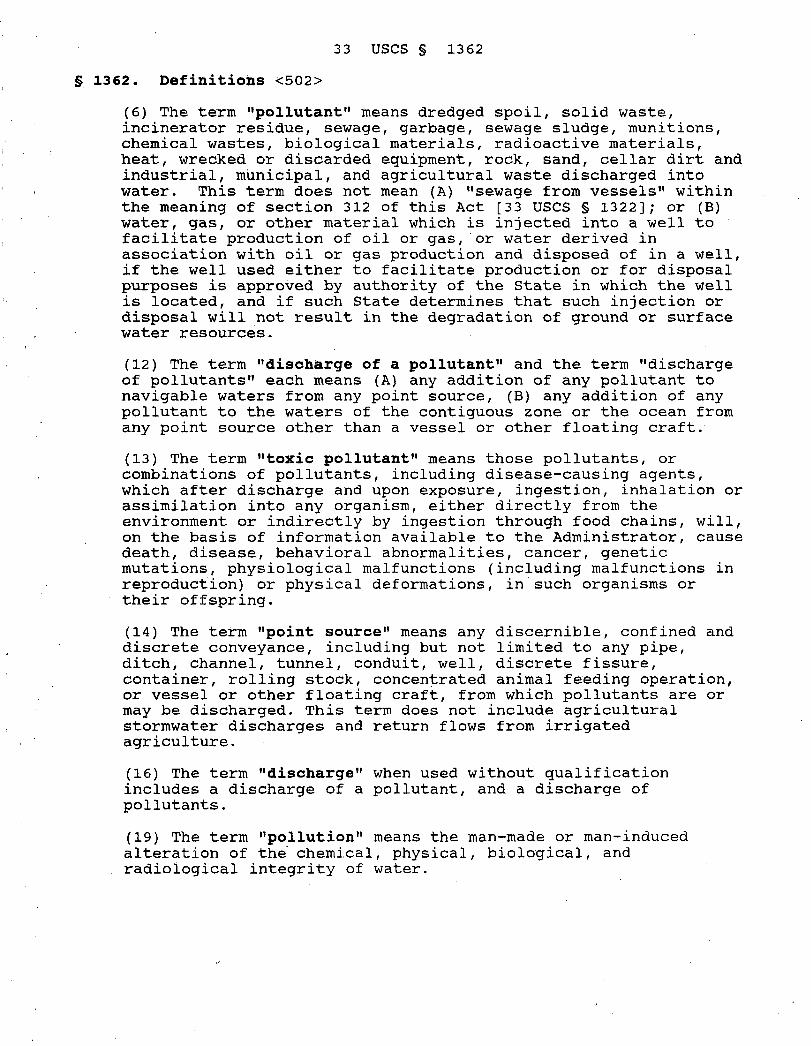
S 1362. Definitions <502>
(6) The term "pollutant" means dredged spoil, solid waste,incinerator residue, sewage, garbage, sewage sludge, munitions,chemical wastes, biological materials, radioactive materials,heat, wrecked or discarded equipment, rock, sand, cellar dirt andindustrial, municipal, and agricultural waste discharged intowater. This term does not mean (A) "sewage from vessels" withinthe meaning of section 312 of this Act [33 uses § 1322]; or (B)water, gas, or other material which is injected into a well tofacilitate production of oil or gas,or water derived inassociation with oil or gas production and disposed of in a well,if the well used either to facilitate production or for disposalpurposes is approved by authority of the state in which the wellis located, and if such state determines that such injection ordisposal will not result in the degradation of ground or surfacewater resources.
(12) The term "discharge of a pollutant" and the term "dischargeof pollutants" each means (A) any addition of any pollutant tonavigable waters from any point source, (B) any addition of anypollutant to the waters of the contiguous zone or the ocean fromany point source other than a vessel or other floating craft.
(13) The term "toxic pollutant" means those pollutants, orcombinations of pollutants, including disease-causing agents,which after discharge and upon exposure, ingestion, inhalation orassimilation into any organism, either directly from theenvironment or indirectly by ingestion through food chains, will,on the basis of information available to the Administrator, causedeath, disease, behavioral abnormalities, cancer, geneticmutations, physiological malfunctions (including malfunctions inreproduction) or physical deformations, in such organisms ortheir offspring.
(14) The term "point source" means any discernible, confined anddiscrete conveyance, including but not limited to any pipe,ditch, channel, tunnel, conduit, well, discrete fissure,container, rolling stock, concentrated animal feeding operation,or vessel or other floating craft, from which pollutants are ormay be discharged. This term does not include agriculturalstormwater discharges and return flows from irrigatedagriculture.
(16) The term "discharge" when used without qualificationincludes a discharge of a pollutant, and a discharge ofpollutants.
(19) The term "pollution" means the man-made or man-inducedalteration of th~ chemical, physical, biological, andradiological integrity of water.

()~SA
USE THIS TABLE WITH THE STANDARD RECOMMENDATION CHEAT SHEET FOR p=~Samp size Confidence to List Confidence to De-list
0.9 0.8 0.7 0.65 0.1 0.2 0.3 0.351 0 0 0 0 0 0 0 02 0 0 0 0 0 0 0 03 1 0 0 0 0 0 0 04 1 0 0 0 0 0 0 05 1 1 0 0 0 0 0 06 1 1 0 0 0 0 0 07 1 1 1 0 0 0 0 08 1 1 1 0 0 0 0 09 1 1 1 1 0 0 0 0
10 1 1 1 1 0 0 0 011 2 1 1 1 0 0 0 012 2 1 1 1 0 0 0 013 2 1 1 1 0 0 0 014 2 1 1 1 0 0 0 0,.,
0 015 2 1 1 1 0 016 2 1 1 1 0 0 0 017 2 2 1 1 0 0 0 018 2 2 1 1 0 0 0 019 2 2 1 1 0 0 0 020 2 2 1 1 0 0 0 021 2 2 1 1 0 0 0 122 2 2 2 1 0 0 0 123 3 2 2 1 0 0 0 124 3 2 2 1 0 0 1 125 3 2 2 2 0 0 1 126 3 2 2 2 0 0 1 127 3 2 2 2 0 0 1 128 3 2 2 2 0 0 1 129 3 2 2 2 0 0 1 130 3 2 2 2 0 0 1 131 3 3 2 2 0 0 1 132 3 3 2 2 0 1 1 133 3 3 2 2 0 1 1 134 3 3 2 2 0 1 1 135 3 3 2 2 0 1 1 136 4 3 2 2 0 1 1 137 4 3 2 2 0 1 1 138 4 3 2 2 0 1 1 139 4 3 3 2 0 1 1 140 4 3 3 2 0 1 1 141 4 3 3 2 0 1 1 142 4 3 3 3 0 1 1 143 4 3 3 3 0 1 1 144 4 3 3 3 0 1 1 245 4 3 3 3 1 1 1 246 4 3 3 3 1 1 1 247 4 4 3 3 1 1 1 248 4 4 3 3 1 1 1 2
,I,49 4 4 3 3 1 1 2 2

50 5 4 3 3 1 1 2 251 5 4 3 3 1 1 2 252 5 4 3 3 1 1 2 253 5 4 3 3 1 1 2 254 5 4 3 3 1 1 2 255 5 4 3 3 1 1 2 256 5 4 4 3 1 1 2 257 5 4 4 3 1 1 2 258 5 4 4 3 1 1 2 259 5 4 4 3 1 2 2 260 5 4 4 4 1 2 2 261 5 4 4 4 1 2 2 262 5 4 4 4 1 2 2 263 5 5 4 4 1 2 2 264 6 5 4 4 1 2 2 265 6 5 4 4 1 2 2 266 6 5 4 4 1 2 2 267 6 5 4 4 1 2 2 368 6 5 4 4 1 2 2 369 6 5 4 4 1 2 2 370 6 5 4 4 1 2 2 371 6 5 4 4 1 2 2 372 6 5 4 4 1 2 3 373 6 5 5 4 1 2 3 374 6 5 5 4 1 2 3 375 6 5 5 4 1 2 3 376 6 5 5 4 1 2 3 377 6 5 5 4 2 2 3 378 6 5 5 5 2 2 3 379 7 6 5 5 2 2 3 380 7 6 5 5 2 2 3 381 7 6 5 5 2 2 3 382 7 6 5 5 2 2 3 383 7 6 5 5 2 2 3 384 7 6 5 5 2 2 3 385 7 6 5 5 2 3 3 386 7 6 5 5 2 3 3 387 7 6 5 5 2 3 3 388 7 6 5 5 2 3 3 389 7 6 5 5 2 3 3 490 7 6 5 5 2 3 3 491 7 6 6 5 2 3 3 492 7 6 6 5 2 3 3 4
r'3 3 493 7 6 6 5 2
94 7 6 6 5 2 3 3 4
95 8 6 6 5 2 3 4 496 8 7 6 5 2 3 4 497 8 7 6 6 2 3 4 4
98 8 7 6 6 2 3 4 499 8 7 6 6 2 3 4 4
100 8 7 6 6 2 3 4 4

,.J~SSYY'\!L~"
~<ll~
DRAFT REPORTA WEIGHT-OF-EVIDENCE APPROACH
FOR EVALUATING ECOLOGICAL RISKS
Prepared by
MassachusettsWeight-of-Evidence Workgroup
November 2,1995

ACKNOWLEDGEMENTS
The Weight-of-Evidence Workgroup
Nancy Bettinger, Massachusetts Department of Environmental Protection (DEP),Boston, Massachusetts
Jerry Cura, Menzie-Cura & Associates, Chelmsford, Massachusetts
Ken Finkelstein, NOAA Coastal Resource Coordinator, Boston, Massachusetts
Jack Gentile, University of Miami, Miami, Florida (formerly with U.S.Environmental Protection Agency Risk Assessment Forum)
Miranda Hope Henning, McLarenlHart - ChemRisk, Portland, Maine
Jamie Maughn, CH2M Hll...L, Boston, Massachusetts
Charlie Menzie (Chairperson), Menzie-Cura & Associates, Chelmsford,Massachusetts
Dave Mitchell, ENSR, Acton, Massachusetts
Stephen Petron, CH2M Hll...L, Boston, Massachusetts (formerly with Metcalf &Eddy, Wakefield MA)
Bonnie Potocki, CDM, Federal Inc., Boston, Massachusetts
Sue Svirsky, U.S. Environmental Protection Agency, Boston, Massachusetts
Patti Tyler, U.S. Environmental Protection Agency, Lexington, Massachusetts
Other Support
Meetings were held either at Metcalf & Eddy or at Menzie-Cura & Associates. ChemRiskand Menzie-Cura & Associates provided logistical support.
Helpful comments were received from Rick Suggat (Normandeau Associates) and severalstaff members at Massachusetts Department of Environmental Protection including GaryGonyea, Steve Pearlman, and Robert Nuzzo.
i

TABLE OF CONTENTS
FOREWARD ; 1
EXECUTIVE SUMMARY 3
1.0 INTRODUCTION 51.1 Defining "Weight-of-Evidence" 51.2 Components of a Weight-of-Evidence Approach 7
2.0 SELECTING AND WEIGHING MEASUREMENT ENDPOINTS 92.1 Application of Measurement Endpoint Attributes in the Assessment Process 92.2 Consideration of Attributes in a Qualitative Evaluation 122.3 Consideration of Attributes in a Quantitative Evaluation 132.4 Weighing Measurement Endpoints 20
3.0 MAGNITUDE OF RESPONSE IN THE MEASUREMENT ENDPOINT 23
4.0 CONCURRENCE AMONG MEASUREMENT ENDPOINTS 27
5.0 A QUALITATIVE WEIGHT-OF-EVIDENCE APPROACH 30
6.0 SUMMARY 33
7.0 REFERENCES ; 34
ii

FOREWORD
This paper describes a weight-of-evidence evaluation procedure for integrating the results ofmultiple measurements in environmental risk assessments. Multiple measurements are often usedto evaluate each effect of concern. A weight-of-evidence evaluation takes into account thestrengths and weaknesses of different measurement methods when determining whether the resultsshow that a stressor has caused, or could cause, a harmful environmental effect.
The procedure outlined in this paper was developed by the Massachusetts Weight-of-EvidenceWorkgroup, an independent ad hoc group of ecological risk assessors from both government andthe private sector. The Weight-of-Evidence Workgroup grew out of the MassachusettsEnvironmental Risk Characterization Guidance Workgroup, which has met intermittently since1993 to assist the Massachusetts Department of Environmental Protection (DEP) in developinggeneral guidance for risk characterization at disposal sites pursuant to the MassachusettsContingency Plan (MCP). Workgroup members recognized that weight-of-evidence evaluation isa critical component in environmental risk assessments in general, and convened the Weight-ofEvidence Workgroup to focus on this topic.
The weight-of evidence project was conducted independently from the Massachusetts DEPWorkgroup as these issues are broadly applicable, and because there was no previously publishedgeneral guidance on the topic. It was hoped that operating outside of the constraints of a particularprogram would foster more creative thought, rigorous analysis and more open discussions in theworkgroup. The Workgroup believes that a generally applicable evaluation method will provide amore solid foundation for further method development than would a program-specificmethodology. Finally, Massachusetts DEP staff recognize that development of a broadlyapplicable method is an important first step in developing program specific guidance.
The Workgroup focused on developing a standard, quantitative evaluation procedure, which isdescribed in detail in this paper. Most members of the Workgroup believe that a standardprocedure will minimize subjectivity and promote consistency among assessments conducted bydifferent risk assessors. (Although Massachusetts DEP staff participated in the Weight-of-evidenceWorkgroup, the Massachusetts Draft Environmental Risk Characterization Guidance currentlyrecommends a qualitative approach that is based on the same criteria.)
A formal weight-of-evidence evaluation, whether qualitative or quantitative, can provide aframework for rigorous consideration of the strengths and weaknesses of various measurements,and of the nature of uncertainty associated with each of them. Applying a weight-of-evidenceevaluation in an environmental risk assessment will promote systematic analysis by the riskassessor, and documentation of the evaluation will elucidate the risk assessor's thought process. Itis important to recognize, however, that professional judgement may also be influenced by factorsother than scientific knowledge and technical expertise.
1

Professional judgement applied in the selection and evaluation of measurements may incorporateboth knowledge about the strengths and weaknesses of various measurements and beliefs aboutwhether the measurements in question are likely to overestimate or underestimate risk. Thus,regulatory agency risk assessors, who are charged with protection against harm, may tend to beskeptical about the reliability of field studies, which provide direct measures of effects but may nothave sufficient power to detect effects that could be biologically significant. At the same time, riskassessors representing the regulated community may be more wary of indirect non-site specificmeasurement methods, such as comparing contaminant concentrations to benchmark valuespublished in the literature, which often suggest effects that are not observed in the field. A formalweight-of-evidence evaluation will not eliminate the influence of such beliefs from professionaljudgement. It may, though, increase risk assessor's awareness of hislher beliefs, and elucidate forthe user/reviewer of the_as~essment the influence of beliefs on professional judgement.
Within the larger risk assessment community, the proposal outlined in this paper should not beviewed as a final product, but as a first step in the continuing effort to integrate diversemeasurement methods in environmental risk assessments and to establish a framework forinterpreting the results. The workgroup welcomes critical analysis of this proposal and encouragesother efforts to the further develop guidance for weight-of-evidence evaluations.
2

EXECUTIVE SUMMARY
Weight-of-evidence is the process by which multiple measurement endpoints are related to anassessment endpoint to evaluate whether significant risk of harm is posed to the environment. Inthis paper, a methodology is offered for reconciling or balancing multiple lines of evidencepertaining to an assessment endpoint.
Weight-of-evidence is reflected in three characteristics of measurement endpoints: a) the weightassigned to each measurement endpoint; b) the magnitude of response observed in themeasurement endpoint; and c) the concurrence among outcomes of multiple measurementendpoints. Briefly, the methodologies proposed to account for these three components are asfollows.
First, weights are assigned to measurement endpoints based on attributes related to: a) strength ofassociation between asse~sment and measurement endpoints; b) data quality; and c) study designand execution. These general categories are further divided into ten specific attributes. Therelative importance of the ten specific attributes is then scaled, based on a survey of theprofessional judgement of ten ecological risk assessors. The resultant scaling values for the tenattributes range from 0.2 to 1.0. Measurement endpoints are then scored with respect to the tenattributes. Scores may range from one (low) to five (high). Unambiguous definitions of onethrough five for each attribute are provided, to limit subjectivity in the analysis. Finally, the weightof each measurement endpoint is obtained by multiplying the scaling values by the scores assignedfor each attribute, summing these products, and dividing by 5.
Second, the magnitude of response in the measurement endpoint is evaluated with respect towhether the measurement endpoint indicates the presence or absence of harm (yes, no, orundetermined) and whether the response is low or high. In order to evaluate magnitude ofresponse, the measurement endpoint is accompanied by a set of metrics, such as: a) change ordifference in the response variable that is considered potentially ecologically relevant; b) spatialscale of the change or difference; and c) temporal scale of the change or difference.
Third, concurrence among measurement endpoints is evaluated by plotting the findings of the twopreceding steps on a matrix for each measurement endpoint evaluated. The columns of the matrixpresent the weights assigned in the first step (e.g., 1-5), while the rows of the matrix present themagnitude of effect (e.g., positive effect of high magnitude, positive effect of low magnitude,undetermined, negative effect of low magnitude, negative effect of high magnitude). The matrixallows easy visual examination of agreements or divergences among measurement endpoints,facilitating interpretation of the collection of measurement endpoints with respect to the assessmentendpoint.
For some risk assessments, the quantitative weight-of-evidence approach described above may beunwarranted, such as when measurement endpoints for a single assessment endpoint do not
3

contradict one another, or when a contradiction exists but there is a clear difference in the scientificdefensibility of the endpoints. In these cases, the weight-of-evidence approach may besubstantially simplified. A qualitative adaptation of the weight-of-evidence approach also involvesthree main steps; only the first step differs substantially from that applied under the quantitativemethod. First, each measurement endpoint is assigned a qualitative score of high, medium or lowfor each of the three principal attributes. The numbers of high, medium, and low scores for eachmeasurement endpoint are counted and the measurement endpoint is assigned an overall scorebased on the majority of attribute specific scores. Second, the risk assessor evaluates the outcomeof each measurement endpoint with respect to indication of risk of harm (e.g., positive, negative, orundetermined) and magnitude of the outcome (e.g., high or low). Third, the risk assessorintegrates the measurement endpoint weight and magnitude of response on a matrix, in order todetermine whether the overall evidence indicates a risk of harm. While this qualitative adaptationis clearly simpler to apply than the quantitative approach, it introduces greater subjectivity and mayrequire less deliberate justification for conclusions regarding the potential risk of harm to theenvironment.
4

1.0 INTRODUCTION
A weight-of-evidence approach is recognized to be is a central component of ecological riskassessment. However, there is little specific guidance on the features of evaluating weight-ofevidence. An ad-hoc workgroup was formed to define what was meant by a weight-of-evidenceapproach and to outline a methodology for implementing such an approach. This group, comprisedof representatives from the DEP, the U.S. Environmental Protection Agency (USEPA); theNational Oceanic and Atmospheric Administration (NOAA), and six environmental consultingfirms, met on an approximately monthly basis from November 1994 to June 1995. The groupsystematically examined various aspects of a weight-of-evidence approach and developed amethod that reflects and makes transparent the underlying professional judgements associated withusing a weight-of-evidence approach to characterize ecological risks. This paper presents theresults of the workgroup meetings and proposes a method for implementing a weight-of-evidenceapproach. The ecological risk assessment terminology follows the USEPA's Framework forEcological Risk Assessment (USEPA, 1992).
This paper is organized around the components of a weight-of-evidence approach, as definedbelow. The manner in which these components are incorporated into an ecological risk assessmentare also described, along with a simple case example. Key points of discussion or analyses arehighlighted throughout the paper.
1.1 Derming "Weight-or-Evidence"
Although the term "weight-of-evidence" is used frequently in ecological risk assessment, there isno consensus on its definition or how it should be applied. Published definitions or descriptionsinclude:
"Each risk estimate will have its own assumptions and associated uncertainties and thesemay not be expressed equivalently. The separate lines of evidence must be evaluated,organized in some coherent fashion, and explained to the risk manager so that a weight-ofevidence evaluation can be made." Suter (1993).
"Risk description has two primary elements. The first is the ecological risk summary,which summarizes the results of the risk estimation and uncertainty analysis and assessesconfidence in the risk estimates through a discussion of the weight-of-evidence." EPA 'sFrameworkfor Ecological Risk Assessment (USEPA, 1992).
"For many Superfund ecological risk assessments, a weight-of-evidence approach will beused. This frequently will require that different types ofdata are evaluated together. Thesetypes ofdata may include toxicity test results, assessments of existing impacts on-site, ortrue risk calculations comparing estimated exposure doses with toxicity values from theliterature. Balancing and interpreting the different types ofdata can be a major task. .. the
5

strength ofevidence provided by different types of tests and the precedence that one type ojstudy has over another should already have been determined...This will insure that datainterpretation is objective and not designed (i.e., biased) to support a preconceivedanswer. " USEPA's Draft Ecological Risk Assessment Guidance for Superfund (USEPA,1994).
The workgroup considered the available definitions and descriptions and derived a description thatrelates the weight-of-evidence approach to the process of conducting an ecological risk assessment:
"The weight-of-evidence approach is the process by which measurement endpoints arerelated to an assessment endpoint to evaluate whether a significant risk ofharm! is posedto the environment. The approach is planned and initiated at the problem fonnulationstage and results are integrated at the risk characterization stage. "
This definition provides an explicit link between risk characterization and the assessmentendpoints developed during problem formulation. Because the weight-of-evidence approachinvolves the process of relating measurement endpoints to an assessment endpoint, these two termsare defined below.
Assessment endpoints are explicit expressions of the actual environmental value that is tobe protected. They reflect social and ecological priorities and are expressed in a manner that can beevaluated through an objective scientific process. They are most useful when they are expressed interms of a specific receptor (species, habitat, system) and a function or quality that is to bemaintained or protected.
Examples of clearly defined and ecologically relevant assessment endpoint are:
• maintenance of a benthic community that can serve as a prey base for local fishpopulations;
• reproductive success of the mink population within foraging range of the contaminatedarea; and
• community structure and reproductive success of songbird populations within acontaminated area.
Measurement Endpoints are the lines of evidence used to evaluate the assessmentendpoint. Multiple measurement endpoints are often associated with a single assessment endpoint.The measurement endpoints are the bases for structuring the analysis phase of an ecological risk .
InSignificant risk of harm" is the term used within the Massachusetts MCP to describe an unacceptable risk outcome.
6

assessment and serve as the actual measurements used to estimate risk. Therefore, they should beexplicitly related - either directly or indirectly - to specific assessment endpoints. Further, theyshould include metrics (e.g., degree of response, space, and/or time) that can be used as a basis forestimating risks. I
Examples of appropriate measurement endpoints for the example assessment endpoint,maintenance ofa benthic community that can serve as a prey base for local fish, are:
• concentration of chemical of concern in sediment, relative to levels reported in the scientificliterature to be harmful;
• toxicity observed in a whole sediment bioassay at levels considered significant according tothe test protocol; and
• benthic invertebrate community structure, relative to reference areas.
1.2 Components of a Weight-of-Evidence Approach
The workgroup identified three major components that reflect the weight-of-evidence ofmeasurement endpoints, with respect to a specific assessment endpoint:
1. Weight assigned to each measurement endpoint: Measurement endpoints may vary in thedegree to which they relate to the assessment endpoint, the quality of the data, or themanner in which they were applied. Based on these attributes, an investigator may assignmore weight to or have more confidence in one measurement endpoint compared toanother.
2. Magnitude ofresponse in the measurement endpoint: Strong or obvious responses aretypically assigned greater weight than marginal or ambiguous responses.
3. Concurrence among measurement endpoints: More weight or confidence is generallyattributed to fmdings in which there is agreement among multiple measurement endpoints.An investigator generally has less confidence in findings in which the lines of evidencecontradict one another.
In the following sections, a weight-of-evidence approach is presented, based on these threecomponents (Sections 2 - 4). The approach is quantitative inasmuch as numerical values areassigned to elements of professional judgement; the judgements themselves can be based on anumber of qualitative as well as quantitative considerations. Section 5 presents a qualitative (i.e.,non-numerical) approach to weighing evidence. The conceptual approach is illustrated in Figure 1.
7

Figure 1Implementing a Weight-of-Evidence Approach
Within an Ecological Risk Assessment for Contaminated Sites(Note: this is a simplified figure of the overall ecological risk process)
PROBLEM FORMULATION
• Identify Contaminants of Ecological Concern• Identify Potential Exposure Pathways• Identify Ecological Receptors
• Select Assessment Endpoints• Select Measurement Endpoints for each Assessment Endpoint
- Consider the ten attributes for weighting measurement endpoints asa basis for selection
- Establish basis for evaluating the measurement endpoint withregard to evidence of harm and the magirltude of harm
• Develop Scope for Analysis and Risk Characterization Phases- Consider the attributes for weighting measurement endpoints as a
basis for designing elements of the Analysis Phase
ANALYSIS
• Characterization of Exposure• Characterization of Ecological Effects
I
RISK CHARACTERIZATION
• Present Results
For Each Assessment Endpoint:• Evaluate Weight or Strength of Each Measurement Endpoint Using the Ten
Attributes• Evaluate Magnitude of Response for Each Measurement Endpoint• Evaluate Concurrence among Measurement Endpoints• Provide Conclusion Regarding Risk of Harm• Present Uncertainties Associated with the Risk Characterization
8

Some members ofthe group feltthatthe attribute related to qualityofdatashould'be·evaluated
"separately"aneLpriorto theweighing',of',the'measurementendpoints. As ,a:result,we,ighingschemes :were.'developed\'\dth,,and'withouthis, attribute;, ,
2.0 SELECTING AND WEIGHING MEASUREMENT ENDPOINTS
A weight-of-evidence evaluation enables the risk assessor to follow a process to determine on arelative scale those measurement endpoints that best represent the assessment endpoint, so that theyhave greater influence on the conclusions of the risk assessment. The approach outlined in thispaper involves considering specific attributes of each measurement endpoint to determine how wellthe endpoint represents theassessment endpoint. Attributesare defined as the characteristics ofa measurement endpoint thatdetermine how well it estimates orpredicts the effect defined by theassessment endpoint.Consideration of the specificattributes defined later in thispaper enable the risk assessor toidentify the measurementendpoints that best represent theassessment endpoints, and to givethem more weight in the riskassessment.
The workgroup identified ten attributes considered most important in selecting and weighingmeasurement endpoints. These were grouped into three categories: (1) attributes related to strengthof association between assessment and measurement endpoints; (2) attributes related to data qualityand (3) attributes related to study design and execution. Table 1 presents definitions of theattributes in each of these groups.
2.1 Application of Measurement Endpoint Attributes in the Assessment Process
The question of how well a measurement endpoint represents an assessment endpoint arises at twoseparate points in the risk assessment process: (1) in the problem formulation stage, when the riskassessor selects optimal measurement endpoints for evaluating each assessment endpoint, and (2) inthe risk characterization stage, when the risk assessor evaluates whether the results of variousmeasurements (which may contradict each other) indicate a risk of harm to the environment. Thus,the ten attributes listed in Table 1 are applied both in·selecting measurement methods (andendpoints) and in weighing different results obtained from different measurements. Considerationof these attributes during selection of measurement endpoints in the problem formulation phase willhelp ensure that the overall study design is strong and scientifically defensible and that the findingsof the ecological risk assessment are conclusive.
9

Table 1
Attributes for Judging Measurement Endpoints
In the weight-of-evidence procedure, ten attributes of each measurement endpoint areevaluated. For a given assessment endpoint, the quality of each measurement endpoint iscompared with respect to these attributes. Those measurement endpoints with the highestquality for the most attributes are given the greatest weight in the overall characterization ofrisk. The attributes for consideration are: .
I. Attributes Related to Strength of Association Between Assessment and MeasurementEndpoints
Biological linkage between measurement endpoint and assessment endpoint.This attribute refers to the extent to which the measurement endpoint is representative of,and correlated with, or applicable to the assessment endpoint. If there is no biologicallinkage between a measurement endpoint (e.g., a study that may have been performed forsome other purpose) and the assessment endpoint of interest, then that study should not beused to evaluate the stated assessment endpoint. Biological linkage pertains to similarity ofeffect, target organ, mechanism of action, and level of ecological organization.
Correlation of stressor to response.This attribute relates the ability of the endpoint to demonstrate .effect from chronicexposure to the stressor and to correlate effects with the degree of exposure. As such, this!1ttribute also takes into consideration the susceptibility of the receptor and the magnitudeof effects observed.
Utility of measure for judging environmental harm.This attribute relates the ability to judge results of the study against well-acceptedstandards, criteria, or objective measures. As such, the attribute describes the applicability,certainty, and scientific basis of the measure, as well as the sensitivity of a benchmark indetecting environmental harm. Examples of objective standards or measure for judgmentmight include ambient water quality criteria, .sediment quality criteria, biological indices,and toxicity or exposure thresholds recognized by the scientific or regulatory communityas measures of environmental harm.
II. Attributes Related to Data Quality
Extent to which data Ouality Objectives are Met.This attribute reflects to degree to which data quality objectives are designated that arecomprehensive and rigorous, as well as the extent to which they are met. Data qualityobjectives should clearly evaluate the appropriateness of data collection and analysispractices. If any data quality objectives are not met, the reason for not meeting them andthe potential impact on the overall assessment should be clearly documented.
10

III. Attributes Related to Study Design and Execution
Site-specifi city.This attribute relates the extent to which chemical and biological data, environmentalmedia, specie, environmental conditions, benchmark (or reference), and habitat types thatare used in the measurement endpoint reflect the site of interest.
Sensitivity onhe measurement endpoint for detecting changes.This attribute relates to the ability to detect a response in the measurement endpoint,expressed as the percentage of the total possible variability that the endpoint is able todetect. Additionally, this attribute reflects the ability of the measurement endpoint todiscriminate between responses to a stressor and those resulting from natural or designvariability and uncertainty.
Spatial representativeness.This attribute relates to the degree of compatibility or overlap between the study area.locations of measurements or samples, locations of stressors, and locations of ecologicalreceptors and their potential exposure.
Temporal representativenessThis attribute relates to the temporal compatibility or overlap between the measurementendpoint (when data were collected or the period for which data are representative) and theperiod during which effects of concern would be likely to be detected. Also linked to thisattribute is the number of measurement or sampling events over time and the expectedvariability over time.
QuantitativenessThis attribute relates to the degree to which numbers can be used to describe the magnitudeof response of the measurement endpoint to the stressor, as well as whether results areobjective or subjective,whether the results are sufficient to test for statistical significance,and whether biological significance can be inferred from statistical significance.
Use of a standard method.The extent to which the study follows standard protocols recommended by a recognizedscientific authority for conducting the method correctly. Examples of standard methodsare study designs or chemical measures published in the Federal Register of the Code ofFederal Regulations, developed by ASTM, or repeatedly published in the peer reviewedscientific literature, including impact assessments, filed surveys, toxicity tests, benchmarkapproaches, toxicity quotients, and tissue residue analyses. This attribute also reflects thesuitability and applicability of the method to the endpoint and the site, as well as the needfor modification of the method.
11

Selecting and linking measurement endpoints to assessment endpoints provides a basis for planningthe scope of the Analysis phases of the risk assessment.
Consideration of these attributes in the risk characterization phase fosters a systematic and balancedconsideration of the strengths and weaknesses of the information derived from each measurementapproach. Further, a full discussion of how the attributes are considered in the weight-of-evidenceevaluation elucidates the risk assessor's thought process and professional judgements. A rigorousexplanation of the links and gaps between the measurement results and the risk assessor'sconclusions enables risk mangers to make decisions with a clear understanding of the uncertaintiesinherent in the assessment. .
Some members of the workgroup felt that, when using a weight-of-evidence evaluation tocharacterize risk, the attribute related to quality of data should be evaluated separately and prior tothe weighing of the measurement endpoint. One suggested approach is to consider data quality asa pass/fail criterion, as follows:
• if the quality is adequate, the measurement endpoint is retained for consideration inthe risk characterization, but the data quality is not considered as a factor in theweight-of-evidence evaluation;
• if the data quality is inadequate, the endpoint is not considered in the risk.characterization step.
Other members of the workgroup felt that data quality should be fully considered in the weight-ofevidence evaluation. As a result, weighing schemes were developed both with and without theattribute.
A weight-of-evidence evaluation may be qualitative or quantitative. The workgroup focused on adeveloping a quantitative approach, because many members felt that a quantitative scheme wouldbe applied more consistently and would minimize subjectivity. However, a qualitative evaluationwould use the same attributes. Quantitative and qualitative approaches are discussed in thefollowing sections.
2.2 Consideration of Attributes in a Qualitative Weight-of-evidence Evaluation
When selecting measurement methods or characterizing risk, the attributes listed in Table 1 can beconsidered qualitatively, without assigning any numerical values. The evaluations should considerboth the relative importance ofeach attribute· and the quality (or efficacy) of the measurementendpoint with respect to each attribute.
12

For different assessment and measurement endpoints, the relative importance of some of theattributes may vary. One advantage of a qualitative approach is that the relative importance of eachattribute is not fIxed, and can be considered differently on a case by case basis.
In a qualitative weight-of-evidence evaluation, the efficacy of the measurement endpoint relative toeach attribute can be described in non-numeric terms. The qualitative approach described inSection 5.0 uses ratings of high, medium and low to describe the quality a measurement endpointwith respect to individual attributes and groups of attributes.
2.3 Consideration of Attributes in a Quantitative Weight-of-evidence Evaluation
In a quantitative weight-of-evidence evaluation, the attributes are used to assign weights to eachmeasurement endpoint. The process of assigning weights to measurement endpoints incorporatestwo elements:
1. The relative importance of each attribute: Investigators consider some attributes moreimportant than others when considering the overall weight of measurement endpoints.
2. The scores that a measurement receives with respect to each attribute: When measurementendpoints are compared with respect to each of the attributes, some will score better thanothers.
These two elements of assigning weights to measurement endpoints are described in the next threesubsections.
2.3.1 Scaling the Relative Importance of Attributes
'There was considerable discussion
"wit~irl',Jhe::gI::Ol1:~:r~;g(lFqil);g.pp.e :'·'l1leiitsof~scalmg,'the:attribut~s.tQ:·
,· •.••[e?;c~ ••.r~l~tiy~ ••..~ir1P0l"tance ....,~ •...strong.
"';~~~W~0;~~~~~;j~~~;~)}~·deci<i~d:topr()ceed:t().d~velop:a
,. 'scaling"systein. . ,
The ten attributes can either beassigned equal importance or theycan be scaled to reflect their relativeimportance in weighingmeasurement endpoints. Therelative importance of each attributeis subjective and reflects professionaljudgement. To facilitateimplementation of the weight-ofevidence approach, the workgroupdeveloped a set of fIxed scalingvalues that reflect collectiveprofessional judgement and can be
13

applied to ecological risk assessments.
If an investigator chooses to diverge from this fixed set of scaling values, he or she can present an ,alternative set of scaling values and rationale for their use. However, a set of values based oncollective professional judgement reflects the range of opinion that exists among scientists; as such,bias that may be held by anyone scientist, is minimized or avoided altogether. The set of scalingvalues described below were developed based on a survey of ten experienced ecological riskassessors. Because of variability among individuals' professional judgement a survey of a largeror different group of ecological risk assessors might yield somewhat different scalingvalues.
Survey of Ecological Risk Assessors
Ten ecological risk assessors participated in a survey with the objective of scaling the relativeimportance of the ten attributes listed in Table 1. The participants were provided with a matrixlisting the attributes horizontally and vertically. They were provided with the followinginstructions:
1. Score the attributes on the top (horizontal) row of the diagram against the ones on the left(vertical) column using "+s", "_S", or 0 as follows:
+++ if the attribute in the top row is much more important than the attribute in the leftcolumn;
++ if the attribute in the top row is more important than the attribute in the leftcolumn;
+ if the attribute in the top row is sliWtly more important than the attribute inthe left column;
o if the attribute in the top row is as important as the attribute in the leftcolumn;if the attribute in the top row is slightly less important than the attribute inthe left column;if the attribute in the top row is less important than the attribute in the leftcolumn;if the attribute in the top row is much less important than the attribute in theleft column.
14

2. Please answer the following questions:Which attribute(s) do you think are most important on a relative basis?:Which attribute(s) do you think are least important on a relative basis?:Please check how much greater importance would you give to the most importantattribute(s) as compared to the least important ones?:
they're all of equal importance __2 x as important __5 x as important __10 x as important __20 x as important __50 x as important __lOa x as important __
The "+s" and "-s" in each participant's matrix were converted to numerical values ranging from 3(for 3 +s) to -3 (for 3 -s) ..Each combination of values was entered into a table and the average andrange of values was obtained for each pair of attributes. The average and ranges provided anindication of the relative importance of each of the attributes.
As shown in the second section of the survey, participants also provided information on how muchmore important they viewed the most important attribute relative to the least. Respondents gavevalues that ranged from 2 to 50. The geometric mean of the values was 11. The survey resultsindicated that people differed slightly on their choices of the most and least important attributes.Therefore, the range was adjusted to reflect the average spread in the following manner. Using the"+" and "_" system, the maximum spread between any two attributes was 3 (i.e., 3 +s or 3 -s) butthe maximum spread among the averaged values was 1.8, or 60% of the total possible range. Thegeometric mean range of 11 was multiplied by 0.6 to yield an adjusted range of 6.6. The mostimportant attribute was assigned a scaling value of 1.0 and values for other attributes were adjustedto correspond with their relative importance and to fit within an overall range of 6.6. The resultswere then rounded to one significant figure which yielded an overall range of 5 (from 0.2 to 1.0).Because the workgroup could not reach consensus on the most appropriate role of the attribute dataquality in the overall weight-of-evidence approach, scaling values were calculated that bothincluded and excluded the attribute related to the quality of data. The resultant values for scalingthe relative importance of the attributes are given in Table 2. The values provided in the tablecould be applied to most ecological risk assessments, inasmuch as they reflect collective judgementindependent of the measurement endpoints that they are used to help weigh.
15

Table 2Value Scale Representing the Relative Importance of Attributes
Attribute Scaling Values Including Scaling Values ExcludingQuality of Data Quality of Data
Degree of Association 1.0 1.0
StressorlResponse 0.7 0.6
Utility of Measure 0.5 0.4
Quality of Data 0.8 X
Site Specificity 0.5 0.5
Sensitivity 0.5 0.5
Spatial Representativeness 0.4 0.4,
Temporal Representativeness 0.2 0.2
Quantitative Measure 0.2 0.2
Standard Measure 0.2 0.2
2.3.2 Scoring the Attributes
When evaluating measurement endpoints using the ten attributes it can be expected that theendpoints will conform with the attributes to varying degrees. The workgrpup developedguidelines for scoring a measurement endpoint against each attribute to quantify this variability. Arange in score from one (low) to five (high) was selected, because it was perceived as having abroad enough spread to allow differentiation between scores for measurement endpoints, withoutbeing overly cumbersome. The workgroup established non-overlapping, comprehensive, andbroadly applicable criteria based on the most relevant considerations for each attribute for assigningnumeric scores to measurement endpoints (Table 3). .
16

Table 3
DefInition of Scores Applied to Endpoint-Attribute Pairs in Wei~bt of Evidence for Ecolo~icalRisk AssessmentI Attributes Related to Strenl!th of Association Between Assessment and Measurement Endpoints
Attribute Factors to Consider in Rankine I 2 3 4 5Biological linkage Correlation and/or applicability of Biological processes link Biological process Measurement and Measurement and assessment Assessment endpoint is directly
between measurement measurement endpoint with respect the measurement endpoint directly links the assessment endpoints are endpoints are directly linked measured and, therefore, isendpoint and to assessment endpoint; linkage to the assessment measurement and directly linked and the and the adverse effect, target equivalent to the measurement
assessment endpoint based on known biological endpoint only indirectly*, assessment endpoints. adverse effec~ target organ, mechanism of action, endpoint.
processes; similarity of effec~ target yielding a weak althougb the specific organ, and mechanism of and level of ecological
organ, mecbanism of action, ad level correlation between tlJe effect, target organ, and action are the sanle for organization are tlle same for
of ecological organization assessment and mechanism of action both endpoints; however, both endpoints
measuremcnt endpoints evaluated are not tlle the levels of ecological
,s~me organization differ**
Correlatinn nf stressor to Ability of endpoint to demonstrate Endpoint response to In previous studies, In previous studies, Response is quantitatively Statistically significant correlation
response effects from chronic exposure to stressor has not been endpoint response to endpoint response to correlated with magnitude of is demonstrated
stressor and to correlate effects with demonstrated in previous stressor has been stressor has been exposure, but correlation is
degree of exposure; susceptibility studies but is expected to, suggested, but has not demonstrated, but not statistically significant
and magnitude of effeclS. based upon demonstmted been definitely proven response is not correlated (or data are not sufficient to
response to similar with magnitude of test for statistical
suessors exposure significance)
Utility of measnre for Applicability, certainty, and Measure is developed by Measure is personal Measure is well accepted Measure is well accepted and Measure is well accepted and
judging environmental scientific basis uf measure tllat is the investigator (I.e., index and has either and developed by a third developed by a third party developed by a third party and has
harm used to judge enviromnental harm; personal index) and has limited applicability or party but has either and has modemte certainty, very high levels of certainty and
sensitivity of benchmark in limited applicability and cenainty or the scientific limited applicability or applicability and scientific applicability, as well as a very
detecting environmental h311ll certainty and the scientific basis is weak or the cenainty or tlle scientific basis and benchmark is strong scientific basis and
basis is weak and the benchmark is relatively basis is weak or the moderately sensitive benchmark is very sensitive
benchmark is relati vely insensitive benchmark is relatively
insensitive insensitive
An example of an indirect biological link is measurement of community structure for tl,e assessment endpoint of neurotoxicity** An example of differing levels of ecological organization is measurement of impacts to individual organisms of a single species

Table 3 (continued)
Definition of Scores Applied to Endpoint-Attribute Pairs in Weigbt of Evidence for Ecological Risk AssessmentIII. Attributes Related to Studv Desim and Execution
-.,
Attribute Factors to Consider in RankinR 1 2 3 4 5Site-spedfidty Representativeness of chemical Only one or two of the Three of the six factors Four of the six factors Five of the six factors . All six factors (i.e.• data,
or biological data, six factors (i.e.• data. are.derived from or are derived from or are derived from or media. species. env.
enviromnental media. species. media, species. env. renect the site renect the site reUect the site conditions. benchmark,
environmental conditions, conditions. benchmark. habitat type) are derived
benchmarlc: (or reference) and habitat type) is derived from or renect the site (i.e.•
habitat types that are used in from or renects the site both data and benchmatk
the measurement endpoint reflect site conditions)
relative to those present at the
site
Sensitivity of the The percentage of the total Endpoint can detect Endpoint can detect Endpoint can detect Endpoint can detect Endpoint can detect changes
measurement endpoint possible variability that the changes laIger than changes between IOOX changes between lOX changes between 2X and of less than 2X
for detecting changes endpoint is able to detect; I.OOOX and I.OOOX and99X 9X
ability of measurement
endpoint to detect effects from
stressor, rather than from
natural or design variability or
uncertainty
Spallal represent- Spatial overlap of stody area, The locations of two of The locations of two of The locations of three of The locations of four of The locations of five of the
ativeness measurement or sampling the following subjects the following subjects the following subjects the following subjects following subjects overlap
stations. locations of stressors. overlap spatially only to a overlap spatially: study overlap spatially: study overlap spatially: study spatially: study area.
locations of receptors, and limited extent: study area, area, area, area, sampl.inglmeasurement site.
points of potential exposure to sampling/measurement sampling/measurement sampling/measurement sampling/measurement Slressors. receptors. and
those receptors" site, stresSQ~, receptors, site, stressors. receptors, site, stressors, receptors. site. StresSOfS, receptors, points of potential exposure
and points of potential and points of potential and points of potential and points of potential
exposure _exposure exposure exposure
Temporal Temporal overlap between the Measurements are Measurements are Measurements are Measureroentsare Measurements are collected
representativeness measurement period and the collected during a season COllected dUring a collected during the collected during the dUring the same period that
period dUring which chrOnic different from when season different from same period that effects same period that effects effects would be expected to
effects would be likely to be effects would be expected when effects would be would be expected to be would be expected to be be most clearly manifested;
detected (daily. weekly. 10 be most dearly expected to be mosl most clearly manifested; most clearly manifested; ANDseasonally. annually). manifested; AND clearly manifested; OR AND AND

TABLE 3 (continued)
Definition of Scores Applied to Endpoint-Attribute Pairs in Weight of Evidence for Ecological Risk AssessmentII. Attributes Related to Data Quality
Allribute Factors to Consider in Rankin!! I 2 3 4 5Quality oC data Extent to which DQOs' are met Three or more DQOs are Two DQOs are not met One DQO is not met One DQO is not met and All DQOs are met AND
not met OR AND AND
DQOs barely meet the DQOs meet the needs of DQOs meet the needs of DQOs are rigorous and DQOs are rigorous andneeds of tbe risk the risk assessment the risk assessment comprehensive AND comprehensiveassessment OR satisfactorily AND satisfactorily AND
There is no Reason for not meeting Reason for not meeting Reason for not meetingdocumentation of the DQOs and the impact DQO and the impact on DQO and the impact on thereason for not meeting on the assessment are the assessment are clearly assessment is clearlyDQO and the impact on documented documented documentedthe assessment satisfactorily
Note:
A field and Laboratory Reference. EPA600 3-89/013.

Table 3 (continued)
Defmition of Scores Applied to Endpoint-Attribute Pairs in Weight of Evidence for Ecological Risk Assessment
III A"b R ltd t Stud D" d E fttn utes eae 0 IV esum an xecu Ion
Attribute Factor.; to Consider in Rankin!! I 2 3 4 5Temporal Number of measurement or A single sampling or [A single sampling or A single sampling or Two sampling or ElTIIER [two sampling
representativeness sampling events over time, and measurement event is measurement event is measurement event is measurement events are events are conducted and
(continued) conducted; AND conducted; AND conducted; AND conducted; AND variability is low OR
Expected variability over time High variability in that High variability in that Moderate variability in Moderate variability in multiple sampling events are
parameter is expected over panuneter is expected that parameter is that panuneter is conducted and variability is
time over time) expected over time. expected over time moderate to high)
Quantitativeness Results are Results are qUalitative and Results are qualitative Results are quantitative, Results are quantitative Results are quantitative and
quantitative/qualitative, are subject to individual and are not subject to but data are insufficient and may be tested for may be tested for statistical
subjective/objective, sufficient interpretation individual interpretation to test for statistical statistical significance, significance; such tests
to lest for statistical (i.e., objective) significance but such tests do not clearly reOect biological
significance, and extent to clearly reflect biological significance
which biolo!!ical sil!nificance simificance
Use of a standard Method availability; ASTM Method has never been Method is one of the 6 A standard method A standard method A standard method exists
method approval; suitability & published AND listed methodologies, exists, but its suitability exists and it is directly and is directly applicable to
applicability to endpoint and methodology is not an but dIe particular for this purpose is applicable to the the measurement endpoint
site; need for modificatioo of impact assessment, field application is neither questionable, and it measurement endpoint, and it was developed
metlJOd; relationship to impact survey, toxicity test, published nor must be modified to be but it was not developed precisely for this purpose
assessment, field survey, bencJlffiark approach, standardized applicable to site precisely for this and requires no modification
toxicity test, benclunark, toxicity quotient, or specific conditions purpose and requires OR the methodology is used
toxicity quotient, or tissue tissue residue analysis slight modification OR in three or more peer-residue analysis methOdologies the methodology is used reviewed studies
in two peer-reviewed,studies
* Study area, sampling station, and points of exposure are differentiated by level of specificity. While the stody area may be a 5 acre wetland, sampling stations may 0
the 2 acres that are accessible, while the actual points of exposure to invertebrate receptor.; may be the top 6 inches of sediment

2.4 Weighing Measurement Endpoints
The weight of a measurement endpoint is obtained by multiplying the scaling values (Table 2) bythe scores the measurement endpoint is assigned for each attribute (using Table 3), summing theproducts for each measurement endpoint, and dividing by 5 (or 4 if quality of data is excluded), toyield weighing values th~t range between 1 and 5:
Measurement endpoint weight = I: (scaling value * score)/5
The measurement endpoint weights are then rounded to the nearest whole number. Spreadsheetscan be used to automate the calculations, as illustrated in Table 4. This step provides a quantitativemeasure of the first component of the weight-of-evidence - the weight given each measurementendpoint. The workgrou~ discussed the most appropriate number of significant figures for theweights of individual measurement endpoints, but did not reach a consensus. Whole numbers are asimplification and reflect the limited precision of the process However, two or more significantfigures enable the risk assessor to more clearly differentiate between two measurement endpointswith similar weights. Additional case studies may elucidate which approach is more appropriate.
Example:Determining Weight of Measurement Endpoints
To illustrate the weight-of-evidence approach, the following example is used. Sedimentsof a river have been contaminated with an organic chemical that is acutely andchronically toxic to aquatic life. Several assessment endpoints have been developed forevaluating risks at the site. One of the assessment endpoints is maintenance ofa benthiccommunity that can serve as a prey base for local fish. Three measurement endpointswere chosen to evaluate the assessment endpoint: A) the concentration of chemical in thesediments in relation to levels reported to be harmful; B) toxicity as measured in a wholesediment bioassay, where mortality in excess of 20% is considered an adverse effect; andC) abundance and community structure of invertebrates that compose the diet of localfish species at and near the release location, as compared to reference areas. The riskassessor has examined these three measurement endpoints against the ten attributes andscored them in Table 5. The scores reflect a number of site-specific factors.
20

Table 4
Scoring Measurement Endpoints (Scheme A)Score Each Measurement Endpoint from Low to High (1· 5)
Assessment Endpoint: _
Measurementd C
MeasurementMeasurementWeighingAttributesW" h" Felgl 109 actors Factors Endpoint A Endpoint B En Ipoint
I Relationship BetweenMeasurements and Assessment Endpoints
• Degree of Association 1.0• Stressor/Response 0.7• Utility of Measure 0.5
II Data Quality
• Quality of Data 0.8
III Study Design
• Site Specificity 0.5• Sensitivity 0.5• Spatial Representativeness 0.4• Temporal Representativeness 0.2• Quantitative Measure 0.2• Standard Method 0.2
( Sum scores·weighting factors)/5 1
Round to nearest whole number

3.0 MAGNITUDE OF RESPONSE IN THE MEASUREMENT ENDPOINT
As discussed in Section 1.2, the magnitude of the response in the measurement endpoint isconsidered together with the measurement endpoint weight in judging the overall weight-ofevidence. The workgroup divided magnitude of response into two questions:
1. Does the measurement endpoint indicate the presence or absence of harm (yes, no, orundetermined)?
2. Is the response low or high?
While these issues are presented above as discrete functions, the workgroup recognizes thatresponses are more likely to occur as continuous gradients, and that the risk assessment maypresent the results as such. However, the workgroup agreed that discrete categories accompanyinga detailed analysis would more clearly communicate results to risk managers and others.
MetricsIn order to evaluate magnitude of response, the measurement endpoints must be accompanied by aset of metrics. Ideally, such metrics are established during the problem formulation stage, throughdiscussions with the risk manager. They may be accompanied by a statement of the valueconsidered statistically significant, if possible. In general, one or more of the following metrics isincluded for evaluating the response in the measurement endpoint:
1. A change or difference in the response variable that is considered potentially ecologicallyrelevant (e.g., percent of mortality or change in abundance or biomass);
2. Spatial scale of the change or difference, as related to the assessment endpoint (e.g.,hectares, fraction of foraging area, fraction of area utilized by a local population);
3. Temporal scale of the change or difference, as related to the assessment endpoint [duration,changes over time with and without natural stressors (e.g., as storms or floods), rate ofrecovery].
Prior to determining the magnitude of effect, the risk assessor should consider at what level(s) aresponse would be considered indicative of environmental harm with respect to the assessmentendpoint. If possible, it is helpful to set specific criteria for establishing these thresholds. The riskassessor should consider, a priori what represents a "low" or "high" response along a responsegradient. Within the analysis and risk characterization sections of a report, the risk assessor shouldpresent and discuss the details of the considerations and their interpretation.
23

Table 5
Scoring M~asurement Endpoints (Scheme A)Score Each Measurement Endpoint from Low to High (1 - 5)
Assessment Endpoint: Maintenance of a benthic community that can serve as a prey base for local fish.
Attributes Weighing Measurement Measurement MeasurementWeighing Factors Factors Endpoint A Endpoint B Endpoint C
I Relationship BetweenMeasurements and Assessment Endpoints
• Degree of Association 1.0 1 3 5• Stressor/Response 0.7 3 5 2• Utility of Measure 0.5 4 4 2
II Data Quality
• Quality of Data 0.8 4 5 2
III Study Design
• Site Specificity 0.5 3 5 5• Sensitivity 0.5 4 4 2• Spatial Representativeness 0.4 4 4 4• Temporal Representativeness 0.2 3 3 3• Quantitative Measure 0.2 4 4 4• Standard Method 0.2 4 5 3
(Sum scores*weighting factors)/5 1 2.77 4.20 3.42
Round to nearest whole number 3 4 3

The weighting scores (e.g. 1-5), evidence of harm, and magnitudes of response are integrated foreach measurement endpoint in a matrix such as that presented in Table 6. This summary tableprovides a simple communication tool and indicates the risk assessor's conclusions regarding themagnitude of response.
ExampleDetermining the Degree of Response in Measurement Endpoints
In the example of the assessment endpoint maintenance of a benthic community that can serveas a prey basefor local fish, the risk assessor made the following determinations for eachmeasurement endpoint, as illustrated in Table 7.
Measurement Endpoint A - the concentration of chemical in the sediments in relation tolevels reported to be harmful indicated a low risk of harm
Measurement Endpoint B - toxicity as measured in a whole sediment bioassay indicateda high risk of harm
Measurement Endpoint C - abundance and community structure of invertebrates wasundetermined (i.e., the design of the study and/or natural variability precluded adetermination of either harm or lack of harm)
24

Assessment Endpoint:
TABLE 6 --._-
Risk Assessment Scoring Sheet For
Evidence of Harm and Magnitude
W
;../;. }
Measurement Weighting Score Evidence of Harm MagnitudeEndpoints (1 - 5) (Yes/No/Undetermined) (HighlLow)
,Endpoint A
Endpoint B
~ndpoint C

TABLE 7. Examples of Risk Assessment Scoring Sheet For
Evidence of Harm and Magnitude
Assessment Endpoint: Maintenance of a benthic community that can serve as prey base for local fish
Measurement Weighting Score Evidence of Harm MagnitudeEndpoints (1 - 5) (Yes/No/Undetermined) (High/Low)
Endpoint A 2.7 (3) Yes Low
Endpoint B 4.2 (4) Yes High
Endpoint C 3.4 (3) Undetermined Undetermined

4.0 CONCURRENCE AMONG MEASUREMENT ENDPOINTS
The third component of the weight-of-evidence approach involves examining concurrence amongmeasurement endpoints as they relate to a specific assessment endpoint. Logical connections,interdependence, and correlations among measurement endpoints should also be considered whenevaluating concurrence.
The workgroup developed a graphical method for displaying concurrence among measurementendpoints (Table 8). The method involves plotting the letter designation of the measurementendpoint within a matrix with weight of the measurement endpoint and degree of response as axes.The graphical method permits easy visual examination of agreements or divergences amongmeasurement endpoints, along with the weights assigned to the endpoints..
ExampleExamining Concurrence Among Measurement Endpoints
The letters associated with each of the three measurement endpoints used to evaluatemaintenance ofa benthic community that can serve as a prey base for local fish were plotted onthe matrix (Table 9). The resulting plot shows that two of the three measurement endpointsindicated some risk of hann while the third was undetermined. The illustration also shows thatMeasurement Endpoint C (a field study) was assigned a low weight, even though it was a directmeasure of the assessment endpoint. As shown in Table 5, the low weight reflected relativelypoor design and data quality. The risk assessor and risk manager might reach the followingconclusions based on Table 9: 1) there is a risk of harm to the environment as indicated by thepreponderance of evidence and the relative weights of the measurement endpoints; and 2) the"undetermined" status of Measurement Endpoint C diminishes the overall conClusion that thereis a risk ofharm. Either the uncertainty associated with Measurement Endpoint C could beaccepted or additional work could be conducted to strengthen the analysis.
27

"T,able 8., "Risk Analyses Summary Sheet
Assessmen~Endpoint:
Weighing Factorsincreasing confidence or weight ..
c.
Harm/Magnitude
.. Y§§!bQW .
Lowest1 4 .
• C:.:.'=.,-_=_.c_:•.__ ,_.__.
Highest5'.. , .•,.'." .. , ......., ......-
Use letter designations to place measurement endpoints in the boxes

Table 9Example Risk Analyses Summary Sheet
Assessment Endpoint: Maintenance of a benthic community that can serves as a prey
base for local fish
Weighing Factorsincreasing confidence or weight

5.0 QUALITATIVE WEIGHT·OF·EVIDENCE APPROACH( f '
Whileinost risk assessors and risk managers likely agree on the utility of applying a weight- ofevidence approach to ecological risk assessment, a quantitative method such as that describedabove may be perceived as inflexible or overly complicated for certain risk assessments. If desired,
. the approach may be adapted to be more qualitative, while still maintaining the process ofcharacterizing professional judgements according to the attributes defined in this weight-ofevidence approach.
Th;qualitarlve adaptation of the weight of evidence approach consists of three main steps whichparallel the components of the quantitative approach.
(1) Each measurement endpoint is assigned a score of high, medium or low for each ofthe ten individual attributes. Based upon those scores and on the relativeimportance of individual attributes, the risk assessor should determine an overallscore of high, medium or low indicating how well the measurement endpointrepresents the assessment endpoint. .
I
If all attributes are assumed to be of equal importance, then scoring is a simplematter of counting high, medium and low scores. However, most risk assessors arelikely to consider some attributes more important than others when assigning anoverall score. Determining the relative importance of attributes is asubjective·process involving professional judgement. Therefore, it is imperative that the riskassessor provide a detailed and comprehensive description of his\her decisionprocess in order to make the conclusions meaningful to the riskmanager.
The risk assessor may amend the matrix of score definitions (Table 3) to reflect thethree qualitative categories, rather than the five quantitative categories. However,the attribute definitions and the criteria used to score the measurement endpoint with
. respect to each attribute must be clearly stated andfully explained. To insure asystematic evaluation and an unambiguous assessment documentation, the attributesmust be clearly and rigorously defined by the risk assessor.
(2) The outcome of each measurement endpoint is evaluated with respect to magnitudeof response. The indication of risk of harm to the environment is described aspositive, negative, or undetermined indication of risk.
.The magnitude of the outcome is determined, baSed on the definitiveness of apositive or ~egative result. The magnitude of the outcome may be characterized ashigh or low.
30

(3) Finally, the risk assessor integrates the measurement endpoint weight, andmagnitude of response to determine whether the overall evidence indicates a risk~of' ,harm. To that end, each measurement endpoint (e.g., A, B, C) is placed on:a matrix '~j
comparable to Table 10. .;', . y>':..
Table 10 . ". .:., .... ' .Il.• ; _. ~ '"'
.' I' . r~:
llW'h f doT bl £ Ina e or tel!ratine: vera eie:! t-o -evi ence
HARM! LOW MEDIUM mGH "'--. '.,
MAGNITUDE WEIGHT WEIGHT ,I,: WEIGHT'- ,
.... - ',"
YeslHigh A
YeslLow B' i',.
Undeterminate *NolLow C
NolHigh ;
To assess the overall weight-of-evidence, the risk assessor may view Table 10 as a plane, the dot atthe center of the'intersection of "'medium weight" and "undetermined" as a fulcrum,and thedirection of tilt ofthe plane as the weight-of-evidence. In the example provided above, the planewould be tilted toward risk, since Endpoints A and B counterbalance Endpoint C, which has beenassigned a low weight and yields only a weak indication that there is no risk.
In short, .the 'main differences in methodology between the quantitative approach described inSections 2 through 4 and the qualitative approach presented in this section pertain to (1) weighingthe attributes and (2) scoring the measUrement endpoints. Whereas the quantitative approachassigns fixed numerical weIghts to the ten attributes to reflect differing degrees of importance, thequalitative approach does not involve pie-assigned weights. The quantitative approach allows therisk assessor to use the scaling values to derive numerical scores for each assessment endpoint.The qualitaQve approach requires toe risk assessor to rate endpoints in non-numerical terms (I.e.,high, meditim orlow).' ' .. " ,,: ,"i-, ': ,,':
. \. ", 'i' . :!
There is a tradeoff for the quantitative\i.nd qualitative approaches between flexibility andobjectivity. The quantitative method requires the use of numerical scaling values to indicate therelative importante of each: ~ttribute. It is more systematic and requires substantially less case-bycase professional judgement 'ahd if the generic staling values, such as those proposed in this paper,are applied. Assigning numerical scaling values to the endpoint attributes clearly documents therisk assessor's professional judgements and makes the decision process more transparent to riskmanagers and the general public. Determining a numerical score for each measurement endpointusing a previously established procedure may enable risk assessors and regulators to draw a
31

conclusion about risk in situations where the measurement results are contradictory and where theinterested parties hold differing views on environmental assessment and protection.
The qualitativ~ approach is somewhat more flexible, in that it is more amenable to determining therelative importance of the attributes on a case-specific basis. The risk assessor may opt either toassign weights on a case-by-case basis or to assume that each attribute is of equal importance.Assigning case-specific weights to the attributes enables the risk assessor to consider the nature ofthe measurement endpoints in question. However, if attributes are assigned weights on a casespecific basis, it is extremely important for the risk assessor to document the rationale for therelative weight given to each attribute. Thus, determining .the weights for a qualitative approachmay be simpler than for a quantitative evaluation, but documenting the rationale and the decisionprocess requires a more extensive effort.
In order to use a weight-of-evidence evaluation to meet the requirements of a regulatory programand to provide a basis for a regulatory decision, the risk assessor needs the concurrence of the riskmanager on the basic approach. In some cases, the regulator may consider a quantitative approachmore useful; in others, a qualitative approach may be preferred. Whether a quantitative orqualitative approach is used, a systematic weight-of-evidence evaluation is likely to promote abroader and clearer understanding of the judgements incorporated in the ecological risk assessment.
32

6.0 SUMMARY\.'
This paper outlines a weight-of-evidence approach for assessing ecological risks. The approa~h isconducted throughout the assessment; it.'is not carried out "after the fact." The workgroulr'has L",' . I !
defined weight-of-evidence as the process by which measurement endpoint(s) are relateoto an :", ';"assessment,endpoint to evaluate if there is a significant risk of hanrt to the environment. The' ,; ~'2 ..
approach i~. planned and initiated at the problem formulation stage and results, are integrated at 'th~. -~;~/risk characterization stage. ' ~.', - ,; ~"~;
The approach i~ organized aroun~ three components:
1.2.3.
Weight assigned to each measurement endpoint;Magnitude of response in the measurement endppint; andConcurrence among measurement endpoints. ' . " .. 1; "
~ '. .~"" .-,;
A quantitative methodology was developed for each()fthes~ three components. The ~verall intent·;:of the approach is to make transparent and IIlore objec'tive'the various professional judgementS ~';, :,' .made by ecologicalrisk assessors ~ they evaluate information: The quantitative approach includes "methods for: 1) weighing the individliai measurement endpoints by evaluating how well they '0
score against a set of ten attributes, 2) determining whether harm or lack of harm is indicated andthe magnitude of response, and 3) graphically displaying the measurement endpoints in a matrix sothat concurrence can be examined.
A simpler qualitative approach is also discussed. Risk assessors may choose between thequantitative and qualitative methods based on the needs of the assessment. In general, thequantitative approach is more objective and defensible and the qualitative approach is simpler, butrequires greater documentation due to the added subjectivity.
The workgroup has applied the method to several case studies and found that it works reasonablywell and that risk managers and risk assessors alike agree on the conclusions. One of the mostvaluable lessons of these exercises is that the application of the method provides a good basis forevaluating the selected measurement endpoints and for discussing the strengths and limitations ofthe assessment in an objective manner.
33

7.0 REFERENCES
Suter, G.W. 1993. Ecological Risk Assessment. Lewis Publishers. 538 p.
U.S. Environmental Protection Agency. 1992. Framework for Ecological Risk Assessment.EPA/6301R-92/001. Risk Assessment Forum, Washington, D.C.
u.s. Environmental Protection Agency. 1994. Ecological Risk Assessment Guidance forSuperfund: Process for Designing and Conducting Ecological Risk Assessments. Review Draft.Edison, NJ.
34