weka tutorials spanish
TRANSCRIPT

Practical Data Mining
Tutorial 1: Introduction to the WEKA Explorer
Mark Hall, Eibe Frank and Ian H. Witten
May 5, 2011
c©2006-2012 University of Waikato
1 Getting started
This tutorial introduces the main graphical user in-terface for accessing WEKA’s facilities, called theWEKA Explorer. We will work with WEKA 3.6(although almost everything is the same with otherversions), and we assume that it is installed onyour system.
Este tutorial presenta la interfaz grafica de usuarioprincipal para acceder a las instalaciones deWEKA, llamado Explorer WEKA. Vamos a tra-bajar con WEKA 3.6 (aunque casi todo es lomismo con otras versiones), y suponemos que seha instalado en su sistema.
Invoke WEKA from the Windows START menu(on Linux or the Mac, double-click weka.jar orweka.app). This starts up the WEKA GUIChooser. Click the Explorer button to enter theWEKA Explorer.
Invocar WEKA desde el menu INICIO de Win-dows (en Linux o Mac, haga doble clic en weka.jar
o weka.app). Esto pone en marcha el GUIChooser WEKA. Haga clic en el Explorer botonpara entrar en el WEKA Explorer.
Just in case you are wondering about the otherbuttons in the GUI Chooser: Experimenteris a user interface for comparing the predictiveperformance of learning algorithms; Knowledge-Flow is a component-based interface that has asimilar functionality as the Explorer; and Sim-ple CLI opens a command-line interface that em-ulates a terminal and lets you interact with WEKAin this fashion.
Solo en caso de que usted se esta preguntandosobre el resto de botones en la GUI Chooser:Experimenter es una interfaz de usuario paracomparar el rendimiento predictivo de algoritmosde aprendizaje; KnowledgeFlow es una interfazbasada en componentes que tiene una funcionali-dad similar a la de Explorer; y Simple CLI seabre un comando-lınea de interfaz que emula unaterminal y le permite interactuar con WEKA deesta manera.
2 The panels in the Explorer
The user interface to the Explorer consists of sixpanels, invoked by the tabs at the top of the win-dow. The Preprocess panel is the one that isopen when the Explorer is first started. Thistutorial will introduce you to two others as well:Classify and Visualize. (The remaining threepanels are explained in later tutorials.) Here’s abrief description of the functions that these threepanels perform.
La interfaz de usuario de la Explorer se componede seis paneles, invocadas por las etiquetas en laparte superior de la ventana. El panel de Prepro-cess es la que esta abierta cuando la Explorer porprimera vez. Este tutorial le introducira a otrosdos, ası: Classify y Visualize. (Los otros trespaneles se explican en tutoriales mas tarde.) Heaquı una breve descripcion de las funciones que es-tos tres grupos de realizar.
Preprocess is where you to load and preprocessdata. Once a dataset has been loaded, thepanel displays information about it. Thedataset can be modified, either by editingit manually or by applying a filter, and themodified version can be saved. As an alter-native to loading a pre-existing dataset, anartificial one can be created by using a gen-erator. It is also possible to load data froma URL or from a database.
Preprocess es donde puedes cargar los datos ypreproceso. Una vez que un conjunto dedatos se ha cargado, el panel muestra infor-macion sobre Al. El conjunto de datos puedeser modificado, ya sea mediante la edicionde forma manual o mediante la aplicacion deun filtro, y la version modificada se puedeguardar. Como alternativa a la carga de unconjunto de datos pre-existentes, una artifi-cial se pueden crear mediante el uso de ungenerador. Tambien es posible cargar datosdesde una URL o desde una base de datos.
1
Classify is where you invoke the classificationmethods in WEKA. Several options for theclassification process can be set, and the re-sult of the classification can be viewed. Thetraining dataset used for classification is theone loaded (or generated) in the Preprocesspanel.
Classify es donde se invoca a los metodos de clasi-ficacion en WEKA. Varias opciones para elproceso de clasificacion se puede establecer,y el resultado de la clasificacion se puede ver.El conjunto de datos de entrenamiento uti-lizados para la clasificacion es la carga (o gen-erada) en el panel de Preprocess.
Visualize is where you can visualize the datasetloaded in the Preprocess panel as two-dimensional scatter plots. You can select theattributes for the x and y axes.
Visualize es donde se puede visualizar el conjuntode datos cargados en el panel de Preprocesscomo diagramas de dispersion de dos dimen-siones. Puede seleccionar los atributos de losx y y ejes.
3 The Preprocess panel
Preprocess is the panel that opens when theWEKA Explorer is started.
Preprocess es el panel que se abre cuando el Ex-plorer WEKA se ha iniciado.
3.1 Loading a dataset
Before changing to any other panel, the Explorermust have a dataset to work with. To load oneup, click the Open file... button in the topleft corner of the panel. Look around for thefolder containing datasets, and locate a file namedweather.nominal.arff (this file is in the data
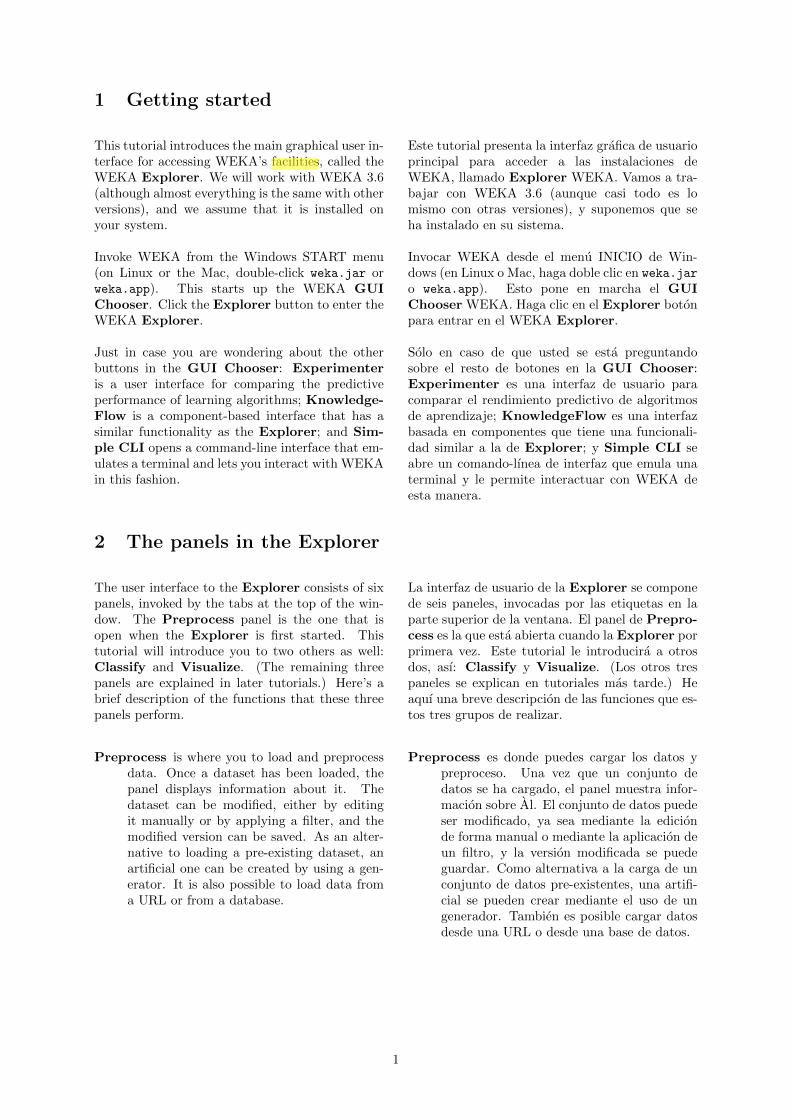
folder that is supplied when WEKA is installed).This contains the nominal version of the standard“weather” dataset. Open this file. Now yourscreen will look like Figure 1.
Antes de cambiar a cualquier otro panel, el Ex-plorer debe tener un conjunto de datos para tra-bajar. Para cargar una, haga clic en el boton deOpen file... en la esquina superior izquierda delpanel. Mire a su alrededor para la carpeta que con-tiene los conjuntos de datos y busque un archivollamado weather.nominal.arff (este archivo estaen el carpeta de data que se suministra cuandoWEKA se instala). Este contiene la version nomi-nal de la norma “tiempo” conjunto de datos. Abrirarchivo. Ahora la pantalla se vera como la Fig-ure 1.
The weather data is a small dataset with only 14examples for learning. Because each row is an in-dependent example, the rows/examples are called“instances.” The instances of the weather datasethave 5 attributes, with names ‘outlook’, ‘temper-ature’, ‘humidity’, ‘windy’ and ‘play’. If you clickon the name of an attribute in the left sub-panel,information about the selected attribute will beshown on the right. You can see the values of theattribute and how many times an instance in thedataset has a particular value. This information isalso shown in the form of a histogram.
Los datos de clima es un conjunto de datospequeno con solo 14 ejemplos para el aprendizaje.Debido a que cada fila es un ejemplo independi-ente, las filas/ejemplos son llamados “casos”. Loscasos del conjunto de datos meteorologicos tienen5 atributos, con ‘perspectivas nombres’ , la ‘tem-peratura’, ‘humedad’, ‘jugar’ con mucho ‘viento’y. Si hace clic en el nombre de un atributo enel sub-panel de la izquierda, la informacion acercadel atributo seleccionado se muestra a la derecha.Usted puede ver los valores de los atributos y lasveces que una instancia del conjunto de datos tieneun valor particular. Esta informacion se muestratambien en la forma de un histograma.
2
Figure 1: The Explorer’s Preprocess panel.
All attributes in this dataset are “nominal,” i.e.they have a predefined finite set of values. Eachinstance describes a weather forecast for a particu-lar day and whether to play a certain game on thatday. It is not really clear what the game is, but letus assume that it is golf. The last attribute ‘play’is the “class” attribute—it classifies the instance.Its value can be ‘yes’ or ‘no’. Yes means that theweather conditions are OK for playing golf, and nomeans they are not OK.
Todos los atributos de este conjunto de datos son“nominales”, es decir, tienen un conjunto finito devalores predefinidos. Cada instancia se describeun pronostico del tiempo para un dıa en particulary si a jugar un cierto juego en ese dıa. No estamuy claro lo que el juego es, pero supongamos quees el golf. ‘Jugar’ el ultimo atributo es el atrib-uto “class”—que clasifica la instancia. Su valorpuede ser ‘si’ o ‘no’. Sı significa que las condi-ciones climaticas estan bien para jugar al golf, yno significa que no estan bien.
3.2 Exercises
To familiarize yourself with the functions discussedso far, please do the following two exercises. Thesolutions to these and other exercises in this tuto-rial are given at the end.
Para familiarizarse con las funciones discutidohasta ahora, por favor, los dos ejercicios siguientes.Las soluciones a estos y otros ejercicios de este tu-torial se dan al final.
Ex. 1: What are the values that the attribute‘temperature’ can have?
Ex. 1: Cuales son los valores que la ‘temperatura’el atributo puede tener?
3
Ex. 2: Load a new dataset. Press the ‘Open file’button and select the file iris.arff. Howmany instances does this dataset have? Howmany attributes? What is the range of pos-sible values of the attribute ’petallength’?
Ex. 2: Carga un nuevo conjunto de datos. Pulseel boton ‘Abrir el archivo’ y seleccione elarchivo iris.arff. Cuantos casos se hanesta base de datos? Como muchos atribu-tos? Cual es el rango de valores posibles de‘petallength’ el atributo?
3.3 The dataset editor
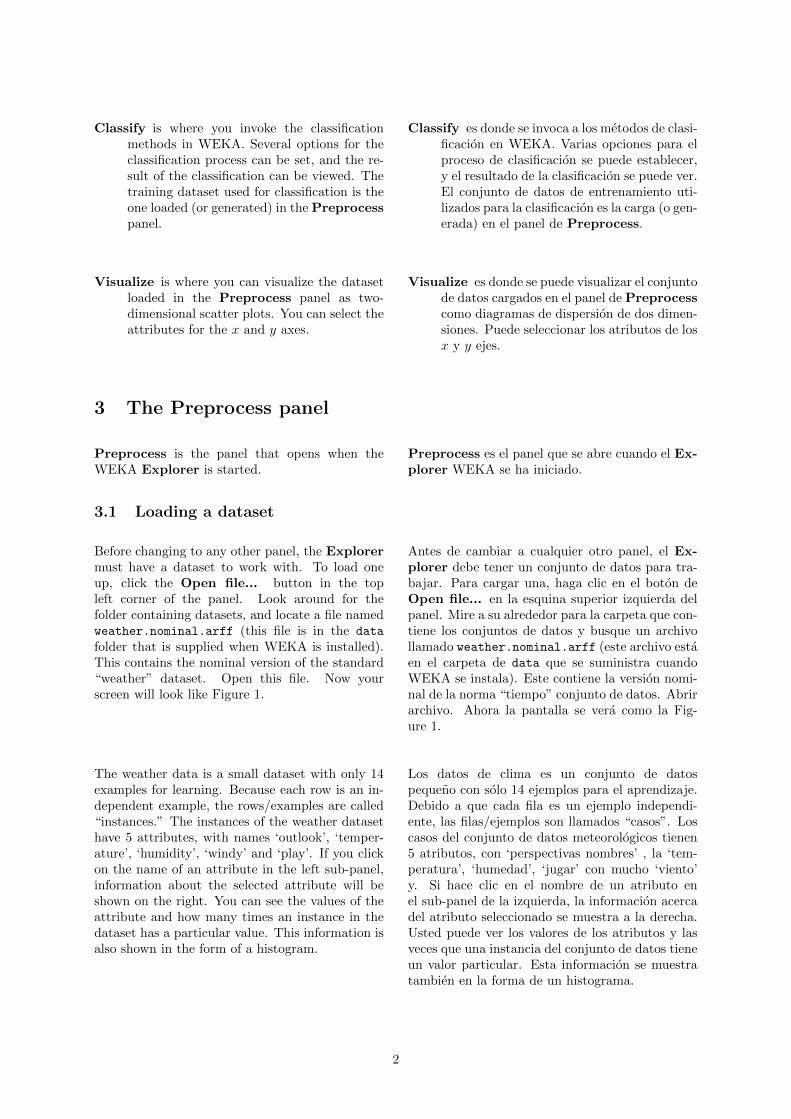
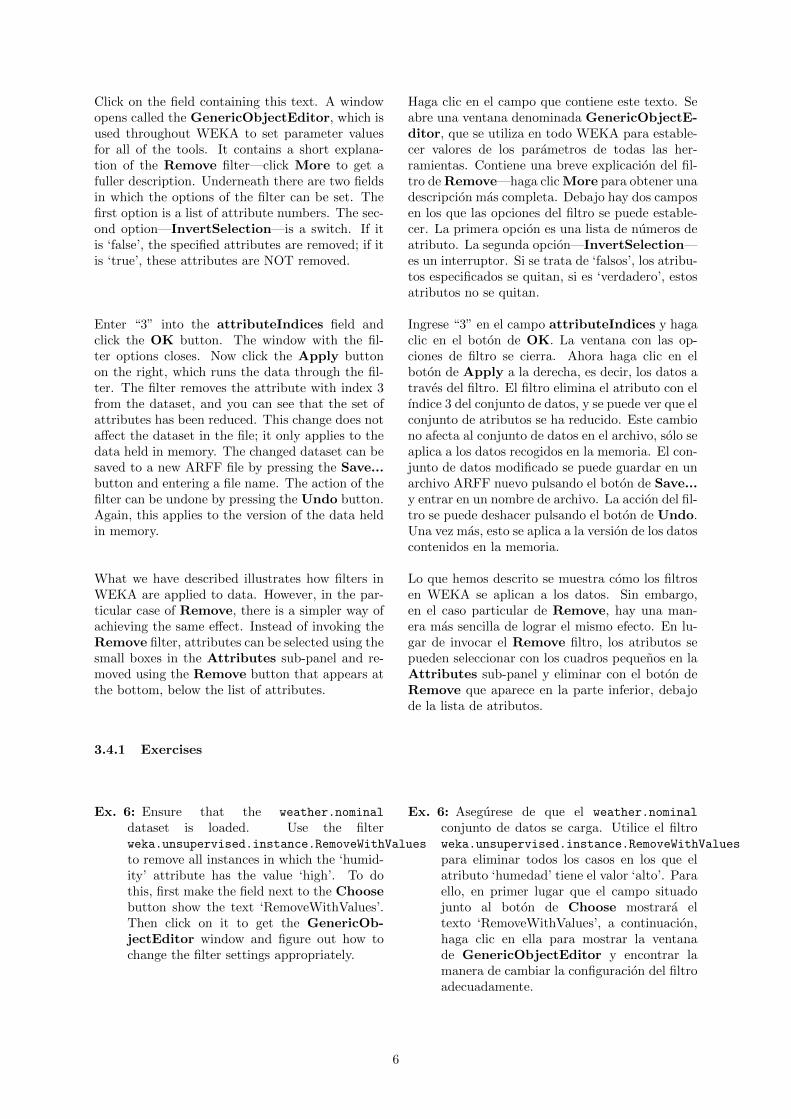
It is possible to view and edit an entire datasetfrom within WEKA. To experiment with this, loadthe file weather.nominal.arff again. Click theEdit... button from the row of buttons at thetop of the Preprocess panel. This opens a newwindow called Viewer, which lists all instances ofthe weather data (see Figure 2).
Es posible ver y editar un conjunto de datos desdeel interior de WEKA. Para experimentar con esto,cargar el archivo weather.nominal.arff nuevo.Haga clic en el boton de Edit... de la fila debotones en la parte superior del panel de Pre-process. Esto abre una nueva ventana llamadaViewer, que enumera todas las instancias de losdatos meteorologicos (vease la Figure 2).
3.3.1 Exercises
Ex. 3: What is the function of the first column inthe Viewer?
Ex. 3: Cual es la funcion de la primera columnade la Viewer?
Ex. 4: Considering the weather data, what is theclass value of instance number 8?
Ex. 4: Teniendo en cuenta los datos meteo-rologicos, cual es el valor de la clase denumero de instancia 8?
Ex. 5: Load the iris data and open it in the edi-tor. How many numeric and how many nom-inal attributes does this dataset have?
Ex. 5: Carga los datos de iris y abrirlo en el ed-itor. Como los atributos nominales muchasnumerico y el numero de este conjunto dedatos se tienen?
3.4 Applying a filter
In WEKA, “filters” are methods that can be usedto modify datasets in a systematic fashion—thatis, they are data preprocessing tools. WEKAhas several filters for different tasks. Reload theweather.nominal dataset, and let’s remove an at-tribute from it. The appropriate filter is calledRemove; its full name is:
En WEKA, “filtros” son metodos que se puedenutilizar para modificar bases de datos de manerasistematica—es decir, son datos del proceso pre-vio herramientas. WEKA tiene varios filtros paradiferentes tareas. Actualizar el weather.nominalconjunto de datos, y vamos a eliminar un atributode ella. El filtro adecuado se llama Remove, sunombre completo es:
weka.filters.unsupervised.attribute.Remove
4
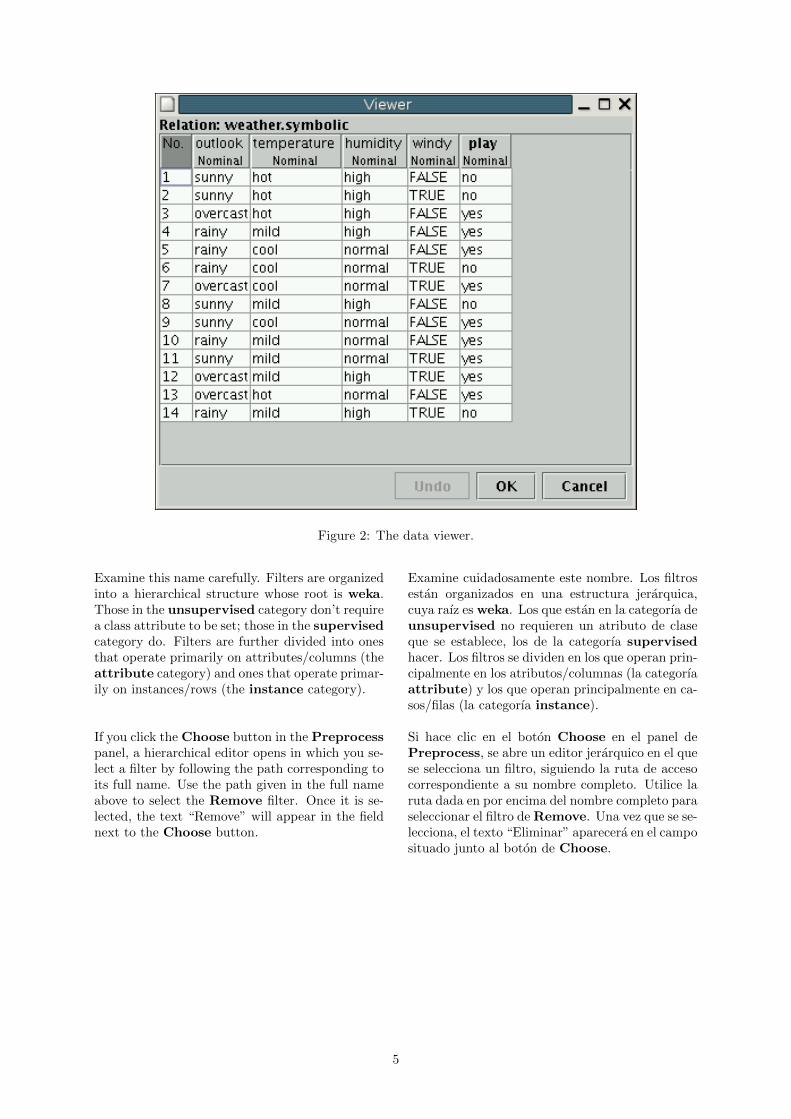
Figure 2: The data viewer.
Examine this name carefully. Filters are organizedinto a hierarchical structure whose root is weka.Those in the unsupervised category don’t requirea class attribute to be set; those in the supervisedcategory do. Filters are further divided into onesthat operate primarily on attributes/columns (theattribute category) and ones that operate primar-ily on instances/rows (the instance category).
Examine cuidadosamente este nombre. Los filtrosestan organizados en una estructura jerarquica,cuya raız es weka. Los que estan en la categorıa deunsupervised no requieren un atributo de claseque se establece, los de la categorıa supervisedhacer. Los filtros se dividen en los que operan prin-cipalmente en los atributos/columnas (la categorıaattribute) y los que operan principalmente en ca-sos/filas (la categorıa instance).
If you click the Choose button in the Preprocesspanel, a hierarchical editor opens in which you se-lect a filter by following the path corresponding toits full name. Use the path given in the full nameabove to select the Remove filter. Once it is se-lected, the text “Remove” will appear in the fieldnext to the Choose button.
Si hace clic en el boton Choose en el panel dePreprocess, se abre un editor jerarquico en el quese selecciona un filtro, siguiendo la ruta de accesocorrespondiente a su nombre completo. Utilice laruta dada en por encima del nombre completo paraseleccionar el filtro de Remove. Una vez que se se-lecciona, el texto “Eliminar” aparecera en el camposituado junto al boton de Choose.
5
Click on the field containing this text. A windowopens called the GenericObjectEditor, which isused throughout WEKA to set parameter valuesfor all of the tools. It contains a short explana-tion of the Remove filter—click More to get afuller description. Underneath there are two fieldsin which the options of the filter can be set. Thefirst option is a list of attribute numbers. The sec-ond option—InvertSelection—is a switch. If itis ‘false’, the specified attributes are removed; if itis ‘true’, these attributes are NOT removed.
Haga clic en el campo que contiene este texto. Seabre una ventana denominada GenericObjectE-ditor, que se utiliza en todo WEKA para estable-cer valores de los parametros de todas las her-ramientas. Contiene una breve explicacion del fil-tro de Remove—haga clic More para obtener unadescripcion mas completa. Debajo hay dos camposen los que las opciones del filtro se puede estable-cer. La primera opcion es una lista de numeros deatributo. La segunda opcion—InvertSelection—es un interruptor. Si se trata de ‘falsos’, los atribu-tos especificados se quitan, si es ‘verdadero’, estosatributos no se quitan.
Enter “3” into the attributeIndices field andclick the OK button. The window with the fil-ter options closes. Now click the Apply buttonon the right, which runs the data through the fil-ter. The filter removes the attribute with index 3from the dataset, and you can see that the set ofattributes has been reduced. This change does notaffect the dataset in the file; it only applies to thedata held in memory. The changed dataset can besaved to a new ARFF file by pressing the Save...button and entering a file name. The action of thefilter can be undone by pressing the Undo button.Again, this applies to the version of the data heldin memory.
Ingrese “3” en el campo attributeIndices y hagaclic en el boton de OK. La ventana con las op-ciones de filtro se cierra. Ahora haga clic en elboton de Apply a la derecha, es decir, los datos atraves del filtro. El filtro elimina el atributo con elındice 3 del conjunto de datos, y se puede ver que elconjunto de atributos se ha reducido. Este cambiono afecta al conjunto de datos en el archivo, solo seaplica a los datos recogidos en la memoria. El con-junto de datos modificado se puede guardar en unarchivo ARFF nuevo pulsando el boton de Save...y entrar en un nombre de archivo. La accion del fil-tro se puede deshacer pulsando el boton de Undo.Una vez mas, esto se aplica a la version de los datoscontenidos en la memoria.
What we have described illustrates how filters inWEKA are applied to data. However, in the par-ticular case of Remove, there is a simpler way ofachieving the same effect. Instead of invoking theRemove filter, attributes can be selected using thesmall boxes in the Attributes sub-panel and re-moved using the Remove button that appears atthe bottom, below the list of attributes.
Lo que hemos descrito se muestra como los filtrosen WEKA se aplican a los datos. Sin embargo,en el caso particular de Remove, hay una man-era mas sencilla de lograr el mismo efecto. En lu-gar de invocar el Remove filtro, los atributos sepueden seleccionar con los cuadros pequenos en laAttributes sub-panel y eliminar con el boton deRemove que aparece en la parte inferior, debajode la lista de atributos.
3.4.1 Exercises
Ex. 6: Ensure that the weather.nominal
dataset is loaded. Use the filterweka.unsupervised.instance.RemoveWithValues
to remove all instances in which the ‘humid-ity’ attribute has the value ‘high’. To dothis, first make the field next to the Choosebutton show the text ‘RemoveWithValues’.Then click on it to get the GenericOb-jectEditor window and figure out how tochange the filter settings appropriately.
Ex. 6: Asegurese de que el weather.nominal
conjunto de datos se carga. Utilice el filtroweka.unsupervised.instance.RemoveWithValues
para eliminar todos los casos en los que elatributo ‘humedad’ tiene el valor ‘alto’. Paraello, en primer lugar que el campo situadojunto al boton de Choose mostrara eltexto ‘RemoveWithValues’, a continuacion,haga clic en ella para mostrar la ventanade GenericObjectEditor y encontrar lamanera de cambiar la configuracion del filtroadecuadamente.
6
Ex. 7: Undo the change to the dataset that youjust performed, and verify that the data isback in its original state.
Ex. 7: Deshacer el cambio en el conjunto de datosque acaba de realizar, y verificar que losdatos vuelve a su estado original.
4 The Visualize panel
We now take a look at WEKA’s data visualizationfacilities. These work best with numeric data, sowe use the iris data.
Ahora eche un vistazo a las instalaciones deWEKA de visualizacion de datos. Estos funcio-nan mejor con datos numericos, por lo que utilizarlos datos del iris.
First, load iris.arff. This data contains flowermeasurements. Each instance is classified as oneof three types: iris-setosa, iris-versicolor and iris-virginica. The dataset has 50 examples of eachtype: 150 instances in all.
En primer lugar, la carga iris.arff. Estos datoscontienen mediciones de flores. Cada caso se clasi-fica como uno de tres tipos: setosa iris, iris versi-color y virginica iris. El conjunto de datos cuentacon 50 ejemplos de cada tipo: 150 casos en total.
Click the Visualize tab to bring up the visual-ization panel. It shows a grid containing 25 two-dimensional scatter plots, with every possible com-bination of the five attributes of the iris data onthe x and y axes. Clicking the first plot in the sec-ond row opens up a window showing an enlargedplot using the selected axes. Instances are shownas little crosses whose color cross depends on theinstance’s class. The x axis shows the ‘sepallength’attribute, and the y axis shows ‘petalwidth’.
Haga clic en la ficha Visualize para que aparezcael panel de visualizacion. Muestra una cuadrıculaque contiene 25 graficos de dispersion de dos di-mensiones, con todas las combinaciones posiblesde los cinco atributos de los datos del iris en los xy y ejes. Al hacer clic en la primera parcela en lasegunda fila se abre una ventana que muestra unatrama ampliada con los ejes seleccionados. Las in-stancias se muestran como pequenas cruces cuyocolor depende de la clase de cruz de la instancia.El eje x muestra el atributo ‘sepallength’, y ‘petal-width’ muestra el y eje.
Clicking on one of the crosses opens up an In-stance Info window, which lists the values of allattributes for the selected instance. Close the In-stance Info window again.
Al hacer clic en una de las cruces se abre una ven-tana de Instance Info, que enumera los valoresde todos los atributos de la instancia seleccionada.Cierre la ventana de Instance Info de nuevo.
The selection fields at the top of the window thatcontains the scatter plot can be used to change theattributes used for the x and y axes. Try changingthe x axis to ‘petalwidth’ and the y axis to ‘petal-length’. The field showing “Colour: class (Num)”can be used to change the colour coding.
Los campos de seleccion en la parte superior dela ventana que contiene el diagrama de dispersionse puede utilizar para cambiar los atributos uti-lizados por los x y y ejes. Pruebe a cambiar eleje x a ‘petalwidth’ y el y eje ‘petallength’. Elcampo muestra “Color: clase (Num)”se puede uti-lizar para cambiar el codigo de colores.
Each of the colorful little bar-like plots to the rightof the scatter plot window represents a single at-tribute. Clicking a bar uses that attribute for thex axis of the scatter plot. Right-clicking a bar doesthe same for the y axis. Try to change the x andy axes back to ‘sepallength’ and ‘petalwidth’ usingthese bars.
Cada una de las parcelas de colores poco comola barra a la derecha de la ventana del grafico dedispersion representa un unico atributo. Haciendoclic en un bar que utiliza atributos para los x ejedel diagrama de dispersion. Derecho clic en un barhace lo mismo con los y eje. Trate de cambiar losx y y ejes de nuevo a ‘sepallength’ y ‘petalwidth’utilizando estas barras.
7
The Jitter slider displaces the cross for each in-stance randomly from its true position, and canreveal situations where instances lie on top of oneanother. Experiment a little by moving the slider.
El control deslizante Jitter desplaza la cruz porcada instancia al azar de su verdadera posicion, ypuede revelar las situaciones en que casos se en-cuentran en la parte superior de uno al otro. Ex-perimente un poco moviendo la barra deslizante.
The Select Instance button and the Reset,Clear and Save buttons let you change thedataset. Certain instances can be selected and theothers removed. Try the Rectangle option: selectan area by left-clicking and dragging the mouse.The Reset button now changes into a Submitbutton. Click it, and all instances outside the rect-angle are deleted. You could use Save to save themodified dataset to a file, while Reset restores theoriginal dataset.
El boton de Select Instance y Reset, Clear, ySave los botones le permiten cambiar el conjuntode datos. Algunos casos se pueden seleccionar yeliminar los demas. Pruebe la opcion Rectangle:seleccionar un area por la izquierda haciendo clicy arrastrando el raton. El Reset boton ahora setransforma en un boton de Submit. Haga clic enel, y todos los casos fuera del rectangulo se elim-inan. Usted podrıa utilizar Save para guardar elconjunto de datos modificados en un archivo, mien-tras que Reset restaura el conjunto de datos orig-inal.
5 The Classify panel
Now you know how to load a dataset from a fileand visualize it as two-dimensional plots. In thissection we apply a classification algorithm—calleda “classifier” in WEKA—to the data. The clas-sifier builds (“learns”) a classification model fromthe data.
Ahora usted sabe como cargar un conjunto dedatos de un archivo y visualizarlo como parce-las de dos dimensiones. En esta seccion se aplicaun algoritmo de clasificacion—denominado “clasi-ficador” en WEKA—a los datos. El clasificador sebasa (“aprende”) un modelo de clasificacion de losdatos.
In WEKA, all schemes for predicting the value of asingle attribute based on the values of some otherattributes are called “classifiers,” even if they areused to predict a numeric target—whereas otherpeople often describe such situations as “numericprediction” or “regression.” The reason is that,in the context of machine learning, numeric pre-diction has historically been called “classificationwith continuous classes.”
En WEKA, todos los esquemas para predecir elvalor de un atributo unico, basado en los valoresde algunos atributos de otros se llaman “clasi-ficadores”, incluso si se utilizan para predecirun objetivo numerico—mientras que otras per-sonas a menudo describen situaciones tales como“numerica prediccion” o “regresion”. La razon esque, en el contexto de aprendizaje de maquina,la prediccion numerica historicamente ha sido lla-mada “la clasificacion con clases continuas.”
Before getting started, load the weatherdata again. Go to the Preprocess panel,click the Open file button, and selectweather.nominal.arff from the data direc-tory. Then switch to the classification panelby clicking the Classify tab at the top of thewindow. The result is shown in Figure 3.
Antes de empezar, carga la informacion deltiempo nuevo. Ir al panel de Preprocess,haga clic en el boton de Open file, y selec-cione weather.nominal.arff desde el directoriode datos. Luego cambiar a la mesa de clasificacion,haga clic en la ficha Classify en la parte supe-rior de la ventana. El resultado se muestra en laFigura 3.
8
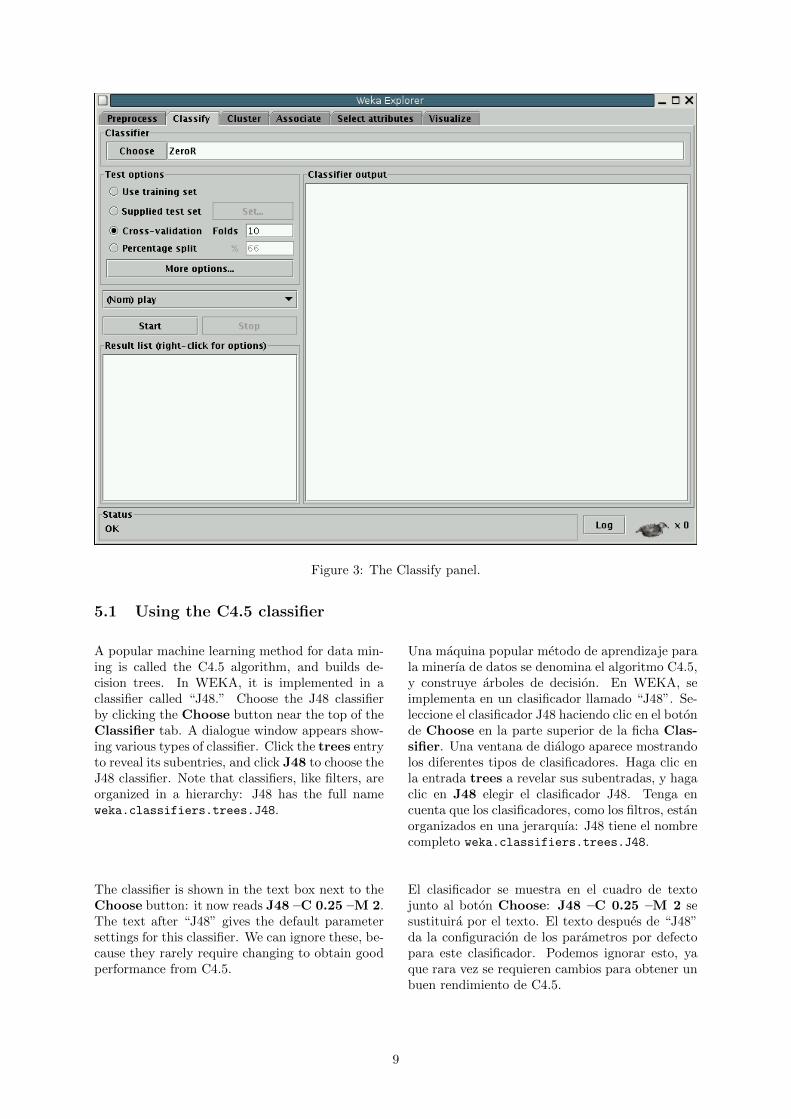
Figure 3: The Classify panel.
5.1 Using the C4.5 classifier
A popular machine learning method for data min-ing is called the C4.5 algorithm, and builds de-cision trees. In WEKA, it is implemented in aclassifier called “J48.” Choose the J48 classifierby clicking the Choose button near the top of theClassifier tab. A dialogue window appears show-ing various types of classifier. Click the trees entryto reveal its subentries, and click J48 to choose theJ48 classifier. Note that classifiers, like filters, areorganized in a hierarchy: J48 has the full nameweka.classifiers.trees.J48.
Una maquina popular metodo de aprendizaje parala minerıa de datos se denomina el algoritmo C4.5,y construye arboles de decision. En WEKA, seimplementa en un clasificador llamado “J48”. Se-leccione el clasificador J48 haciendo clic en el botonde Choose en la parte superior de la ficha Clas-sifier. Una ventana de dialogo aparece mostrandolos diferentes tipos de clasificadores. Haga clic enla entrada trees a revelar sus subentradas, y hagaclic en J48 elegir el clasificador J48. Tenga encuenta que los clasificadores, como los filtros, estanorganizados en una jerarquıa: J48 tiene el nombrecompleto weka.classifiers.trees.J48.
The classifier is shown in the text box next to theChoose button: it now reads J48 –C 0.25 –M 2.The text after “J48” gives the default parametersettings for this classifier. We can ignore these, be-cause they rarely require changing to obtain goodperformance from C4.5.
El clasificador se muestra en el cuadro de textojunto al boton Choose: J48 –C 0.25 –M 2 sesustituira por el texto. El texto despues de “J48”da la configuracion de los parametros por defectopara este clasificador. Podemos ignorar esto, yaque rara vez se requieren cambios para obtener unbuen rendimiento de C4.5.
9
Decision trees are a special type of classificationmodel. Ideally, models should be able to predictthe class values of new, previously unseen instanceswith high accuracy. In classification tasks, accu-racy is often measured as the percentage of cor-rectly classified instances. Once a model has beenlearned, we should test it to see how accurate it iswhen classifying instances.
Los arboles de decision son un tipo especial demodelo de clasificacion. Idealmente, los modelosdeben ser capaces de predecir los valores de la clasede nuevo, no visto previamente casos con gran pre-cision. En las tareas de clasificacion, la precisionse mide como el porcentaje de casos clasificadoscorrectamente. Una vez que un modelo que se haaprendido, hay que probarlo para ver como es ex-acto es la hora de clasificar los casos.
One option in WEKA is to evaluate performanceon the training set—the data that was used tobuild the classifier. This is NOT generally a goodidea because it leads to unrealistically optimisticperformance estimates. You can easily get 100%accuracy on the training data by simple rote learn-ing, but this tells us nothing about performanceon new data that might be encountered when themodel is applied in practice. Nevertheless, for il-lustrative purposes it is instructive to consider per-formance on the training data.
Una opcion en WEKA es evaluar el rendimientoen el conjunto de entrenamiento—los datos quese utilizo para construir el clasificador. Esto noes generalmente una buena idea porque conduce alas estimaciones de rendimiento irrealmente opti-mista. Usted puede obtener el 100% de precisionen los datos de entrenamiento por el aprendizajede memoria sencillo, pero esto no nos dice nadasobre el rendimiento de los nuevos datos que sepueden encontrar cuando el modelo se aplica en lapractica. No obstante, a tıtulo ilustrativo es in-structivo considerar el rendimiento de los datos deentrenamiento.
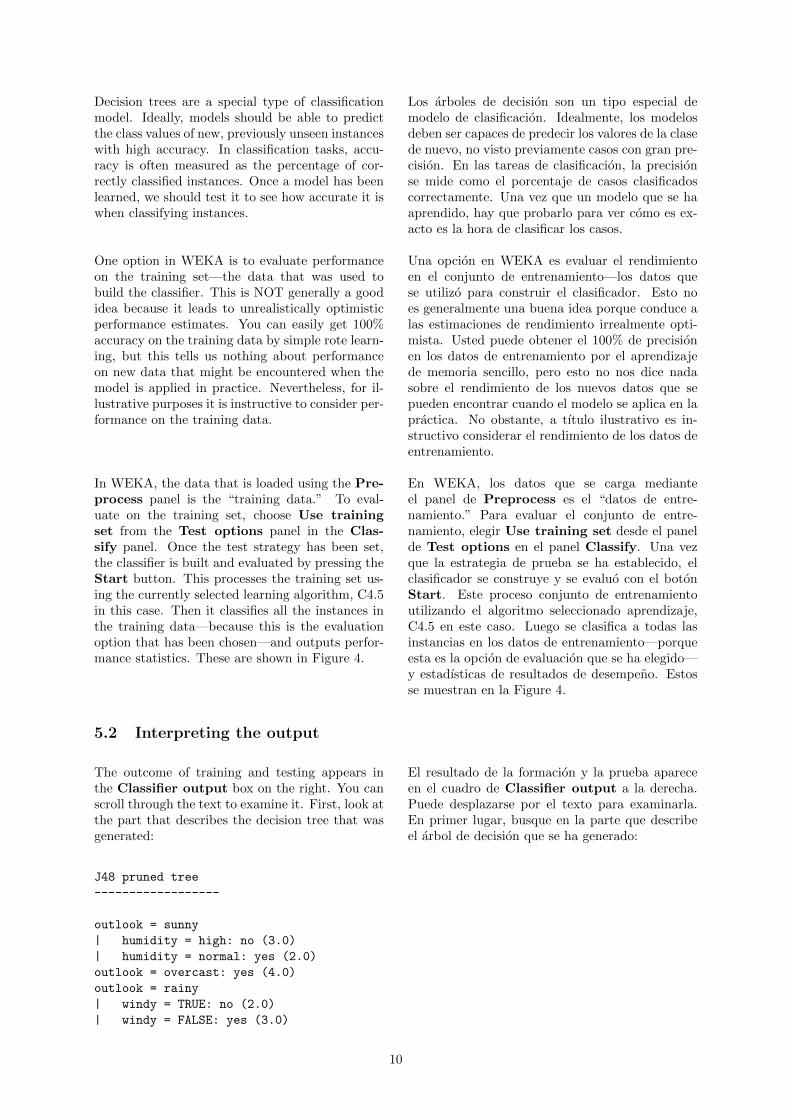
In WEKA, the data that is loaded using the Pre-process panel is the “training data.” To eval-uate on the training set, choose Use trainingset from the Test options panel in the Clas-sify panel. Once the test strategy has been set,the classifier is built and evaluated by pressing theStart button. This processes the training set us-ing the currently selected learning algorithm, C4.5in this case. Then it classifies all the instances inthe training data—because this is the evaluationoption that has been chosen—and outputs perfor-mance statistics. These are shown in Figure 4.
En WEKA, los datos que se carga medianteel panel de Preprocess es el “datos de entre-namiento.” Para evaluar el conjunto de entre-namiento, elegir Use training set desde el panelde Test options en el panel Classify. Una vezque la estrategia de prueba se ha establecido, elclasificador se construye y se evaluo con el botonStart. Este proceso conjunto de entrenamientoutilizando el algoritmo seleccionado aprendizaje,C4.5 en este caso. Luego se clasifica a todas lasinstancias en los datos de entrenamiento—porqueesta es la opcion de evaluacion que se ha elegido—y estadısticas de resultados de desempeno. Estosse muestran en la Figure 4.
5.2 Interpreting the output
The outcome of training and testing appears inthe Classifier output box on the right. You canscroll through the text to examine it. First, look atthe part that describes the decision tree that wasgenerated:
El resultado de la formacion y la prueba apareceen el cuadro de Classifier output a la derecha.Puede desplazarse por el texto para examinarla.En primer lugar, busque en la parte que describeel arbol de decision que se ha generado:
J48 pruned tree
------------------
outlook = sunny
| humidity = high: no (3.0)
| humidity = normal: yes (2.0)
outlook = overcast: yes (4.0)
outlook = rainy
| windy = TRUE: no (2.0)
| windy = FALSE: yes (3.0)
10
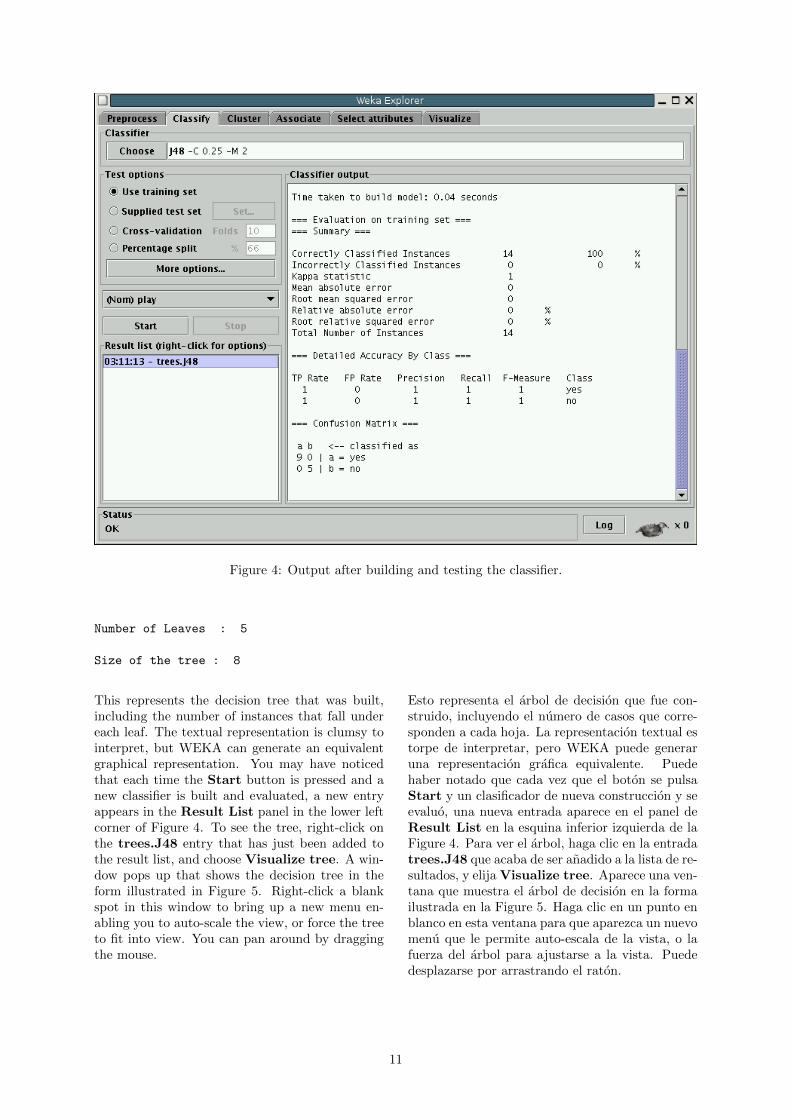
Figure 4: Output after building and testing the classifier.
Number of Leaves : 5
Size of the tree : 8
This represents the decision tree that was built,including the number of instances that fall undereach leaf. The textual representation is clumsy tointerpret, but WEKA can generate an equivalentgraphical representation. You may have noticedthat each time the Start button is pressed and anew classifier is built and evaluated, a new entryappears in the Result List panel in the lower leftcorner of Figure 4. To see the tree, right-click onthe trees.J48 entry that has just been added tothe result list, and choose Visualize tree. A win-dow pops up that shows the decision tree in theform illustrated in Figure 5. Right-click a blankspot in this window to bring up a new menu en-abling you to auto-scale the view, or force the treeto fit into view. You can pan around by draggingthe mouse.
Esto representa el arbol de decision que fue con-struido, incluyendo el numero de casos que corre-sponden a cada hoja. La representacion textual estorpe de interpretar, pero WEKA puede generaruna representacion grafica equivalente. Puedehaber notado que cada vez que el boton se pulsaStart y un clasificador de nueva construccion y seevaluo, una nueva entrada aparece en el panel deResult List en la esquina inferior izquierda de laFigure 4. Para ver el arbol, haga clic en la entradatrees.J48 que acaba de ser anadido a la lista de re-sultados, y elija Visualize tree. Aparece una ven-tana que muestra el arbol de decision en la formailustrada en la Figure 5. Haga clic en un punto enblanco en esta ventana para que aparezca un nuevomenu que le permite auto-escala de la vista, o lafuerza del arbol para ajustarse a la vista. Puededesplazarse por arrastrando el raton.
11
Figure 5: The decision tree that has been built.
This tree is used to classify test instances. Thefirst condition is the one in the so-called “root”node at the top. In this case, the ‘outlook’ at-tribute is tested at the root node and, dependingon the outcome, testing continues down one of thethree branches. If the value is ‘overcast’, testingends and the predicted class is ‘yes’. The rectan-gular nodes are called “leaf” nodes, and give theclass that is to be predicted. Returning to the rootnode, if the ‘outlook’ attribute has value ’sunny’,the ‘humidity’ attribute is tested, and if ’outlook’has value ‘rainy, the ’windy’ attribute is tested. Nopaths through this particular tree have more thantwo tests.
Este arbol se utiliza para clasificar los casos deprueba. La primera condicion es la de la llamada“raız” del nodo en la parte superior. En este caso,el atributo ‘perspectivas’ se prueba en el nodo raızy, dependiendo del resultado, la prueba continuapor una de las tres ramas. Si el valor es ‘cubierto’,finaliza las pruebas y la clase predicha es ‘sı’. Losnodos rectangulares se denominan “hojas” nodos,y dar la clase que se predijo. Volviendo al nodoraız, si el atributo ‘perspectivas’ tiene un valor‘sol’, el atributo ‘humedad’ se prueba, y si ‘per-spectivas’ tiene un valor de ‘lluvias’, el atributo‘viento’ se prueba. No hay caminos a traves deeste arbol en particular tiene mas de dos pruebas.
Now let us consider the remainder of the infor-mation in the Classifier output area. The nexttwo parts of the output report on the quality of theclassification model based on the testing option wehave chosen.
Consideremos ahora el resto de la informacion enel area de Classifier output. Las dos siguientespartes del informe de salida en la calidad del mod-elo de clasificacion basado en la opcion de pruebaque hemos elegido.
The following states how many and what propor-tion of test instances have been correctly classified:
Los siguientes estados cuantos y que proporcion decasos de prueba han sido correctamente clasifica-dos:
Correctly Classified Instances 14 100%
12
This is the accuracy of the model on the dataused for testing. It is completely accurate (100%),which is often the case when the training set isused for testing. There are some other perfor-mance measures in the text output area, which wewon’t discuss here.
Esta es la precision del modelo sobre los datosutilizados para la prueba. Es totalmente preciso(100%), que es a menudo el caso cuando el con-junto de entrenamiento se utiliza para la prueba.Hay algunas medidas de desempeno en la zona desalida de texto, que no vamos a discutir aquı.
At the bottom of the output is the confusion ma-trix:
En la parte inferior de la salida es la matriz deconfusion:
=== Confusion Matrix ===
a b <-- classified as
9 0 | a = yes
0 5 | b = no
Each element in the matrix is a count of instances.Rows represent the true classes, and columns rep-resent the predicted classes. As you can see, all 9‘yes’ instances have been predicted as yes, and all5 ‘no’ instances as no.
Cada elemento de la matriz es un recuento de loscasos. Las filas representan las clases de verdad, ylas columnas representan las clases previsto. Comopuede ver, todos los 9 ‘sı’ casos se han previstocomo sı, y los 5 ‘no’ casos como no.
5.2.1 Exercise
Ex 8: How would the following instance be clas-sified using the decision tree?
outlook = sunny, temperature = cool, hu-midity = high, windy = TRUE
Ex. 8: Como serıa la siguiente instancia se clasi-ficaran con el arbol de decision?
perspectivas = soleado, temperatura = fria,humedad = viento, alta = TRUE
5.3 Setting the testing method
When the Start button is pressed, the selectedlearning algorithm is started and the dataset thatwas loaded in the Preprocess panel is used totrain a model. A model built from the full train-ing set is then printed into the Classifier outputarea: this may involve running the learning algo-rithm one final time.
Cuando el boton se pulsa Start, el algoritmo deaprendizaje seleccionadas se inicia y el conjuntode datos que se cargo en el panel de Preprocessse utiliza para entrenar a un modelo. Un modeloconstruido a partir del conjunto de entrenamientocompleto se imprime en el area de Classifier out-put: esto puede implicar que ejecuta el algoritmode aprendizaje por ultima vez.
The remainder of the output in the Classifieroutput area depends on the test protocol thatwas chosen using Test options. The Test op-tions box gives several possibilities for evaluatingclassifiers:
El resto de la produccion en el area de Classifieroutput depende del protocolo de prueba que fueelegido con Test options. El cuadro de Test op-tions da varias posibilidades para la evaluacion delos clasificadores:
13
Use training set Uses the same dataset that wasused for training (the one that was loaded inthe Preprocess panel). This is the optionwe used above. It is generally NOT recom-mended because it gives over-optimistic per-formance estimates.
Usar el conjunto de la formacion Utiliza elmismo conjunto de datos que se utilizo parala formacion (la que se cargo en el panelde Preprocess). Esta es la opcion queusamos anteriormente. Por lo general, nose recomienda porque da estimaciones derendimiento demasiado optimistas.
Supplied test set Lets you select a file contain-ing a separate dataset that is used exclusivelyfor testing.
prueba suministrados conjunto Permiteseleccionar un archivo que contiene unconjunto de datos independiente que seutiliza exclusivamente para la prueba.
Cross-validation This is the default option, andthe most commonly-used one. It first splitsthe training set into disjoint subsets called“folds.” The number of subsets can be en-tered in the Folds field. Ten is the de-fault, and in general gives better estimatesthan other choices. Once the data has beensplit into folds of (approximately) equal size,all but one of the folds are used for train-ing and the remaining, left-out, one is usedfor testing. This involves building a newmodel from scratch from the correspondingsubset of data and evaluating it on the let-out fold. Once this has been done for thefirst test fold, a new fold is selected for test-ing and the remaining folds used for train-ing. This is repeated until all folds havebeen used for testing. In this way each in-stance in the full dataset is used for testingexactly once, and an instance is only usedfor testing when it is not used for train-ing. WEKA’s cross-validation is a strat-ified cross-validation, which means thatthe class proportions are preserved when di-viding the data into folds: each class is rep-resented by roughly the same number of in-stances in each fold. This gives slightly im-proved performance estimates compared tounstratified cross-validation.
La validacion cruzada Esta es la opcion por de-fecto, y el mas comunmente utilizado. Enprimer lugar, se divide el conjunto de entre-namiento en subconjuntos disjuntos llama-dos “pliegues”. El numero de subconjun-tos se pueden introducir en el campo Folds.Diez es el valor predeterminado, y en gen-eral proporciona mejores estimaciones queotras opciones. Una vez que los datos seha dividido en los pliegues de (aproximada-mente) igual tamano, todos menos uno delos pliegues se utilizan para la formacion y elrestante a cabo, a la izquierda-, uno se utilizapara la prueba. Esto implica la construccionde un nuevo modelo a partir de cero desde elsubconjunto de datos correspondientes y laevaluacion que sobre la que-a veces. Una vezque esto se ha hecho para la primera pruebadoble, una nueva tapa esta seleccionado paralas pruebas y los pliegues restante utilizadopara el entrenamiento. Esto se repite hastaque todos los pliegues se han utilizado parala prueba. De esta manera, cada instan-cia del conjunto de datos completo se utilizapara probar una sola vez, y una instanciasolo se utiliza para la prueba cuando no seutiliza para el entrenamiento. WEKA cruzde la validacion es una stratified cross-validation, lo que significa que las propor-ciones de clase se conservan al dividir losdatos en los pliegues: cada clase esta rep-resentada por aproximadamente el mismonumero de casos en cada pliegue. Estoproporciona un rendimiento mejorado liger-amente en comparacion con las estimacionessin estratificar la validacion cruzada.
14
Percentage split Shuffles the data randomlyand then splits it into a training and a testset according to the proportion specified. Inpractice, this is a good alternative to cross-validation if the size of the dataset makescross-validation too slow.
Shuffles Porcentaje dividir los datos al azar yluego se divide en un entrenamiento y unconjunto de pruebas de acuerdo a la pro-porcion especificada. En la practica, esta esuna buena alternativa a la validacion cruzadasi el tamano del conjunto de datos hace quela validacion cruzada demasiado lento.
The first two testing methods, evaluation on thetraining set and using a supplied test set, involvebuilding a model only once. Cross-validation in-volves building a model N+1 times, where N is thechosen number of folds. The first N times, a frac-tion (N − 1)/N (90% for ten-fold cross-validation)of the data is used for training, and the finaltime the full dataset is used. The percentage splitmethod involves building the model twice, once onthe reduced dataset and again on the full dataset.
Los dos primeros metodos de prueba, la evaluacionen el conjunto de entrenamiento y el uso de unaunidad de prueba suministrada, implicarıa la con-struccion de un modelo de una sola vez. La val-idacion cruzada consiste en la construccion de unmodelo de N + 1 veces, donde N es el numeroelegido de los pliegues. Los primeros N veces, unafraccion (N − 1)/N (90% de diez veces la vali-dacion cruzada) de los datos se utiliza para el en-trenamiento y el tiempo final del conjunto de datoscompleto se utiliza. El metodo de dividir el por-centaje implica la construccion del modelo en dosocasiones, una vez en el conjunto de datos reduci-dos y de nuevo en el conjunto de datos completo.
5.3.1 Exercise
Ex 9: Load the iris data using the Preprocesspanel. Evaluate C4.5 on this data using(a) the training set and (b) cross-validation.What is the estimated percentage of correctclassifications for (a) and (b)? Which esti-mate is more realistic?
Ex. 9 carga los datos del iris mediante el panelde Preprocess. Evaluar C4.5 en estos datosutilizando (a) el conjunto de entrenamientoy (b) la validacion cruzada. Cual es el por-centaje estimado de clasificaciones correctaspara (a) y (b)? Que estiman es mas realista?
5.4 Visualizing classification errors
WEKA’s Classify panel provides a way of visu-alizing classification errors. To do this, right-clickthe trees.J48 entry in the result list and chooseVisualize classifier errors. A scatter plot win-dow pops up. Instances that have been classifiedcorrectly are marked by little crosses; whereas onesthat have been classified incorrectly are marked bylittle squares.
Panel de WEKA de Classify proporciona unamanera de visualizar los errores de clasificacion.Para ello, haga clic en la entrada trees.J48 enla lista de resultados y elegir Visualize classi-fier errors. Una ventana grafica de dispersionaparece. Casos que han sido clasificados correc-tamente marcadas por pequenas cruces, mientrasque los que han sido clasificados incorrectamenteestan marcados por pequenos cuadrados.
5.4.1 Exercise
15

Ex 10: Use the Visualize classifier errors func-tion to find the wrongly classified test in-stances for the cross-validation performed inExercise 9. What can you say about the lo-cation of the errors?
Ex. 10: Utilice la funcion de Visualize classi-fier errors para encontrar las instancias deprueba de mal clasificadas para la validacioncruzada realizada en el ejercicio 9. Quepuede decir acerca de la ubicacion de los er-rores?
16

6 Answers To Exercises
1. Hot, mild and cool. 1. caliente, suave y fresco.
2. The iris dataset has 150 instances and 5 at-tributes. So far we have only seen nomi-nal values, but the attribute ‘petallength’ isa numeric attribute and contains numericvalues. In this dataset the values for thisattribute lie between 1.0 and 6.9 (see Mini-mum and Maximum in the right panel).
2. El conjunto de datos del iris tiene 150 casos yatributos 5. Hasta ahora solo hemos vistolos valores de nominal, pero ‘petallength’ elatributo es un atributo de numeric y con-tiene valores numericos. En este conjuntode datos los valores de este atributo se en-cuentran entre 1.0 y 6.9 (vease MinimumMaximum y en el panel derecho).
3. The first column is the number given to an in-stance when it is loaded from the ARFF file.It corresponds to the order of the instancesin the file.
3. La primera columna es el numero dado en unainstancia cuando se carga desde el archivoARFF. Se corresponde con el orden de lasinstancias en el archivo.
4. The class value of this instance is ‘no’. The rowwith the number 8 in the first column is theinstance with instance number 8.
4. El valor de la clase de esta instancia es “no”. Lafila con el numero 8 en la primera columnaes la instancia con el numero de instancia
5. This can be easily seen in the Viewer window.The iris dataset has four numeric and onenominal attribute. The nominal attribute isthe class attribute.
5. Esto puede verse facilmente en la ventana deViewer. El conjunto de datos del iris tienecuatro numerico y un atributo nominal. Elatributo nominal es el atributo de clase.
6. Select the RemoveWithValues filter afterclicking the Choose button. Click on thefield that is located next to the Choose but-ton and set the field attributeIndex to 3and the field nominalIndices to 1. PressOK and Apply.
6. Seleccione el RemoveWithValues filtro de-spues de hacer clic en el boton de Choose.Haga clic en el campo que se encuentraal lado del boton de Choose y establezcael campo attributeIndex a 3 y el camponominalIndices a 1. Pulse OK y Apply.
7. Click the Undo button. 7. Haga clic en el boton de Undo.
8. The test instance would be classified as ’no’. 8. La instancia de prueba serıa clasificado como‘no’.
17

9. Percent correct on the training data is 98%.Percent correct under cross-validation is96%. The cross-validation estimate is morerealistic.
9. porcentaje correcto en los datos de entre-namiento es de 98%. Porcentaje de respues-tas correctas en la validacion cruzada es del96%. La estimacion de la validacion cruzadaes mas realista.
10. The errors are located at the class boundaries. 10. Los errores se encuentran en los lımites declase.
18

Practical Data Mining
Tutorial 2: Nearest Neighbor Learning and Decision Trees
Eibe Frank and Ian H. Witten
May 5, 2011
c©2006-2012 University of Waikato
1 Introduction
In this tutorial you will experiment with nearestneighbor classification and decision tree learning.For most of it we use a real-world forensic glassclassification dataset.
En este tutorial podras experimentar con la clasi-ficacion mas cercano vecino y arbol de decisionaprendizaje. Para la mayorıa de los que usamosun mundo real forenses conjunto de datos de clasi-ficacion de vidrio.
We begin by taking a preliminary look at thisdataset. Then we examine the effect of selectingdifferent attributes for nearest neighbor classifica-tion. Next we study class noise and its impacton predictive performance for the nearest neighbormethod. Following that we vary the training setsize, both for nearest neighbor classification anddecision tree learning. Finally, you are asked tointeractively construct a decision tree for an imagesegmentation dataset.
Empezamos por echar un vistazo preliminar a estabase de datos. A continuacion, examinamos elefecto de la seleccion de atributos diferentes parala clasificacion del vecino mas cercano. A contin-uacion se estudia el ruido de clase y su impactoen el rendimiento predictivo del metodo del ve-cino mas cercano. Despues de que variar el tamanodel conjunto de la formacion, tanto para la clasifi-cacion del vecino mas cercano y el arbol de decisionaprendizaje. Por ultimo, se le pide para construirde forma interactiva un arbol de decision para unconjunto de datos de segmentacion de la imagen.
Before continuing with this tutorial you should re-view in your mind some aspects of the classificationtask:
Antes de continuar con este tutorial es necesarioque revise en su mente algunos aspectos de la tareade clasificacion:
• How is the accuracy of a classifier measured? • Como es la precision de un clasificador demedir?
• What are irrelevant attributes in a data set,and can additional attributes be harmful?
• Cuales son los atributos irrelevantes en unconjunto de datos y atributos adicionalespueden ser perjudiciales?
• What is class noise, and how would you mea-sure its effect on learning?
• Cual es el ruido de clase, y como medir suefecto en el aprendizaje?
• What is a learning curve? • Que es una curva de aprendizaje?
• If you, personally, had to invent a decisiontree classifier for a particular dataset, howwould you go about it?
• Si usted, personalmente, tenıa que inventarun clasificador de arbol de decision para unconjunto de datos particular, como hacerlo?
1
2 The glass dataset
The glass dataset glass.arff from the US Foren-sic Science Service contains data on six types ofglass. Glass is described by its refractive index andthe chemical elements it contains, and the aim isto classify different types of glass based on thesefeatures. This dataset is taken from the UCI datasets, which have been collected by the Universityof California at Irvine and are freely available onthe World Wide Web. They are often used as abenchmark for comparing data mining algorithms.
El conjunto de datos de cristal glass.arff delos EE.UU. Servicio de Ciencias Forenses contienedatos sobre los seis tipos de vidrio. El vidrio esdescrito por su ındice de refraccion y los elementosquımicos que contiene, y el objetivo es clasificarlos diferentes tipos de vidrio sobre la base de es-tas caracterısticas. Este conjunto de datos se hatomado de los conjuntos de datos de la UCI, quehan sido recogidos por la Universidad de Califor-nia en Irvine y estan disponibles libremente en laWorld Wide Web. A menudo se utilizan como ref-erencia para comparar los algoritmos de minerıade datos.
Find the dataset glass.arff and load it into theWEKA Explorer. For your own information, an-swer the following questions, which review materialcovered in Tutorial 1.
Encontrar el conjunto de datos glass.arff y car-garlo en la Explorer WEKA. Para su propia in-formacion, conteste las siguientes preguntas, queel material objeto de examen en el Tutorial 1.
Ex. 1: How many attributes are there in the glassdataset? What are their names? What is theclass attribute?
Ex. 1: Como los atributos con los que cuenta elconjunto de datos de cristal? Cuales son susnombres? Cual es el atributo de la clase?
Run the classification algorithm IBk(weka.classifiers.lazy.IBk). Use cross-validation to test its performance, leaving thenumber of folds at the default value of 10. Recallthat you can examine the classifier options inthe GenericObjectEditor window that popsup when you click the text beside the Choosebutton. The default value of the KNN field is 1:this sets the number of neighboring instances touse when classifying.
Ejecutar el algoritmo de clasificacion IBK(weka.classifiers.lazy.IBk). Utilice la vali-dacion cruzada para probar su funcionamiento, de-jando el numero de pliegues en el valor predeter-minado de 10. Recuerde que usted puede exami-nar las opciones del clasificador en la ventana deGenericObjectEditor que aparece al hacer clicen el texto junto al boton Choose. El valor pordefecto del campo KNN es una: este establece elnumero de casos de vecinos a utilizar en la clasifi-cacion.
Ex. 2: What is the accuracy of IBk (given in theClassifier output box)?
Ex. 2: Que es la exactitud de IBk (que figuranen el cuadro de Classifier output)?
Run IBk again, but increase the number of neigh-boring instances to k = 5 by entering this value inthe KNN field. Here and throughout this tutorial,continue to use cross-validation as the evaluationmethod.
Ejecutar IBK otra vez, pero aumentar el numerode casos de vecinos a k = 5 por entrar en este valoren el campo KNN. Aquı ya lo largo de este tuto-rial, seguir utilizando la validacion cruzada comoel metodo de evaluacion.
Ex. 3: What is the accuracy of IBk with 5 neigh-boring instances (k = 5)?
Ex. 3: Que es la exactitud de IBk con 5 casos devecinos (k = 5)?
2
3 Attribute selection for glass classification
Now we find what subset of attributes producesthe best cross-validated classification accuracy forthe IBk nearest neighbor algorithm with k = 1 onthe glass dataset. WEKA contains automated at-tribute selection facilities, which we examine in alater tutorial, but it is instructive to do this man-ually.
Ahora nos encontramos con lo subconjunto de losatributos produce la exactitud de la clasificacionmejor validacion cruzada para el algoritmo de ve-cino mas cercano IBk con k = 1 en el conjuntode datos de vidrio. WEKA contiene automatizadoinstalaciones para la seleccion de atributos, que seexaminan mas adelante en un tutorial, pero es in-structivo para hacerlo manualmente.
Performing an exhaustive search over all possi-ble subsets of the attributes is infeasible (why?),so we apply a procedure called “backwards selec-tion.” To do this, first consider dropping eachattribute individually from the full dataset con-sisting of nine attributes (plus the class), and runa cross-validation for each reduced version. Onceyou have determined the best 8-attribute dataset,repeat the procedure with this reduced dataset tofind the best 7-attribute dataset, and so on.
Realizacion de una busqueda exhaustiva sobre to-dos los posibles subconjuntos de los atributos no esfactible (por que?), por lo que aplicar un proced-imiento llamado “al reves de seleccion.” Para ello,en primer lugar considerar abandonar cada atrib-uto individual del conjunto de datos completa queconsiste en nueve atributos (ademas de la clase), yejecutar una validacion cruzada para cada versionreducida. Una vez que haya determinado el con-junto de datos mas de 8 atributo, repita el proced-imiento con este conjunto de datos reduce a en-contrar el mejor conjunto de datos 7-atributo, yası sucesivamente.
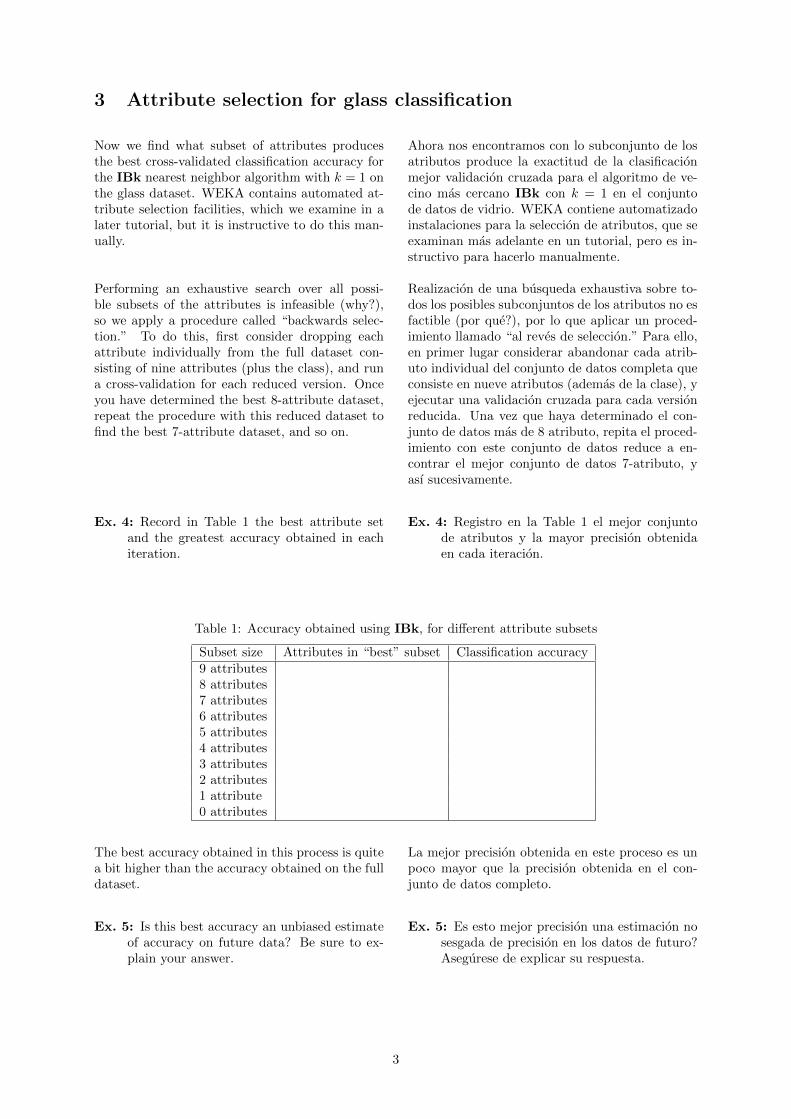
Ex. 4: Record in Table 1 the best attribute setand the greatest accuracy obtained in eachiteration.
Ex. 4: Registro en la Table 1 el mejor conjuntode atributos y la mayor precision obtenidaen cada iteracion.
Table 1: Accuracy obtained using IBk, for different attribute subsets
Subset size Attributes in “best” subset Classification accuracy9 attributes8 attributes7 attributes6 attributes5 attributes4 attributes3 attributes2 attributes1 attribute0 attributes
The best accuracy obtained in this process is quitea bit higher than the accuracy obtained on the fulldataset.
La mejor precision obtenida en este proceso es unpoco mayor que la precision obtenida en el con-junto de datos completo.
Ex. 5: Is this best accuracy an unbiased estimateof accuracy on future data? Be sure to ex-plain your answer.
Ex. 5: Es esto mejor precision una estimacion nosesgada de precision en los datos de futuro?Asegurese de explicar su respuesta.
3
(Hint: to obtain an unbiased estimate of accuracyon future data, we must not look at the test dataat all when producing the classification model forwhich we want to obtain the estimate.)
(Sugerencia: para obtener una estimacion objetivade la exactitud en los datos de futuro, no debemosmirar el at all datos de prueba cuando se pro-duce el modelo de clasificacion para la que quer-emos obtener la estimacion.)
4 Class noise and nearest-neighbor learning
Nearest-neighbor learning, like other techniques,is sensitive to noise in the training data. In thissection we inject varying amounts of class noiseinto the training data and observe the effect onclassification performance.
Aprendizaje mas cercana al vecino, al igual queotras tecnicas, es sensible al ruido en los datos deentrenamiento. En esta seccion se inyectan canti-dades variables de class noise en los datos de en-trenamiento y observar el efecto en el rendimientode la clasificacion.
You can flip a certain percentage of class labels inthe data to a randomly chosen other value using anunsupervised attribute filter called AddNoise, inweka.filters.unsupervised.attribute. How-ever, for our experiment it is important that thetest data remains unaffected by class noise.
Puede invertir un cierto porcentaje de las eti-quetas de clase en los datos a un valor es-cogido de forma aleatoria otras mediante un atrib-uto sin supervision filtro llamado AddNoise,en weka.filters.unsupervised.attribute. Sinembargo, para nuestro experimento es importanteque los datos de prueba no se ve afectado por elruido de la clase.
Filtering the training data without filtering thetest data is a common requirement, and is achievedusing a “meta” classifier called FilteredClassi-fier, in weka.classifiers.meta. This meta clas-sifier should be configured to use IBk as the clas-sifier and AddNoise as the filter. The Filtered-Classifier applies the filter to the data before run-ning the learning algorithm. This is done in twobatches: first the training data and then the testdata. The AddNoise filter only adds noise to thefirst batch of data it encounters, which means thatthe test data passes through unchanged.
Filtrado de los datos de entrenamiento sin fil-trar los datos de prueba es un requisito comun, yse realiza con un “meta” clasificador denominadoFilteredClassifier, en weka.classifiers.meta.Este clasificador meta debe estar configurado parautilizar como IBk AddNoise el clasificador y elfiltro. El FilteredClassifier se aplica el filtro alos datos antes de ejecutar el algoritmo de apren-dizaje. Esto se hace en dos tandas: en primer lugarlos datos de entrenamiento y, a continuacion losdatos de prueba. El AddNoise filtro solo hacıaque el primer lote de datos que encuentra, lo quesignifica que los datos de prueba pasa a traves decambios.
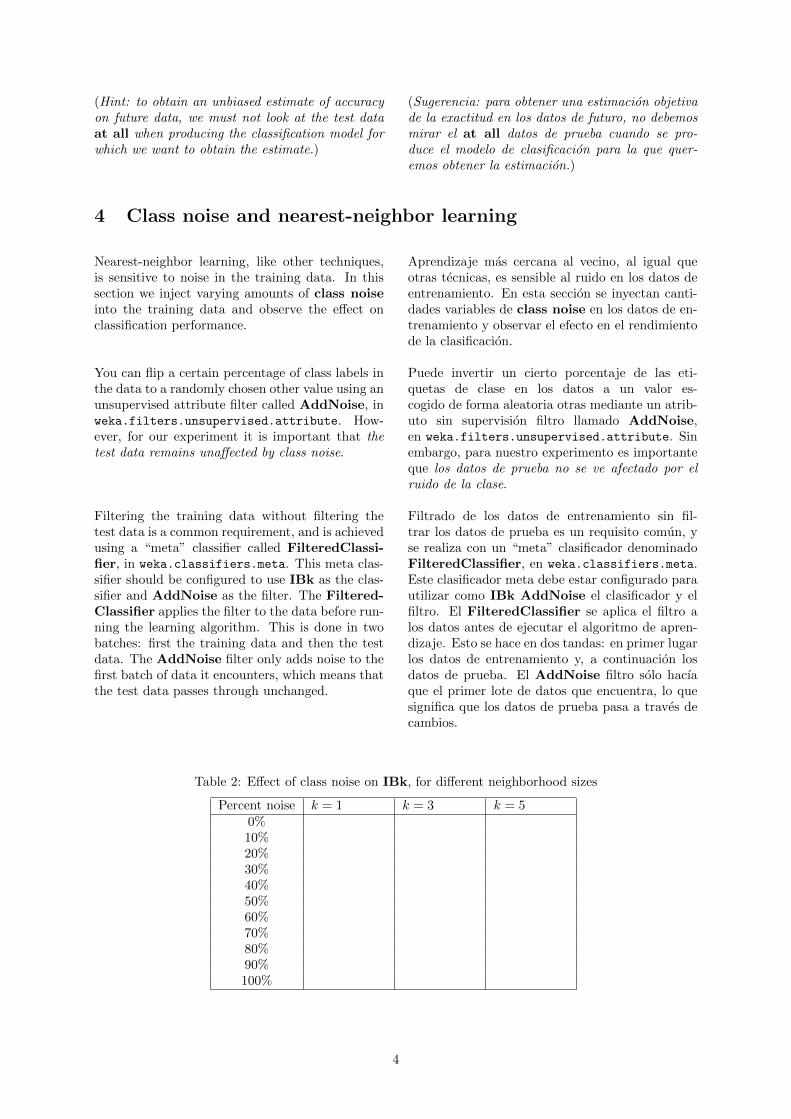
Table 2: Effect of class noise on IBk, for different neighborhood sizes
Percent noise k = 1 k = 3 k = 50%10%20%30%40%50%60%70%80%90%100%
4
Ex. 6: Reload the original glass dataset, andrecord in Table 2 the cross-validated accu-racy estimate of IBk for 10 different percent-ages of class noise and neighborhood sizesk = 1, k = 3, k = 5 (determined by the valueof k in the k-nearest-neighbor classifier).
Ex. 6: Actualizar el conjunto de datos de vidriooriginal, y registrar en la Table 2 la exactitudvalidacion cruzada estimacion de IBk por 10diferentes porcentajes de ruido de la clase yel barrio tamanos k = 1, k = 3, k = 5 (de-terminado por el valor de k en el clasificadork vecino mas cercano).
Ex. 7: What is the effect of increasing the amountof class noise?
Ex. 7: Cual es el efecto de aumentar la cantidadde ruido de clase?
Ex. 8: What is the effect of altering the value ofk?
Ex. 8: Que elemento es el efecto de modificar elvalor de k?
5 Varying the amount of training data
In this section we consider “learning curves,”which show the effect of gradually increasing theamount of training data. Again we use the glassdata, but this time with both IBk and the C4.5decision tree learner, implemented in WEKA asJ48.
En esta seccion tenemos en cuenta “las curvas deaprendizaje”, que muestran el efecto de aumen-tar gradualmente la cantidad de datos de entre-namiento. Una vez mas se utilizan los datos devidrio, pero esta vez con dos IBk y la decision C4.5alumno arbol, implementado en WEKA como J48.
To obtain learning curves, use the Filtered-Classifier again, this time in conjunction withweka.filters.unsupervised.instance.Resample,which extracts a certain specified percentage of agiven dataset and returns the reduced dataset.1
Again this is done only for the first batch to whichthe filter is applied, so the test data passes un-modified through the FilteredClassifier beforeit reaches the classifier.
Para obtener las curvas de aprendizaje, el uso dela FilteredClassifier, esta vez en relacion con elweka.filters.unsupervised.instance.Resample,que extrae un porcentaje especificado de un con-junto de datos y devuelve el conjunto de datosreducidos.2 Una vez mas esto se hace solo para elprimer grupo al que se aplica el filtro, por lo quelos datos de prueba pasa sin modificar a travesde la FilteredClassifier antes que alcanza elclasificador.
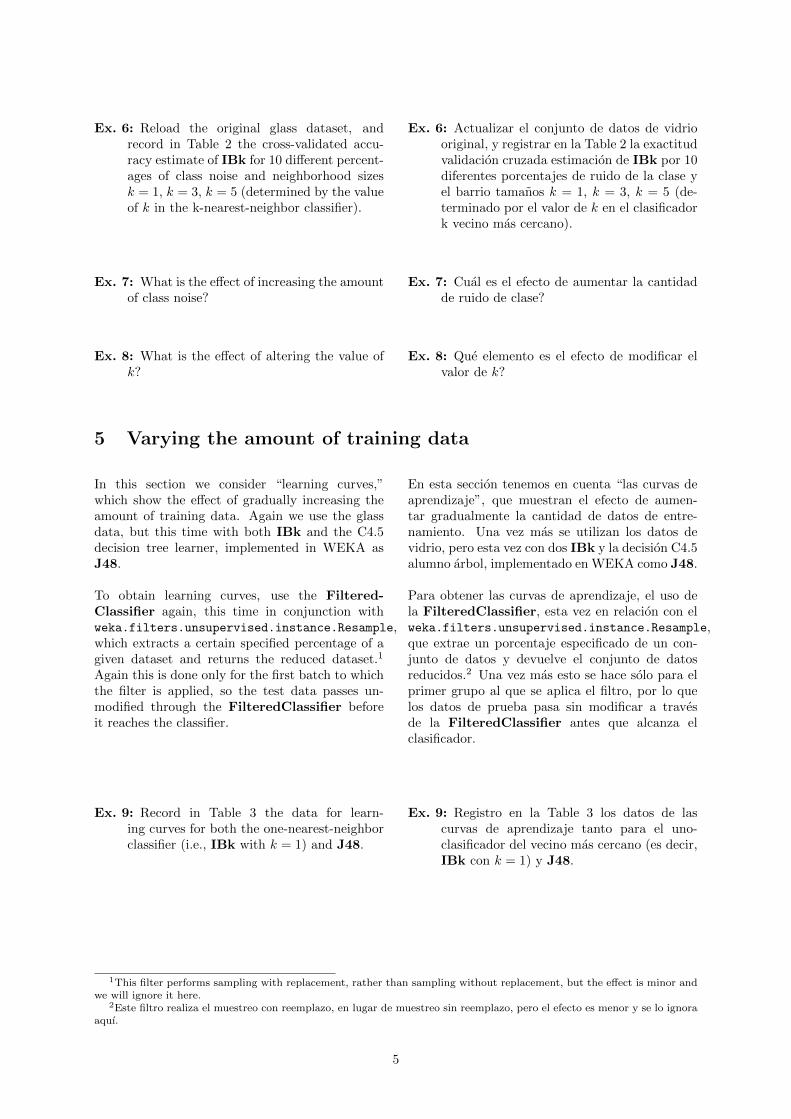
Ex. 9: Record in Table 3 the data for learn-ing curves for both the one-nearest-neighborclassifier (i.e., IBk with k = 1) and J48.
Ex. 9: Registro en la Table 3 los datos de lascurvas de aprendizaje tanto para el uno-clasificador del vecino mas cercano (es decir,IBk con k = 1) y J48.
1This filter performs sampling with replacement, rather than sampling without replacement, but the effect is minor andwe will ignore it here.
2Este filtro realiza el muestreo con reemplazo, en lugar de muestreo sin reemplazo, pero el efecto es menor y se lo ignoraaquı.
5
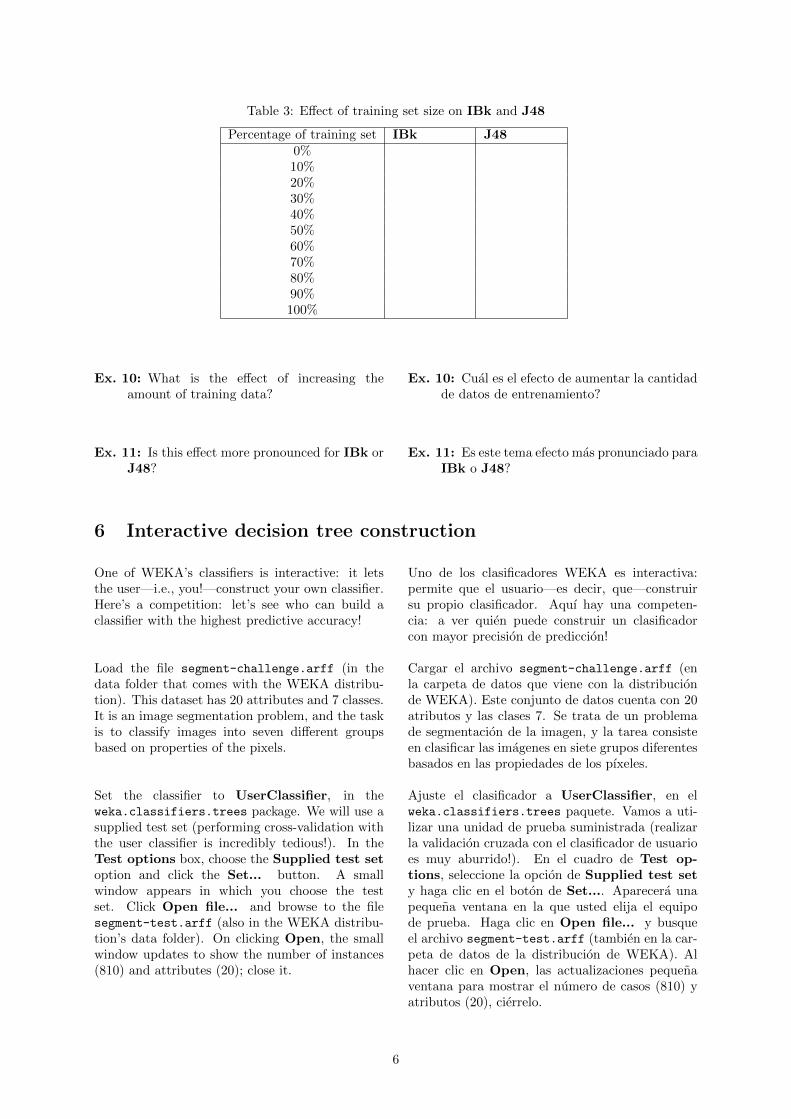
Table 3: Effect of training set size on IBk and J48
Percentage of training set IBk J480%10%20%30%40%50%60%70%80%90%100%
Ex. 10: What is the effect of increasing theamount of training data?
Ex. 10: Cual es el efecto de aumentar la cantidadde datos de entrenamiento?
Ex. 11: Is this effect more pronounced for IBk orJ48?
Ex. 11: Es este tema efecto mas pronunciado paraIBk o J48?
6 Interactive decision tree construction
One of WEKA’s classifiers is interactive: it letsthe user—i.e., you!—construct your own classifier.Here’s a competition: let’s see who can build aclassifier with the highest predictive accuracy!
Uno de los clasificadores WEKA es interactiva:permite que el usuario—es decir, que—construirsu propio clasificador. Aquı hay una competen-cia: a ver quien puede construir un clasificadorcon mayor precision de prediccion!
Load the file segment-challenge.arff (in thedata folder that comes with the WEKA distribu-tion). This dataset has 20 attributes and 7 classes.It is an image segmentation problem, and the taskis to classify images into seven different groupsbased on properties of the pixels.
Cargar el archivo segment-challenge.arff (enla carpeta de datos que viene con la distribucionde WEKA). Este conjunto de datos cuenta con 20atributos y las clases 7. Se trata de un problemade segmentacion de la imagen, y la tarea consisteen clasificar las imagenes en siete grupos diferentesbasados en las propiedades de los pıxeles.
Set the classifier to UserClassifier, in theweka.classifiers.trees package. We will use asupplied test set (performing cross-validation withthe user classifier is incredibly tedious!). In theTest options box, choose the Supplied test setoption and click the Set... button. A smallwindow appears in which you choose the testset. Click Open file... and browse to the filesegment-test.arff (also in the WEKA distribu-tion’s data folder). On clicking Open, the smallwindow updates to show the number of instances(810) and attributes (20); close it.
Ajuste el clasificador a UserClassifier, en elweka.classifiers.trees paquete. Vamos a uti-lizar una unidad de prueba suministrada (realizarla validacion cruzada con el clasificador de usuarioes muy aburrido!). En el cuadro de Test op-tions, seleccione la opcion de Supplied test sety haga clic en el boton de Set.... Aparecera unapequena ventana en la que usted elija el equipode prueba. Haga clic en Open file... y busqueel archivo segment-test.arff (tambien en la car-peta de datos de la distribucion de WEKA). Alhacer clic en Open, las actualizaciones pequenaventana para mostrar el numero de casos (810) yatributos (20), cierrelo.
6
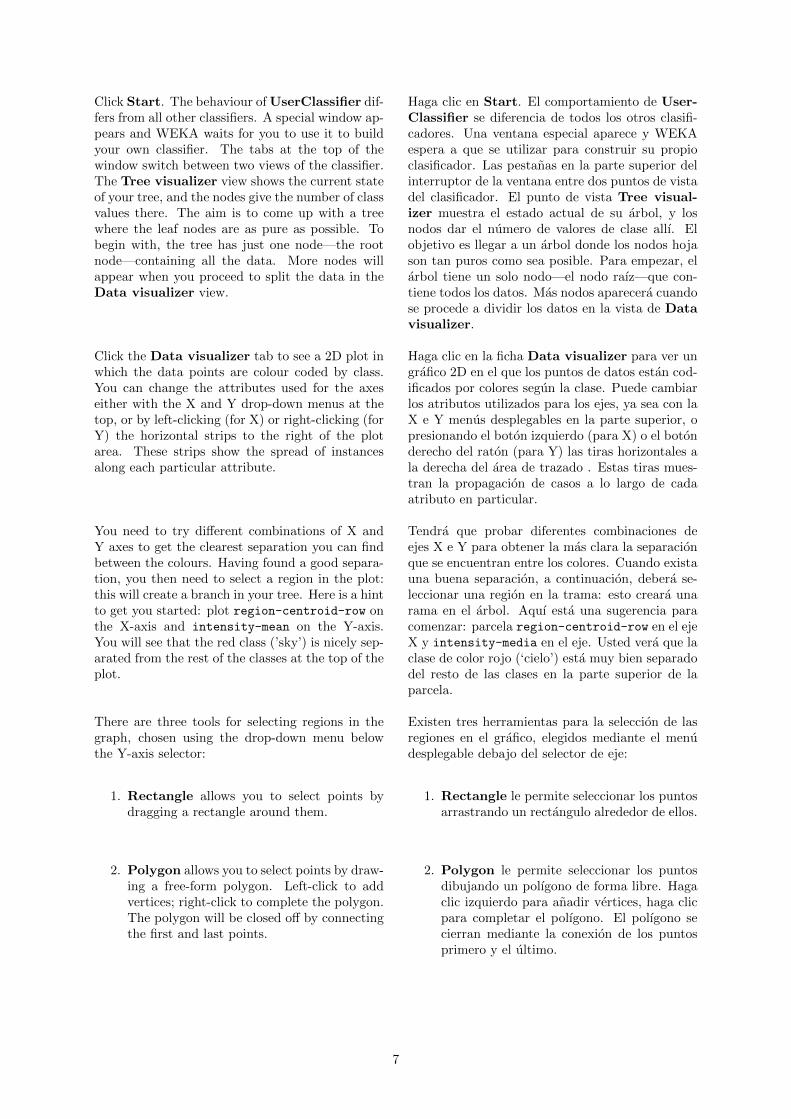
Click Start. The behaviour of UserClassifier dif-fers from all other classifiers. A special window ap-pears and WEKA waits for you to use it to buildyour own classifier. The tabs at the top of thewindow switch between two views of the classifier.The Tree visualizer view shows the current stateof your tree, and the nodes give the number of classvalues there. The aim is to come up with a treewhere the leaf nodes are as pure as possible. Tobegin with, the tree has just one node—the rootnode—containing all the data. More nodes willappear when you proceed to split the data in theData visualizer view.
Haga clic en Start. El comportamiento de User-Classifier se diferencia de todos los otros clasifi-cadores. Una ventana especial aparece y WEKAespera a que se utilizar para construir su propioclasificador. Las pestanas en la parte superior delinterruptor de la ventana entre dos puntos de vistadel clasificador. El punto de vista Tree visual-izer muestra el estado actual de su arbol, y losnodos dar el numero de valores de clase allı. Elobjetivo es llegar a un arbol donde los nodos hojason tan puros como sea posible. Para empezar, elarbol tiene un solo nodo—el nodo raız—que con-tiene todos los datos. Mas nodos aparecera cuandose procede a dividir los datos en la vista de Datavisualizer.
Click the Data visualizer tab to see a 2D plot inwhich the data points are colour coded by class.You can change the attributes used for the axeseither with the X and Y drop-down menus at thetop, or by left-clicking (for X) or right-clicking (forY) the horizontal strips to the right of the plotarea. These strips show the spread of instancesalong each particular attribute.
Haga clic en la ficha Data visualizer para ver ungrafico 2D en el que los puntos de datos estan cod-ificados por colores segun la clase. Puede cambiarlos atributos utilizados para los ejes, ya sea con laX e Y menus desplegables en la parte superior, opresionando el boton izquierdo (para X) o el botonderecho del raton (para Y) las tiras horizontales ala derecha del area de trazado . Estas tiras mues-tran la propagacion de casos a lo largo de cadaatributo en particular.
You need to try different combinations of X andY axes to get the clearest separation you can findbetween the colours. Having found a good separa-tion, you then need to select a region in the plot:this will create a branch in your tree. Here is a hintto get you started: plot region-centroid-row onthe X-axis and intensity-mean on the Y-axis.You will see that the red class (’sky’) is nicely sep-arated from the rest of the classes at the top of theplot.
Tendra que probar diferentes combinaciones deejes X e Y para obtener la mas clara la separacionque se encuentran entre los colores. Cuando existauna buena separacion, a continuacion, debera se-leccionar una region en la trama: esto creara unarama en el arbol. Aquı esta una sugerencia paracomenzar: parcela region-centroid-row en el ejeX y intensity-media en el eje. Usted vera que laclase de color rojo (‘cielo’) esta muy bien separadodel resto de las clases en la parte superior de laparcela.
There are three tools for selecting regions in thegraph, chosen using the drop-down menu belowthe Y-axis selector:
Existen tres herramientas para la seleccion de lasregiones en el grafico, elegidos mediante el menudesplegable debajo del selector de eje:
1. Rectangle allows you to select points bydragging a rectangle around them.
1. Rectangle le permite seleccionar los puntosarrastrando un rectangulo alrededor de ellos.
2. Polygon allows you to select points by draw-ing a free-form polygon. Left-click to addvertices; right-click to complete the polygon.The polygon will be closed off by connectingthe first and last points.
2. Polygon le permite seleccionar los puntosdibujando un polıgono de forma libre. Hagaclic izquierdo para anadir vertices, haga clicpara completar el polıgono. El polıgono secierran mediante la conexion de los puntosprimero y el ultimo.
7
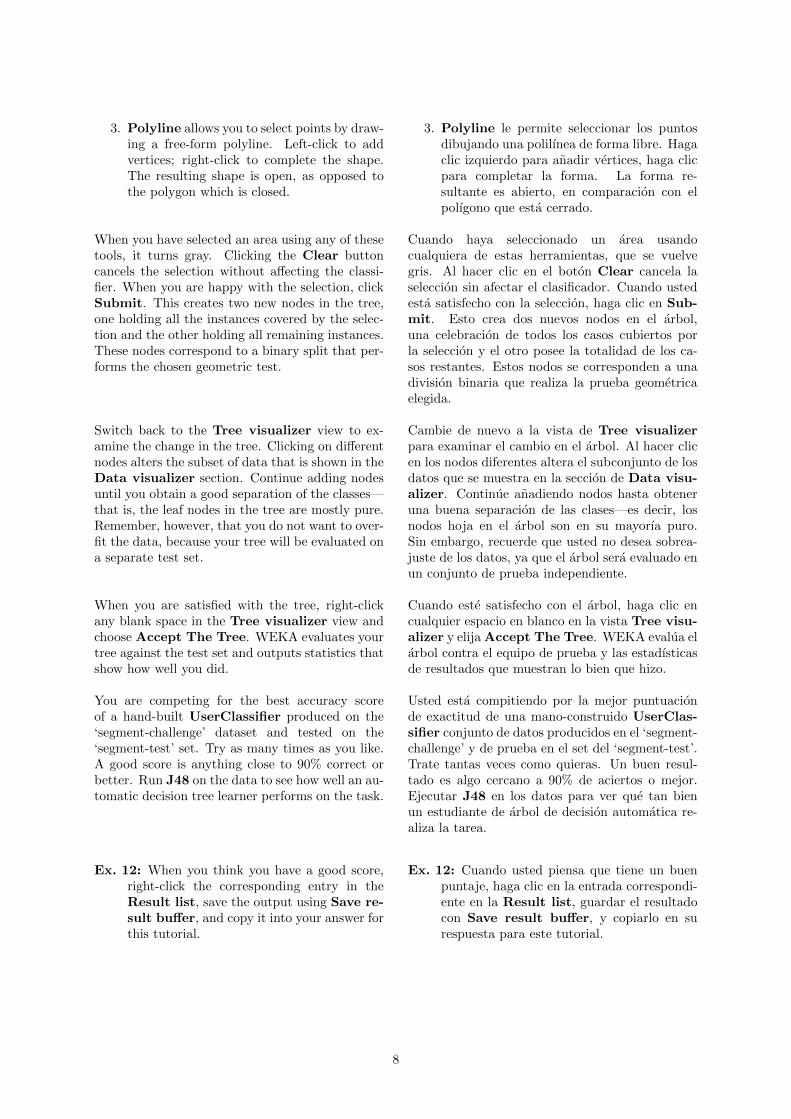
3. Polyline allows you to select points by draw-ing a free-form polyline. Left-click to addvertices; right-click to complete the shape.The resulting shape is open, as opposed tothe polygon which is closed.
3. Polyline le permite seleccionar los puntosdibujando una polilınea de forma libre. Hagaclic izquierdo para anadir vertices, haga clicpara completar la forma. La forma re-sultante es abierto, en comparacion con elpolıgono que esta cerrado.
When you have selected an area using any of thesetools, it turns gray. Clicking the Clear buttoncancels the selection without affecting the classi-fier. When you are happy with the selection, clickSubmit. This creates two new nodes in the tree,one holding all the instances covered by the selec-tion and the other holding all remaining instances.These nodes correspond to a binary split that per-forms the chosen geometric test.
Cuando haya seleccionado un area usandocualquiera de estas herramientas, que se vuelvegris. Al hacer clic en el boton Clear cancela laseleccion sin afectar el clasificador. Cuando ustedesta satisfecho con la seleccion, haga clic en Sub-mit. Esto crea dos nuevos nodos en el arbol,una celebracion de todos los casos cubiertos porla seleccion y el otro posee la totalidad de los ca-sos restantes. Estos nodos se corresponden a unadivision binaria que realiza la prueba geometricaelegida.
Switch back to the Tree visualizer view to ex-amine the change in the tree. Clicking on differentnodes alters the subset of data that is shown in theData visualizer section. Continue adding nodesuntil you obtain a good separation of the classes—that is, the leaf nodes in the tree are mostly pure.Remember, however, that you do not want to over-fit the data, because your tree will be evaluated ona separate test set.
Cambie de nuevo a la vista de Tree visualizerpara examinar el cambio en el arbol. Al hacer clicen los nodos diferentes altera el subconjunto de losdatos que se muestra en la seccion de Data visu-alizer. Continue anadiendo nodos hasta obteneruna buena separacion de las clases—es decir, losnodos hoja en el arbol son en su mayorıa puro.Sin embargo, recuerde que usted no desea sobrea-juste de los datos, ya que el arbol sera evaluado enun conjunto de prueba independiente.
When you are satisfied with the tree, right-clickany blank space in the Tree visualizer view andchoose Accept The Tree. WEKA evaluates yourtree against the test set and outputs statistics thatshow how well you did.
Cuando este satisfecho con el arbol, haga clic encualquier espacio en blanco en la vista Tree visu-alizer y elija Accept The Tree. WEKA evalua elarbol contra el equipo de prueba y las estadısticasde resultados que muestran lo bien que hizo.
You are competing for the best accuracy scoreof a hand-built UserClassifier produced on the‘segment-challenge’ dataset and tested on the‘segment-test’ set. Try as many times as you like.A good score is anything close to 90% correct orbetter. Run J48 on the data to see how well an au-tomatic decision tree learner performs on the task.
Usted esta compitiendo por la mejor puntuacionde exactitud de una mano-construido UserClas-sifier conjunto de datos producidos en el ‘segment-challenge’ y de prueba en el set del ‘segment-test’.Trate tantas veces como quieras. Un buen resul-tado es algo cercano a 90% de aciertos o mejor.Ejecutar J48 en los datos para ver que tan bienun estudiante de arbol de decision automatica re-aliza la tarea.
Ex. 12: When you think you have a good score,right-click the corresponding entry in theResult list, save the output using Save re-sult buffer, and copy it into your answer forthis tutorial.
Ex. 12: Cuando usted piensa que tiene un buenpuntaje, haga clic en la entrada correspondi-ente en la Result list, guardar el resultadocon Save result buffer, y copiarlo en surespuesta para este tutorial.
8

Practical Data Mining
Tutorial 3: Classification Boundaries
Eibe Frank and Ian H .Witten
May 5, 2011
c©2008-2012 University of Waikato
1 Introduction
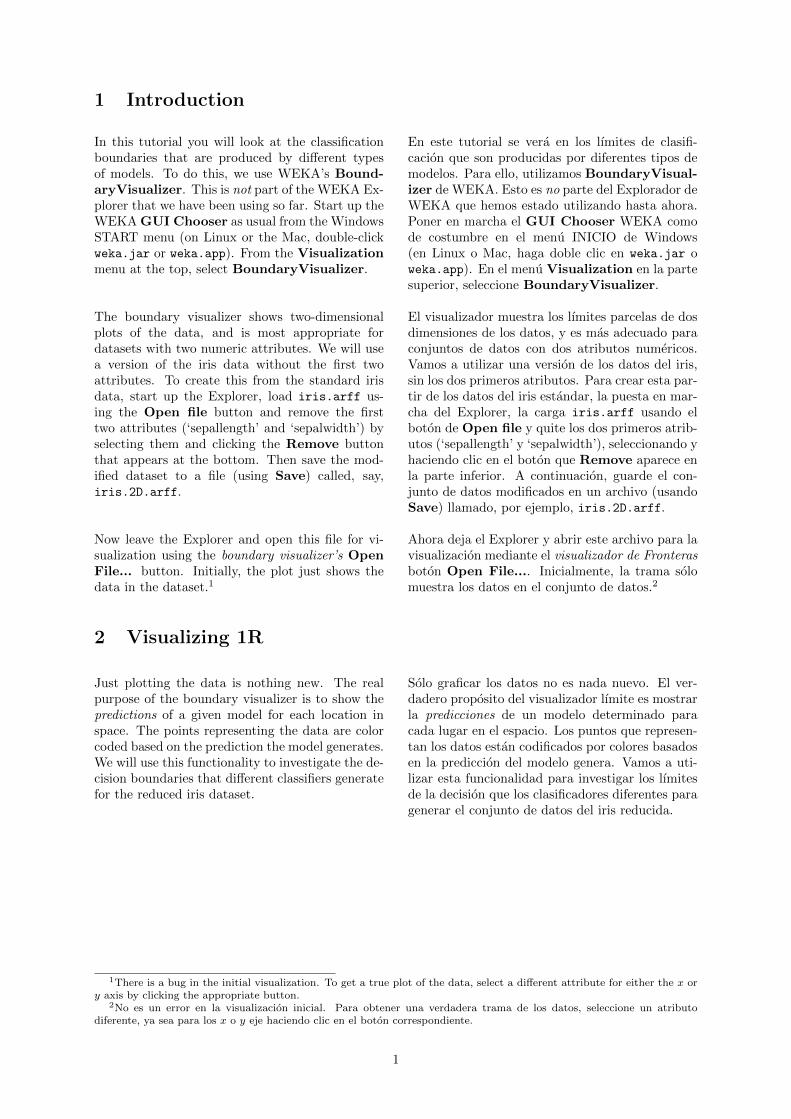
In this tutorial you will look at the classificationboundaries that are produced by different typesof models. To do this, we use WEKA’s Bound-aryVisualizer. This is not part of the WEKA Ex-plorer that we have been using so far. Start up theWEKA GUI Chooser as usual from the WindowsSTART menu (on Linux or the Mac, double-clickweka.jar or weka.app). From the Visualizationmenu at the top, select BoundaryVisualizer.
En este tutorial se vera en los lımites de clasifi-cacion que son producidas por diferentes tipos demodelos. Para ello, utilizamos BoundaryVisual-izer de WEKA. Esto es no parte del Explorador deWEKA que hemos estado utilizando hasta ahora.Poner en marcha el GUI Chooser WEKA comode costumbre en el menu INICIO de Windows(en Linux o Mac, haga doble clic en weka.jar oweka.app). En el menu Visualization en la partesuperior, seleccione BoundaryVisualizer.
The boundary visualizer shows two-dimensionalplots of the data, and is most appropriate fordatasets with two numeric attributes. We will usea version of the iris data without the first twoattributes. To create this from the standard irisdata, start up the Explorer, load iris.arff us-ing the Open file button and remove the firsttwo attributes (‘sepallength’ and ‘sepalwidth’) byselecting them and clicking the Remove buttonthat appears at the bottom. Then save the mod-ified dataset to a file (using Save) called, say,iris.2D.arff.
El visualizador muestra los lımites parcelas de dosdimensiones de los datos, y es mas adecuado paraconjuntos de datos con dos atributos numericos.Vamos a utilizar una version de los datos del iris,sin los dos primeros atributos. Para crear esta par-tir de los datos del iris estandar, la puesta en mar-cha del Explorer, la carga iris.arff usando elboton de Open file y quite los dos primeros atrib-utos (‘sepallength’ y ‘sepalwidth’), seleccionando yhaciendo clic en el boton que Remove aparece enla parte inferior. A continuacion, guarde el con-junto de datos modificados en un archivo (usandoSave) llamado, por ejemplo, iris.2D.arff.
Now leave the Explorer and open this file for vi-sualization using the boundary visualizer’s OpenFile... button. Initially, the plot just shows thedata in the dataset.1
Ahora deja el Explorer y abrir este archivo para lavisualizacion mediante el visualizador de Fronterasboton Open File.... Inicialmente, la trama solomuestra los datos en el conjunto de datos.2
2 Visualizing 1R
Just plotting the data is nothing new. The realpurpose of the boundary visualizer is to show thepredictions of a given model for each location inspace. The points representing the data are colorcoded based on the prediction the model generates.We will use this functionality to investigate the de-cision boundaries that different classifiers generatefor the reduced iris dataset.
Solo graficar los datos no es nada nuevo. El ver-dadero proposito del visualizador lımite es mostrarla predicciones de un modelo determinado paracada lugar en el espacio. Los puntos que represen-tan los datos estan codificados por colores basadosen la prediccion del modelo genera. Vamos a uti-lizar esta funcionalidad para investigar los lımitesde la decision que los clasificadores diferentes paragenerar el conjunto de datos del iris reducida.
1There is a bug in the initial visualization. To get a true plot of the data, select a different attribute for either the x ory axis by clicking the appropriate button.
2No es un error en la visualizacion inicial. Para obtener una verdadera trama de los datos, seleccione un atributodiferente, ya sea para los x o y eje haciendo clic en el boton correspondiente.
1
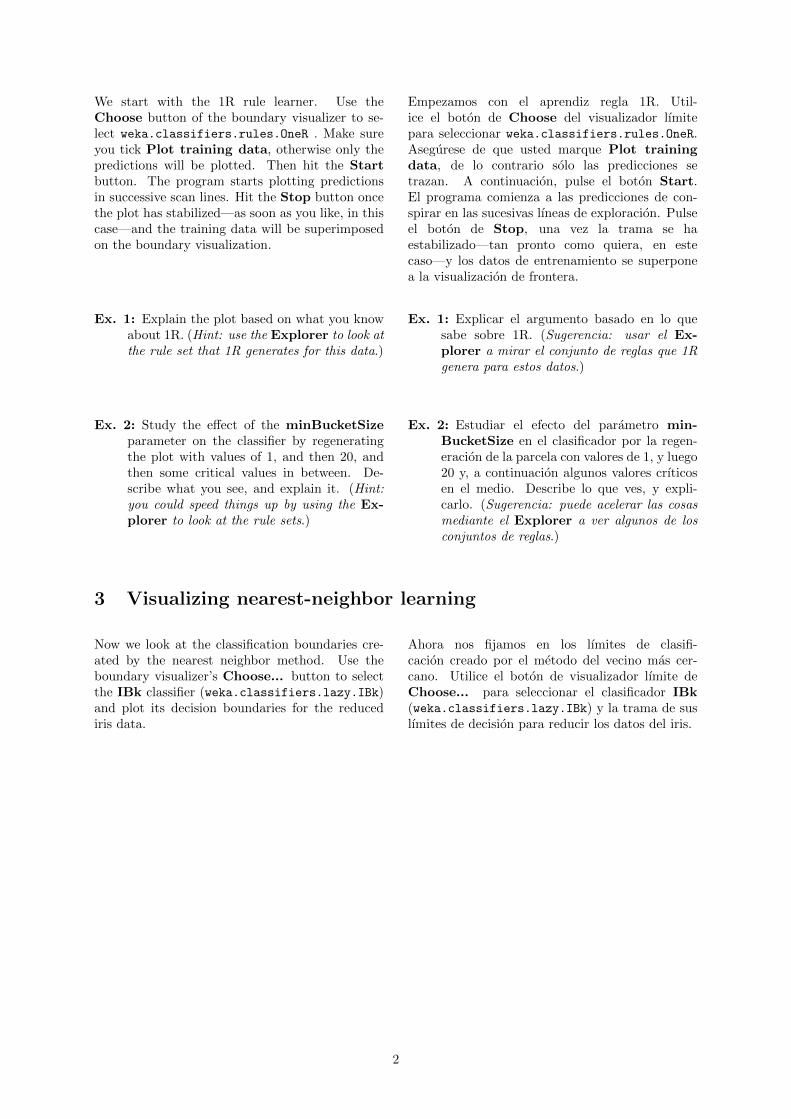
We start with the 1R rule learner. Use theChoose button of the boundary visualizer to se-lect weka.classifiers.rules.OneR . Make sureyou tick Plot training data, otherwise only thepredictions will be plotted. Then hit the Startbutton. The program starts plotting predictionsin successive scan lines. Hit the Stop button oncethe plot has stabilized—as soon as you like, in thiscase—and the training data will be superimposedon the boundary visualization.
Empezamos con el aprendiz regla 1R. Util-ice el boton de Choose del visualizador lımitepara seleccionar weka.classifiers.rules.OneR.Asegurese de que usted marque Plot trainingdata, de lo contrario solo las predicciones setrazan. A continuacion, pulse el boton Start.El programa comienza a las predicciones de con-spirar en las sucesivas lıneas de exploracion. Pulseel boton de Stop, una vez la trama se haestabilizado—tan pronto como quiera, en estecaso—y los datos de entrenamiento se superponea la visualizacion de frontera.
Ex. 1: Explain the plot based on what you knowabout 1R. (Hint: use the Explorer to look atthe rule set that 1R generates for this data.)
Ex. 1: Explicar el argumento basado en lo quesabe sobre 1R. (Sugerencia: usar el Ex-plorer a mirar el conjunto de reglas que 1Rgenera para estos datos.)
Ex. 2: Study the effect of the minBucketSizeparameter on the classifier by regeneratingthe plot with values of 1, and then 20, andthen some critical values in between. De-scribe what you see, and explain it. (Hint:you could speed things up by using the Ex-plorer to look at the rule sets.)
Ex. 2: Estudiar el efecto del parametro min-BucketSize en el clasificador por la regen-eracion de la parcela con valores de 1, y luego20 y, a continuacion algunos valores crıticosen el medio. Describe lo que ves, y expli-carlo. (Sugerencia: puede acelerar las cosasmediante el Explorer a ver algunos de losconjuntos de reglas.)
3 Visualizing nearest-neighbor learning
Now we look at the classification boundaries cre-ated by the nearest neighbor method. Use theboundary visualizer’s Choose... button to selectthe IBk classifier (weka.classifiers.lazy.IBk)and plot its decision boundaries for the reducediris data.
Ahora nos fijamos en los lımites de clasifi-cacion creado por el metodo del vecino mas cer-cano. Utilice el boton de visualizador lımite deChoose... para seleccionar el clasificador IBk(weka.classifiers.lazy.IBk) y la trama de suslımites de decision para reducir los datos del iris.
2
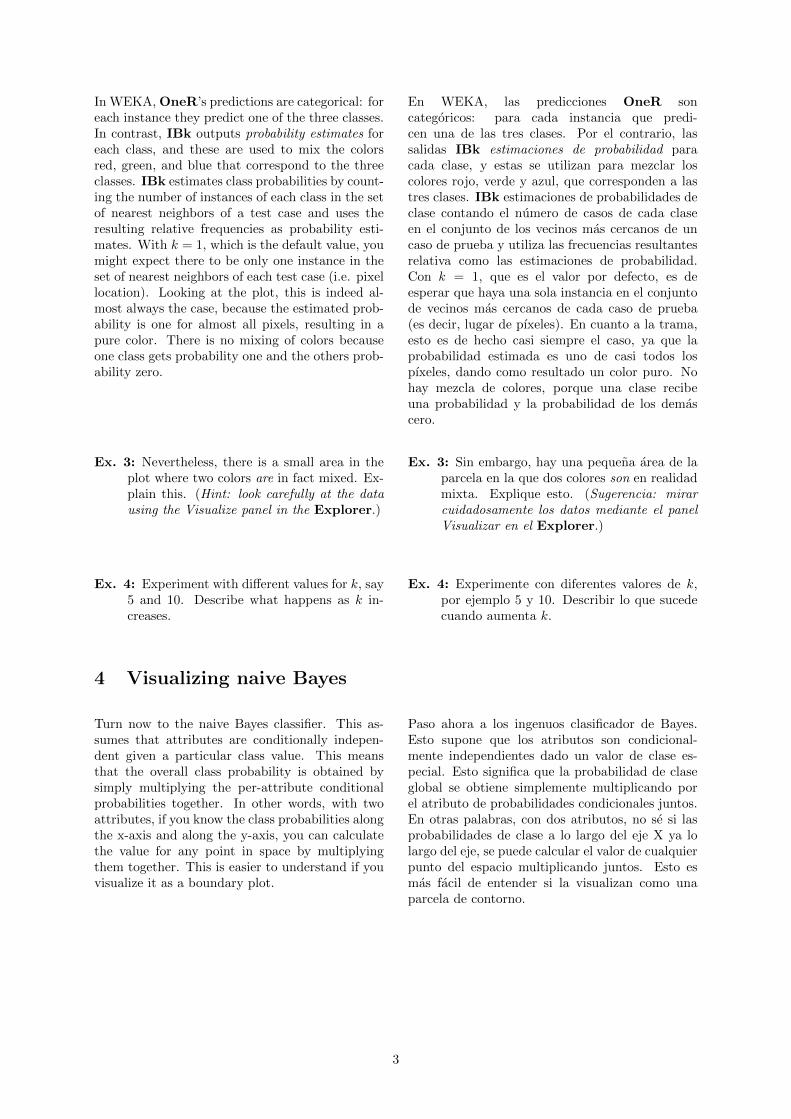
In WEKA, OneR’s predictions are categorical: foreach instance they predict one of the three classes.In contrast, IBk outputs probability estimates foreach class, and these are used to mix the colorsred, green, and blue that correspond to the threeclasses. IBk estimates class probabilities by count-ing the number of instances of each class in the setof nearest neighbors of a test case and uses theresulting relative frequencies as probability esti-mates. With k = 1, which is the default value, youmight expect there to be only one instance in theset of nearest neighbors of each test case (i.e. pixellocation). Looking at the plot, this is indeed al-most always the case, because the estimated prob-ability is one for almost all pixels, resulting in apure color. There is no mixing of colors becauseone class gets probability one and the others prob-ability zero.
En WEKA, las predicciones OneR soncategoricos: para cada instancia que predi-cen una de las tres clases. Por el contrario, lassalidas IBk estimaciones de probabilidad paracada clase, y estas se utilizan para mezclar loscolores rojo, verde y azul, que corresponden a lastres clases. IBk estimaciones de probabilidades declase contando el numero de casos de cada claseen el conjunto de los vecinos mas cercanos de uncaso de prueba y utiliza las frecuencias resultantesrelativa como las estimaciones de probabilidad.Con k = 1, que es el valor por defecto, es deesperar que haya una sola instancia en el conjuntode vecinos mas cercanos de cada caso de prueba(es decir, lugar de pıxeles). En cuanto a la trama,esto es de hecho casi siempre el caso, ya que laprobabilidad estimada es uno de casi todos lospıxeles, dando como resultado un color puro. Nohay mezcla de colores, porque una clase recibeuna probabilidad y la probabilidad de los demascero.
Ex. 3: Nevertheless, there is a small area in theplot where two colors are in fact mixed. Ex-plain this. (Hint: look carefully at the datausing the Visualize panel in the Explorer.)
Ex. 3: Sin embargo, hay una pequena area de laparcela en la que dos colores son en realidadmixta. Explique esto. (Sugerencia: mirarcuidadosamente los datos mediante el panelVisualizar en el Explorer.)
Ex. 4: Experiment with different values for k, say5 and 10. Describe what happens as k in-creases.
Ex. 4: Experimente con diferentes valores de k,por ejemplo 5 y 10. Describir lo que sucedecuando aumenta k.
4 Visualizing naive Bayes
Turn now to the naive Bayes classifier. This as-sumes that attributes are conditionally indepen-dent given a particular class value. This meansthat the overall class probability is obtained bysimply multiplying the per-attribute conditionalprobabilities together. In other words, with twoattributes, if you know the class probabilities alongthe x-axis and along the y-axis, you can calculatethe value for any point in space by multiplyingthem together. This is easier to understand if youvisualize it as a boundary plot.
Paso ahora a los ingenuos clasificador de Bayes.Esto supone que los atributos son condicional-mente independientes dado un valor de clase es-pecial. Esto significa que la probabilidad de claseglobal se obtiene simplemente multiplicando porel atributo de probabilidades condicionales juntos.En otras palabras, con dos atributos, no se si lasprobabilidades de clase a lo largo del eje X ya lolargo del eje, se puede calcular el valor de cualquierpunto del espacio multiplicando juntos. Esto esmas facil de entender si la visualizan como unaparcela de contorno.
3
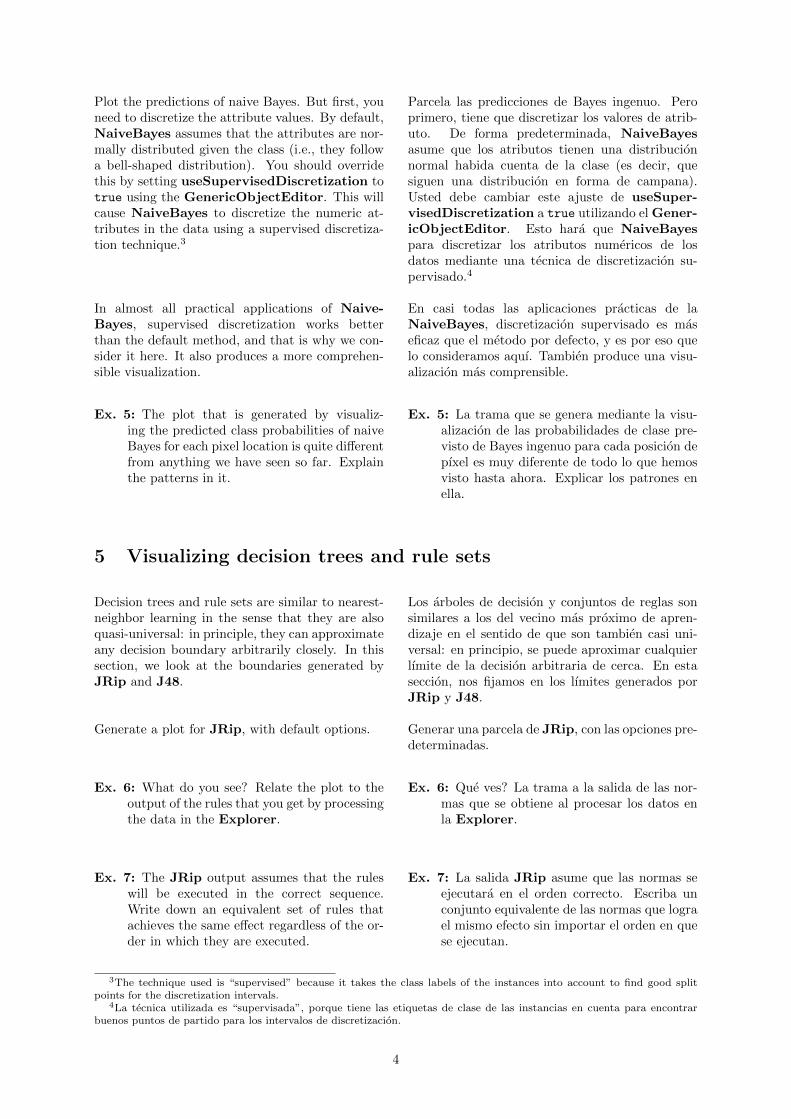
Plot the predictions of naive Bayes. But first, youneed to discretize the attribute values. By default,NaiveBayes assumes that the attributes are nor-mally distributed given the class (i.e., they followa bell-shaped distribution). You should overridethis by setting useSupervisedDiscretization totrue using the GenericObjectEditor. This willcause NaiveBayes to discretize the numeric at-tributes in the data using a supervised discretiza-tion technique.3
Parcela las predicciones de Bayes ingenuo. Peroprimero, tiene que discretizar los valores de atrib-uto. De forma predeterminada, NaiveBayesasume que los atributos tienen una distribucionnormal habida cuenta de la clase (es decir, quesiguen una distribucion en forma de campana).Usted debe cambiar este ajuste de useSuper-visedDiscretization a true utilizando el Gener-icObjectEditor. Esto hara que NaiveBayespara discretizar los atributos numericos de losdatos mediante una tecnica de discretizacion su-pervisado.4
In almost all practical applications of Naive-Bayes, supervised discretization works betterthan the default method, and that is why we con-sider it here. It also produces a more comprehen-sible visualization.
En casi todas las aplicaciones practicas de laNaiveBayes, discretizacion supervisado es maseficaz que el metodo por defecto, y es por eso quelo consideramos aquı. Tambien produce una visu-alizacion mas comprensible.
Ex. 5: The plot that is generated by visualiz-ing the predicted class probabilities of naiveBayes for each pixel location is quite differentfrom anything we have seen so far. Explainthe patterns in it.
Ex. 5: La trama que se genera mediante la visu-alizacion de las probabilidades de clase pre-visto de Bayes ingenuo para cada posicion depıxel es muy diferente de todo lo que hemosvisto hasta ahora. Explicar los patrones enella.
5 Visualizing decision trees and rule sets
Decision trees and rule sets are similar to nearest-neighbor learning in the sense that they are alsoquasi-universal: in principle, they can approximateany decision boundary arbitrarily closely. In thissection, we look at the boundaries generated byJRip and J48.
Los arboles de decision y conjuntos de reglas sonsimilares a los del vecino mas proximo de apren-dizaje en el sentido de que son tambien casi uni-versal: en principio, se puede aproximar cualquierlımite de la decision arbitraria de cerca. En estaseccion, nos fijamos en los lımites generados porJRip y J48.
Generate a plot for JRip, with default options. Generar una parcela de JRip, con las opciones pre-determinadas.
Ex. 6: What do you see? Relate the plot to theoutput of the rules that you get by processingthe data in the Explorer.
Ex. 6: Que ves? La trama a la salida de las nor-mas que se obtiene al procesar los datos enla Explorer.
Ex. 7: The JRip output assumes that the ruleswill be executed in the correct sequence.Write down an equivalent set of rules thatachieves the same effect regardless of the or-der in which they are executed.
Ex. 7: La salida JRip asume que las normas seejecutara en el orden correcto. Escriba unconjunto equivalente de las normas que lograel mismo efecto sin importar el orden en quese ejecutan.
3The technique used is “supervised” because it takes the class labels of the instances into account to find good splitpoints for the discretization intervals.
4La tecnica utilizada es “supervisada”, porque tiene las etiquetas de clase de las instancias en cuenta para encontrarbuenos puntos de partido para los intervalos de discretizacion.
4
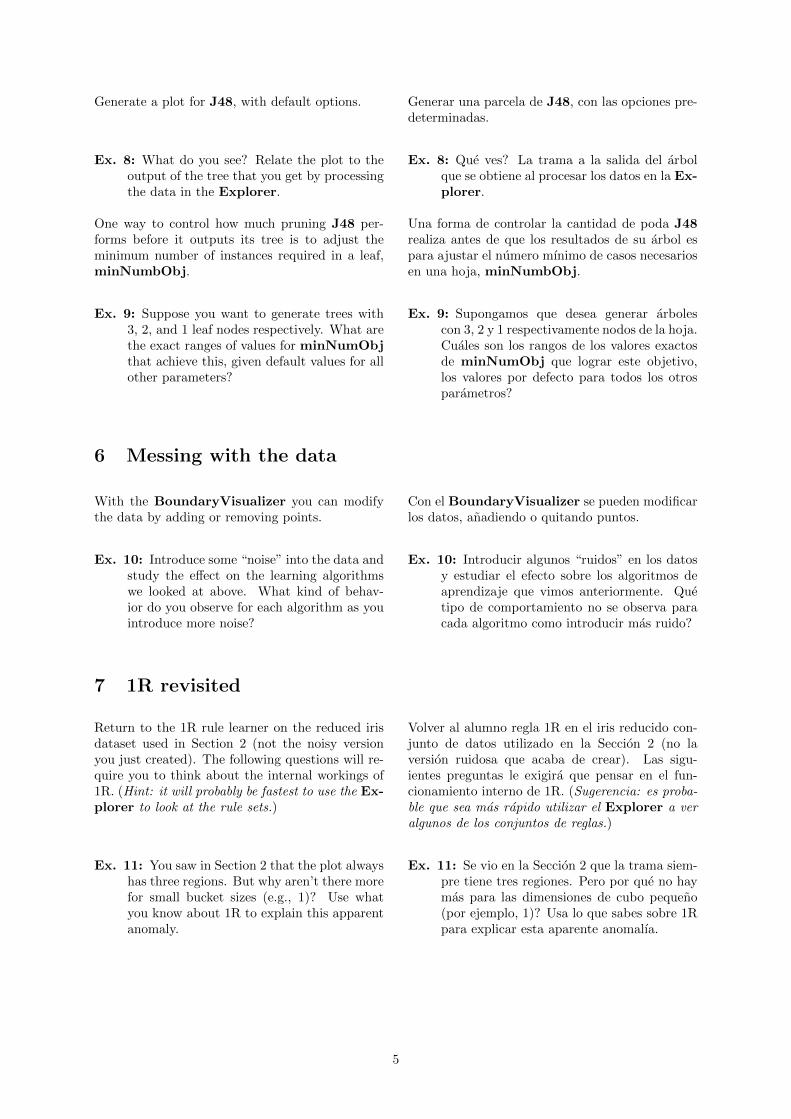
Generate a plot for J48, with default options. Generar una parcela de J48, con las opciones pre-determinadas.
Ex. 8: What do you see? Relate the plot to theoutput of the tree that you get by processingthe data in the Explorer.
Ex. 8: Que ves? La trama a la salida del arbolque se obtiene al procesar los datos en la Ex-plorer.
One way to control how much pruning J48 per-forms before it outputs its tree is to adjust theminimum number of instances required in a leaf,minNumbObj.
Una forma de controlar la cantidad de poda J48realiza antes de que los resultados de su arbol espara ajustar el numero mınimo de casos necesariosen una hoja, minNumbObj.
Ex. 9: Suppose you want to generate trees with3, 2, and 1 leaf nodes respectively. What arethe exact ranges of values for minNumObjthat achieve this, given default values for allother parameters?
Ex. 9: Supongamos que desea generar arbolescon 3, 2 y 1 respectivamente nodos de la hoja.Cuales son los rangos de los valores exactosde minNumObj que lograr este objetivo,los valores por defecto para todos los otrosparametros?
6 Messing with the data
With the BoundaryVisualizer you can modifythe data by adding or removing points.
Con el BoundaryVisualizer se pueden modificarlos datos, anadiendo o quitando puntos.
Ex. 10: Introduce some “noise” into the data andstudy the effect on the learning algorithmswe looked at above. What kind of behav-ior do you observe for each algorithm as youintroduce more noise?
Ex. 10: Introducir algunos “ruidos” en los datosy estudiar el efecto sobre los algoritmos deaprendizaje que vimos anteriormente. Quetipo de comportamiento no se observa paracada algoritmo como introducir mas ruido?
7 1R revisited
Return to the 1R rule learner on the reduced irisdataset used in Section 2 (not the noisy versionyou just created). The following questions will re-quire you to think about the internal workings of1R. (Hint: it will probably be fastest to use the Ex-plorer to look at the rule sets.)
Volver al alumno regla 1R en el iris reducido con-junto de datos utilizado en la Seccion 2 (no laversion ruidosa que acaba de crear). Las sigu-ientes preguntas le exigira que pensar en el fun-cionamiento interno de 1R. (Sugerencia: es proba-ble que sea mas rapido utilizar el Explorer a veralgunos de los conjuntos de reglas.)
Ex. 11: You saw in Section 2 that the plot alwayshas three regions. But why aren’t there morefor small bucket sizes (e.g., 1)? Use whatyou know about 1R to explain this apparentanomaly.
Ex. 11: Se vio en la Seccion 2 que la trama siem-pre tiene tres regiones. Pero por que no haymas para las dimensiones de cubo pequeno(por ejemplo, 1)? Usa lo que sabes sobre 1Rpara explicar esta aparente anomalıa.
5

Ex. 12: Can you set minBucketSize to a valuethat results in less than three regions? Whatis the smallest possible number of regions?What is the smallest value for minBucket-Size that gives you this number of regions?Explain the result based on what you knowabout the iris data.
Ex. 12: Se puede configurar minBucketSize aun valor que los resultados en menos de tresregiones? Cual es el menor numero posiblede regiones? Cual es el valor mas pequenode minBucketSize que le da este numerode regiones? Explicar el resultado sobre labase de lo que sabe acerca de los datos deliris.
6

Practical Data Mining
Tutorial 4: Preprocessing and Parameter Tuning
Eibe Frank and Ian H. Witten
May 5, 2011
c©2008-2012 University of Waikato
1 Introduction
Data preprocessing is often necessary to get dataready for learning. It may also improve the out-come of the learning process and lead to more ac-curate and concise models. The same is true forparameter tuning methods. In this tutorial wewill look at some useful preprocessing techniques,which are implemented as WEKA filters, as wellas a method for automatic parameter tuning.
Preprocesamiento de datos es a menudo necesariopara obtener los datos listos para el aprendizaje.Tambien puede mejorar el resultado del proceso deaprendizaje y dar lugar a modelos mas precisos yconcisos. Lo mismo es cierto para los metodos deajuste de parametros. En este tutorial vamos aver algunas de las tecnicas de preprocesamientoutil, que se aplican como filtros de WEKA, asıcomo un metodo para el ajuste automatico de losparametros.
2 Discretization
Numeric attributes can be converted into discreteones by splitting their ranges into numeric inter-vals, a process known as discretization. There aretwo types of discretization techniques: unsuper-vised ones, which are “class blind.,” and supervisedone, which take the class value of the instances intoaccount when creating intervals. The aim with su-pervised techniques is to create intervals that areas consistent as possible with respect to the classlabels.
los atributos numericos se pueden convertir en losdiscretos mediante el fraccionamiento de sus areasde distribucion en intervalos numericos, un pro-ceso conocido como discretizacion. Hay dos tiposde tecnicas de discretizacion: sin supervision losque son “de clase ciego,” y una supervision, quetienen el valor de clase de las instancias en cuentaal crear intervalos. El objetivo con las tecnicas desupervision es la creacion de intervalos que seantan coherentes como sea posible con respecto a lasetiquetas de clase.
The main unsupervised technique for dis-cretizing numeric attributes in WEKA isweka.filters.unsupervised.attribute.
Discretize. It implements two straightforwardmethods: equal-width and equal-frequency dis-cretization. The first simply splits the numericrange into equal intervals. The second choosesthe width of the intervals so that they contain(approximately) the same number of instances.The default is to use equal width.
El principal tecnica unsupervisada para dis-cretizar los atributos numericos en WEKAes weka.filters.unsupervised.attribute.
Discretize. Se implementa dos metodos sencil-los: la igualdad de ancho y discretizacion de igualfrecuencia. El primero, simplemente se divide elrango numerico en intervalos iguales. El segundoopta por la amplitud de los intervalos para que losmismos contienen (aproximadamente) el mismonumero de casos. El valor por defecto es usar lamisma anchura.
Find the glass dataset glass.arff and load itinto the Explorer. Apply the unsupervised dis-cretization filter in the two different modes dis-cussed above.
Encontrar el conjunto de datos de cristalglass.arff y cargarlo en la Explorer. Aplicarel filtro de discretizacion sin supervision en las dosmodalidades anteriormente expuestas.
Ex. 1: What do you observe when you comparethe histograms obtained? Why is the one forequal-frequency discretization quite skewedfor some attributes?
Ex. 1: Que observa al comparar los histogramasobtenidos? Por que es la discretizacion dela igualdad de frecuencia muy sesgada de al-gunos atributos?
1

The main supervised technique for dis-cretizing numeric attributes in WEKAis weka.filters.supervised.attribute.
Discretize. Locate the iris data, load it in,apply the supervised discretization scheme, andlook at the histograms obtained. Superviseddiscretization attempts to create intervals suchthat the class distributions differ between intervalsbut are consistent within intervals.
El principal supervisado tecnica para dis-cretizar los atributos numericos en WEKAes weka.filters.supervised.attribute.
Discretize. Busque los datos del iris, secarga en, aplicar el esquema de discretizacionsupervisado, y ver los histogramas obtenidos. En-cuadramiento intentos de discretizacion para crearintervalos de tal manera que las distribucionesdifieren entre los intervalos de clase, pero soncoherentes dentro de los intervalos.
Ex. 2: Based on the histograms obtained, whichof the discretized attributes would you con-sider the most predictive ones?
Ex. 2: Con base en los histogramas obtenidos,que de los atributos discretizados se tiene encuenta los mas predictivo?
Reload the glass data and apply supervised dis-cretization to it.
Actualizar los datos de vidrio y aplicar dis-cretizacion supervisada a la misma.
Ex. 3: There is only a single bar in the histogramsfor some of the attributes. What does thatmean?
Ex. 3: Solo hay una sola barra en los histogramasde algunos de los atributos. Que significaeso?
Discretized attributes are normally coded as nomi-nal attributes, with one value per range. However,because the ranges are ordered, a discretized at-tribute is actually on an ordinal scale. Both filtersalso have the ability to create binary attributesrather than multi-valued ones, by setting the op-tion makeBinary to true.
Atributos discretizado normalmente codificadoscomo atributos nominales, con un valor por rango.Sin embargo, debido a los rangos estan ordenados,un atributo discretizado es en realidad en una es-cala ordinal. Ambos filtros tambien tienen la ca-pacidad de crear los atributos binarios en lugar delos multiples valores, mediante el establecimientode la makeBinary opcion de verdad.
Ex. 4: Choose one of the filters and apply itto create binary attributes. Compare tothe output generated when makeBinary isfalse. What do the binary attributes repre-sent?
Ex. 4: Elegir un de los filtros y aplicarlo paracrear atributos binarios. Compare con elresultado generado cuando makeBinary esfalsa. Que significan los atributos binariosrepresentan?
3 More on Discretization
Here we examine the effect of discretization whenbuilding a J48 decision tree for the data inionosphere.arff. This dataset contains informa-tion about radar signals returned from the iono-sphere. “Good” samples are those showing evi-dence of some type of structure in the ionosphere,while for “bad” ones the signals pass directlythrough the ionosphere. For more details, take alook the comments in the ARFF file. Begin withunsupervised discretization.
Aquı se examina el efecto de la discretizacion enla construccion de un arbol de decision J48 paralos datos de ionosphere.arff. Este conjunto dedatos contiene informacion acerca de las senalesde radar de regresar de la ionosfera. “Bueno” sonlas muestras que presenten indicios de algun tipode estructura de la ionosfera, mientras que para los“malos” las senales pasan directamente a traves dela ionosfera. Para obtener mas informacion, visitalos comentarios en el archivo ARFF. Comience condiscretizacion sin supervision.
2
Ex. 5: Compare the cross-validated accuracy ofJ48 and the size of the trees generated for(a) the raw data, (b) data discretized by theunsupervised discretization method in de-fault mode, (c) data discretized by the samemethod with binary attributes.
Ex. 5: Comparacion de la precision validacioncruzada de J48 y el tamano de los arbolesgenerados por (a) los datos en bruto, (b)los datos discretizados por el metodo de dis-cretizacion sin supervision en el modo por de-fecto, (c) los datos discretizados por el mismometodo con atributos binarios.
Now turn to supervised discretization. Here a sub-tle issue arises. If we simply repeated the previousexercise using a supervised discretization method,the result would be over-optimistic. In effect, sincecross-validation is used for evaluation, the data inthe test set has been taken into account when deter-mining the discretization intervals. This does notgive a fair estimate of performance on fresh data.
Ahora pasa a la discretizacion supervisado. Aquısurge una cuestion sutil. Si nos limitamos a repe-tir el ejercicio anterior utilizando un metodo dediscretizacion supervisado, el resultado serıa de-masiado optimista. En efecto, ya que la validacioncruzada se utiliza para la evaluacion, los datos enel conjunto de pruebas se ha tenido en cuenta paradeterminar los intervalos de discretizacion. Estono da una estimacion razonable de rendimiento ennuevos datos.
To evaluate supervised discretization in a fair fash-ion, we use the FilteredClassifier from WEKA’smeta-classifiers. This builds the filter model fromthe training data only, before evaluating it on thetest data using the discretization intervals com-puted for the training data. After all, that is howyou would have to process fresh data in practice.
Para evaluar discretizacion supervisado de man-era justa, se utiliza el FilteredClassifier de metade WEKA-clasificadores. Esto se basa el modelode filtro de los datos de entrenamiento solamente,antes de evaluar que en los datos de prueba medi-ante los intervalos de discretizacion calculados paralos datos de entrenamiento. Despues de todo, quees como se tendrıa que procesar los datos frescosen la practica.
Ex. 6: Compare the cross-validated accuracy andthe size of the trees generated using the Fil-teredClassifier and J48 for (d) superviseddiscretization in default mode, (e) superviseddiscretization with binary attributes.
Ex. 6: Comparacion de la precision validacioncruzada y el tamano de los arboles genera-dos con el FilteredClassifier y J48 para (d)discretizacion supervisado en su modo nor-mal, (e) discretizacion de supervision de losatributos binarios.
Ex. 7: Compare these with the results for the rawdata ((a) above). Can you think of a rea-son of why decision trees generated from dis-cretized data can potentially be more accu-rate predictors than those built from raw nu-meric data?
Ex. 7: Compare estos datos con los resultados delos datos en bruto ((a) anterior). Puedespensar en una razon de por que los arboles dedecision generados a partir de datos discretospueden ser potencialmente predictores masfiables que las construye a partir de datosnumericos en bruto?
3
4 Automatic Attribute Selection
In most practical applications of supervised learn-ing not all attributes are equally useful for predict-ing the target. Depending on the learning schemeemployed, redundant and/or irrelevant attributescan result in less accurate models being generated.The task of manually identifying useful attributesin a dataset can be tedious, as you have seen in thesecond tutorial—but there are automatic attributeselection methods that can be applied.
En la mayorıa de las aplicaciones practicas deaprendizaje supervisado, no todos los atributos sonigualmente utiles para predecir el destino. De-pendiendo de la actividad de aprendizaje emplea-dos, redundantes y/o atributos irrelevantes puedendar lugar a modelos menos precisos generando.La tarea de identificar manualmente los atributosutiles en un conjunto de datos puede ser tedioso, yaque hemos visto en el segundo tutorial—pero haymetodos automaticos de seleccion de atributos quese pueden aplicar.
They can be broadly divided into those that rankindividual attributes (e.g., based on their informa-tion gain) and those that search for a good subsetof attributes by considering the combined effectof the attributes in the subset. The latter meth-ods can be further divided into so-called filter andwrapper methods. Filter methods apply a compu-tationally efficient heuristic to measure the qualityof a subset of attributes. Wrapper methods mea-sure the quality of an attribute subset by buildingand evaluating an actual classification model fromit, usually based on cross-validation. This is moreexpensive, but often delivers superior performance.
Pueden dividirse en aquellos que se clasifican losatributos individuales (por ejemplo, sobre la basede su ganancia de informacion) y los de busquedaque para un subconjunto de los atributos de buenaconsiderando el efecto combinado de los atributosen el subconjunto. Estos metodos se pueden di-vidir en los llamados filtro y contenedor metodos.metodos de aplicar un filtro eficiente computa-cionalmente heurıstica para medir la calidad de unsubconjunto de los atributos. metodos Wrappermedir la calidad de un subconjunto de atributosmediante la construccion y evaluacion de un mod-elo de clasificacion real de ella, generalmente sebasa en la validacion cruzada. Esto es mas caro,pero a menudo ofrece un rendimiento superior.
In the WEKA Explorer, you can use the Se-lect attributes panel to apply an attribute se-lection method on a dataset. The default is Cf-sSubsetEval. However, if we want to rank in-dividual attributes, we need to use an attributeevaluator rather than a subset evaluator, e.g., theInfoGainAttributeEval. Attribute evaluatorsneed to be applied with a special “search” method,namely the Ranker.
En el Explorer WEKA, puede utilizar el panelde Select attributes de aplicar un metodo deseleccion de atributos en un conjunto de datos.El valor predeterminado es CfsSubsetEval. Sinembargo, si queremos clasificar los atributos in-dividuales, tenemos que recurrir a un evaluadorde atributos en vez de un subgrupo evaluador,por ejemplo, la InfoGainAttributeEval. evalu-adores de atributos deben ser aplicados con un es-pecial de “busqueda” metodo, a saber, la Ranker.
Ex. 8: Apply this technique to the labour nego-tiations data in labor.arff. What are thefour most important attributes based on in-formation gain?1
Ex. 8: Aplicar esta tecnica para las negociacioneslaborales de datos en labor.arff. Cualesson los cuatro atributos mas importantesbasadas en el aumento de la informacion?2
1Note that most attribute evaluators, including InfoGainAttributeEval, discretize numeric attributes using WEKA’ssupervised discretization method before they are evaluated. This is also the case for CfsSubsetEval.
2Nota que la mayorıa de los evaluadores de atributos, incluyendo InfoGainAttributeEval, discretizar los atributosnumericos mediante el metodo de discretizacion supervisado WEKA antes de que se evaluan. Este es tambien el caso deCfsSubsetEval.
4

WEKA’s default attribute selection method, Cfs-SubsetEval, uses a heuristic attribute subset eval-uator in a filter search method. It aims to iden-tify a subset of attributes that are highly corre-lated with the target while not being strongly cor-related with each other. By default, it searchesthrough the space of possible attribute subsetsfor the “best” one using the BestFirst searchmethod.3 You can choose others, like a geneticalgorithm or even an exhaustive search. In fact,choosing GreedyStepwise and setting search-Backwards to true gives “backwards selection,”the search method you used manually in the sec-ond tutorial.
WEKA atributo por defecto el metodo de se-leccion, CfsSubsetEval, utiliza un subconjuntode atributos evaluador heurıstica en un metodo defiltro de busqueda. Su objetivo es identificar unsubconjunto de los atributos que estan muy cor-relacionados con el objetivo sin ser fuertementecorrelacionados entre sı. De forma predetermi-nada, se busca a traves del espacio de subcon-juntos de atributos posibles para el “mejor” conel metodo de busqueda BestFirst.4 Usted puedeelegir otros, como un algoritmo genetico o inclusouna exhaustiva busqueda. De hecho, la eleccionde GreedyStepwise searchBackwards y el es-tablecimiento de verdad da “al reves de seleccion,”el metodo de busqueda que usa manualmente en elsegundo tutorial.
To use the wrapper method rather than a filtermethod like CfsSubsetEval, you need to selectWrapperSubsetEval. You can configure this bychoosing a learning algorithm to apply. You canalso set the number of folds for the cross-validationthat is used to evaluate the model on each subsetof attributes.
Para utilizar el metodo de envoltura en vez de unmetodo de filtro como CfsSubsetEval, es nece-sario seleccionar WrapperSubsetEval. Puedeconfigurar esta eligiendo un algoritmo de apren-dizaje de aplicar. Tambien puede establecer elnumero de pliegues para la validacion cruzada quese utiliza para evaluar el modelo en cada subcon-junto de atributos.
Ex. 9: On the same data, run CfsSubsetEvalfor correlation-based selection, using Best-First search. Then run the wrapper methodwith J48 as the base learner, again usingBestFirst search. Examine the attributesubsets that are output. Which attributesare selected by both methods? How do theyrelate to the output generated by ranking us-ing information gain?
Ex. 9: En los mismos datos, CfsSubsetEval cor-rer para la seleccion basada en la correlacion,mediante la busqueda de BestFirst. A con-tinuacion, ejecute el metodo de envoltura conJ48 como el aprendiz de base, utilizando denuevo la busqueda BestFirst. Examinarlos subconjuntos de atributos que se emiten.Que atributos son seleccionados por ambosmetodos? Como se relacionan con el resul-tado generado por el aumento de clasificacionde informacion utiliza?
5 More on Automatic Attribute Selection
The Select attribute panel allows us to gain in-sight into a dataset by applying attribute selectionmethods to a dataset. However, using this infor-mation to reduce a dataset becomes problematicif we use some of the reduced data for testing themodel (as in cross-validation).
El panel de Select attribute nos permite profun-dizar en un conjunto de datos mediante la apli-cacion de metodos de seleccion de atributos de unconjunto de datos. Sin embargo, utilizar esta in-formacion para reducir un conjunto de datos seconvierte en un problema si utilizamos algunos delos datos reducidos para probar el modelo (comoen la validacion cruzada).
3This is a standard search method from AI.4Este es un metodo de busqueda estandar de la influenza aviar.
5
The reason is that, as with supervised discretiza-tion, we have actually looked at the class labels inthe test data while selecting attributes—the “best”attributes were chosen by peeking at the test data.As we already know (see Tutorial 2), using the testdata to influence the construction of a model bi-ases the accuracy estimates obtained: measuredaccuracy is likely to be greater than what will beobtained when the model is deployed on fresh data.To avoid this, we can manually divide the data intotraining and test sets and apply the attribute se-lection panel to the training set only.
La razon es que, al igual que con discretizacion su-pervisado, que se han mirado en las etiquetas declase en los datos de prueba, mientras que la se-leccion de los atributos—la “mejor” los atributosfueron elegidos por espiar a los datos de prueba.Como ya sabemos (ver Tutorial 2), utilizando losdatos de prueba para influir en la construccion deun modelo de los sesgos de la exactitud estima-ciones obtenidas: La precision de medida es prob-able que sea mayor de lo que se obtiene cuando elmodelo se implementa en nuevos datos. Para evi-tar esto, se puede dividir manualmente los datos enconjuntos de entrenamiento y de prueba y aplicarel comite de seleccion de atributos al conjunto deentrenamiento solamente.
A more convenient method is to use theAttributeSelectedClassifer, one of WEKA’smeta-classifiers. This allows us to specify an at-tribute selection method and a learning algorithmas part of a classification scheme. The Attribute-SelectedClassifier ensures that the chosen set ofattributes is selected based on the training dataonly, in order to give unbiased accuracy estimates.
Un metodo mas conveniente es utilizar elAttributeSelectedClassifer, uno de los meta-clasificadores de WEKA. Esto nos permite especi-ficar un metodo de seleccion de atributos y un al-goritmo de aprendizaje como parte de un esquemade clasificacion. El AttributeSelectedClassifierasegura que el conjunto seleccionado de atribu-tos se selecciona basandose en los datos de entre-namiento solamente, a fin de dar estimaciones ins-esgadas precision.
Now we test the various attribute selection meth-ods tested above in conjunction with NaiveBayes.Naive Bayes assumes (conditional) independenceof attributes, so it can be affected if attributesare redundant, and attribute selection can be veryhelpful.
Ahora ponemos a prueba los metodos de se-leccion de atributos diferentes probado anterior-mente en relacion con NaiveBayes. Bayesianoasume (condicional) la independencia de los atrib-utos, por lo que puede verse afectado si los atrib-utos son redundantes, y la seleccion de atributospuede ser muy util.
You can see the effect of redundantattributes on naive Bayes by addingcopies of an existing attribute to adataset using the unsupervised filter classweka.filters.unsupervised.attribute.Copy
in the Preprocess panel. Each copy is obviouslyperfectly correlated with the original.
Usted puede ver el efecto de los atributos redun-dantes en Bayes ingenuo mediante la adicion decopias de un atributo existente a un conjunto dedatos utilizando la clase de filtro sin supervisionweka.filters.unsupervised.attribute.Copy
en el panel de Preprocess. Cada copia es,obviamente, una correlacion perfecta con eloriginal.
Ex. 10: Load the diabetes classification data indiabetes.arff and start adding copies ofthe first attribute in the data, measuring theperformance of naive Bayes (with useSu-pervisedDiscretization turned on) usingcross-validation after you have added eachcopy. What do you observe?
Ex. 10: carga los datos de clasificacion de la dia-betes diabetes.arff y comenzar a agregarcopias de la primera cualidad de los datos,medir el rendimiento de Bayes naive (conuseSupervisedDiscretization encendido)con validacion cruzada despues de haberagregado cada copia. Que observa?
Let us now check whether the three attribute se-lection methods from above, used in conjunctionwith AttributeSelectedClassifier and Naive-Bayes, successfully eliminate the redundant at-tributes. The methods are:
Vamos ahora a comprobar si los tres metodosde seleccion de atributos de arriba, se uti-liza junto con AttributeSelectedClassifier yNaiveBayes, con exito eliminar los atributos re-dundantes. Los metodos son:
6
• InfoGainAttributeEval with Ranker (8attributes)
• InfoGainAttributeEval con Ranker (8atributos)
• CfsSubsetEval with BestFirst • CfsSubsetEval con BestFirst
• WrapperSubsetEval with NaiveBayesand BestFirst.
• WrapperSubsetEval con NaiveBayes yBestFirst.
Run each method from within AttributeSelect-edClassifier to see the effect on cross-validatedaccuracy and check the attribute subset selectedby each method. Note that you need to specify thenumber of ranked attributes to use for the Rankermethod. Set this to eight, because the original dia-betes data contains eight attributes (excluding theclass). Note also that you should specify Naive-Bayes as the classifier to be used inside the wrap-per method, because this is the classifier that wewant to select a subset for.
Ejecutar cada metodo dentro de AttributeSe-lectedClassifier para ver el efecto en la cruz-validado la exactitud y verificar el subconjunto deatributos seleccionados por cada metodo. Tengaen cuenta que es necesario especificar el numerode atributos clasifico a utilizar para el metodo deRanker. Ponga esto a ocho, porque los datos dela diabetes original contiene ocho atributos (conexclusion de la clase). Tenga en cuenta tambienque debe especificar NaiveBayes como el clasifi-cador para ser utilizado en el metodo de envoltura,porque este es el clasificador que desea seleccionarun subconjunto de.
Ex. 11: What can you say regarding the perfor-mance of the three attribute selection meth-ods? Do they succeed in eliminating redun-dant copies? If not, why not?
Ex. 11: Que puede decir respecto al rendimientode los tres metodos de seleccion de atribu-tos? No tienen exito en la eliminacion de lascopias redundantes? Si no, por que no?
6 Automatic parameter tuning
Many learning algorithms have parameters thatcan affect the outcome of learning. For example,the decision tree learner C4.5 (J48 in WEKA) hastwo parameters that influence the amount of prun-ing that it does (we saw one, the minimum numberof instances required in a leaf, in the last tutorial).The k-nearest-neighbor classifier IBk has one thatsets the neighborhood size. But manually tweakingparameter settings is tedious, just like manuallyselecting attributes, and presents the same prob-lem: the test data must not be used when selectingparameters—otherwise the performance estimateswill be biased.
Muchos algoritmos de aprendizaje tienenparametros que pueden afectar los resultadosdel aprendizaje. Por ejemplo, el arbol de de-cision C4.5 alumno (J48 en WEKA) tiene dosparametros que influyen en la cantidad de lapoda que hace (hemos visto a uno, el numeromınimo de casos necesarios en una hoja, en elultimo tutorial). El k -clasificador del vecino masproximo IBk tiene uno que establece el tamano dela vecindad. Pero manualmente modificando losajustes de parametros es tedioso, al igual que losatributos seleccionar manualmente, y presenta elmismo problema: los datos de prueba no debe serutilizado cuando los parametros de seleccion—locontrario las estimaciones de rendimiento se haracon preferencia.
7
WEKA has a “meta” classifier,CVParameterSelection, that automaticallysearches for the “best” parameter settings byoptimizing cross-validated accuracy on the train-ing data. By default, each setting is evaluatedusing 10-fold cross-validation. The parameters tooptimize re specified using the CVParametersfield in the GenericObjectEditor. For eachone, we need to give (a) a string that names itusing its letter code, (b) a numeric range of valuesto evaluate, and (c) the number of steps to try inthis range (Note that the parameter is assumedto be numeric.) Click on the More button inthe GenericObjectEditor for more information,and an example.
WEKA tiene una “meta” clasificador,CVParameterSelection, que busca au-tomaticamente los “mejores” valores de losparametros mediante la optimizacion de cruz-validado la exactitud de los datos de entre-namiento. De forma predeterminada, cadaajuste se evaluo utilizando 10 veces la validacioncruzada. Los parametros para volver a optimizarel uso especificado en el campo CVParametersGenericObjectEditor. Para cada uno de ellos,tenemos que dar (a) una cadena que le asigna elnombre utilizando su codigo de letras, (b) unaserie de valores numericos para evaluar, y (c) elnumero de medidas para tratar en este rango de(Tenga en cuenta que el parametro se supone quees numerico.) Haga clic en el boton de Moreen la GenericObjectEditor para obtener masinformacion, y un ejemplo.
For the diabetes data used in the previous section,use CVParameterSelection in conjunction withIBk to select the “best” value for the neighbor-hood size, ranging from 1 to 10 in ten steps. Theletter code for the neighborhood size is K. Thecross-validated accuracy of the parameter-tunedversion of IBk is directly comparable with its accu-racy using default settings, because tuning is per-formed by applying inner cross-validation runs tofind the best parameter setting for each trainingset occuring in the outer cross-validation—and thelatter yields the final performance estimate.
Para los datos de la diabetes utilizados en laseccion anterior, el uso CVParameterSelectionIBk en conjunto con el fin de seleccionar la“mejor” valor para el tamano de la vecindad, quevan desde 1 a 10 en diez pasos. El codigo de le-tras para el tamano de esta zona: K. La precisionde validacion cruzada de la version parametro afi-nado de IBk es directamente comparable con laprecision con la configuracion predeterminada, yaque ajuste se realiza mediante la aplicacion de in-terior validacion cruzada se ejecuta para encontrarel mejor ajuste de parametros para cada conjuntode entrenamiento se producen en el exterior vali-dacion cruzada—y los rendimientos de este ultimola estimacion final de ejecucion.
Ex. 12: What accuracy is obtained in each case?What value is selected for the parameter-tuned version based on cross-validation onthe full training set? (Note: this value isoutput in the Classifier output text area.)
Ex. 12: Que precision se obtiene en cada caso?Que valor se selecciona para la versionparametro afinado sobre la base de la val-idacion cruzada en el conjunto de entre-namiento completo? (Nota: este valor es laproduccion en el area de texto Classifier desalida.)
Now consider parameter tuning for J48. We canuse CVParameterSelection to perform a gridsearch on both pruning parameters simultaneouslyby adding multiple parameter strings in the CV-Parameters field. The letter code for the pruningconfidence parameter is C, and you should evalu-ate values from 0.1 to 0.5 in five steps. The lettercode for the minimum leaf size parameter is M ,and you should evaluate values from 1 to 10 in tensteps.
Ahora considere ajuste de parametros de J48.Podemos utilizar CVParameterSelection pararealizar una busqueda de la rejilla en ambosparametros al mismo tiempo de poda mediantela adicion de varias cadenas de parametros en elcampo CVParameters. El codigo de letras parael parametro de la confianza de la poda es de C,y usted debe evaluar los valores de 0,1 a 0,5 encinco pasos. El codigo de letras para el parametrode hoja de tamano mınimo es de M , y se debenevaluar los valores de 1 a 10 en diez pasos.
8

Ex. 13: Run CVParameterSelection to findthe best parameter values in the resultinggrid. Compare the output you get to thatobtained from J48 with default parameters.Has accuracy changed? What about treesize? What parameter values were selectedby CVParameterSelection for the modelbuilt from the full training set?
Ex. 13: Ejecutar CVParameterSelection paraencontrar los mejores valores de parametrosen la red resultante. Comparar la salida sellega a la obtenida de J48 con los parametrospor defecto. Tiene una precision cambiado?Que pasa con el tamano del arbol? Que val-ores de los parametros han sido seleccionadospor CVParameterSelection para el mod-elo construido a partir del conjunto de entre-namiento completo?
9

Practical Data Mining
Tutorial 5: Document Classification
Eibe Frank and Ian H. Witten
May 5, 2011
c©2008-2012 University of Waikato
1 Introduction
Text classification is a popular application of ma-chine learning. You may even have used it: emailspam filters are classifiers that divide email mes-sages, which are just short documents, into twogroups: junk and not junk. So-called “Bayesian”spam filters are trained on messages that have beenmanually labeled, perhaps by putting them intoappropriate folders (e.g. “ham” vs “spam”).
Clasificacion de texto es una aplicacion popular deaprendizaje automatico. Puede que incluso lo hanutilizado: los filtros de spam de correo electronicoson los clasificadores que dividen a los mensajesde correo electronico, que son documentos pocomenos, en dos grupos: basura y no deseado. Losllamados “Bayesiano” filtros de spam son entre-nados en los mensajes que han sido etiquetadosde forma manual, tal vez por su puesta en car-petas correspondientes (por ejemplo, “jamon” vs“spam”).
In this tutorial we look at how to perform docu-ment classification using tools in WEKA. The rawdata is text, but most machine learning algorithmsexpect examples that are described by a fixed setof attributes. Hence we first convert the text datainto a form suitable for learning. This is usuallydone by creating a dictionary of terms from allthe documents in the training corpus and makinga numeric attribute for each term. Then, for aparticular document, the value of each attribute isbased on the frequency of the corresponding termin the document. There is also the class attribute,which gives the document’s label.
En este tutorial vamos a ver como llevar a cabo laclasificacion de documentos usando herramientasen WEKA. Los datos en bruto es de texto, pero lamayorıa de algoritmos de aprendizaje automaticoesperar ejemplos que se describen mediante un con-junto fijo de atributos. Por lo tanto, primero con-vertir los datos de texto en una forma adecuadapara el aprendizaje. Esto suele hacerse mediantela creacion de un diccionario de terminos de todoslos documentos en el corpus de entrenamiento y ha-ciendo un atributo numerico de cada termino. En-tonces, para un documento particular, el valor decada atributo se basa en la frecuencia del terminocorrespondiente en el documento. tambien existeel atributo de clase, lo que da la etiqueta del doc-umento.
2 Data with string attributes
WEKA’s unsupervised attribute filterStringToWordVector can be used to convertraw text into term-frequency-based attributes.The filter assumes that the text of the documentsis stored in an attribute of type String, which isa nominal attribute without a pre-specified set ofvalues. In the filtered data, this string attribute isreplaced by a fixed set of numeric attributes, andthe class attribute is put at the beginning, as thefirst attribute.
Atributo sin supervision WEKA el filtroStringToWordVector se puede utilizar paraconvertir el texto en bruto en los atributos plazobasado en la frecuencia. El filtro se supone queel texto de los documentos se almacena en unatributo de tipo String, que es un atributonominal sin un conjunto previamente especificadode valores. En los datos filtrados, este atributode cadena se sustituye por un conjunto fijo deatributos numericos, y el atributo de la clase sepone al principio, como el primer atributo.
To perform document classification, we firstneed to create an ARFF file with a stringattribute that holds the documents’ text—declared in the header of the ARFF file using@attribute document string, where document
is the name of the attribute. We also need a nom-inal attribute that holds the document’s classifica-tion.
Para realizar la clasificacion de documentos,primero tenemos que crear un archivo deARFF con un atributo de cadena que con-tiene texto de los documentos—declarado enel encabezado del archivo ARFF mediante@attribute document string, donde document
es el nombre del atributo. tambien necesitamosun atributo nominal que contiene la clasificaciondel documento.
1
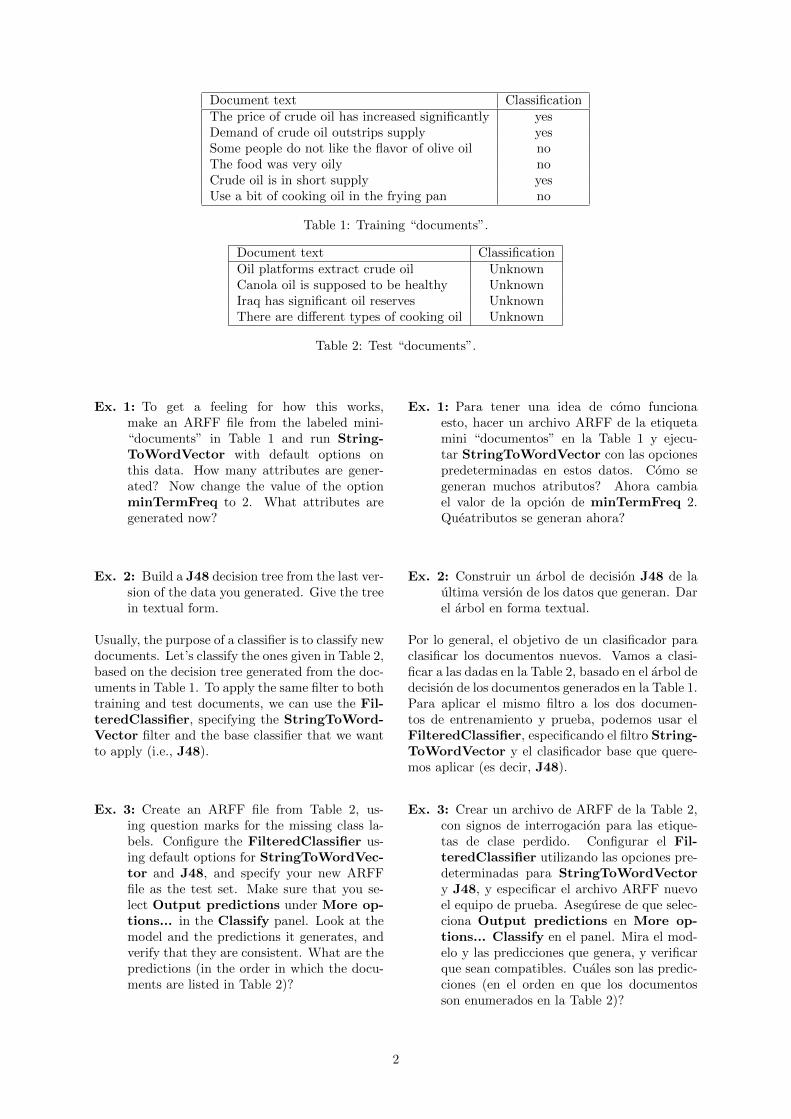
Document text ClassificationThe price of crude oil has increased significantly yesDemand of crude oil outstrips supply yesSome people do not like the flavor of olive oil noThe food was very oily noCrude oil is in short supply yesUse a bit of cooking oil in the frying pan no
Table 1: Training “documents”.
Document text ClassificationOil platforms extract crude oil UnknownCanola oil is supposed to be healthy UnknownIraq has significant oil reserves UnknownThere are different types of cooking oil Unknown
Table 2: Test “documents”.
Ex. 1: To get a feeling for how this works,make an ARFF file from the labeled mini-“documents” in Table 1 and run String-ToWordVector with default options onthis data. How many attributes are gener-ated? Now change the value of the optionminTermFreq to 2. What attributes aregenerated now?
Ex. 1: Para tener una idea de como funcionaesto, hacer un archivo ARFF de la etiquetamini “documentos” en la Table 1 y ejecu-tar StringToWordVector con las opcionespredeterminadas en estos datos. Como segeneran muchos atributos? Ahora cambiael valor de la opcion de minTermFreq 2.Queatributos se generan ahora?
Ex. 2: Build a J48 decision tree from the last ver-sion of the data you generated. Give the treein textual form.
Ex. 2: Construir un arbol de decision J48 de laultima version de los datos que generan. Darel arbol en forma textual.
Usually, the purpose of a classifier is to classify newdocuments. Let’s classify the ones given in Table 2,based on the decision tree generated from the doc-uments in Table 1. To apply the same filter to bothtraining and test documents, we can use the Fil-teredClassifier, specifying the StringToWord-Vector filter and the base classifier that we wantto apply (i.e., J48).
Por lo general, el objetivo de un clasificador paraclasificar los documentos nuevos. Vamos a clasi-ficar a las dadas en la Table 2, basado en el arbol dedecision de los documentos generados en la Table 1.Para aplicar el mismo filtro a los dos documen-tos de entrenamiento y prueba, podemos usar elFilteredClassifier, especificando el filtro String-ToWordVector y el clasificador base que quere-mos aplicar (es decir, J48).
Ex. 3: Create an ARFF file from Table 2, us-ing question marks for the missing class la-bels. Configure the FilteredClassifier us-ing default options for StringToWordVec-tor and J48, and specify your new ARFFfile as the test set. Make sure that you se-lect Output predictions under More op-tions... in the Classify panel. Look at themodel and the predictions it generates, andverify that they are consistent. What are thepredictions (in the order in which the docu-ments are listed in Table 2)?
Ex. 3: Crear un archivo de ARFF de la Table 2,con signos de interrogacion para las etique-tas de clase perdido. Configurar el Fil-teredClassifier utilizando las opciones pre-determinadas para StringToWordVectory J48, y especificar el archivo ARFF nuevoel equipo de prueba. Asegurese de que selec-ciona Output predictions en More op-tions... Classify en el panel. Mira el mod-elo y las predicciones que genera, y verificarque sean compatibles. Cuales son las predic-ciones (en el orden en que los documentosson enumerados en la Table 2)?
2
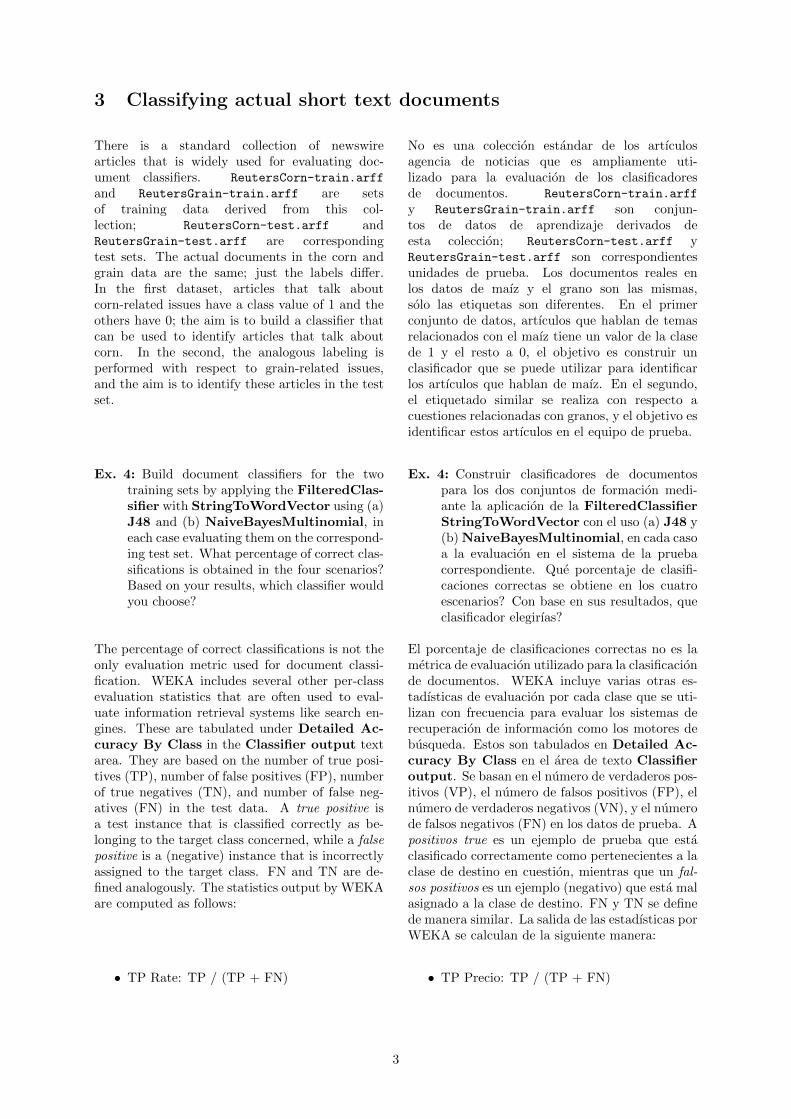
3 Classifying actual short text documents
There is a standard collection of newswirearticles that is widely used for evaluating doc-ument classifiers. ReutersCorn-train.arff
and ReutersGrain-train.arff are setsof training data derived from this col-lection; ReutersCorn-test.arff andReutersGrain-test.arff are correspondingtest sets. The actual documents in the corn andgrain data are the same; just the labels differ.In the first dataset, articles that talk aboutcorn-related issues have a class value of 1 and theothers have 0; the aim is to build a classifier thatcan be used to identify articles that talk aboutcorn. In the second, the analogous labeling isperformed with respect to grain-related issues,and the aim is to identify these articles in the testset.
No es una coleccion estandar de los artıculosagencia de noticias que es ampliamente uti-lizado para la evaluacion de los clasificadoresde documentos. ReutersCorn-train.arff
y ReutersGrain-train.arff son conjun-tos de datos de aprendizaje derivados deesta coleccion; ReutersCorn-test.arff yReutersGrain-test.arff son correspondientesunidades de prueba. Los documentos reales enlos datos de maız y el grano son las mismas,solo las etiquetas son diferentes. En el primerconjunto de datos, artıculos que hablan de temasrelacionados con el maız tiene un valor de la clasede 1 y el resto a 0, el objetivo es construir unclasificador que se puede utilizar para identificarlos artıculos que hablan de maız. En el segundo,el etiquetado similar se realiza con respecto acuestiones relacionadas con granos, y el objetivo esidentificar estos artıculos en el equipo de prueba.
Ex. 4: Build document classifiers for the twotraining sets by applying the FilteredClas-sifier with StringToWordVector using (a)J48 and (b) NaiveBayesMultinomial, ineach case evaluating them on the correspond-ing test set. What percentage of correct clas-sifications is obtained in the four scenarios?Based on your results, which classifier wouldyou choose?
Ex. 4: Construir clasificadores de documentospara los dos conjuntos de formacion medi-ante la aplicacion de la FilteredClassifierStringToWordVector con el uso (a) J48 y(b) NaiveBayesMultinomial, en cada casoa la evaluacion en el sistema de la pruebacorrespondiente. Que porcentaje de clasifi-caciones correctas se obtiene en los cuatroescenarios? Con base en sus resultados, queclasificador elegirıas?
The percentage of correct classifications is not theonly evaluation metric used for document classi-fication. WEKA includes several other per-classevaluation statistics that are often used to eval-uate information retrieval systems like search en-gines. These are tabulated under Detailed Ac-curacy By Class in the Classifier output textarea. They are based on the number of true posi-tives (TP), number of false positives (FP), numberof true negatives (TN), and number of false neg-atives (FN) in the test data. A true positive isa test instance that is classified correctly as be-longing to the target class concerned, while a falsepositive is a (negative) instance that is incorrectlyassigned to the target class. FN and TN are de-fined analogously. The statistics output by WEKAare computed as follows:
El porcentaje de clasificaciones correctas no es lametrica de evaluacion utilizado para la clasificacionde documentos. WEKA incluye varias otras es-tadısticas de evaluacion por cada clase que se uti-lizan con frecuencia para evaluar los sistemas derecuperacion de informacion como los motores debusqueda. Estos son tabulados en Detailed Ac-curacy By Class en el area de texto Classifieroutput. Se basan en el numero de verdaderos pos-itivos (VP), el numero de falsos positivos (FP), elnumero de verdaderos negativos (VN), y el numerode falsos negativos (FN) en los datos de prueba. Apositivos true es un ejemplo de prueba que estaclasificado correctamente como pertenecientes a laclase de destino en cuestion, mientras que un fal-sos positivos es un ejemplo (negativo) que esta malasignado a la clase de destino. FN y TN se definede manera similar. La salida de las estadısticas porWEKA se calculan de la siguiente manera:
• TP Rate: TP / (TP + FN) • TP Precio: TP / (TP + FN)
3
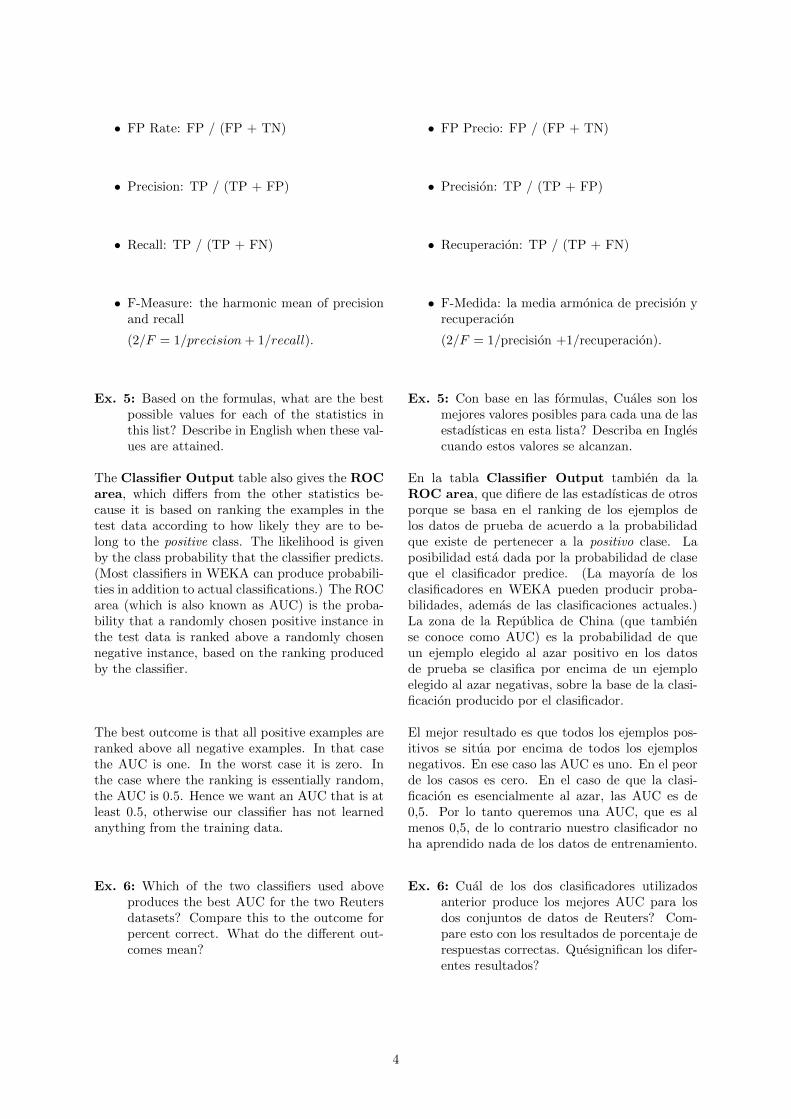
• FP Rate: FP / (FP + TN) • FP Precio: FP / (FP + TN)
• Precision: TP / (TP + FP) • Precision: TP / (TP + FP)
• Recall: TP / (TP + FN) • Recuperacion: TP / (TP + FN)
• F-Measure: the harmonic mean of precisionand recall
(2/F = 1/precision + 1/recall).
• F-Medida: la media armonica de precision yrecuperacion
(2/F = 1/precision +1/recuperacion).
Ex. 5: Based on the formulas, what are the bestpossible values for each of the statistics inthis list? Describe in English when these val-ues are attained.
Ex. 5: Con base en las formulas, Cuales son losmejores valores posibles para cada una de lasestadısticas en esta lista? Describa en Inglescuando estos valores se alcanzan.
The Classifier Output table also gives the ROCarea, which differs from the other statistics be-cause it is based on ranking the examples in thetest data according to how likely they are to be-long to the positive class. The likelihood is givenby the class probability that the classifier predicts.(Most classifiers in WEKA can produce probabili-ties in addition to actual classifications.) The ROCarea (which is also known as AUC) is the proba-bility that a randomly chosen positive instance inthe test data is ranked above a randomly chosennegative instance, based on the ranking producedby the classifier.
En la tabla Classifier Output tambien da laROC area, que difiere de las estadısticas de otrosporque se basa en el ranking de los ejemplos delos datos de prueba de acuerdo a la probabilidadque existe de pertenecer a la positivo clase. Laposibilidad esta dada por la probabilidad de claseque el clasificador predice. (La mayorıa de losclasificadores en WEKA pueden producir proba-bilidades, ademas de las clasificaciones actuales.)La zona de la Republica de China (que tambiense conoce como AUC) es la probabilidad de queun ejemplo elegido al azar positivo en los datosde prueba se clasifica por encima de un ejemploelegido al azar negativas, sobre la base de la clasi-ficacion producido por el clasificador.
The best outcome is that all positive examples areranked above all negative examples. In that casethe AUC is one. In the worst case it is zero. Inthe case where the ranking is essentially random,the AUC is 0.5. Hence we want an AUC that is atleast 0.5, otherwise our classifier has not learnedanything from the training data.
El mejor resultado es que todos los ejemplos pos-itivos se situa por encima de todos los ejemplosnegativos. En ese caso las AUC es uno. En el peorde los casos es cero. En el caso de que la clasi-ficacion es esencialmente al azar, las AUC es de0,5. Por lo tanto queremos una AUC, que es almenos 0,5, de lo contrario nuestro clasificador noha aprendido nada de los datos de entrenamiento.
Ex. 6: Which of the two classifiers used aboveproduces the best AUC for the two Reutersdatasets? Compare this to the outcome forpercent correct. What do the different out-comes mean?
Ex. 6: Cual de los dos clasificadores utilizadosanterior produce los mejores AUC para losdos conjuntos de datos de Reuters? Com-pare esto con los resultados de porcentaje derespuestas correctas. Quesignifican los difer-entes resultados?
4
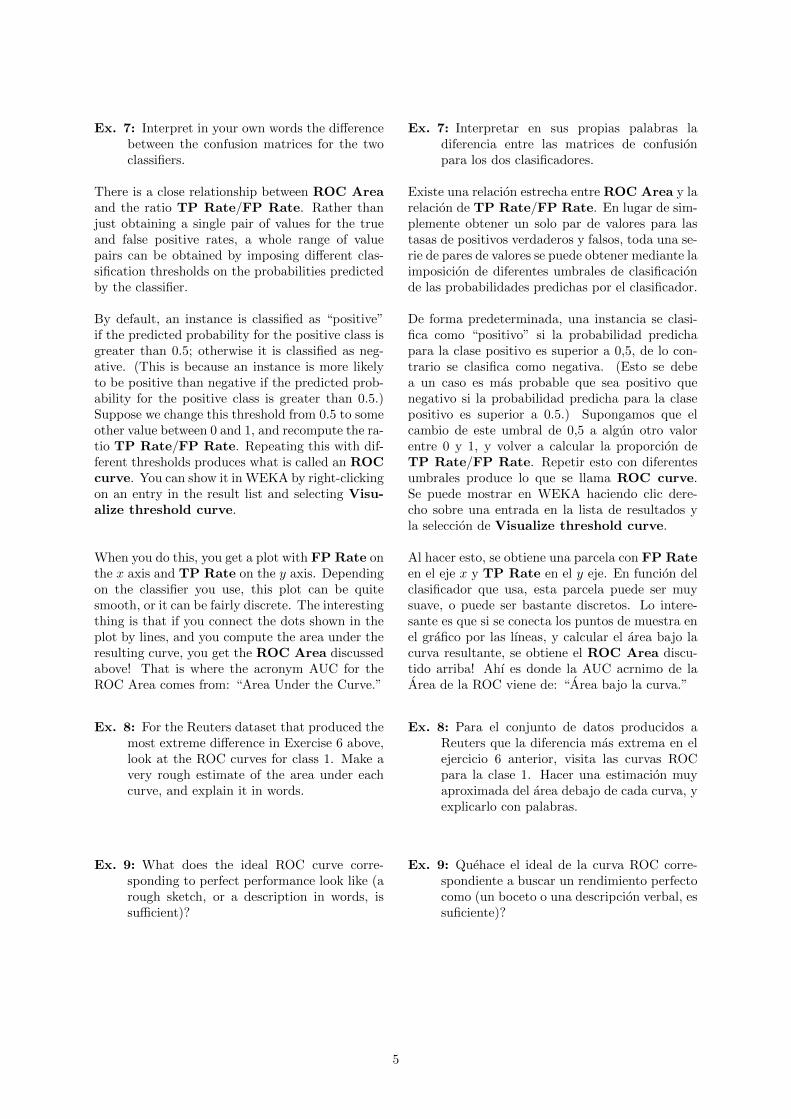
Ex. 7: Interpret in your own words the differencebetween the confusion matrices for the twoclassifiers.
Ex. 7: Interpretar en sus propias palabras ladiferencia entre las matrices de confusionpara los dos clasificadores.
There is a close relationship between ROC Areaand the ratio TP Rate/FP Rate. Rather thanjust obtaining a single pair of values for the trueand false positive rates, a whole range of valuepairs can be obtained by imposing different clas-sification thresholds on the probabilities predictedby the classifier.
Existe una relacion estrecha entre ROC Area y larelacion de TP Rate/FP Rate. En lugar de sim-plemente obtener un solo par de valores para lastasas de positivos verdaderos y falsos, toda una se-rie de pares de valores se puede obtener mediante laimposicion de diferentes umbrales de clasificacionde las probabilidades predichas por el clasificador.
By default, an instance is classified as “positive”if the predicted probability for the positive class isgreater than 0.5; otherwise it is classified as neg-ative. (This is because an instance is more likelyto be positive than negative if the predicted prob-ability for the positive class is greater than 0.5.)Suppose we change this threshold from 0.5 to someother value between 0 and 1, and recompute the ra-tio TP Rate/FP Rate. Repeating this with dif-ferent thresholds produces what is called an ROCcurve. You can show it in WEKA by right-clickingon an entry in the result list and selecting Visu-alize threshold curve.
De forma predeterminada, una instancia se clasi-fica como “positivo” si la probabilidad predichapara la clase positivo es superior a 0,5, de lo con-trario se clasifica como negativa. (Esto se debea un caso es mas probable que sea positivo quenegativo si la probabilidad predicha para la clasepositivo es superior a 0.5.) Supongamos que elcambio de este umbral de 0,5 a algun otro valorentre 0 y 1, y volver a calcular la proporcion deTP Rate/FP Rate. Repetir esto con diferentesumbrales produce lo que se llama ROC curve.Se puede mostrar en WEKA haciendo clic dere-cho sobre una entrada en la lista de resultados yla seleccion de Visualize threshold curve.
When you do this, you get a plot with FP Rate onthe x axis and TP Rate on the y axis. Dependingon the classifier you use, this plot can be quitesmooth, or it can be fairly discrete. The interestingthing is that if you connect the dots shown in theplot by lines, and you compute the area under theresulting curve, you get the ROC Area discussedabove! That is where the acronym AUC for theROC Area comes from: “Area Under the Curve.”
Al hacer esto, se obtiene una parcela con FP Rateen el eje x y TP Rate en el y eje. En funcion delclasificador que usa, esta parcela puede ser muysuave, o puede ser bastante discretos. Lo intere-sante es que si se conecta los puntos de muestra enel grafico por las lıneas, y calcular el area bajo lacurva resultante, se obtiene el ROC Area discu-tido arriba! Ahı es donde la AUC acrnimo de laArea de la ROC viene de: “Area bajo la curva.”
Ex. 8: For the Reuters dataset that produced themost extreme difference in Exercise 6 above,look at the ROC curves for class 1. Make avery rough estimate of the area under eachcurve, and explain it in words.
Ex. 8: Para el conjunto de datos producidos aReuters que la diferencia mas extrema en elejercicio 6 anterior, visita las curvas ROCpara la clase 1. Hacer una estimacion muyaproximada del area debajo de cada curva, yexplicarlo con palabras.
Ex. 9: What does the ideal ROC curve corre-sponding to perfect performance look like (arough sketch, or a description in words, issufficient)?
Ex. 9: Quehace el ideal de la curva ROC corre-spondiente a buscar un rendimiento perfectocomo (un boceto o una descripcion verbal, essuficiente)?
5
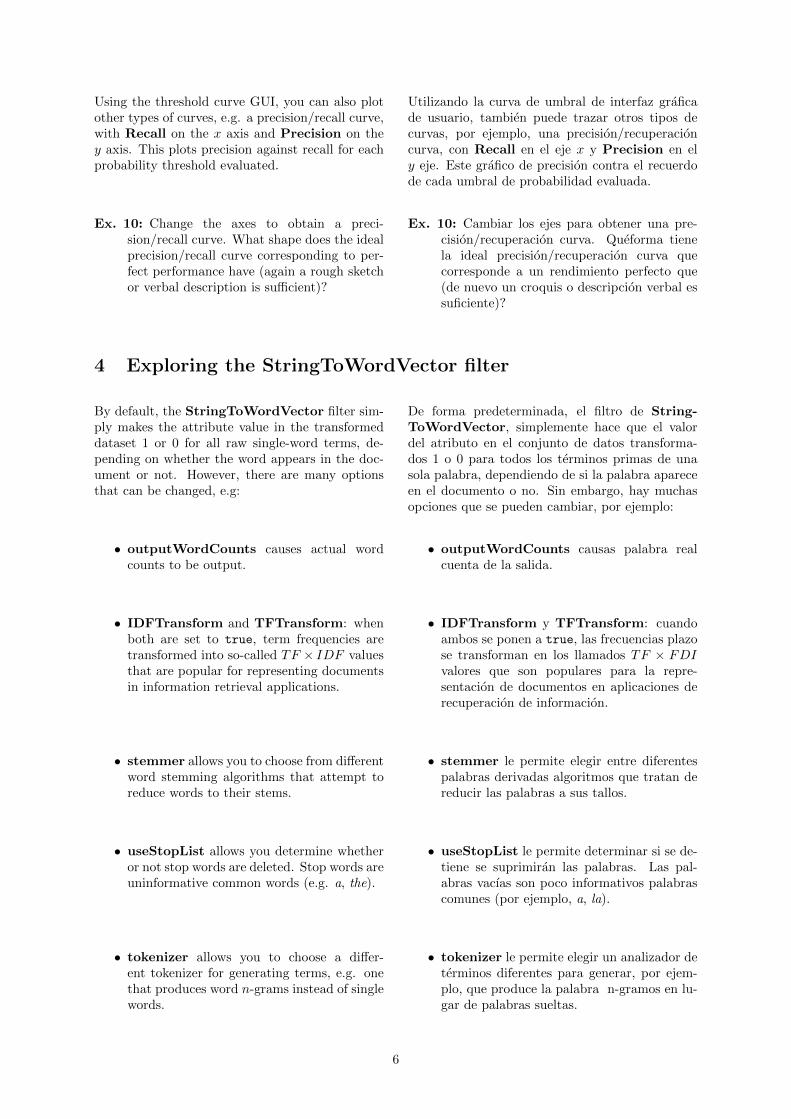
Using the threshold curve GUI, you can also plotother types of curves, e.g. a precision/recall curve,with Recall on the x axis and Precision on they axis. This plots precision against recall for eachprobability threshold evaluated.
Utilizando la curva de umbral de interfaz graficade usuario, tambien puede trazar otros tipos decurvas, por ejemplo, una precision/recuperacioncurva, con Recall en el eje x y Precision en ely eje. Este grafico de precision contra el recuerdode cada umbral de probabilidad evaluada.
Ex. 10: Change the axes to obtain a preci-sion/recall curve. What shape does the idealprecision/recall curve corresponding to per-fect performance have (again a rough sketchor verbal description is sufficient)?
Ex. 10: Cambiar los ejes para obtener una pre-cision/recuperacion curva. Queforma tienela ideal precision/recuperacion curva quecorresponde a un rendimiento perfecto que(de nuevo un croquis o descripcion verbal essuficiente)?
4 Exploring the StringToWordVector filter
By default, the StringToWordVector filter sim-ply makes the attribute value in the transformeddataset 1 or 0 for all raw single-word terms, de-pending on whether the word appears in the doc-ument or not. However, there are many optionsthat can be changed, e.g:
De forma predeterminada, el filtro de String-ToWordVector, simplemente hace que el valordel atributo en el conjunto de datos transforma-dos 1 o 0 para todos los terminos primas de unasola palabra, dependiendo de si la palabra apareceen el documento o no. Sin embargo, hay muchasopciones que se pueden cambiar, por ejemplo:
• outputWordCounts causes actual wordcounts to be output.
• outputWordCounts causas palabra realcuenta de la salida.
• IDFTransform and TFTransform: whenboth are set to true, term frequencies aretransformed into so-called TF × IDF valuesthat are popular for representing documentsin information retrieval applications.
• IDFTransform y TFTransform: cuandoambos se ponen a true, las frecuencias plazose transforman en los llamados TF × FDIvalores que son populares para la repre-sentacion de documentos en aplicaciones derecuperacion de informacion.
• stemmer allows you to choose from differentword stemming algorithms that attempt toreduce words to their stems.
• stemmer le permite elegir entre diferentespalabras derivadas algoritmos que tratan dereducir las palabras a sus tallos.
• useStopList allows you determine whetheror not stop words are deleted. Stop words areuninformative common words (e.g. a, the).
• useStopList le permite determinar si se de-tiene se suprimiran las palabras. Las pal-abras vacıas son poco informativos palabrascomunes (por ejemplo, a, la).
• tokenizer allows you to choose a differ-ent tokenizer for generating terms, e.g. onethat produces word n-grams instead of singlewords.
• tokenizer le permite elegir un analizador determinos diferentes para generar, por ejem-plo, que produce la palabra n-gramos en lu-gar de palabras sueltas.
6

There are several other useful options. For moreinformation, click on More in the GenericOb-jectEditor.
Hay varias opciones utiles. Para obtener mas in-formacion, haga clic en More en la GenericOb-jectEditor.
Ex. 11: Experiment with the options that areavailable. What options give you a goodAUC value for the two datasets above, usingNaiveBayesMultinomial as the classifier?(Note: an exhaustive search is not required.)
Ex. 11: Experimento con las opciones que estandisponibles. Queopciones le dan un buenvalor de AUC para los dos conjuntos de datosanterior, con NaiveBayesMultinomial enel clasificador? (Nota: una busqueda exhaus-tiva no es necesario.)
Often, not all attributes (i.e., terms) are importantwhen classifying documents, because many wordsmay be irrelevant for determining the topic of anarticle. We can use WEKA’s AttributeSelect-edClassifier, using ranking with InfoGainAt-tributeEval and the Ranker search, to try andeliminate attributes that are not so useful. Asbefore we need to use the FilteredClassifier totransform the data before it is passed to the At-tributeSelectedClassifier.
A menudo, no todos los atributos (es decir,terminos) son importantes para la clasificacionde documentos, ya que muchas palabras puedenser irrelevantes para determinar el tema de unartıculo. Podemos utilizar AttributeSelected-Classifier WEKA, utilizando ranking con Info-GainAttributeEval Ranker y la busqueda, paratratar de eliminar los atributos que no son tanutiles. Al igual que antes tenemos que utilizarel FilteredClassifier para transformar los datosantes de que se pasa al AttributeSelectedClas-sifier.
Ex. 12: Experiment with this set-up, using de-fault options for StringToWordVectorand NaiveBayesMultinomial as the clas-sifier. Vary the number of most-informativeattributes that are selected from the info-gain-based ranking by changing the valueof the numToSelect field in the Ranker.Record the AUC values you obtain. Whatnumber of attributes gives you the best AUCfor the two datasets above? What AUCvalues are the best you manage to obtain?(Again, an exhaustive search is not required.)
Ex. 12: Experimento con esta puesta en marcha,utilizando las opciones predeterminadas paraStringToWordVector y NaiveBayes-Multinomial en el clasificador. Variar elnumero de los atributos mas informativoque se seleccionan de la clasificacion deinformacion de ganancia basado en cambiarel valor del campo en el numToSelectRanker. Registre los valores del AUC deobtener. Quenumero de atributos que ofrecela mejor AUC para los dos conjuntos dedatos anteriores? Quevalores AUC son losmejores que logran obtener? (De nuevo, unabusqueda exhaustiva no es necesario.)
7

Practical Data Mining
Tutorial 6: Mining Association Rules
Eibe Frank and Ian H. Witten
May 5, 2011
c©2008-2012 University of Waikato
1 Introduction
Association rule mining is one of the most promi-nent data mining techniques. In this tutorial, wewill work with Apriori—the association rule min-ing algorithm that started it all. As you will see, itis not straightforward to extract useful informationusing association rule mining.
La minerıa de reglas de asociacion es una de lastecnicas de minerıa de datos mas destacados. Eneste tutorial, vamos a trabajar con Apriori—laregla de asociacion algoritmo de minerıa de datosque lo empezo todo. Como se vera, no es facil deextraer informacion util con la minerıa de reglasde asociacion.
2 Association rule mining in WEKA
In WEKA’s Explorer, techniques for associationrule mining are accessed using the Associatepanel. Because this is a purely exploratory datamining technique, there are no evaluation options,and the structure of the panel is simple. The de-fault method is Apriori, which we use in this tuto-rial. WEKA contains a couple of other techniquesfor learning associations from data, but they areprobably more interesting to researchers than prac-titioners.
En Explorer WEKA, tecnicas para la extraccionde reglas de asociacion se accede mediante el panelde Associate. Debido a que esta es una tecnica deminerıa de datos puramente exploratoria, no hayopciones de evaluacion, y la estructura del paneles simple. El metodo predeterminado es Apriori,que utilizamos en este tutorial. WEKA contieneun par de otras tecnicas para el aprendizaje de lasasociaciones de los datos, pero son probablementemas interesante para los investigadores de los pro-fesionales.
To get a feel for how to apply Apriori, we startby mining rules from the weather.nominal.arff
data that we used in Tutorial 1. Note that this al-gorithm expects data that is purely nominal: nu-meric attributes must be discretized first. Afterloading the data in the Preprocess panel, hitthe Start button in the Associate panel to runApriori with default options. It outputs ten rules,ranked according to the confidence measure givenin parentheses after each one. The number follow-ing a rule’s antecedent shows how many instancessatisfy the antecedent; the number following theconclusion shows how many instances satisfy theentire rule (this is the rule’s “support”). Becauseboth numbers are equal for all ten rules, the con-fidence of every rule is exactly one.
Para tener una idea de como aplicar Apriori,empezamos por las normas de la minerıa de laweather.nominal.arff datos que se utilizo en elTutorial 1. Tenga en cuenta que este algoritmo es-pera de datos que es puramente nominal: los atrib-utos numericos deben ser discretos en primer lugar.Despues de cargar los datos en el panel de Prepro-cess, pulsa el boton Start en el panel de Asso-ciate para ejecutar Apriori con las opciones pre-determinadas. Hace salir diez reglas, ordenadas deacuerdo a la medida de confianza entre parentesisdespues de cada uno. El numero siguiente an-tecedente de una regla se muestra como muchoscasos cumplen el antecedente, el numero despuesde la conclusion muestra cuantas instancias satis-facer toda la regla (esta es la regla de “apoyo”).Debido a que ambos numeros son iguales para to-das las diez reglas, la confianza de cada regla esexactamente uno.
1
In practice, it is tedious to find minimum sup-port and confidence values that give satisfactoryresults. Consequently WEKA’s Apriori runs thebasic algorithm several times. It uses same user-specified minimum confidence value throughout,given by the minMetric parameter. The sup-port level is expressed as a proportion of the totalnumber of instances (14 in the case of the weatherdata), as a ratio between 0 and 1. The minimumsupport level starts at a certain value (upper-BoundMinSupport, which should invariably beleft at 1.0 to include the entire set of instances).In each iteration the support is decreased by afixed amount (delta, default 0.05, 5% of the in-stances) until either a certain number of rules hasbeen generated (numRules, default 10 rules) orthe support reaches a certain “minimum mini-mum” level (lowerBoundMinSupport, default0.1—typically rules are uninteresting if they applyto only 10% of the dataset or less). These fourvalues can all be specified by the user.
En la practica, es tedioso para encontrar un apoyomınimo y los valores de la confianza que dan re-sultados satisfactorios. En consecuencia WEKA’sApriori corre el algoritmo basico en varias oca-siones. Utiliza el mismo valor mınimo especificadopor el usuario a traves de la confianza, dado porel parametro minMetric. El nivel de soporte seexpresa como un porcentaje del numero total decasos (14 en el caso de los datos meteorologicos),como una relacion entre 0 y 1. El nivel mınimode apoyo se inicia en un determinado valor (up-perBoundMinSupport, que invariablemente sedebe dejar en 1.0 para incluir todo el conjuntode casos). En cada iteracion el apoyo se reduceen una cantidad fija (delta, por defecto 0.05, 5%de los casos) hasta que un cierto numero de re-glas se ha generado (numRules, por defecto 10normas) o el apoyo llega a un cierto “mınimomınimo “nivel (lowerBoundMinSupport, pordefecto 0.1—normalmente reglas son poco intere-santes si se aplican a solo el 10% del conjunto dedatos o menos). Estos cuatro valores pueden serespecificados por el usuario.
This sounds pretty complicated, so let us examinewhat happens on the weather data. From the out-put in the Associator output text area, we seethat the algorithm managed to generate ten rules.This is based on a minimum confidence level of 0.9,which is the default, and is also shown in the out-put. The Number of cycles performed, whichis shown as 17, tells us that Apriori was actuallyrun 17 times to generate these rules, with 17 dif-ferent values for the minimum support. The finalvalue, which corresponds to the output that wasgenerated, is 0.15 (corresponding to 0.15 ∗ 14 ≈ 2instances).
Esto suena bastante complicado, ası que vamosa examinar lo que sucede en los datos meteo-rologicos. Desde la salida en el area de textoAssociator output, vemos que el algoritmo degestion para generar diez reglas. Esto se basa enun nivel de confianza mınimo de 0.9, que es el pre-determinado, y tambien se muestra en la salida.El Number of cycles performed, que se muestracomo 17, nos dice que Apriori era en realidad eje-cuta 17 veces para generar estas normas, con 17valores diferentes de la ayuda mınima. El costefinal, que corresponde a la salida que se ha gener-ado, es de 0,15 (que corresponde a 0.15 ∗ 14 ≈ 2instances).
By looking at the options in the GenericOb-jectEditor, we can see that the initial value forthe minimum support (upperBoundMinSup-port) is 1 by default, and that delta is 0.05. Now,1 − 17 × 0.05 = 0.15, so this explains why a mini-mum support value of 0.15 is reached after 17 iter-ations. Note that upperBoundMinSupport isdecreased by delta before the basic Apriori algo-rithm is run for the first time.
Al mirar las opciones de la GenericObjectEdi-tor, podemos ver que el valor inicial de la ayudamınima (upperBoundMinSupport) es 1 por de-fecto, y que delta es de 0,05. Ahora, 1−17×0.05 =0, 15, ası que esto explica por que un valor mınimode apoyo de 0,15 que se llego despues de 17 itera-ciones. Tenga en cuenta que upperBoundMin-Support delta es disminuido por antes de la baseApriori algoritmo se ejecuta por primera vez.
2
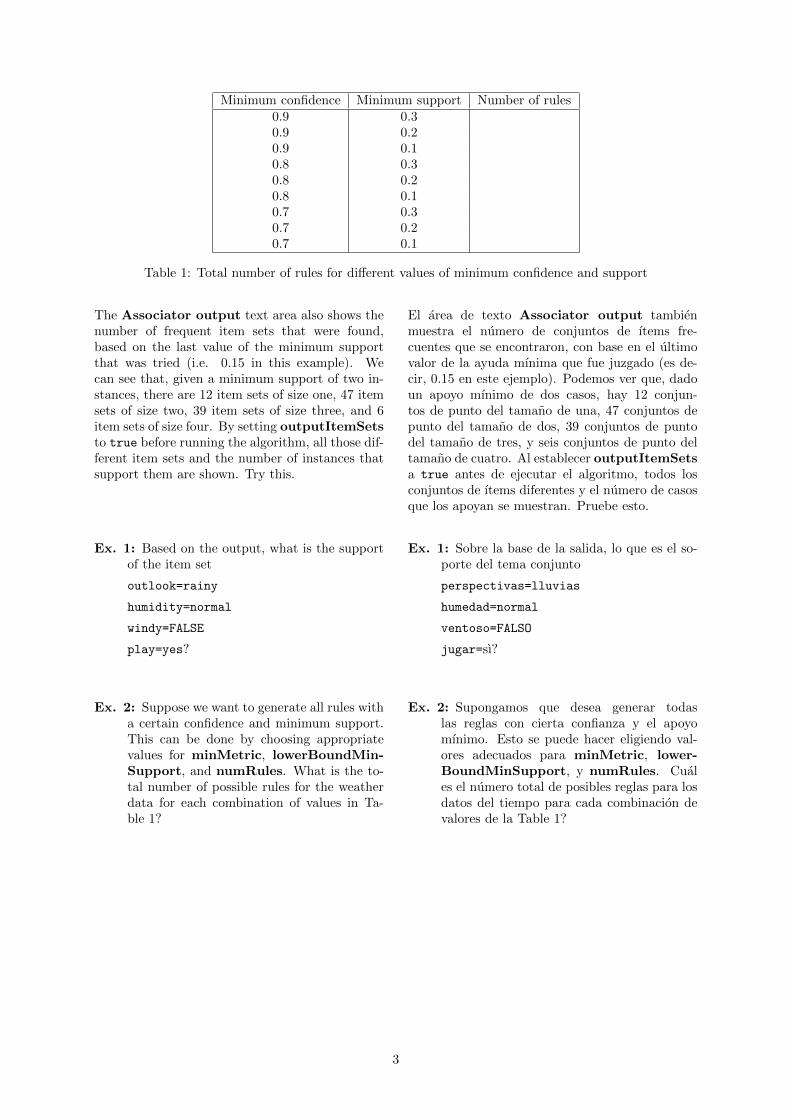
Minimum confidence Minimum support Number of rules0.9 0.30.9 0.20.9 0.10.8 0.30.8 0.20.8 0.10.7 0.30.7 0.20.7 0.1
Table 1: Total number of rules for different values of minimum confidence and support
The Associator output text area also shows thenumber of frequent item sets that were found,based on the last value of the minimum supportthat was tried (i.e. 0.15 in this example). Wecan see that, given a minimum support of two in-stances, there are 12 item sets of size one, 47 itemsets of size two, 39 item sets of size three, and 6item sets of size four. By setting outputItemSetsto true before running the algorithm, all those dif-ferent item sets and the number of instances thatsupport them are shown. Try this.
El area de texto Associator output tambienmuestra el numero de conjuntos de ıtems fre-cuentes que se encontraron, con base en el ultimovalor de la ayuda mınima que fue juzgado (es de-cir, 0.15 en este ejemplo). Podemos ver que, dadoun apoyo mınimo de dos casos, hay 12 conjun-tos de punto del tamano de una, 47 conjuntos depunto del tamano de dos, 39 conjuntos de puntodel tamano de tres, y seis conjuntos de punto deltamano de cuatro. Al establecer outputItemSetsa true antes de ejecutar el algoritmo, todos losconjuntos de ıtems diferentes y el numero de casosque los apoyan se muestran. Pruebe esto.
Ex. 1: Based on the output, what is the supportof the item set
outlook=rainy
humidity=normal
windy=FALSE
play=yes?
Ex. 1: Sobre la base de la salida, lo que es el so-porte del tema conjunto
perspectivas=lluvias
humedad=normal
ventoso=FALSO
jugar=sı?
Ex. 2: Suppose we want to generate all rules witha certain confidence and minimum support.This can be done by choosing appropriatevalues for minMetric, lowerBoundMin-Support, and numRules. What is the to-tal number of possible rules for the weatherdata for each combination of values in Ta-ble 1?
Ex. 2: Supongamos que desea generar todaslas reglas con cierta confianza y el apoyomınimo. Esto se puede hacer eligiendo val-ores adecuados para minMetric, lower-BoundMinSupport, y numRules. Cuales el numero total de posibles reglas para losdatos del tiempo para cada combinacion devalores de la Table 1?
3
Apriori has some further parameters. If signif-icanceLevel is set to a value between zero andone, the association rules are filtered based on aχ2 test with the chosen significance level. How-ever, applying a significance test in this contextis problematic because of the so-called “multiplecomparison problem”: if we perform a test hun-dreds of times for hundreds of association rules, itis likely that a significant effect will be found justby chance (i.e., an association seems to be statis-tically significant when really it is not). Also, theχ2 test is inaccurate for small sample sizes (in thiscontext, small support values).
Apriori tiene algunos parametros mas. Si signif-icanceLevel se establece en un valor entre ceroy uno, las reglas de asociacion se filtran sobre labase de un χ2 la prueba con el nivel de significacionelegido. Sin embargo, la aplicacion de una pruebade significacion en este contexto es problematicodebido a los llamados “problemas de comparacionmultiple”: si realizamos una prueba cientos de ve-ces por cientos de reglas de asociacion, es probableque un efecto significativo se encuentran solo porcasualidad (es decir, una asociacion parece ser es-tadısticamente significativa, cuando en realidad nolo es). Ademas, el χ2 la prueba es inexacto parapequenos tamanos de muestra (en este contexto,los valores de apoyar a los pequenos).
There are alternative measures for ranking rules.As well as Confidence, Apriori supports Lift,Leverage, and Conviction. These can be se-lected using metricType. More information isavailable by clicking More in the GenericOb-jectEditor.
Hay medidas alternativas para las reglas de clasi-ficacion. Ademas de Confidence, Apriori Liftapoya, Leverage y Conviction. Estos pueden serseleccionados con metricType. Mas informacionesta disponible haciendo clic More en el Generi-cObjectEditor.
Ex. 3: Run Apriori on the weather data witheach of the four rule ranking metrics, anddefault settings otherwise. What is the top-ranked rule that is output for each metric?
Ex. 3: Ejecutar Apriori en la informacion deltiempo con cada uno de los cuatro indi-cadores regla de clasificacion, y la configu-racion por defecto de otra manera. Cual esla primera regla de clasificacion que se emitepara cada metrica?
3 Mining a real-world dataset
Now consider a real-world dataset, vote.arff,which gives the votes of 435 U.S. congressmen on16 key issues gathered in the mid-80s, and also in-cludes their party affiliation as a binary attribute.This is a purely nominal dataset with some miss-ing values (actually, abstentions). It is normallytreated as a classification problem, the task beingto predict party affiliation based on voting pat-terns. However, we can also apply association rulemining to this data and seek interesting associa-tions. More information on the data appears inthe comments in the ARFF file.
Consideremos ahora un conjunto de datos delmundo real, vote.arff, lo que da los votos de 435congresistas EE.UU. el 16 de cuestiones clave sereunieron a mediados de los anos 80, y tambien in-cluye su afiliacion a un partido como un atributobinario. Se trata de un conjunto de datos pura-mente nominal con algunos valores que faltan (dehecho, abstenciones). Normalmente se trata comoun problema de clasificacion, la tarea que para pre-decir afiliacion a un partido basado en los patronesde voto. Sin embargo, tambien podemos aplicarla minerıa de reglas de asociacion a estos datos ybuscar asociaciones interesantes. Mas informacionsobre los datos aparecen en los comentarios en elarchivo ARFF.
Ex. 4: Run Apriori on this data with default set-tings. Comment on the rules that are gener-ated. Several of them are quite similar. Howare their support and confidence values re-lated?
Ex. 4: Ejecutar Apriori en estos datos con laconfiguracion predeterminada. Opina sobrelas reglas que se generan. Varios de ellosson bastante similares. Como son su apoyoy confianza de los valores asociados?
4
Ex. 5: It is interesting to see that none ofthe rules in the default output involveClass=republican. Why do you think thatis?
Ex. 5: Es interesante ver que ninguna de las re-glas en la salida predeterminada implicanClase=republicana. Por que crees que es?
4 Market basket analysis
A popular application of association rule mining ismarket basket analysis—analyzing customer pur-chasing habits by seeking associations in the itemsthey buy when visiting a store. To do market bas-ket analysis in WEKA, each transaction is codedas an instance whose attributes represent the itemsin the store. Each attribute has only one value: if aparticular transaction does not contain it (i.e., thecustomer did not buy that particular item), this iscoded as a missing value.
Una aplicacion popular de la minerıa de reglasde asociacion es el analisis de la cesta—analizarlos habitos de compra de los clientes mediantela busqueda de asociaciones en los productos quecompran al visitar una tienda. Para hacer analisisde la cesta de WEKA, cada transaccion se codi-fica como una instancia cuyos atributos represen-tan los artıculos de la tienda. Cada atributo tieneun unico valor: si una transaccion en particularno lo contiene (es decir, el cliente no comprar eseartıculo en particular), esto se codifica como unvalor que falta.
Your job is to mine supermarket checkout data forassociations. The data in supermarket.arff wascollected from an actual New Zealand supermar-ket. Take a look at this file using a text editorto verify that you understand the structure. Themain point of this exercise is to show you how dif-ficult it is to find any interesting patterns in thistype of data!
Su trabajo consiste en extraer datos superme-rcado para las asociaciones. Los datos desupermarket.arff se obtuvo de un verdadero su-permercado de Nueva Zelanda. Echa un vistazoa este archivo utilizando un editor de texto paracomprobar que entender la estructura. El puntoprincipal de este ejercicio es mostrar lo difıcil quees encontrar cualquier patrones interesantes en estetipo de datos!
Ex. 6: Experiment with Apriori and investigatethe effect of the various parameters discussedabove. Write a brief report on your investi-gation and the main findings.
Ex. 6: Experimente con Apriori e investigar elefecto de la diversos parmetros discutidos an-teriormente. Escriba un breve informe en suinvestigacin y las conclusiones principales.
5