welcome to bg brasil - thaiembassybrazil.comthaiembassybrazil.com/pdf/bgbrasil.pdf · the following...
TRANSCRIPT
Welcome to BG Brasil 27 June 2012
Nelson Silva – President, BG Brasil
Legal notice
The following presentation contains forward-looking statements concerning BG Group plc‟s strategy, operations, financial performance or condition, outlook, growth opportunities or circumstances in the countries, sectors or markets in which BG Group plc operates. By their nature, forward-looking statements involve uncertainty because they depend on future circumstances, and relate to events, not all of which can be controlled or predicted. Although the Company believes that the expectations reflected in such forward-looking statements are reasonable, no assurance can be given that such expectations will prove to have been correct. Actual results could differ materially from the guidance given in this presentation for a number of reasons. For a detailed analysis of the factors that may affect our business, financial performance or results of operations, we urge you to look at the “Principal risks and uncertainties” included in the BG Group plc Annual Report & Accounts 2011. Nothing in this presentation should be construed as a profit forecast and no part of this presentation constitutes, or shall be taken to constitute, an invitation or inducement to invest in BG Group plc or any other entity, and must not be relied upon in any way in connection with any investment decision. BG Group plc undertakes no obligation to update any forward-looking statements.
No representation or warranty, express or implied, is or will be made in relation to the accuracy or completeness of the information in this presentation and no responsibility or liability is or will be accepted by BG Group plc or any of its respective subsidiaries, affiliates and associated companies (or by any of their respective officers, employees or agents) in relation to it.
2
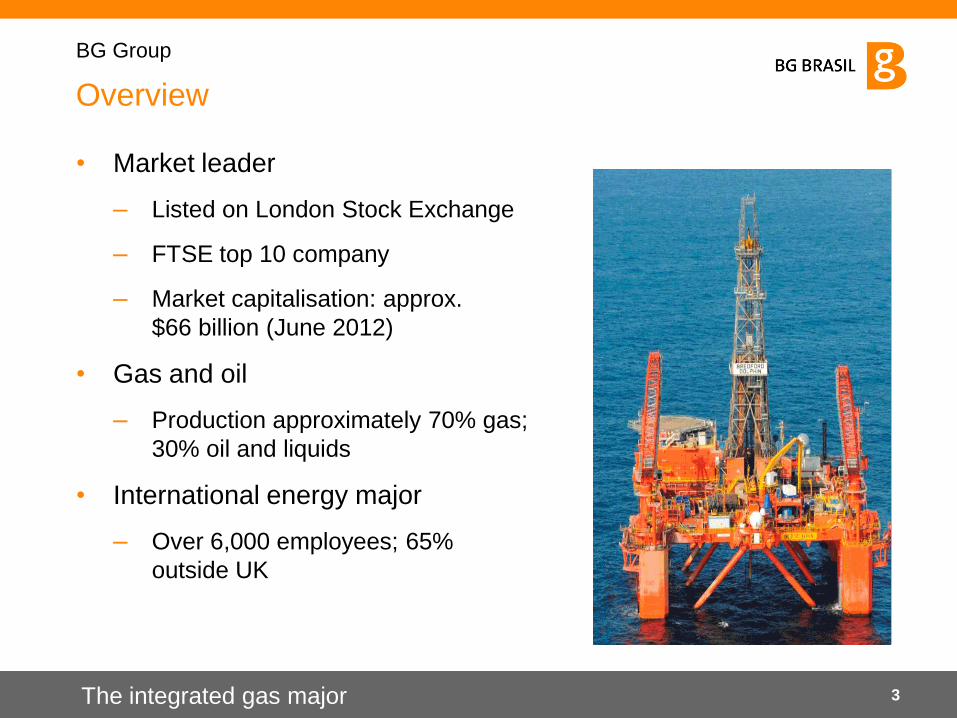
Overview
• Market leader
– Listed on London Stock Exchange
– FTSE top 10 company
– Market capitalisation: approx.
$66 billion (June 2012)
• Gas and oil
– Production approximately 70% gas;
30% oil and liquids
• International energy major
– Over 6,000 employees; 65%
outside UK
The integrated gas major
BG Group
3
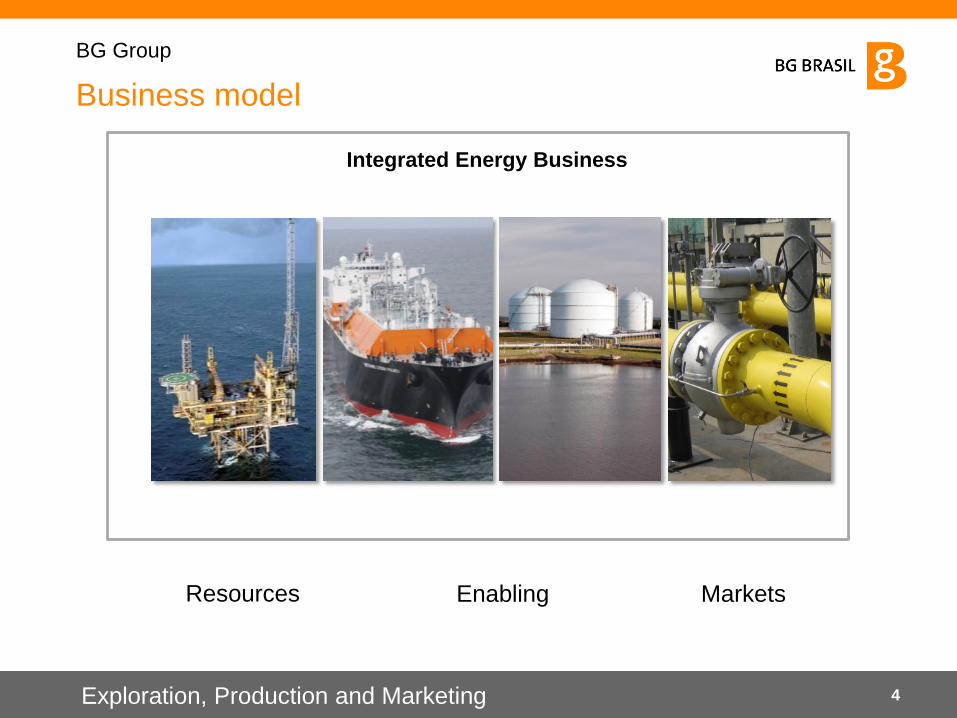
Business model
Exploration, Production and Marketing
BG Group
Markets Enabling Resources
Integrated Energy Business
4
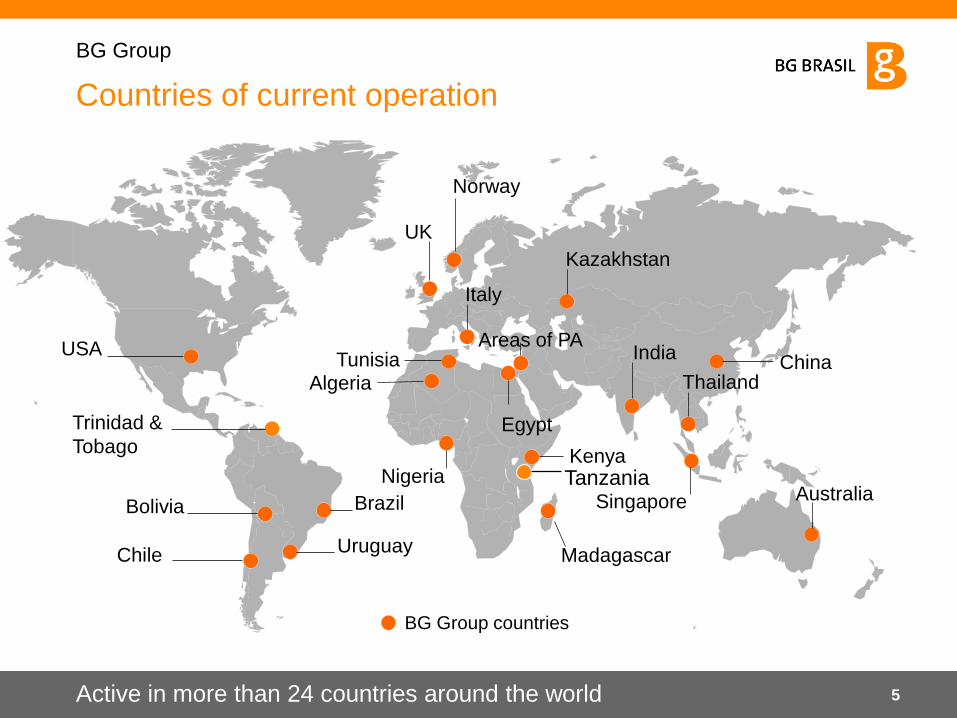
Countries of current operation
Active in more than 24 countries around the world
BG Group countries
Trinidad &
Tobago Egypt
Kazakhstan
UK
India
Uruguay
Bolivia Brazil
USA
Italy
Tunisia Thailand
Singapore
Areas of PA
Norway
Nigeria
China
Madagascar
Algeria
Chile
Australia Tanzania Kenya
BG Group
5
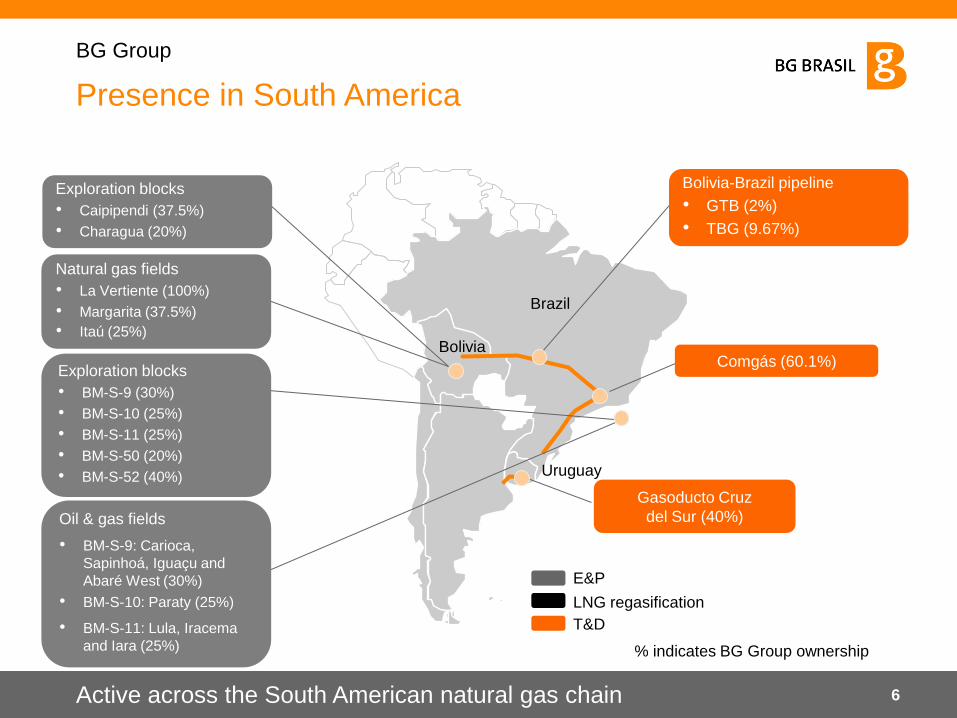
E&P
Gasoducto Cruz
del Sur (40%)
Bolivia-Brazil pipeline
• GTB (2%)
• TBG (9.67%)
Exploration blocks
• Caipipendi (37.5%)
• Charagua (20%)
Exploration blocks
• BM-S-9 (30%)
• BM-S-10 (25%)
• BM-S-11 (25%)
• BM-S-50 (20%)
• BM-S-52 (40%)
Natural gas fields
• La Vertiente (100%)
• Margarita (37.5%)
• Itaú (25%)
Brazil
Bolivia
Uruguay
T&D
LNG regasification
% indicates BG Group ownership
Presence in South America
Active across the South American natural gas chain
BG Group
6
Oil & gas fields
• BM-S-9: Carioca,
Sapinhoá, Iguaçu and
Abaré West (30%)
• BM-S-10: Paraty (25%)
• BM-S-11: Lula, Iracema
and Iara (25%)
Comgás (60.1%)
BG Group in Brazil
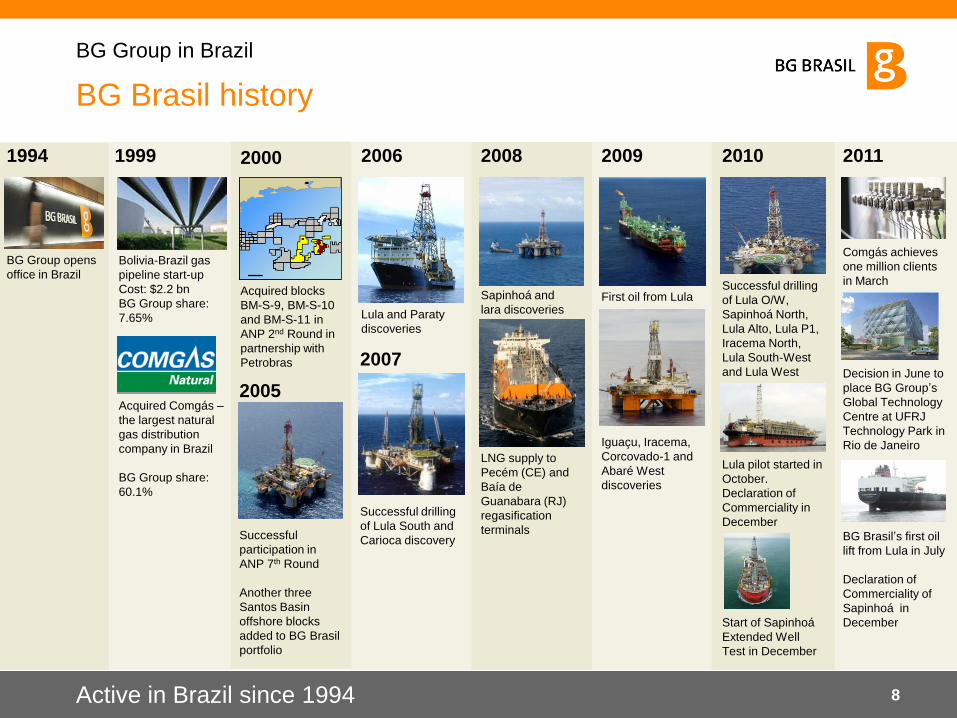
BG Brasil history
1994
BG Group opens
office in Brazil
2005
2007
2011
1999
2006
Lula and Paraty
discoveries
2005
Successful
participation in
ANP 7th Round
Another three
Santos Basin
offshore blocks
added to BG Brasil
portfolio
2007
Successful drilling
of Lula South and
Carioca discovery
2008
Sapinhoá and
lara discoveries
LNG supply to
Pecém (CE) and
Baía de
Guanabara (RJ)
regasification
terminals
2000
Acquired blocks
BM-S-9, BM-S-10
and BM-S-11 in
ANP 2nd Round in
partnership with
Petrobras
2009
First oil from Lula
Iguaçu, Iracema,
Corcovado-1 and
Abaré West
discoveries
2010
Successful drilling
of Lula O/W,
Sapinhoá North,
Lula Alto, Lula P1,
Iracema North,
Lula South-West
and Lula West
Lula pilot started in
October.
Declaration of
Commerciality in
December
Start of Sapinhoá
Extended Well
Test in December
2011
Comgás achieves
one million clients
in March
Decision in June to
place BG Group‟s
Global Technology
Centre at UFRJ
Technology Park in
Rio de Janeiro
BG Brasil‟s first oil
lift from Lula in July
Declaration of
Commerciality of
Sapinhoá in
December
Bolivia-Brazil gas
pipeline start-up
Cost: $2.2 bn
BG Group share:
7.65%
Acquired Comgás –
the largest natural
gas distribution
company in Brazil
BG Group share:
60.1%
Active in Brazil since 1994
BG Group in Brazil
8
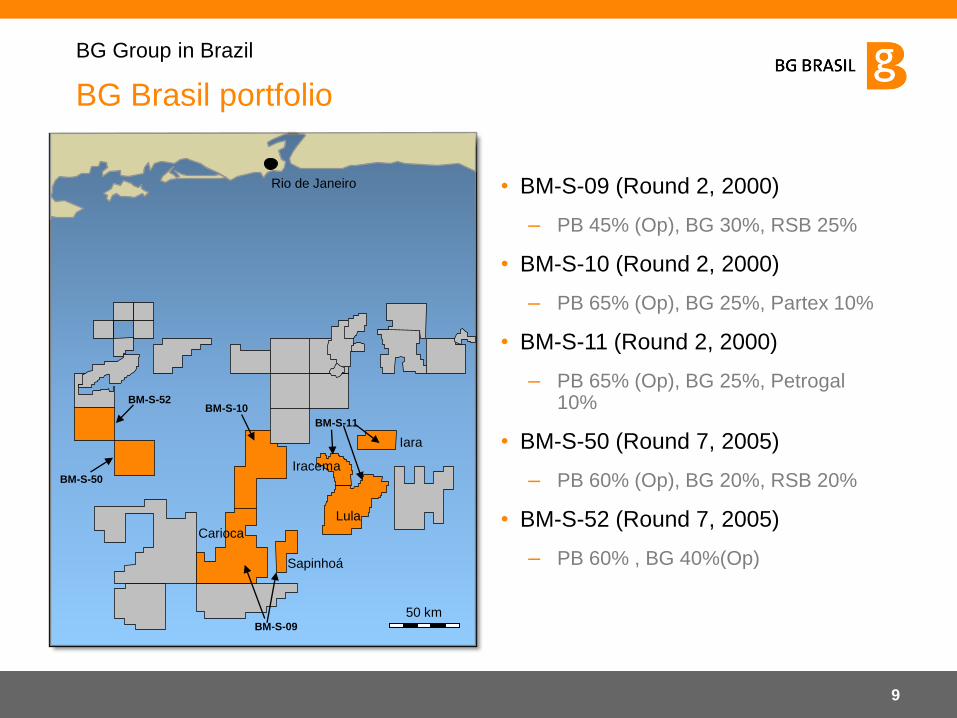
BG Brasil portfolio
• BM-S-09 (Round 2, 2000)
– PB 45% (Op), BG 30%, RSB 25%
• BM-S-10 (Round 2, 2000)
– PB 65% (Op), BG 25%, Partex 10%
• BM-S-11 (Round 2, 2000)
– PB 65% (Op), BG 25%, Petrogal 10%
• BM-S-50 (Round 7, 2005)
– PB 60% (Op), BG 20%, RSB 20%
• BM-S-52 (Round 7, 2005)
– PB 60% , BG 40%(Op)
Carioca
Iara
Sapinhoá
Rio de Janeiro
50 km
Lula
Iracema
BM-S-52
BM-S-50
BM-S-10
BM-S-09
BM-S-11
BG Group in Brazil
9
Significant progress and visibility
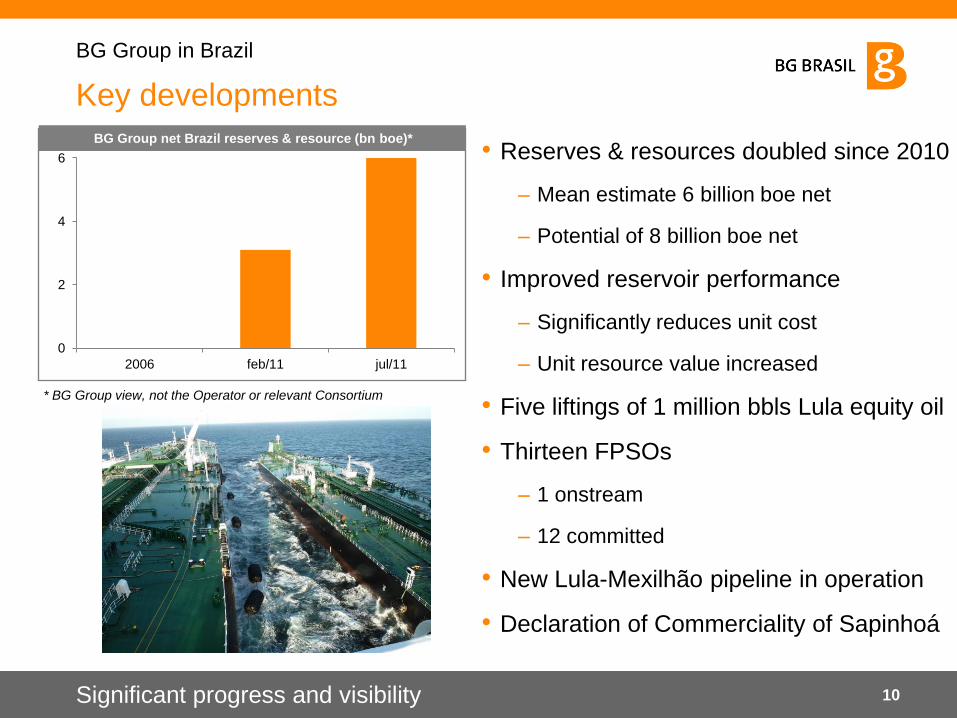
• Reserves & resources doubled since 2010
– Mean estimate 6 billion boe net
– Potential of 8 billion boe net
• Improved reservoir performance
– Significantly reduces unit cost
– Unit resource value increased
• Five liftings of 1 million bbls Lula equity oil
• Thirteen FPSOs
– 1 onstream
– 12 committed
• New Lula-Mexilhão pipeline in operation
• Declaration of Commerciality of Sapinhoá
0
2
4
6
2006 feb/11 jul/11
BG Group net Brazil reserves & resource (bn boe)*
Key developments
BG Group in Brazil
10
* BG Group view, not the Operator or relevant Consortium
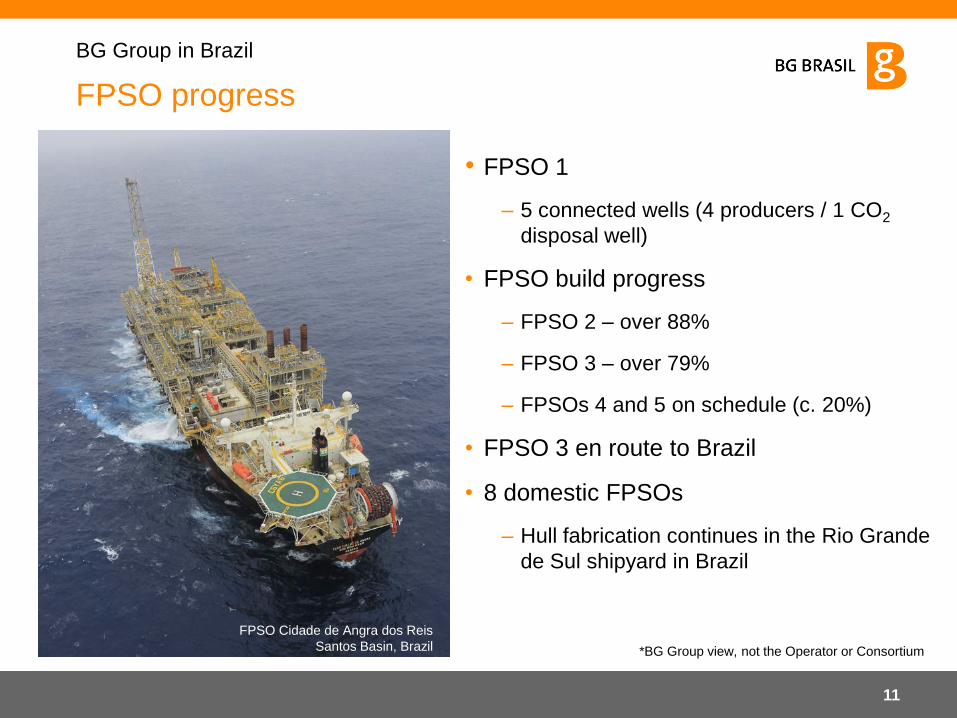
FPSO progress
• FPSO 1
– 5 connected wells (4 producers / 1 CO2
disposal well)
• FPSO build progress
– FPSO 2 – over 88%
– FPSO 3 – over 79%
– FPSOs 4 and 5 on schedule (c. 20%)
• FPSO 3 en route to Brazil
• 8 domestic FPSOs
– Hull fabrication continues in the Rio Grande
de Sul shipyard in Brazil
FPSO Cidade de Angra dos Reis
Santos Basin, Brazil *BG Group view, not the Operator or Consortium
BG Group in Brazil
11
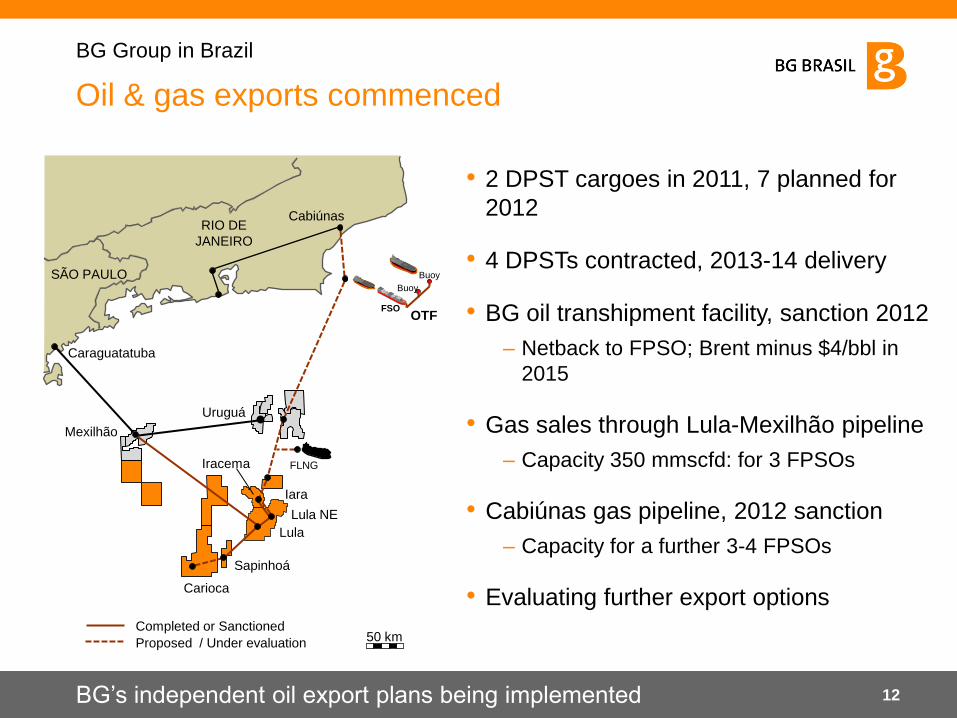
Oil & gas exports commenced
• 2 DPST cargoes in 2011, 7 planned for
2012
• 4 DPSTs contracted, 2013-14 delivery
• BG oil transhipment facility, sanction 2012
– Netback to FPSO; Brent minus $4/bbl in
2015
• Gas sales through Lula-Mexilhão pipeline
– Capacity 350 mmscfd: for 3 FPSOs
• Cabiúnas gas pipeline, 2012 sanction
– Capacity for a further 3-4 FPSOs
• Evaluating further export options
Completed or Sanctioned
Proposed / Under evaluation 50 km
Caraguatatuba
RIO DE
JANEIRO
Sapinhoá
Carioca
Mexilhão
Lula
Iracema
Iara
Lula NE
FLNG
Uruguá
SÃO PAULO
Cabiúnas
Buoy
Buoy
FSO OTF
BG‟s independent oil export plans being implemented
BG Group in Brazil
12
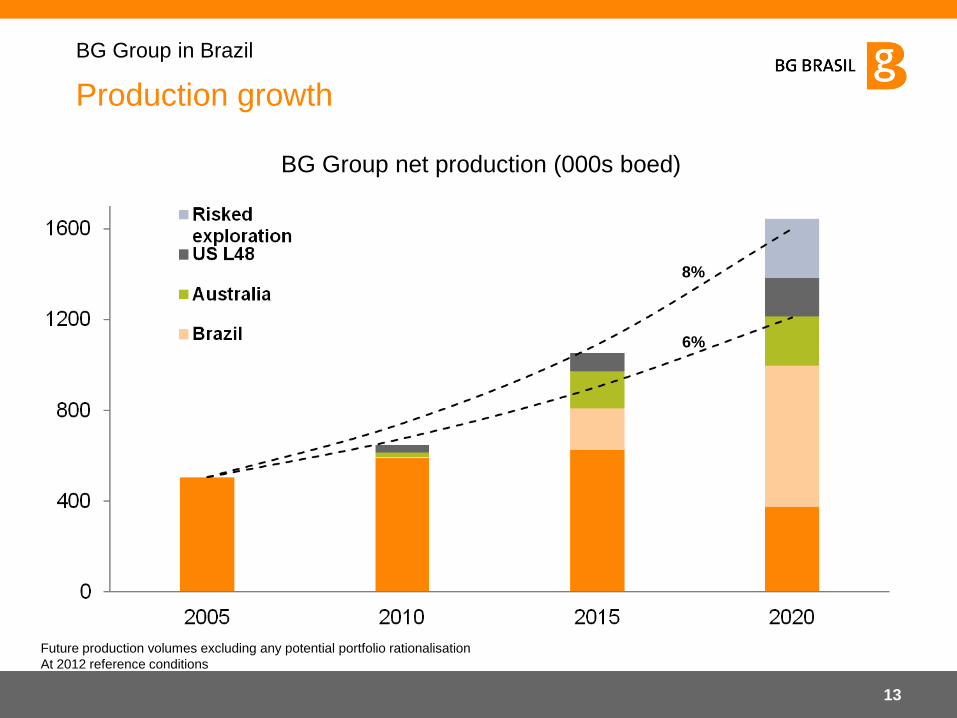
BG Group net production (000s boed)
8%
6%
Future production volumes excluding any potential portfolio rationalisation
At 2012 reference conditions
BG Group in Brazil
Production growth
13
Sustainability
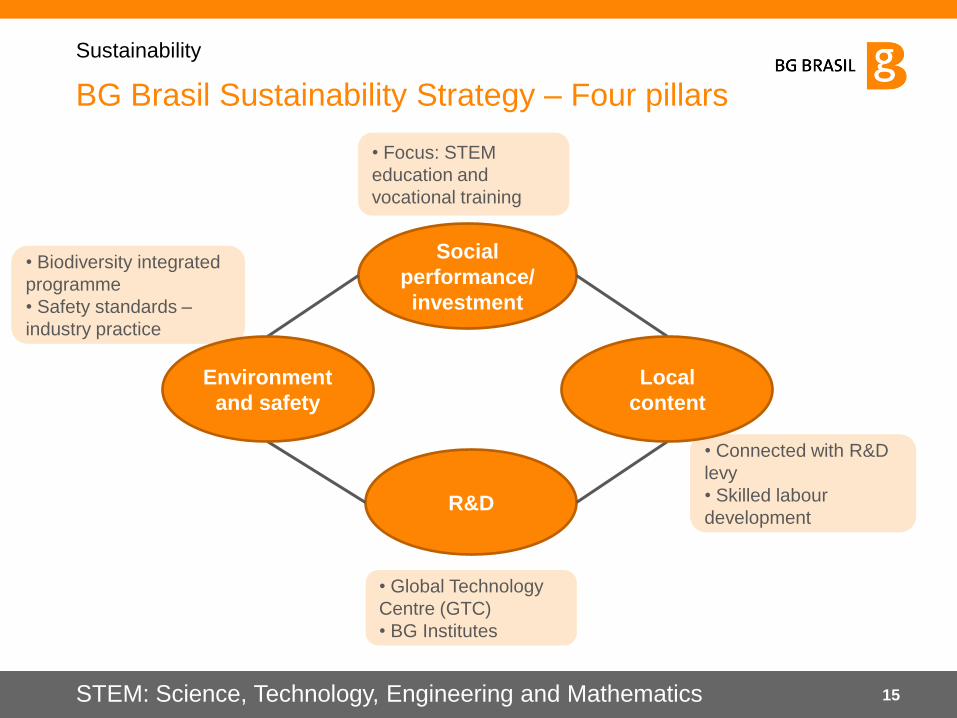
Social
performance/
investment
R&D
BG Brasil Sustainability Strategy – Four pillars
Sustainability
STEM: Science, Technology, Engineering and Mathematics
• Global Technology
Centre (GTC)
• BG Institutes
• Connected with R&D
levy
• Skilled labour
development
• Focus: STEM
education and
vocational training
• Biodiversity integrated
programme
• Safety standards –
industry practice
Environment
and safety
Local
content
15
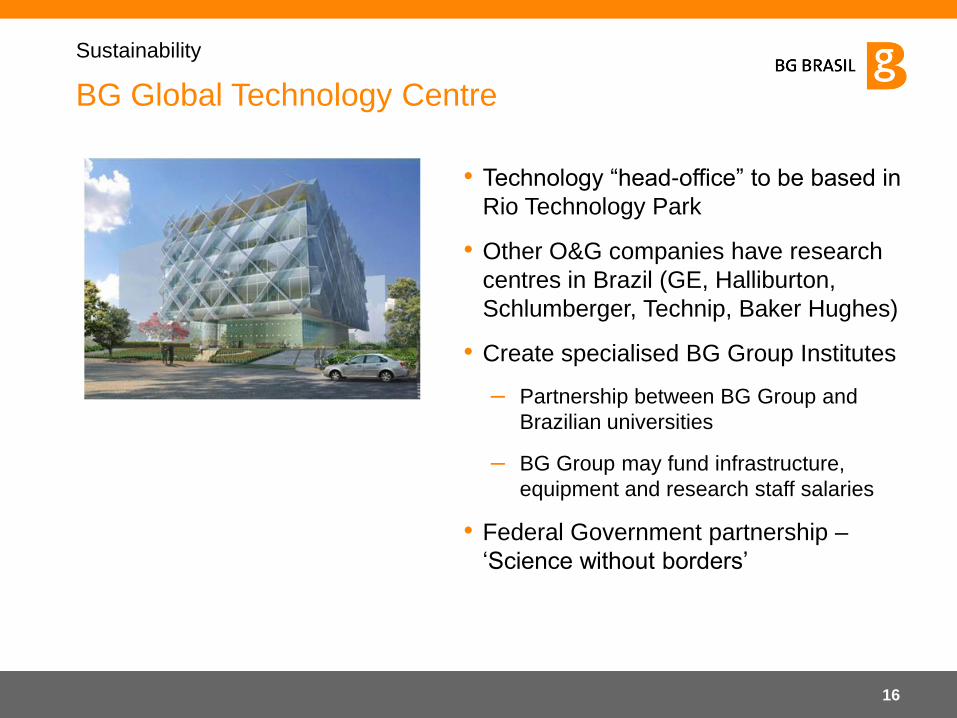
BG Global Technology Centre
Sustainability
• Technology “head-office” to be based in
Rio Technology Park
• Other O&G companies have research
centres in Brazil (GE, Halliburton,
Schlumberger, Technip, Baker Hughes)
• Create specialised BG Group Institutes
– Partnership between BG Group and
Brazilian universities
– BG Group may fund infrastructure,
equipment and research staff salaries
• Federal Government partnership –
„Science without borders‟
16
Comgás
18
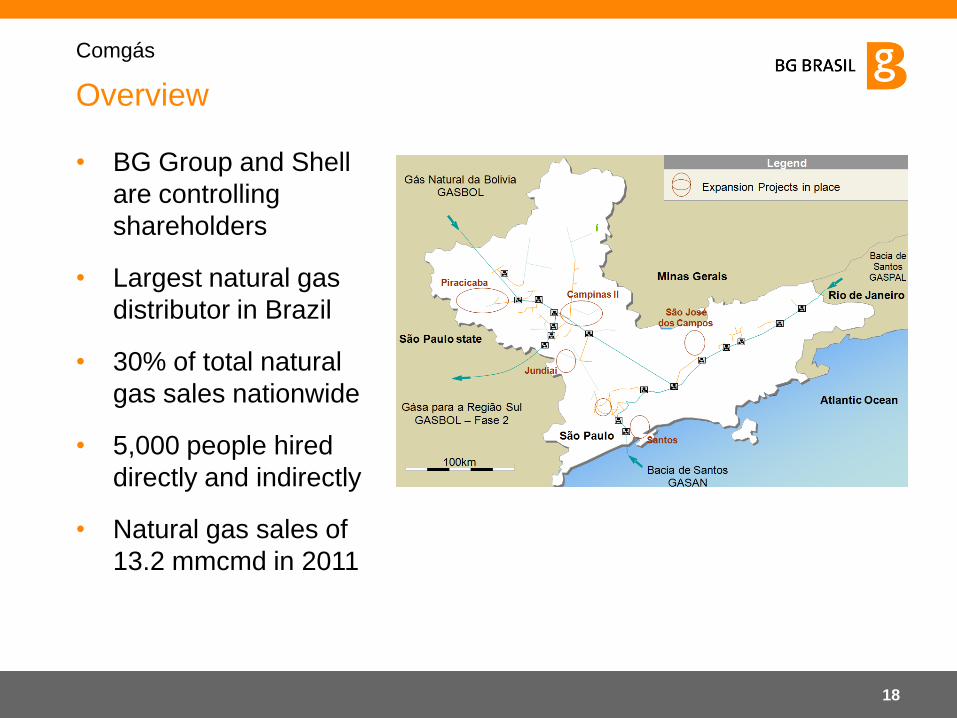
• BG Group and Shell
are controlling
shareholders
• Largest natural gas
distributor in Brazil
• 30% of total natural
gas sales nationwide
• 5,000 people hired
directly and indirectly
• Natural gas sales of
13.2 mmcmd in 2011
Overview
Comgás
Long-term commitment
• Achievements after privatisation – 1999 to 2011
– Volumes: 3.2 to 13.2 mmcmd
– Over R$4 billion in investments
– Network expansion: 2,534 to 8,000 km
– Customers: 314,000 to 1,000,000*
– Municipalities served: 20 to 70
• Concession area
– 29.2 million population
– 27% share of GDP
– 35% share of energy consumption
A history of success
Comgás
* One million clients reached in March 2011
19
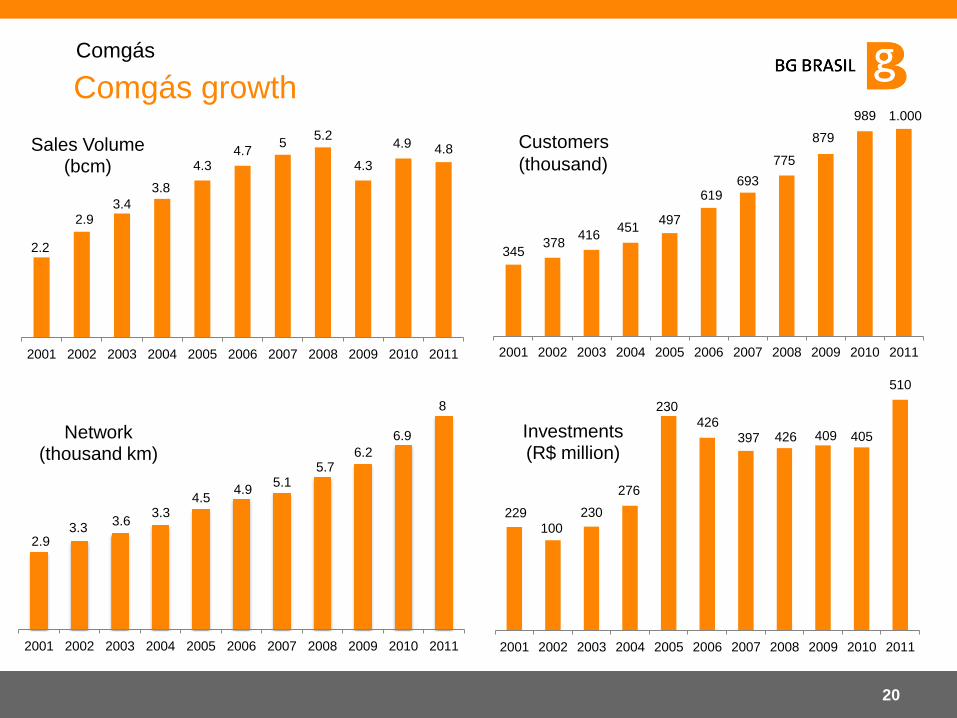
Comgás growth
Comgás
2.9 3.3
3.6 3.3
4.5 4.9
5.1 5.7
6.2
6.9
8
2001 2002 2003 2004 2005 2006 2007 2008 2009 2010 2011
Network (thousand km)
229 100
230
276
230
426 397 426 409 405
510
2001 2002 2003 2004 2005 2006 2007 2008 2009 2010 2011
Investments (R$ million)
345 378
416 451
497
619 693
775
879
989 1.000
2001 2002 2003 2004 2005 2006 2007 2008 2009 2010 2011
Customers
(thousand)
2.2
2.9 3.4
3.8
4.3 4.7
5 5.2
4.3
4.9 4.8
2001 2002 2003 2004 2005 2006 2007 2008 2009 2010 2011
Sales Volume (bcm)
20
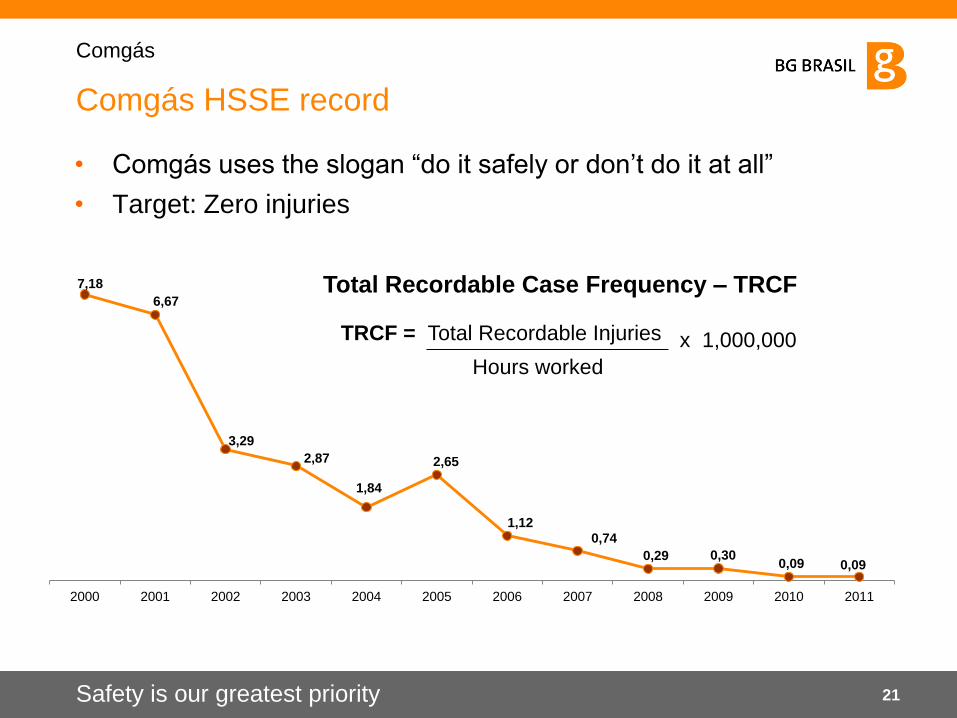
Comgás HSSE record
Comgás
Safety is our greatest priority
• Comgás uses the slogan “do it safely or don‟t do it at all”
• Target: Zero injuries
Total Recordable Case Frequency – TRCF
TRCF = Total Recordable Injuries
x 1,000,000
Hours worked
21
7,18
6,67
3,29
2,87
1,84
2,65
1,12 0,74
0,29 0,30 0,09 0,09
2000 2001 2002 2003 2004 2005 2006 2007 2008 2009 2010 2011