welcome to living environment (biology) observe each of the pictures on the following 4 slides. can...
TRANSCRIPT
Welcome To Living Environment
(Biology)
Observe each of the pictures on the following 4 slides. Can you figure out what the people in the pictures have in common?
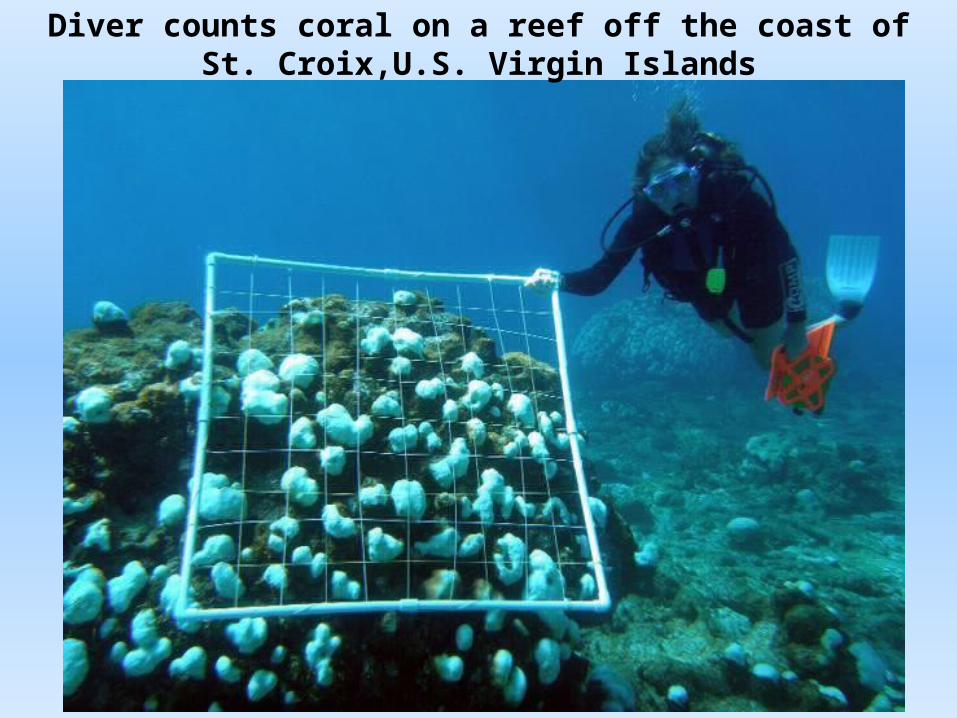
Diver counts coral on a reef off the coast of St. Croix,U.S. Virgin Islands

Observing penguins in Antarctica

Examination of an influenza virus

A child is vaccinated for Malaria in Tanzania.

The thing they all have in common is that they are all
BIOLOGISTS.

Biology is the science that tries to help us understand the living world. Because there is such a great variety of living things, biologists can be found all over the world and conduct their experiments in all types of environments.

The Scientific MethodIt is a way to ask and answer scientific questions by making observations and doing experiments.


Step # 1 - State The Problem
The investigator is identifying a problem and making observations as to the cause of the problem.
Example: My geranium plants do not grow as well as the geranium plants at the nursery.
Nursery
Plant
My Plant
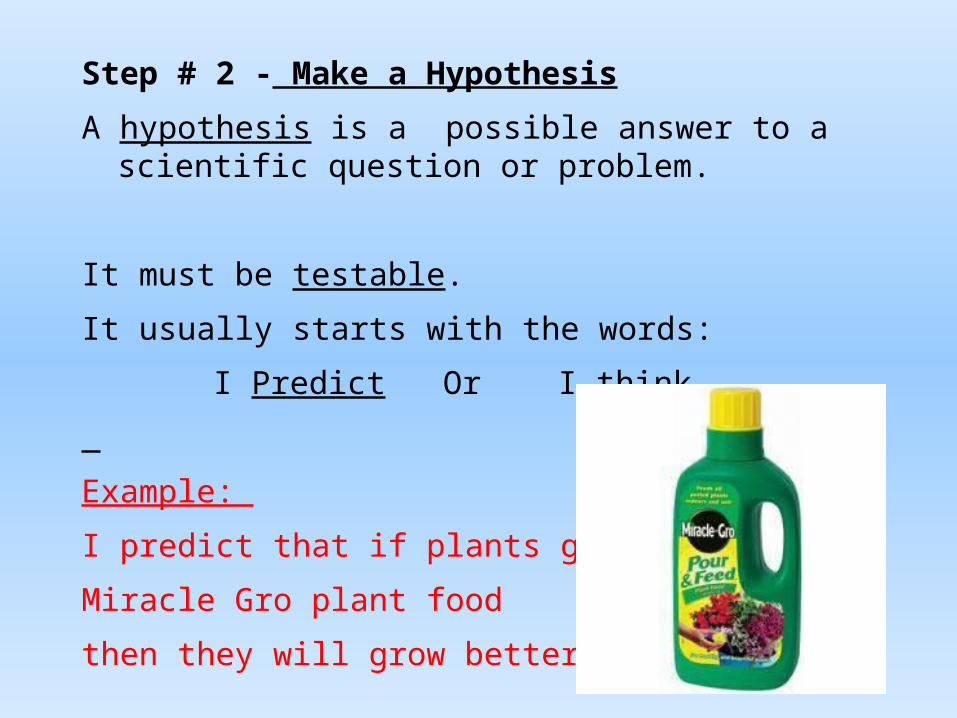
Step # 2 - Make a Hypothesis
A hypothesis is a possible answer to a scientific question or problem.
It must be testable.
It usually starts with the words:
I Predict Or I think
Example:
I predict that if plants get
Miracle Gro plant food
then they will grow better.

Step # 3 Design an Experiment
An experiment is a carefully created situation that will test a hypothesis. It will need to have:
a. experimental groups
b. independent (manipulated) variable
c. dependent (responding) variable
d. control group
e. constants
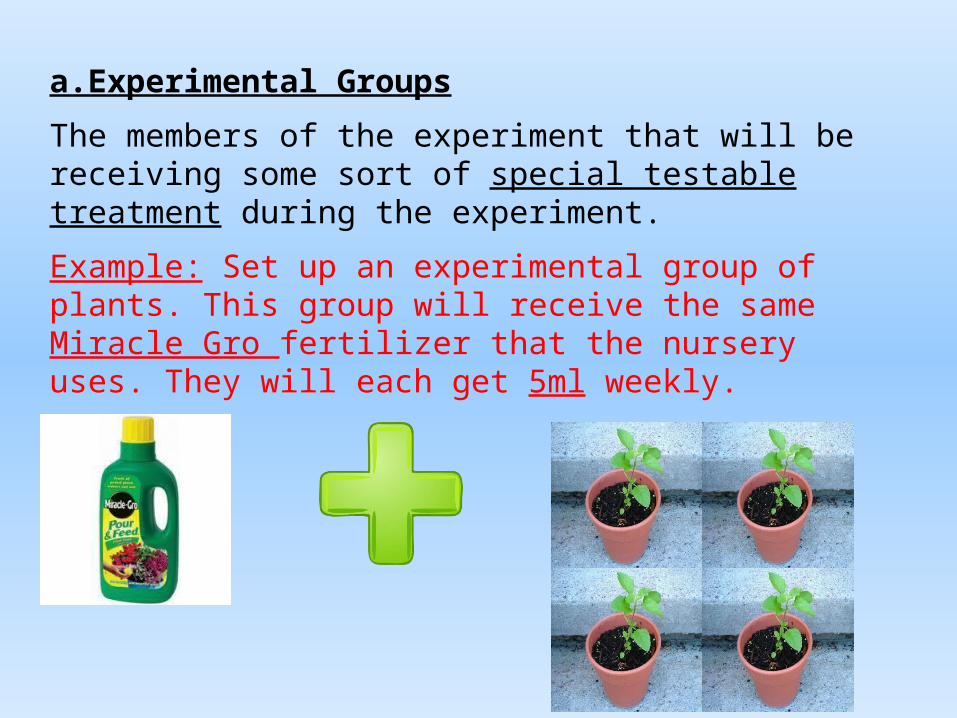
a.Experimental Groups
The members of the experiment that will be receiving some sort of special testable treatment during the experiment.
Example: Set up an experimental group of plants. This group will receive the same Miracle Gro fertilizer that the nursery uses. They will each get 5ml weekly.

b. Independent (manipulated) Variable
It is the one thing that is purposely changed by the investigator.
Example:
In the plant experiment the Miracle Gro plant food is the independent variable.In my experiment it is the one thing that I am choosing to test.

c.Dependent (responding) Variable
The one thing that you are going to measure or count in an experiment.
Example:
I will measure my plants every week
to see how well they are growing.
I will make centimeter
measurements and keep a
record of my results.

d. Control Group
It refers to the members of the experiment that will not be receiving any sort of special treatment during the experiment.
Example:
Set up a control group of plants. This group will not receive the Miracle Gro fertilizer that the nursery uses. They will be treated the way I normally treated my plants with just plain water.

e. Constants
All the things in the experiment that need to be kept the same for all the members of the experiment. It is the only way to know if the results that you get are due to the independent variable in the experiment.
Example:
1. Type of plants
2. Type of soil
3. Amount of sunlight
4. Containers
5. Amount of water
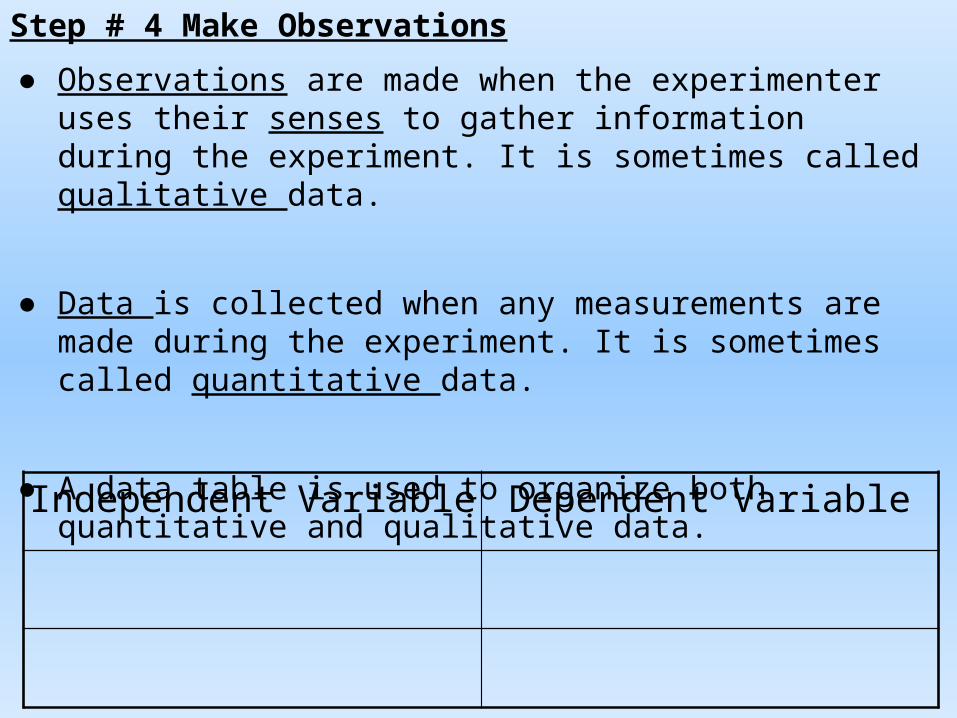
Step # 4 Make Observations
● Observations are made when the experimenter uses their senses to gather information during the experiment. It is sometimes called qualitative data.
● Data is collected when any measurements are made during the experiment. It is sometimes called quantitative data.
● A data table is used to organize both quantitative and qualitative data.Independent Variable Dependent Variable

Step # 5 Conclusion
It states whether or not the data supports or refutes the hypothesis.
Example:
All the plants that received the Miracle Gro showed an improvement in their growth. After a two month period they grew approximately 2cm more than the group that did not get the Miracle Gro. My results support my hypothesis.
GraphingGraphs are helpful because they create pictures of the data collected. They can show trends, patterns or relationships that may exist within the data.

Line Graphs
● Line graphs are the most common type used in Biology!
● Line graphs are usually used to show time series data - that is how one or more variables change over a continuous period of time
● Line graphs can also be appropriate for displaying data that are measured over other continuous variables such as temperature or pH ranges.
● Line graphs are particularly useful for identifying patterns and trends in the data

Locate your Y axis!This is where you will place the
independent variable.
Y Axis

Locate your X axis!This is where you will place the
dependent variable.
X Axis

Title your Graph!Here’s a few simple tips:
● Steal the name for the graph from up above the data table!
OR
● Substitute the actual names for the independent and dependent variables into the following statement:
● The effect of independent variable on the dependent variable.

Determining Range and Scale !
● Decide on an appropriate scale for each axis.
● Choose a scale that lets you make the graph as large as possible for your paper and data.
● Scale is determined by your highest & lowest values found on each side of the data table.
● Each axis will have it’s own scale.

How to determine Scale
• For the x axis, it will be 2002 minus 1995. That is a difference of 7.
• For the y axis, it will be 2600 minus 2000.That is a difference of 600.
Xaxis
Yaxis

How to determine Intervals• An interval is the amount of space between one number
on a graph to the next number or one type of data to the next type of data.
• Each interval on an axis should be of equal value and evenly spaced.
• The interval is decided by using your range.
• It is always best to try to go with the smallest interval possible as this will spread the data out over the greatest area.

● It is not necessary to start your scale at zero.
● Do not use breaks in your graph.
Minnesota Wolf Population
2000
2100
2200
2300
2400
2500
2600
2700
Years
Est
ima
ted
Po
pula
tion
95 96 97 98 99 00 01 02

Interpreting Graphs• Graphs not only have the data, but they
show changes in the data.
• When interpreting graphs you are basically making an observation as to how the dependent variable on the x axis is responding to the independent variable on the y axis.
• This allows you to see if there is some type of pattern or trend in the data.
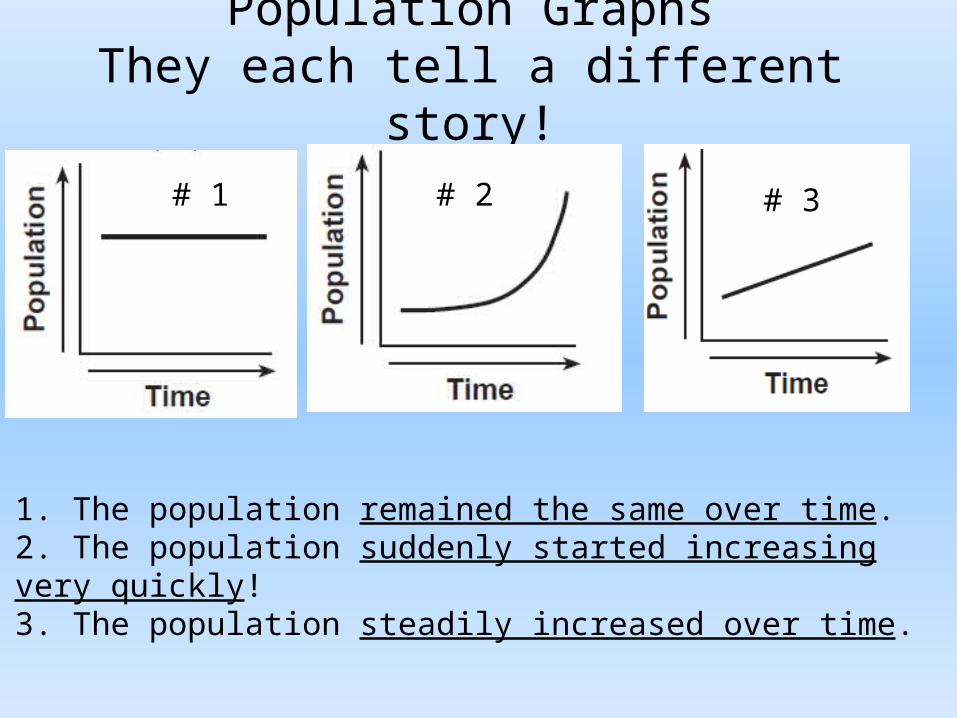
Population GraphsThey each tell a different story!
1. The population remained the same over time.2. The population suddenly started increasing very quickly! 3. The population steadily increased over time.
# 1 # 2 # 3

Bar Graphs• They are used to display and compare the number,
frequency or other measures for different categories or groups of things.
• Since the x-axis (the horizontal axis) represents the different categories it has no scale.
• The y-axis (the vertical axis) does have a scale and this indicates the units of measurement.
• There are various ways in which bar graphs can be constructed and this makes them very flexible.

Examples of Bar Graphs

Horizontal or Vertical ?
● It doesn’t make any difference! ● The graph still says the same thing!