welcome to orbs indicator trading! (opening range breakout)
TRANSCRIPT


Welcome to ORBS Indicator Trading!(Opening Range Breakout)
http://www.smartsetups.com/opening-range-breakout/

Risk DisclaimerTrading or investing carries a high level of risk, and is not suitable for all persons. Before deciding to trade or invest you should carefully consider your investment objectives, level of experience, and ability to tolerate risk. This content is subject to change at any time without notice, and is provided for the sole purpose of education and assistance in making independent investment decisions. SmartSetups.com has taken reasonable measures to ensure the accuracy of the information contained herein; however, SmartSetups.com does not guarantee its accuracy and is not liable for any loss or damage which may result directly or indirectly from such content or from an inability to access such information or any delay in or failure of the transmission or the receipt of any instruction or notification in connection therewith. Any past performance results are shown for illustration and example only, are hypothetical and as such have many inherent limitations. No representation is being made that any account will or is likely to achieve profits or losses similar to those shown. Past performance is not necessarily indicative of future results.

Hypothetical Risk DisclaimerU.S. Government Required Disclaimer - Commodity Futures Trading Commission Futures and Options trading has large potential rewards, but also large potential risk. You must be aware of the risks and be willing to accept them in order to invest in the futures and options markets. Don't trade with money you can't afford to lose. This is neither a solicitation nor an offer to Buy/Sell futures, stocks or options on the same. No representation is being made that any account will or is likely to achieve profits or losses similar to those discussed on this web site. The past performance of any trading system or methodology is not necessarily indicative of future results.
CFTC RULE 4.41 - HYPOTHETICAL OR SIMULATED PERFORMANCE RESULTS HAVE CERTAIN LIMITATIONS. UNLIKE AN ACTUAL PERFORMANCE RECORD, SIMULATED RESULTS DO NOT REPRESENT ACTUAL TRADING. ALSO, SINCE THE TRADES HAVE NOT BEEN EXECUTED, THE RESULTS MAY HAVE UNDER-OR-OVER COMPENSATED FOR THE IMPACT, IF ANY, OF CERTAIN MARKET FACTORS, SUCH AS LACK OF LIQUIDITY. SIMULATED TRADING PROGRAMS IN GENERAL ARE ALSO SUBJECT TO THE FACT THAT THEY ARE DESIGNED WITH THE BENEFIT OF HINDSIGHT. NO REPRESENTATION IS BEING MADE THAT ANY ACCOUNT WILL OR IS LIKELY TO ACHIEVE PROFIT OR LOSSES SIMILAR TO THOSE SHOWN.
NO REPRESENTATION IS BEING MADE THAT ANY ACCOUNT WILL, OR IS LIKELY TO ACHIEVE PROFITS OR LOSSES SIMILAR TO THOSE DISCUSSED WITHIN THIS SITE, SUPPORT AND TEXTS. OUR COURSE(S), PRODUCTS AND SERVICES SHOULD BE USED AS LEARNING AIDS ONLY AND SHOULD NOT BE USED TO INVEST REAL MONEY. IF YOU DECIDE TO INVEST REAL MONEY, ALL TRADING DECISIONS SHOULD BE YOUR OWN.

Background● Hubert Senters is one of the leading Active Investors and Professional traders In the World. His Daily trading research is followed by over 98,329 people that follow his daily research.● He is the Co-Founder of TradeTheMarkets.com, which is an INC 500 fastest growing company.● He is also a frequent guest speaker for Many Trading Exchanges including the CME, CBOT, ICE, and Eurex.● He and His Companies/Experts have been featured guests on: CNBC, Bloomberg, Fox business, CNN, CBS Market Watch, Forbes, The Street, Active Trader Magazine, Stocks and Commodities Magazine, Money Show and Traders Expo.● Hubert holds a Series 3 & 30 License and is a Principal at Razor Trading holdings.● Hubert currently resides in Versailles, Kentucky with Lisa, his wife of 20 years, and their three kids Mackenzie, Morgan and Mason. You can usually find them at one of the kids sporting events.
Hubert Senters

Background● Private trader since 1989 with Stocks, Futures, FOREX, and Options.● Professional Hedge Fund Manager for almost 20 years● Author of “Dynamic Trading Indicators”● Top New CTAs 1998 Futures Magazine● Two Time Managed Funds Star Search (2003 & 2008)● Developed Patented ValueCharts®Mark Helweg

ORBS Indicator
A roadmap for trading

Traders need a game plan before the trading day begins.
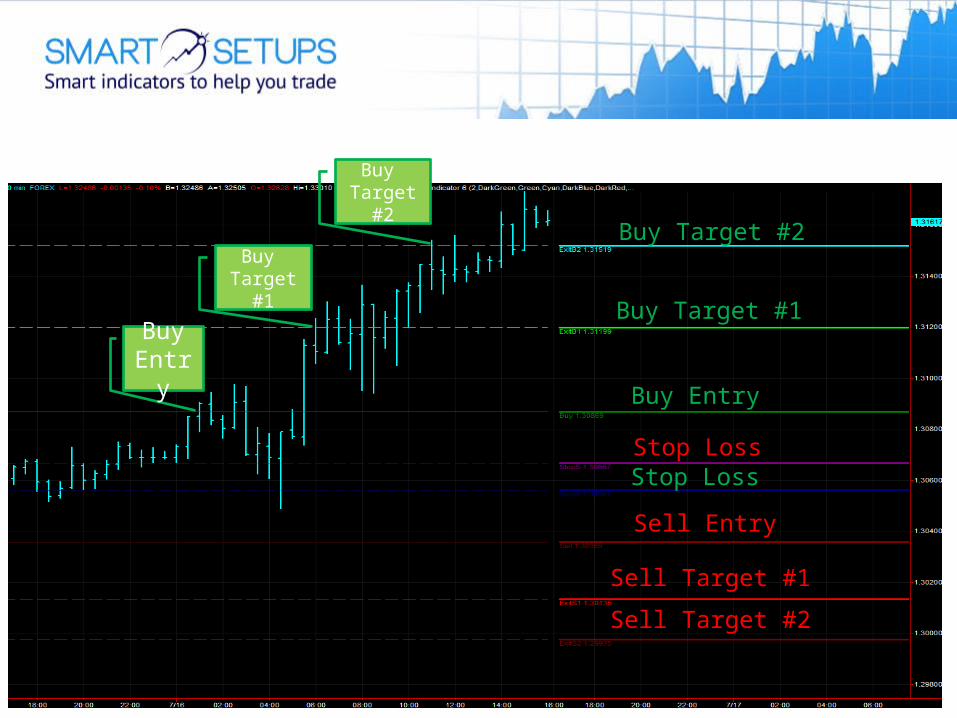
ORBS Indicator

● Buy Entry ● Stop Loss● Buy Target #1● Buy Target #2
ORBS Indicator Levels
● Sell Entry● Stop Loss● Sell Target #1● Sell Target #2

ORBS IndicatorTrading Rules
1. The ORB Indicator Levels are Determined at the Open of the Session.2. Enter trade at Buy Level (for Buy Signal) or Sell Level (for Sell Signal).3. Exit Trade at Stop Level if hit before Target Level.4. Consider partial or full exit at Target #1.5. Consider partial or full exit at Target #2.6. Consider re-entry if market holds Daily Open Level.7. Use filters to confirm trend and market direction.
Note: Trade execution, slippage, and transaction costs will effect potential gain or loss per trade.

Buy Entry
Buy Target #1
Buy Target #2
Stop LossStop Loss
Sell Entry
Sell Target #1
Sell Target #2

Buy Entry
Buy Target #1
Buy Target #2
Stop LossStop Loss
Sell Entry
Sell Target #1
Sell Target #2
Buy Entry

Buy Entry
Buy Target #1
Buy Target #2
Stop LossStop Loss
Sell Entry
Sell Target #1
Sell Target #2
Buy Entry
Buy Target #1
Buy Entry
Buy Target #1
Buy Target #2
Stop LossStop Loss
Sell Entry
Sell Target #1
Sell Target #2
Buy Entry
Buy Target #1
Buy Target #2

Stop Loss
Stop Loss
Sell Entry
Sell Target #1
Sell Target #2

Stop Loss
Stop Loss
Sell Entry
Sell Target #1
Sell Target #2
SellEntry

Stop Loss
Stop Loss
Sell Entry
Sell Target #1
Sell Target #2
SellEntry
SellTarget #1

Stop Loss
Stop Loss
Sell Entry
Sell Target #1
Sell Target #2
SellEntry
SellTarget #1
SellTarget #2

SellEntry

SellEntry
SellTarget #1

SellEntry
SellTarget #1
SellTarget #2

Buy Entry
Buy Target #1
Buy Stop Loss
Buy Target #1

Buy Entry
Buy Target #1
Buy Stop Loss
Stop Loss
Buy Target #1
Hypothetical Risk DisclaimerU.S. Government Required Disclaimer - Commodity Futures Trading Commission Futures and Options trading has large potential rewards, but also large potential risk. You must be aware of the risks and be willing to accept them in order to invest in the futures and options markets. Don't trade with money you can't afford to lose. This is neither a solicitation nor an offer to Buy/Sell futures, stocks or options on the same. No representation is being made that any account will or is likely to achieve profits or losses similar to those discussed on this web site. The past performance of any trading system or methodology is not necessarily indicative of future results.
CFTC RULE 4.41 - HYPOTHETICAL OR SIMULATED PERFORMANCE RESULTS HAVE CERTAIN LIMITATIONS. UNLIKE AN ACTUAL PERFORMANCE RECORD, SIMULATED RESULTS DO NOT REPRESENT ACTUAL TRADING. ALSO, SINCE THE TRADES HAVE NOT BEEN EXECUTED, THE RESULTS MAY HAVE UNDER-OR-OVER COMPENSATED FOR THE IMPACT, IF ANY, OF CERTAIN MARKET FACTORS, SUCH AS LACK OF LIQUIDITY. SIMULATED TRADING PROGRAMS IN GENERAL ARE ALSO SUBJECT TO THE FACT THAT THEY ARE DESIGNED WITH THE BENEFIT OF HINDSIGHT. NO REPRESENTATION IS BEING MADE THAT ANY ACCOUNT WILL OR IS LIKELY TO ACHIEVE PROFIT OR LOSSES SIMILAR TO THOSE SHOWN.
NO REPRESENTATION IS BEING MADE THAT ANY ACCOUNT WILL, OR IS LIKELY TO ACHIEVE PROFITS OR LOSSES SIMILAR TO THOSE DISCUSSED WITHIN THIS SITE, SUPPORT AND TEXTS. OUR COURSE(S), PRODUCTS AND SERVICES SHOULD BE USED AS LEARNING AIDS ONLY AND SHOULD NOT BE USED TO INVEST REAL MONEY. IF YOU DECIDE TO INVEST REAL MONEY, ALL TRADING DECISIONS SHOULD BE YOUR OWN.

ORBS IndicatorSimulated Testing Rules
1. Only 1 Buy and 1 Sell Signal are taken per session (per day).2. Buy Signal is taken if Buy Line is hit/Sell Signal is taken if Sell Line is hit.3. If Stop Loss is hit before Profit Target #1, trade is a counted as a loss.4. If Profit Target is reached before Stop Loss, Profit Target level is exit.5. Profit Target #1 is taken if market only reaches Profit Target #1.6. Profit Target #2 is taken if market only reaches Profit Target #2.
Note: Trade execution, slippage, and transaction costs will effect potential gain or loss per trade. Read Hypothetical Risk Disclaimer.

Date EURUSD GBPUSD USDCHF AUDUSD EURJPY
Jun-12 232 328 242 383 160
Jul-12 353 205 313 249 226
Aug-12 478 173 355 220 117
Sep-12 385 232 253 394 207
Oct-12 530 292 385 213 362
Nov-12 335 147 271 68 148
Dec-12 407 409 259 158 481
Jan-13 295 485 213 158 21
Feb-13 349 321 200 42 -45
Mar-13 433 359 301 325 330
Apr-13 455 619 220 158 -59
May-13 371 383 568 337 -124
Total: 4623 3953 3580 2705 1824
Average: 385 329 298 225 152
ORBS Simulated Results (Pips/Ticks)
CFTC RULE 4.41 - HYPOTHETICAL OR SIMULATED PERFORMANCE RESULTS HAVE CERTAIN LIMITATIONS. UNLIKE AN ACTUAL PERFORMANCE RECORD, SIMULATED RESULTS DO NOT REPRESENT ACTUAL TRADING. ALSO, SINCE THE TRADES HAVE NOT BEEN EXECUTED, THE RESULTS MAY HAVE UNDER-OR-OVER COMPENSATED FOR THE IMPACT, IF ANY, OF CERTAIN MARKET FACTORS, SUCH AS LACK OF LIQUIDITY. SIMULATED TRADING PROGRAMS IN GENERAL ARE ALSO SUBJECT TO THE FACT THAT THEY ARE DESIGNED WITH THE BENEFIT OF HINDSIGHT. NO REPRESENTATION IS BEING MADE THAT ANY ACCOUNT WILL OR IS LIKELY TO ACHIEVE PROFIT OR LOSSES SIMILAR TO THOSE SHOWN.
NO REPRESENTATION IS BEING MADE THAT ANY ACCOUNT WILL, OR IS LIKELY TO ACHIEVE PROFITS OR LOSSES SIMILAR TO THOSE DISCUSSED WITHIN THIS SITE, SUPPORT AND TEXTS. OUR COURSE(S), PRODUCTS AND SERVICES SHOULD BE USED AS LEARNING AIDS ONLY AND SHOULD NOT BE USED TO INVEST REAL MONEY. IF YOU DECIDE TO INVEST REAL MONEY, ALL TRADING DECISIONS SHOULD BE YOUR OWN. Results do not include slippage or commission costs.

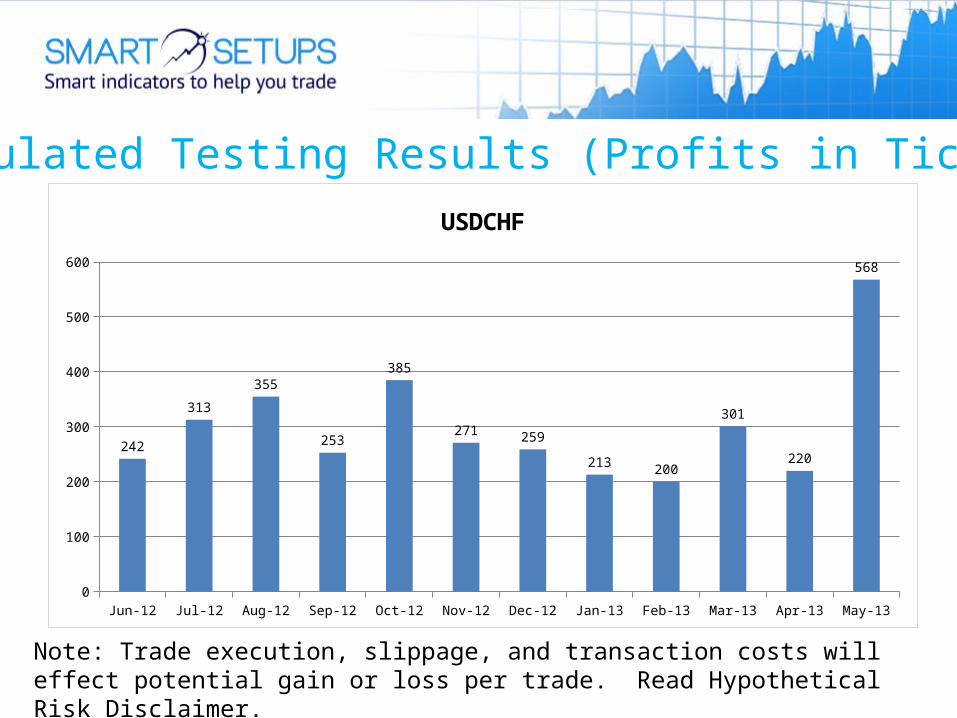
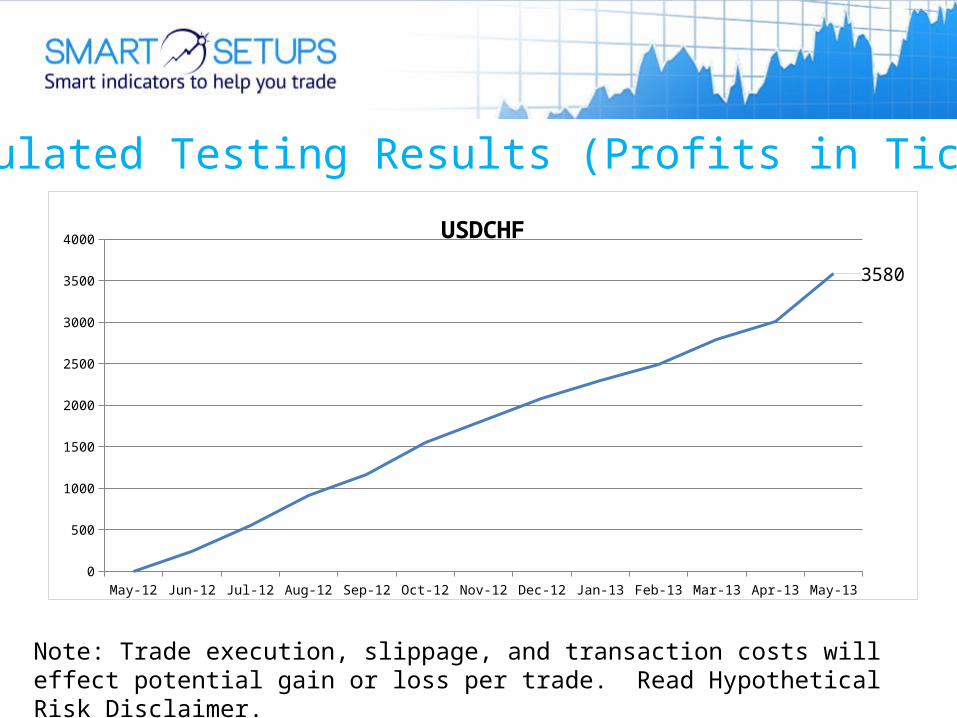
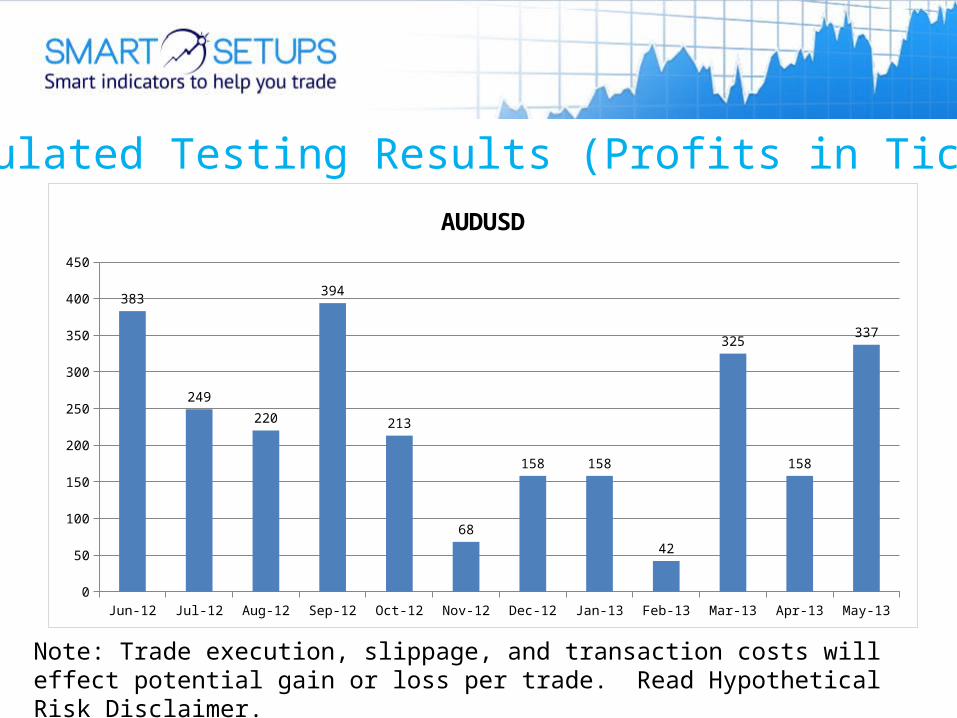
Simulated Testing Results (Profits in Ticks)
Note: Trade execution, slippage, and transaction costs will effect potential gain or loss per trade. Read Hypothetical Risk Disclaimer.
Jun-12 Jul-12 Aug-12 Sep-12 Oct-12 Nov-12 Dec-12 Jan-13 Feb-13 Mar-13 Apr-13 May-130
100
200
300
400
500
600
232
353
478
385
530
335
407
295
349
433455
371
EURUSD

Note: Trade execution, slippage, and transaction costs will effect potential gain or loss per trade. Read Hypothetical Risk Disclaimer.
Simulated Testing Results (Profits in Ticks)
May-12 Jun-12 Jul-12 Aug-12 Sep-12 Oct-12 Nov-12 Dec-12 Jan-13 Feb-13 Mar-13 Apr-13 May-130
500
1000
1500
2000
2500
3000
3500
4000
4500
5000
4623
EURUSD

Simulated Testing Results (Profits in Ticks)
Note: Trade execution, slippage, and transaction costs will effect potential gain or loss per trade. Read Hypothetical Risk Disclaimer.
Jun-12 Jul-12 Aug-12 Sep-12 Oct-12 Nov-12 Dec-12 Jan-13 Feb-13 Mar-13 Apr-13 May-130
100
200
300
400
500
600
700
328
205173
232
292
147
409
485
321359
619
383
GBPUSD

Note: Trade execution, slippage, and transaction costs will effect potential gain or loss per trade. Read Hypothetical Risk Disclaimer.
Simulated Testing Results (Profits in Ticks)
May-12 Jun-12 Jul-12 Aug-12 Sep-12 Oct-12 Nov-12 Dec-12 Jan-13 Feb-13 Mar-13 Apr-13 May-130
500
1000
1500
2000
2500
3000
3500
4000
4500
3953
GBPUSD
Simulated Testing Results (Profits in Ticks)
Note: Trade execution, slippage, and transaction costs will effect potential gain or loss per trade. Read Hypothetical Risk Disclaimer.
Jun-12 Jul-12 Aug-12 Sep-12 Oct-12 Nov-12 Dec-12 Jan-13 Feb-13 Mar-13 Apr-13 May-130
100
200
300
400
500
600
242
313
355
253
385
271 259
213 200
301
220
568
USDCHF
Note: Trade execution, slippage, and transaction costs will effect potential gain or loss per trade. Read Hypothetical Risk Disclaimer.
Simulated Testing Results (Profits in Ticks)
May-12 Jun-12 Jul-12 Aug-12 Sep-12 Oct-12 Nov-12 Dec-12 Jan-13 Feb-13 Mar-13 Apr-13 May-130
500
1000
1500
2000
2500
3000
3500
4000
3580
USDCHF
Simulated Testing Results (Profits in Ticks)
Note: Trade execution, slippage, and transaction costs will effect potential gain or loss per trade. Read Hypothetical Risk Disclaimer.
Jun-12 Jul-12 Aug-12 Sep-12 Oct-12 Nov-12 Dec-12 Jan-13 Feb-13 Mar-13 Apr-13 May-130
50
100
150
200
250
300
350
400
450
383
249
220
394
213
68
158 158
42
325
158
337
AUDUSD

Note: Trade execution, slippage, and transaction costs will effect potential gain or loss per trade. Read Hypothetical Risk Disclaimer.
Simulated Testing Results (Profits in Ticks)
May-12 Jun-12 Jul-12 Aug-12 Sep-12 Oct-12 Nov-12 Dec-12 Jan-13 Feb-13 Mar-13 Apr-13 May-130
500
1000
1500
2000
2500
3000
2705
AUDUSD

Simulated Testing Results (Profits in Ticks)
Note: Trade execution, slippage, and transaction costs will effect potential gain or loss per trade. Read Hypothetical Risk Disclaimer.
Jun-12 Jul-12 Aug-12 Sep-12 Oct-12 Nov-12 Dec-12 Jan-13 Feb-13 Mar-13 Apr-13 May-13
-200
-100
0
100
200
300
400
500
600
160
226
117
207
362
148
481
21
-45
330
-59
-124
EURJPY

Note: Trade execution, slippage, and transaction costs will effect potential gain or loss per trade. Read Hypothetical Risk Disclaimer.
Simulated Testing Results (Profits in Ticks)
May-12 Jun-12 Jul-12 Aug-12 Sep-12 Oct-12 Nov-12 Dec-12 Jan-13 Feb-13 Mar-13 Apr-13 May-130
500
1000
1500
2000
2500
1824
EURJPY

ORBS Simulated Results (Pips/Ticks)
CFTC RULE 4.41 - HYPOTHETICAL OR SIMULATED PERFORMANCE RESULTS HAVE CERTAIN LIMITATIONS. UNLIKE AN ACTUAL PERFORMANCE RECORD, SIMULATED RESULTS DO NOT REPRESENT ACTUAL TRADING. ALSO, SINCE THE TRADES HAVE NOT BEEN EXECUTED, THE RESULTS MAY HAVE UNDER-OR-OVER COMPENSATED FOR THE IMPACT, IF ANY, OF CERTAIN MARKET FACTORS, SUCH AS LACK OF LIQUIDITY. SIMULATED TRADING PROGRAMS IN GENERAL ARE ALSO SUBJECT TO THE FACT THAT THEY ARE DESIGNED WITH THE BENEFIT OF HINDSIGHT. NO REPRESENTATION IS BEING MADE THAT ANY ACCOUNT WILL OR IS LIKELY TO ACHIEVE PROFIT OR LOSSES SIMILAR TO THOSE SHOWN.
NO REPRESENTATION IS BEING MADE THAT ANY ACCOUNT WILL, OR IS LIKELY TO ACHIEVE PROFITS OR LOSSES SIMILAR TO THOSE DISCUSSED WITHIN THIS SITE, SUPPORT AND TEXTS. OUR COURSE(S), PRODUCTS AND SERVICES SHOULD BE USED AS LEARNING AIDS ONLY AND SHOULD NOT BE USED TO INVEST REAL MONEY. IF YOU DECIDE TO INVEST REAL MONEY, ALL TRADING DECISIONS SHOULD BE YOUR OWN. Results do not include slippage or commission costs.
Date Crude Oil Gold 30 Year Bonds Emini S&P 500 Soybeans
Jun-12 886 549 219 -25 437
Jul-12 1014 235 73 -106 285
Aug-12 129 -615 33 -240 1104
Sep-12 431 569 91 60 586
Oct-12 85 166 181 16 1359
Nov-12 522 47 33 -136 551
Dec-12 -92 234 -2 -15 -81
Jan-13 6 57 6 -28 -155
Feb-13 52 -270 -2 15 319
Mar-13 446 -190 1 222 -451
Apr-13 688 1089 13 308 477
May-13 895 695 49 -5 402
Total: 5062 2566 695 66 4833
Average: 421 213 57 5.5 402.75

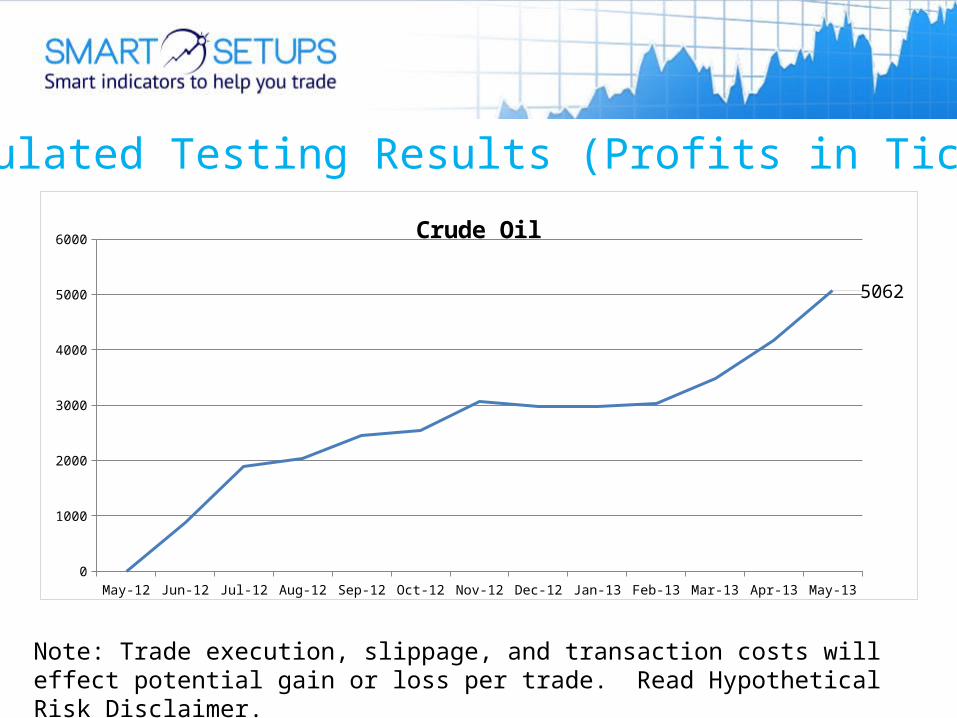
Simulated Testing Results (Profits in Ticks)
Note: Trade execution, slippage, and transaction costs will effect potential gain or loss per trade. Read Hypothetical Risk Disclaimer.
Jun-12 Jul-12 Aug-12 Sep-12 Oct-12 Nov-12 Dec-12 Jan-13 Feb-13 Mar-13 Apr-13 May-13
-200
0
200
400
600
800
1000
1200
886
1014
129
431
85
522
-92
652
446
688
895
Crude Oil
Note: Trade execution, slippage, and transaction costs will effect potential gain or loss per trade. Read Hypothetical Risk Disclaimer.
Simulated Testing Results (Profits in Ticks)
May-12 Jun-12 Jul-12 Aug-12 Sep-12 Oct-12 Nov-12 Dec-12 Jan-13 Feb-13 Mar-13 Apr-13 May-130
1000
2000
3000
4000
5000
6000
5062
Crude Oil

Simulated Testing Results (Profits in Ticks)
Note: Trade execution, slippage, and transaction costs will effect potential gain or loss per trade. Read Hypothetical Risk Disclaimer.
Jun-12 Jul-12 Aug-12 Sep-12 Oct-12 Nov-12 Dec-12 Jan-13 Feb-13 Mar-13 Apr-13 May-13
-800
-600
-400
-200
0
200
400
600
800
1000
1200
549
235
-615
569
166
47
234
57
-270-190
1089
695
Gold

Note: Trade execution, slippage, and transaction costs will effect potential gain or loss per trade. Read Hypothetical Risk Disclaimer.
Simulated Testing Results (Profits in Ticks)
May-12 Jun-12 Jul-12 Aug-12 Sep-12 Oct-12 Nov-12 Dec-12 Jan-13 Feb-13 Mar-13 Apr-13 May-130
500
1000
1500
2000
2500
3000
2566
Gold
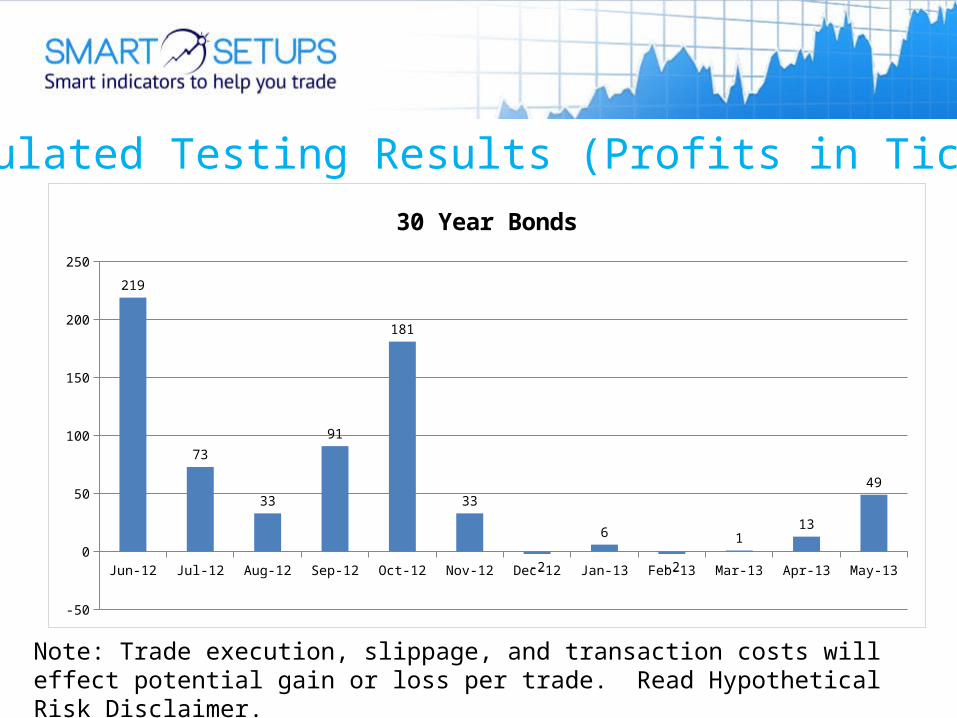
Simulated Testing Results (Profits in Ticks)
Note: Trade execution, slippage, and transaction costs will effect potential gain or loss per trade. Read Hypothetical Risk Disclaimer.
Jun-12 Jul-12 Aug-12 Sep-12 Oct-12 Nov-12 Dec-12 Jan-13 Feb-13 Mar-13 Apr-13 May-13
-50
0
50
100
150
200
250
219
73
33
91
181
33
-2
6
-2
113
49
30 Year Bonds

Note: Trade execution, slippage, and transaction costs will effect potential gain or loss per trade. Read Hypothetical Risk Disclaimer.
Simulated Testing Results (Profits in Ticks)
May-12 Jun-12 Jul-12 Aug-12 Sep-12 Oct-12 Nov-12 Dec-12 Jan-13 Feb-13 Mar-13 Apr-13 May-130
100
200
300
400
500
600
700
800
695
30 Year Bonds

Simulated Testing Results (Profits in Ticks)
Note: Trade execution, slippage, and transaction costs will effect potential gain or loss per trade. Read Hypothetical Risk Disclaimer.
Jun-12 Jul-12 Aug-12 Sep-12 Oct-12 Nov-12 Dec-12 Jan-13 Feb-13 Mar-13 Apr-13 May-13
-300
-200
-100
0
100
200
300
400
-25
-106
-240
60
16
-136
-15 -28
15
222
308
-5
Emini S&P 500

Note: Trade execution, slippage, and transaction costs will effect potential gain or loss per trade. Read Hypothetical Risk Disclaimer.
Simulated Testing Results (Profits in Ticks)
May-12 Jun-12 Jul-12 Aug-12 Sep-12 Oct-12 Nov-12 Dec-12 Jan-13 Feb-13 Mar-13 Apr-13 May-13
-600
-500
-400
-300
-200
-100
0
100
200
66
Emini S&P 500

Simulated Testing Results (Profits in Ticks)
Note: Trade execution, slippage, and transaction costs will effect potential gain or loss per trade. Read Hypothetical Risk Disclaimer.
Jun-12 Jul-12 Aug-12 Sep-12 Oct-12 Nov-12 Dec-12 Jan-13 Feb-13 Mar-13 Apr-13 May-13
-1000
-500
0
500
1000
1500
437
285
1104
586
1359
551
-81-155
319
-451
477402
Soybeans

Note: Trade execution, slippage, and transaction costs will effect potential gain or loss per trade. Read Hypothetical Risk Disclaimer.
Simulated Testing Results (Profits in Ticks)
May-12 Jun-12 Jul-12 Aug-12 Sep-12 Oct-12 Nov-12 Dec-12 Jan-13 Feb-13 Mar-13 Apr-13 May-130
1000
2000
3000
4000
5000
6000
4833
Soybeans

ORBS IndicatorLive Trading Examples