welcome to physics 40! - santa rosa junior collegelwillia2/40/40lab1lecture_s14.pdf · include the...
TRANSCRIPT

Welcome to Physics 40!

Physics for Scientists and Engineers
Lab 1: Introduction to Measurement

SI Quantities & Units • In mechanics, three basic quantities are used
– Length, Mass, Time • Will also use derived quantities
– Ex: Joule, Newton, etc. • SI – Systéme International
– agreed to in 1960 by an international committee

Density: A derived Quantity
• Density is an example of a derived quantity • It is defined as mass per unit volume • Units are kg/m3
mV
ρ ≡

Length: METER
The meter is defined to be the distance light travels through a vacuum in exactly 1/299792458
seconds. 1 m is about 39.37 inches. I inch is about 2.54 cm.

Powers of Ten!

Mass: Kilogram • Units
– SI – kilogram, kg • Defined in terms of a
kilogram, based on a specific cylinder kept at the International Bureau of Standards
• Mass is Energy! (Physcis 43)

Time: Second
• Units – seconds, s
• Defined in terms of the oscillation of radiation from a cesium atom

Prefixes
• The prefixes can be used with any base units
• They are multipliers of the base unit
• Examples: – 1 mm = 10-3 m – 1 mg = 10-3 g


To convert from one unit to another, multiply by conversion factors that are equal to one.


To convert from one unit to another, multiply by conversion factors that are equal to one.
Example: 32 km = ? nm 1. 1km = 103 m 2 1 nm = 10-9 m
3 910 10321 1
m nmkmkm m
3 932 10 10 nm= × ×
133.2 10 nm= ×

1 light year = 9.46 x 10¹⁵m 1 mile = 1.6 km
How many miles in a light year?
15
3
9.46 10 111 1.6 10
m milelyly m
× ×
125.9 10 miles= ×

1 light year = 9.46 x 10¹⁵m 1 mile = 1.6 km
~ 6 Trillion Miles!!! Closest Star: Proxima Centauri 4.3 ly Closest Galaxy: Andromeda Galaxy 2.2 million ly

It had long been known that Andromeda is rushing towards Earth at about 250,000 miles per hour -- or about the distance from Earth to the moon. They will collide in 4 billion years!


Significant Figures
• A significant figure is one that is reliably known
• Zeros may or may not be significant – Those used to position the decimal point are not
significant – To remove ambiguity, use scientific notation
• In a measurement, the significant figures include the first estimated digit
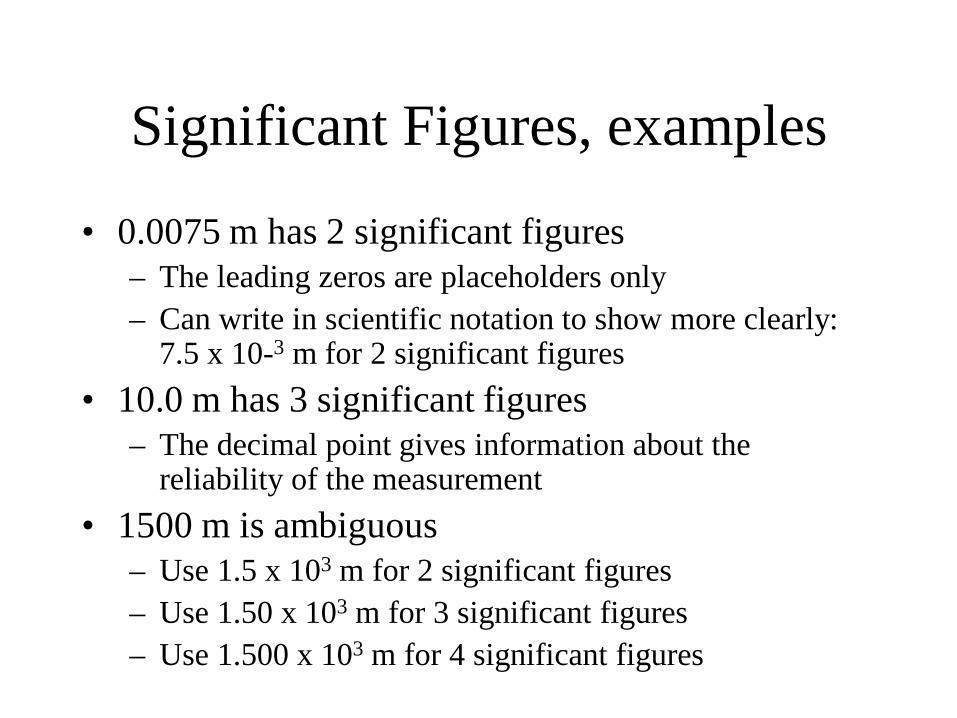
Significant Figures, examples
• 0.0075 m has 2 significant figures – The leading zeros are placeholders only – Can write in scientific notation to show more clearly:
7.5 x 10⁻³ m for 2 significant figures • 10.0 m has 3 significant figures
– The decimal point gives information about the reliability of the measurement
• 1500 m is ambiguous – Use 1.5 x 10³ m for 2 significant figures – Use 1.50 x 10³ m for 3 significant figures – Use 1.500 x 10³ m for 4 significant figures

Sig Fis & Scientific Notation


Rounding
• Last retained digit is increased by 1 if the last digit dropped is 5 or above
• Last retained digit remains as it is if the last digit dropped is less than 5
• If the last digit dropped is equal to 5, the retained digit should be rounded to the nearest even number
• Saving rounding until the final result will help eliminate accumulation of errors
• Keep a few extra terms for intermediate calculations
Round Each to 3 Sig Figs
• 124.65 • 0.003255 • 12.25 • 3675

Plate Problem
A rectangular plate has a length of 21.3 cm and a width of 9.8 cm. Calculate the area of the plate, and the number of significant figures.
A = 21.3cm x 9.8cm = 208.74cm2
A = 210cm2
How many significant figures? 2

Operations with Significant Figures – Multiplying or Dividing
• When multiplying or dividing, the number of significant figures in the final answer is the same as the number of significant figures in the quantity having the lowest number of significant figures.
• Example: 25.57 m x 2.45 m = 62.6465 m2 – The 2.45 m limits your result to 3 significant
figures: 62.6m2

Operations with Significant Figures – Adding or Subtracting
• When adding or subtracting, the number of decimal places in the result should equal the smallest number of decimal places in any term in the sum.
• Example: 135 cm + 3.25 cm = 138 cm – The 135 cm limits your answer to the units
decimal value


Operations With Significant Figures – Summary
• The rule for addition and subtraction are different than the rule for multiplication and division
• For adding and subtracting, the number of decimal places is the important consideration
• For multiplying and dividing, the number of significant figures is the important consideration

Significant Figure RULES of Class
• For problems on HW, Quizzes and Exams assume THREE significant figures.
• For lab, the number of significant figures is based on the precision of your measuring device. VERY IMPORTANT!!!!!

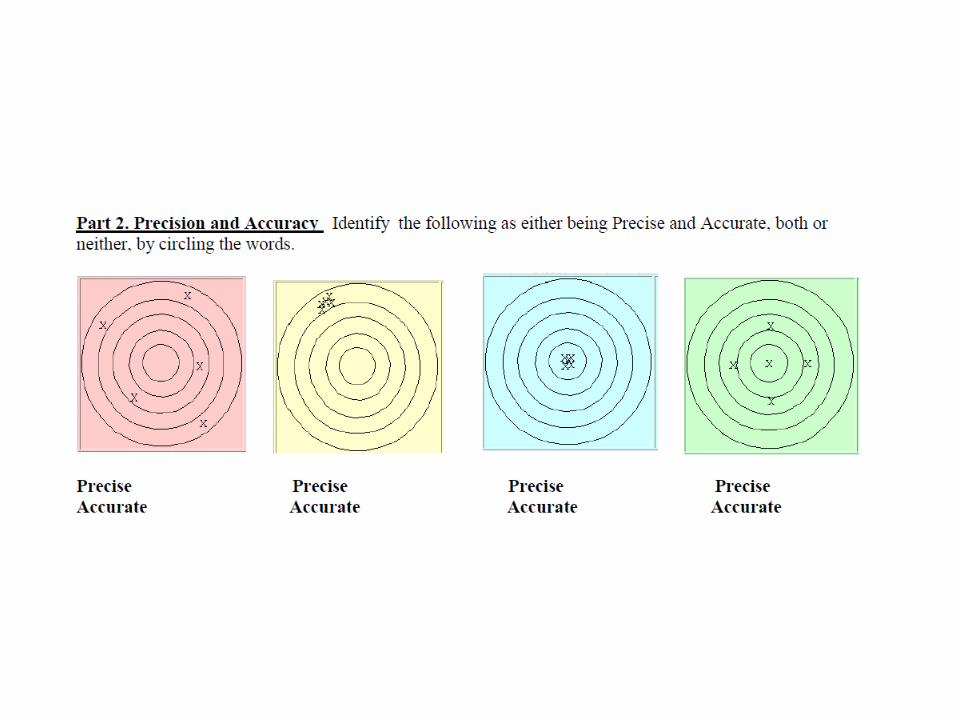
Precision & Accuracy
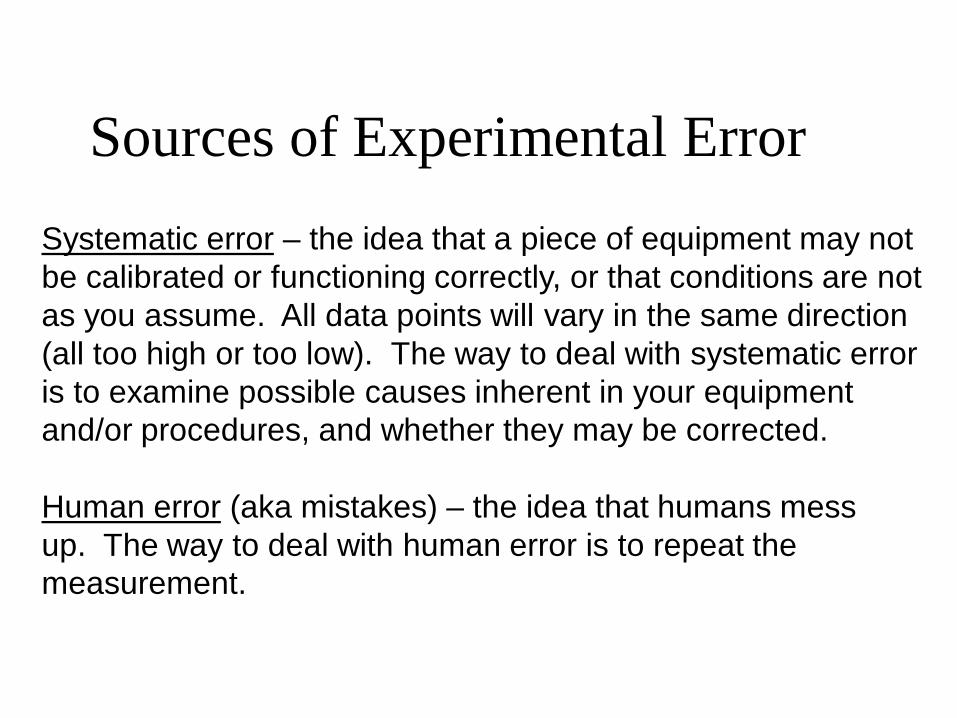
Systematic error – the idea that a piece of equipment may not be calibrated or functioning correctly, or that conditions are not as you assume. All data points will vary in the same direction (all too high or too low). The way to deal with systematic error is to examine possible causes inherent in your equipment and/or procedures, and whether they may be corrected. Human error (aka mistakes) – the idea that humans mess up. The way to deal with human error is to repeat the measurement.
Sources of Experimental Error

Don’t Trust your Eyes! Parallax & Optical Illusions

Every Measurement has an Uncertainty!
If you are using a scale such as a ruler to measure the length of an object, then your uncertainty is usually estimated to be one tenth the smallest division. For example, this bug has a length between 1.54 and 1.56 in or
1.55 /- 0.01L in in= + The 1.55in is the average measure and the 0.01in is the uncertainty.
M M± ∆

Discrepancy & Percent Difference

In Sum….
• Every measurement has an uncertainty • Multiple measurements – use statistics • Single measurements – use propagation • Different sources of Experimental ERROR • Precision vs Accuracy • Discrepancy vs Error vs Uncertainty • More on Error Analysis soon!


Statistical Uncertainty
Random fluctuation – the idea that the actual quantity may vary slightly around some central value. It is assumed that the variations go in both directions equally. The way to deal with random fluctuation is to take several measurements of the same quantity and calculate the average. The uncertainty is given by the average deviation.
Average value of n measurements of x = ∑xi /n
Deviation in xi = ∆xi = xi–x avg Average Deviation: ∆x = ∑∆xi /n

Uncertainty in Measurements • Uncertainty (error) is unavoidable in measurement. • Uncertainty in a measurement, M, can have the symbol DM or dM • Expressed in two ways: absolute or fractional. • Absolute: uses same units as the measured quantity: (21.3 +/- 0.2) cm Fractional: the uncertainty is expressed as a fraction or a percent of the measured quantity: 0.2cm/21.3cm = .009 =.9% 21.3cm +/- .9% Uncertainty is propagated in calculations. There are two simple rules:
1) If any two quantities are added or subtracted, you add the absolute uncertainties to find the absolute uncertainty of the result. 2) If any two quantities are multiplied or divided, add the fractional (or percent) uncertainties to obtain the fractional (percent) uncertainty in the result: A L W
A L W∆ ∆ ∆
= +

Read Chapter 1 & 2 ASAP!

Uncertainty in Measurements Uncertainty arises primarily because no piece of measuring equipment is infinitely precise (sensitive) or infinitely accurate (correct). When you make measurements in these labs, you need to estimate the uncertainty of each measurement you make, and record it in your lab report. You also need to take those estimated uncertainties and determine the uncertainty in the results you calculate.
• Uncertainty (error) is unavoidable in measurement.
• Uncertainty in a measurement, M, can have the symbol DM or dM
• Measured values are reported as: M M± ∆

Sample Problem Using Averages (not on handout)
Example: You have performed an experiment in which you timed the fall of a mass. You got the following values, all in seconds: 12.24, 12.32, 12.25, 12.11 The average value of these times is the sum of the values, divided by 4 (the number of measurements): 12.24 + 12.32 + 12.25 + 12.11 = 48.92 48.92 ÷ 4 = 12.23 So 12.23 is the average value.
Average value of n measurements of x = ∑xi /n Deviation in xi = ∆xi = xi–x avg Average Deviation: ∆x = ∑∆xi /n

Sample Problem Now, to find the deviation of each measurement, we subtract this average value,12.23 from each value: Value deviation 12.24 0.01 12.32 0.09 12.25 0.02 12.11 -0.12 And then we take the absolute values of each deviation, and average them: (0.01 + 0.09 + 0.02 + 0.12) ÷ 4 = 0.24 ÷ 4 = 0.06 The average deviation for this set of measurements is therefore 0.06. The value should then be reported as 12.23 ± 0.06 seconds.

Plate Problem: Again... A rectangular plate has a length of L = (21.3 +/- 0.2) cm and a width of W = (9.8 +/-0.1) cm. Calculate the area of the plate, including its uncertainty.
( )( ) 221.3 cm 9.8 cm 208.74 cmA LxW= = =
0.2 0.1 .01959 .02 2%21.3 9.8
∆ = + = ± = ± =
AA
2 2(.02)(208.74 cm ) 4.18 cm=
2 2210 cm 4 cmA = ±
Calculate the Area, keeping a few extra sig figs:
Calculate the total fractional/percent uncertainty:
Calculate the total absolute uncertainty:
Round to significant figures:
(2 sig figs in the measurements and 1 sig fig in the uncertainty.)
Standard Form
A L WA L W∆ ∆ ∆
= +

Sphere Problem
The radius of a solid sphere is measured to be (6.50 +/- 0.20) cm, and its mass is measured to be (1.85 +/-0.02) kg. Determine the density of the sphere in kilograms per cubic meter and the uncertainty in the density.
( ) ( )( )
26.50 0.20 cm 6.50 0.20 10 m
1.85 0.02 kg
r
m
−= ± = ± ×
= ±
Givens:
Fractional error in density: 3m rm r
ρρ∆ ∆ ∆
= + ( )3 0.200.02 0.1031.85 6.50
= + =
( ) ( )3 3
324 3
1.85 1.61 10 kg m6.5 10 m
kgρπ −
= = ××
Calculate the density:
( ) 343
mr
ρπ
=
Calculate the total absolute uncertainty: 3 3 3 3)(.103)(1.61 10 kg m .17 10 kg m× = ×
( ) 3 31.61 0.2 10 kg m± ∆ = ± ×ρ ρRound & Standard Form:

Circle Problem The radius of a circle is measured to be (10.5 +/- 0.2) m. Calculate the (a) area and (b) circumference of the circle and give the uncertainty in each value.
2 2346 m 10 mA = ±
( )2 2 10.5 m 0.2 m 65.97 1.25C r m mπ π= = ± = ±
2A rA r∆ ∆
=.22 .038
10.5mm
= =
( )22 210.5 m 346.36 mrπ π= =
(.038)(346) 13.18A m m∆ = =
Calculate the Area:
Fractional uncertainty in the Area:
Absolute uncertainty in the Area:
Round & Standard Form:
Circumference:
(66.0 1.3)C m= ±

Another way to do it The radius of a circle is measured to be (10.5 +/- 0.2) m. Calculate the (a) area and (b) circumference of the circle and give the uncertainty in each value.
( )22
2 2
2 2
10.5 m 0.2 m
(10.5 m) 2(10.5 m)(0.2 m) (0.2 m)
346 m 10 m
rπ π
π
= ±
= ± +
= ±
( )2 2 10.5 m 0.2 m 66.0 m 1.3 mrπ π= ± = ±