welcome to pmba0608: economics/statistics foundation fall 2006 session 5: september 20
Post on 20-Dec-2015
216 views
TRANSCRIPT
Welcome toPMBA0608: Economics/Statistics Foundation
Fall 2006Session 5: September 20
Exam 1 Saturday, September 30, 14:30-16:00
Covers Chapters 1 through 4 of Mankiw Chapters 1 through 3 of Mendenhall,
Beaver and Beaver (up to 3.4, Page 102) Send me your questions I will do one, two or all of the following:
Answer you privately Publish the answer to your question on line Answer your question right before exam at
14:00-14:30, Saturday, September 30.
From now on please
1. don’t turn in your assignments in pieces. (separate documents)
2. answer the questions in the right order.
3. don’t forget to put your names on the assignment.
4. otherwise, I will deduct points.
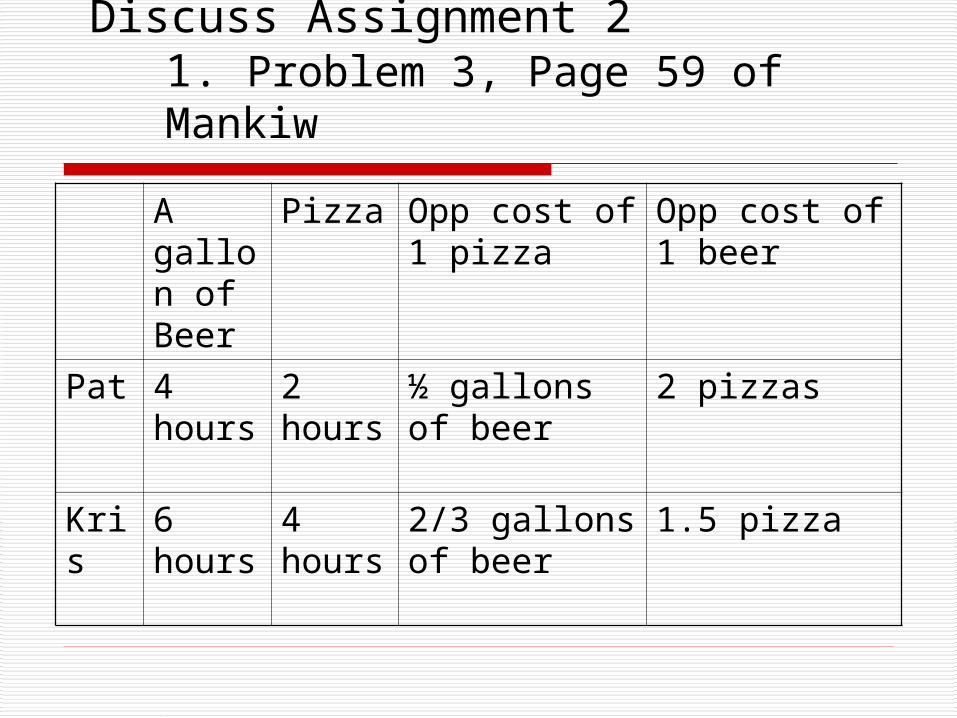
Discuss Assignment 21. Problem 3, Page 59 of Mankiw
A gallon of Beer
Pizza Opp cost of 1 pizza
Opp cost of 1 beer
Pat 4 hours
2 hours
½ gallons of beer
2 pizzas
Kris 6 hours
4 hours
2/3 gallons of beer
1.5 pizza
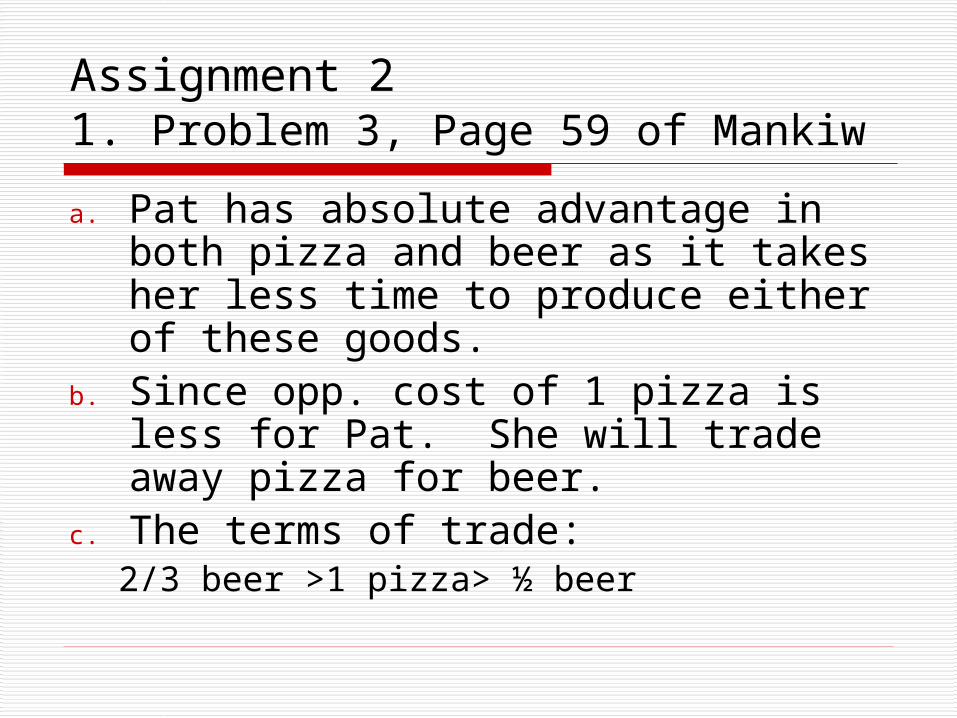
Assignment 21. Problem 3, Page 59 of Mankiw
a. Pat has absolute advantage in both pizza and beer as it takes her less time to produce either of these goods.
b. Since opp. cost of 1 pizza is less for Pat. She will trade away pizza for beer.
c. The terms of trade:2/3 beer >1 pizza> ½ beer
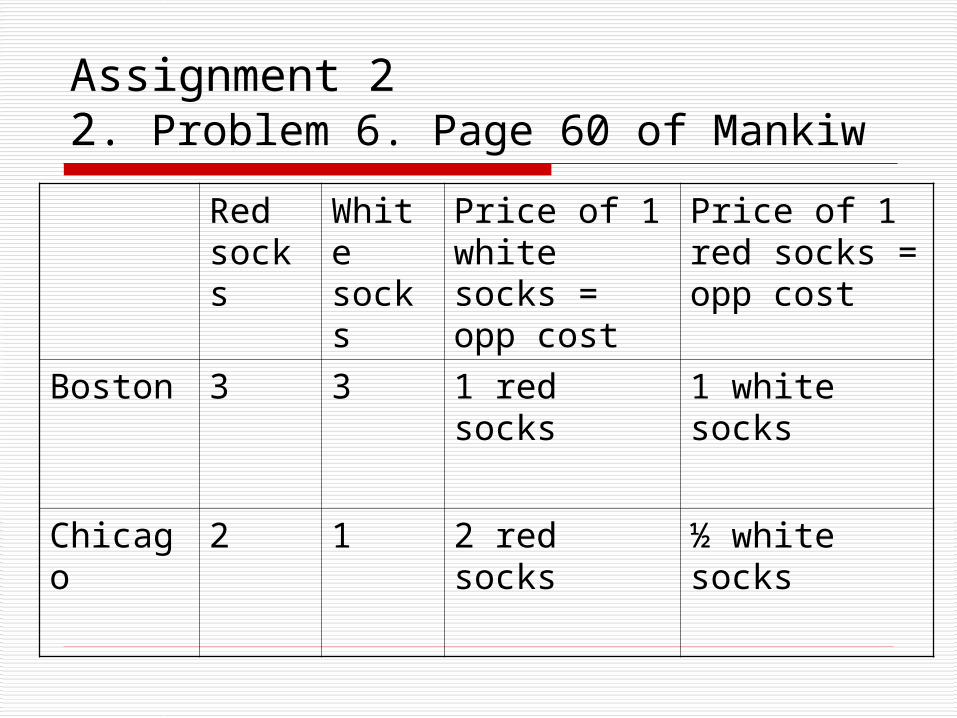
Assignment 2 2. Problem 6. Page 60 of Mankiw
Red socks
White socks
Price of 1 white socks = opp cost
Price of 1 red socks = opp cost
Boston 3 3 1 red socks 1 white socks
Chicago 2 1 2 red socks ½ white socks
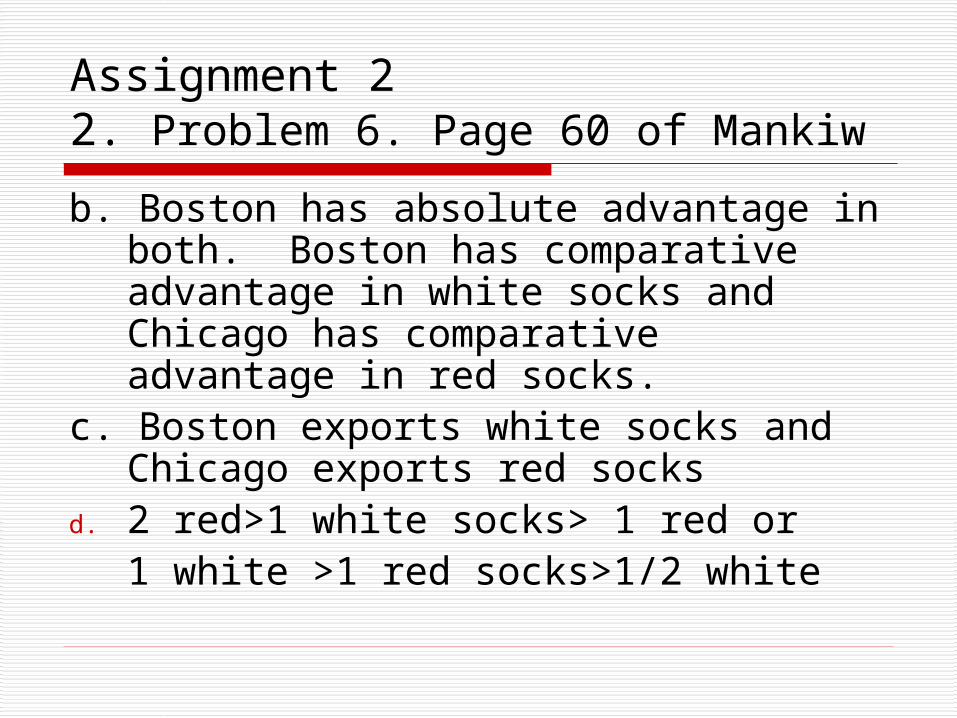
Assignment 2 2. Problem 6. Page 60 of Mankiw
b. Boston has absolute advantage in both. Boston has comparative advantage in white socks and Chicago has comparative advantage in red socks.
c. Boston exports white socks and Chicago exports red socks
d. 2 red>1 white socks> 1 red or 1 white >1 red socks>1/2 white
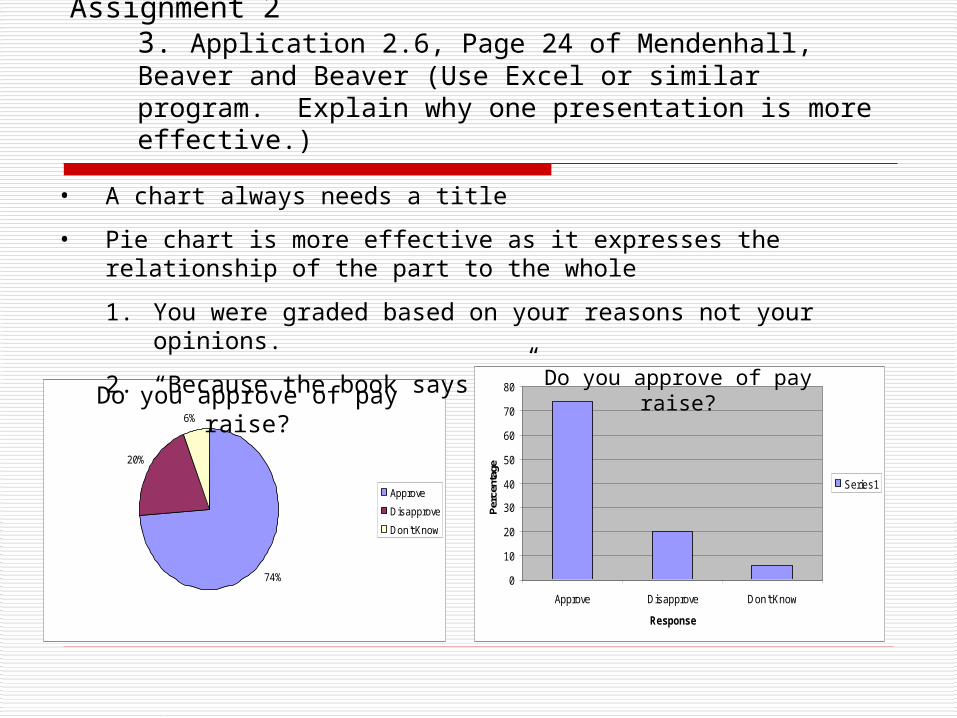
Assignment 23. Application 2.6, Page 24 of Mendenhall, Beaver and Beaver (Use Excel or similar program. Explain why one presentation is more effective.)
74%
20%
6%
Approve
Disapprove
Don't Know
• A chart always needs a title
• Pie chart is more effective as it expresses the relationship of the part to the whole
1. You were graded based on your reasons not your opinions.
2. “Because the book says so” is not a reason.
0
10
20
30
40
50
60
70
80
Approve Disapprove Don't Know
Response
Perc
enta
geSeries1
Do you approve of pay raise?Do you approve of pay raise?
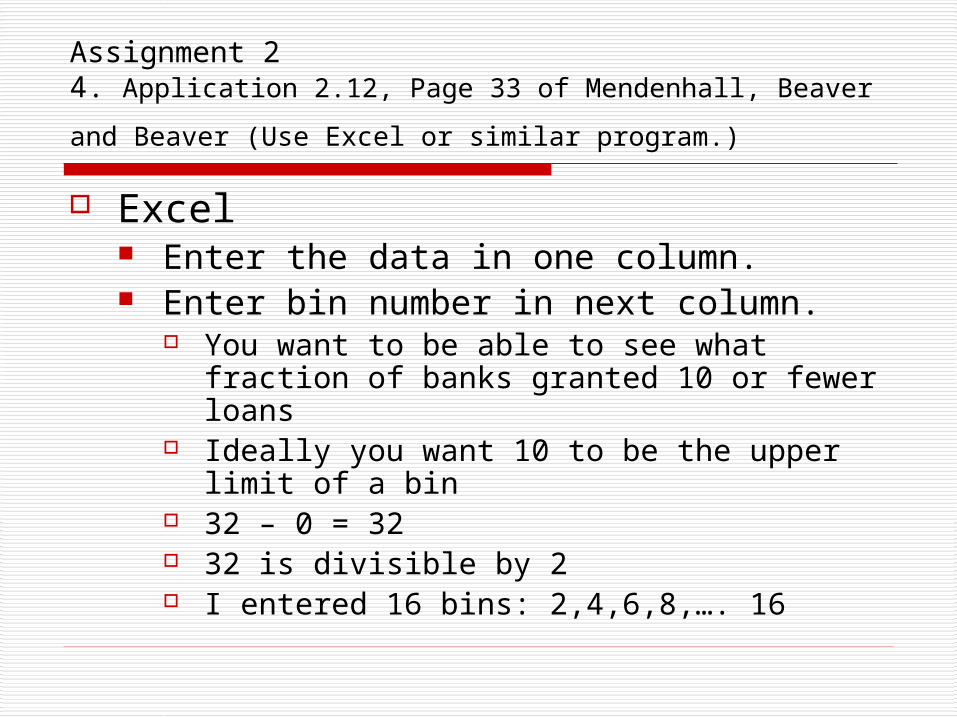
Assignment 24. Application 2.12, Page 33 of Mendenhall, Beaver and
Beaver (Use Excel or similar program.)
Excel Enter the data in one column. Enter bin number in next column.
You want to be able to see what fraction of banks granted 10 or fewer loans
Ideally you want 10 to be the upper limit of a bin
32 – 0 = 32 32 is divisible by 2 I entered 16 bins: 2,4,6,8,…. 16
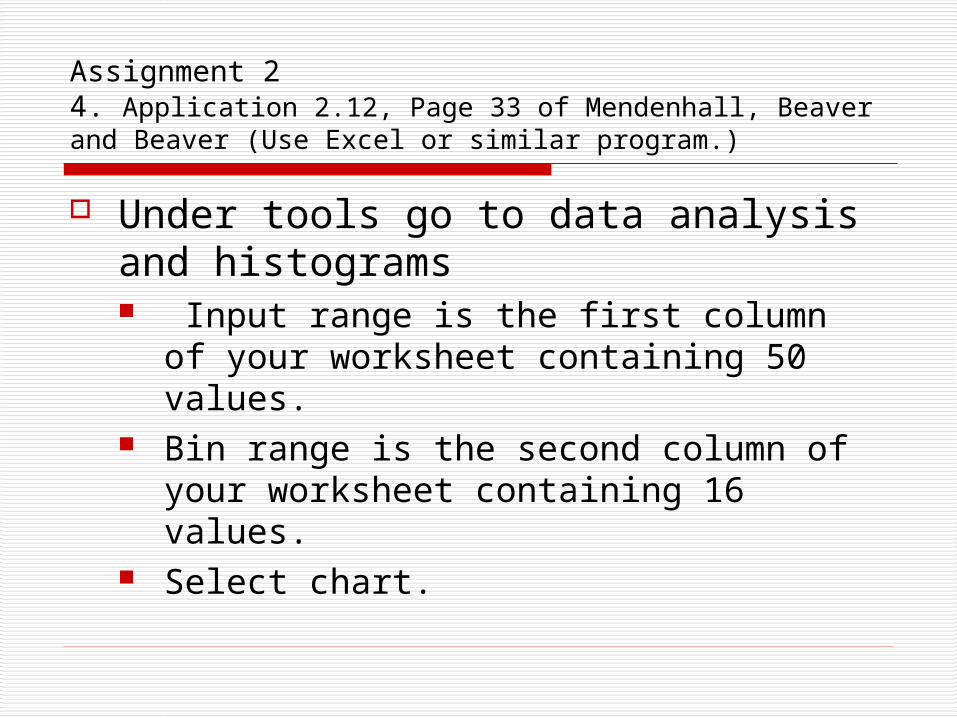
Assignment 24. Application 2.12, Page 33 of Mendenhall, Beaver and Beaver (Use Excel or similar program.)
Under tools go to data analysis and histograms Input range is the first column of your
worksheet containing 50 values. Bin range is the second column of your
worksheet containing 16 values. Select chart.
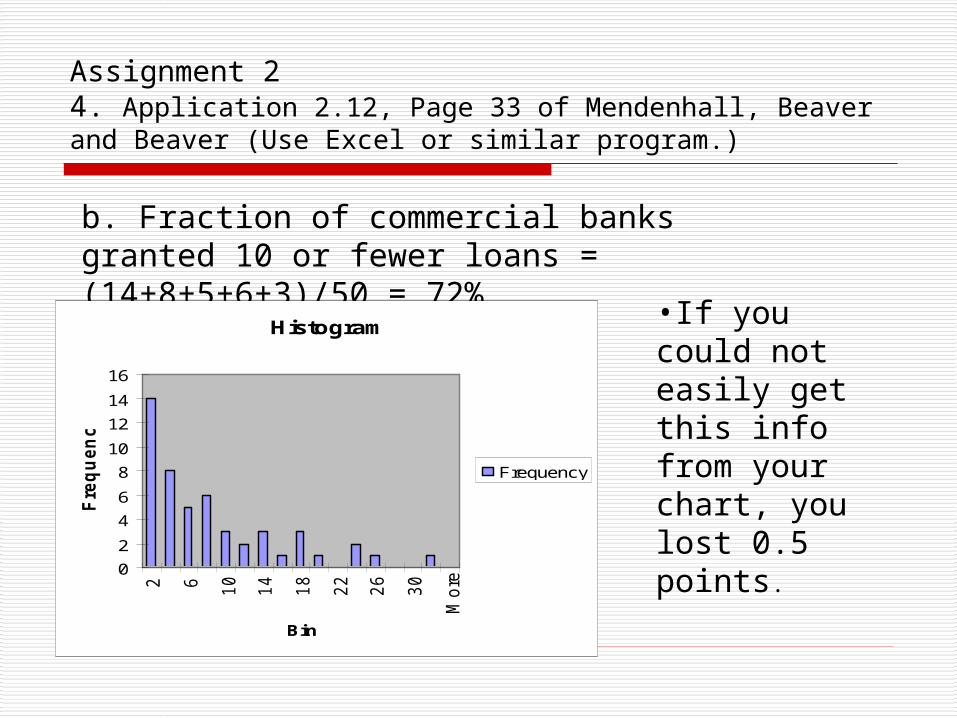
Assignment 24. Application 2.12, Page 33 of Mendenhall, Beaver and Beaver (Use Excel or similar program.)
b. Fraction of commercial banks granted 10 or fewer loans = (14+8+5+6+3)/50 = 72%
Histogram
0
2
4
6
8
10
12
14
16
2 6 10
14
18
22
26
30
More
Bin
Fre
qu
en
cy
Frequency
•If you could not easily get this info from your chart, you lost 0.5 points.
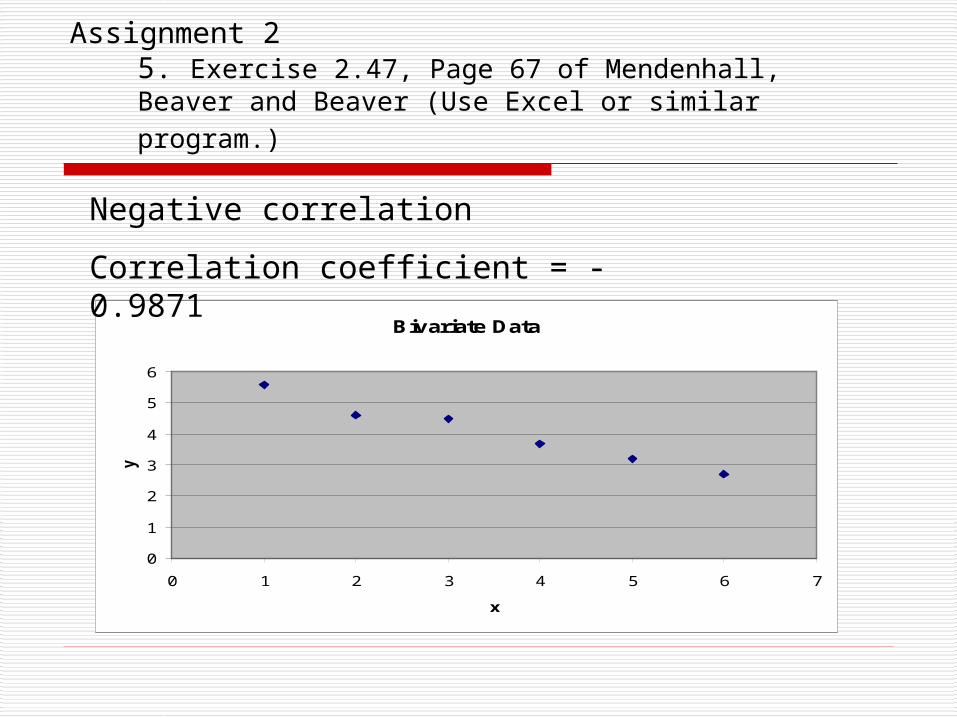
Assignment 25. Exercise 2.47, Page 67 of Mendenhall, Beaver and Beaver (Use Excel or similar program.)
Bivariate Data
0
1
2
3
4
5
6
0 1 2 3 4 5 6 7
x
y
Negative correlation
Correlation coefficient = - 0.9871

Market Model
Supply and DemandChapter 4 of Mankiw
What are Markets?
Institutions that allow buyers and sellers to exchange
There are two sides to a market
1. Potential buyers demanders
2. Potential sellers suppliers
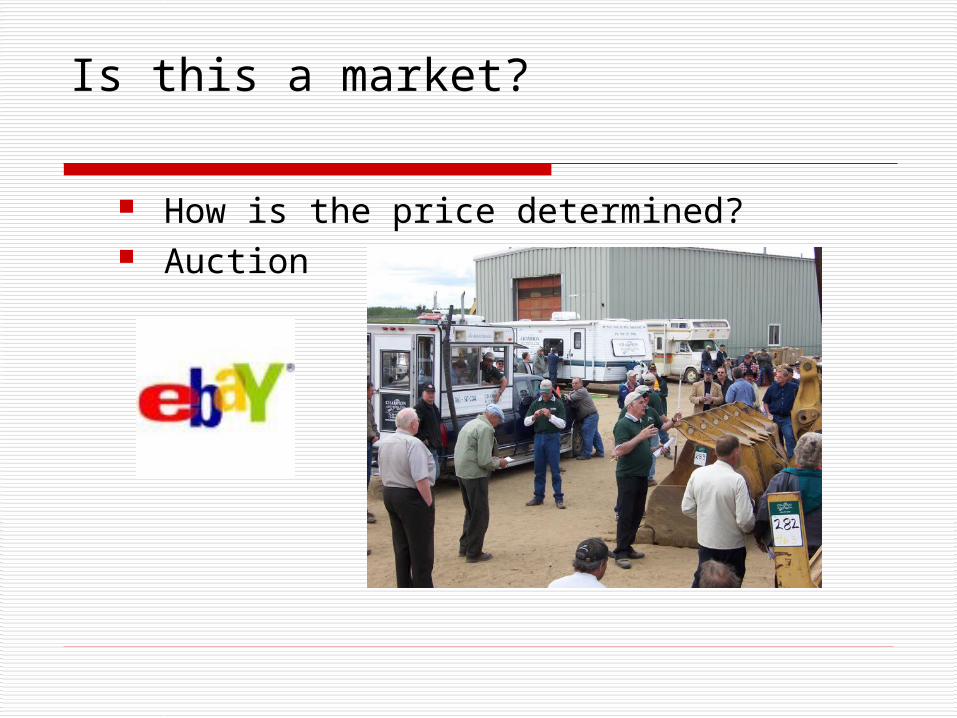
Is this a market?
How is the price determined? Auction
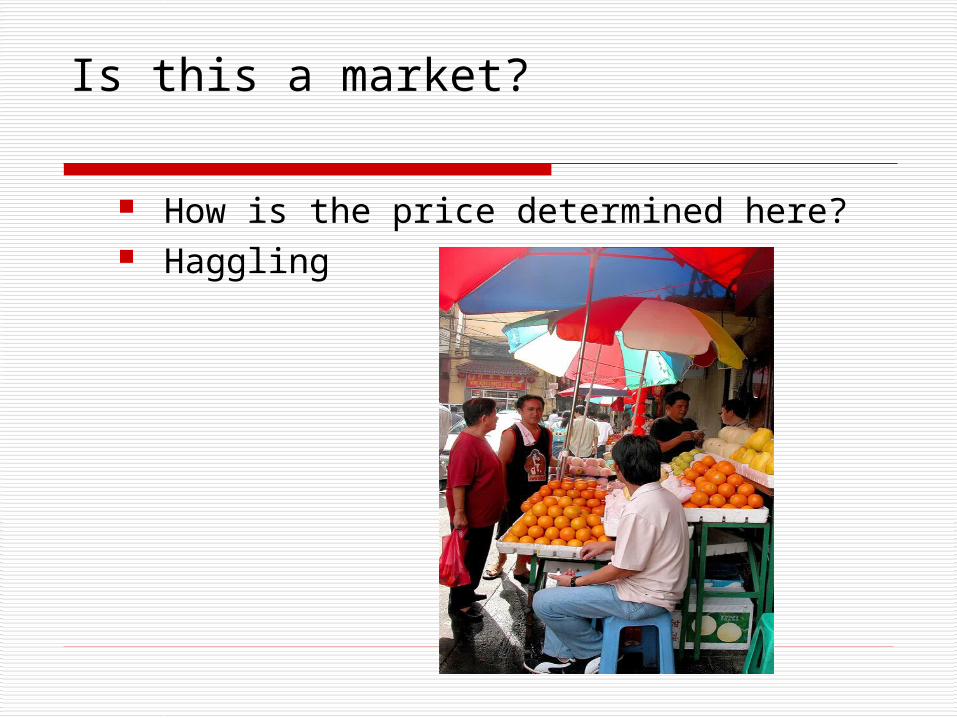
Is this a market?
How is the price determined here? Haggling
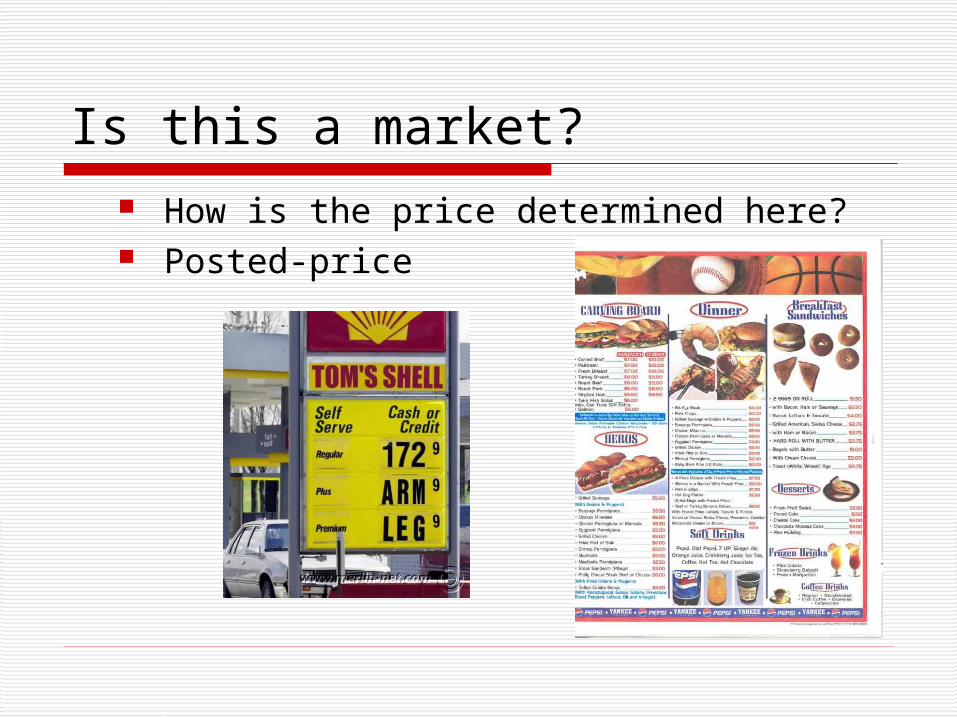
How is the price determined here? Posted-price
Is this a market?
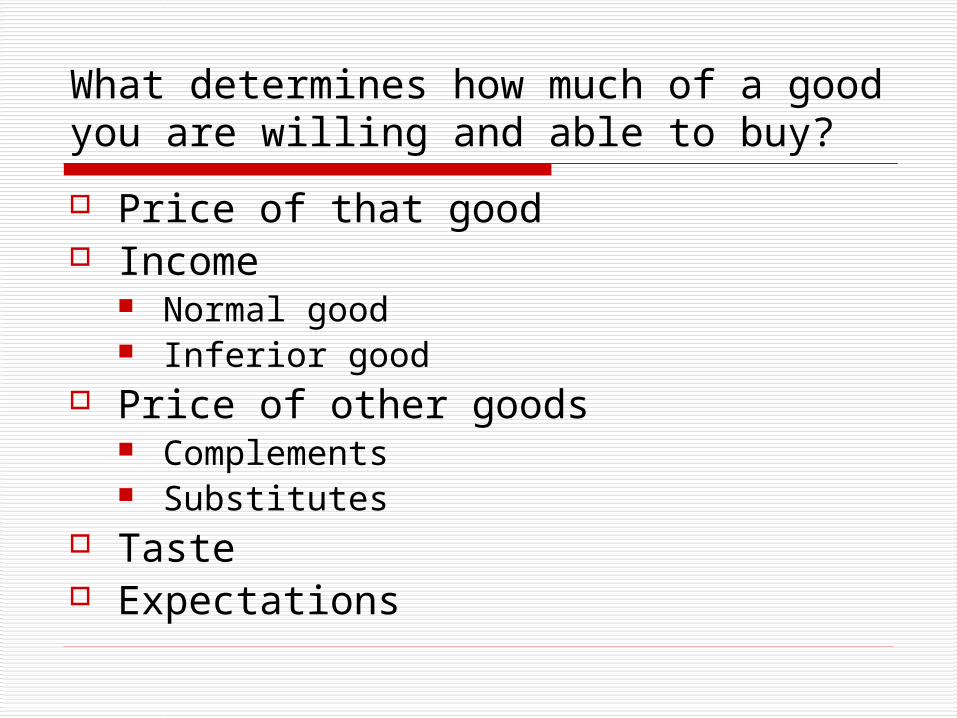
What determines how much of a good you are willing and able to buy?
Price of that good Income
Normal good Inferior good
Price of other goods Complements Substitutes
Taste Expectations
Demand Curve
shows how much of a good consumers are willing and able to buy at different prices, holding everything else constant.
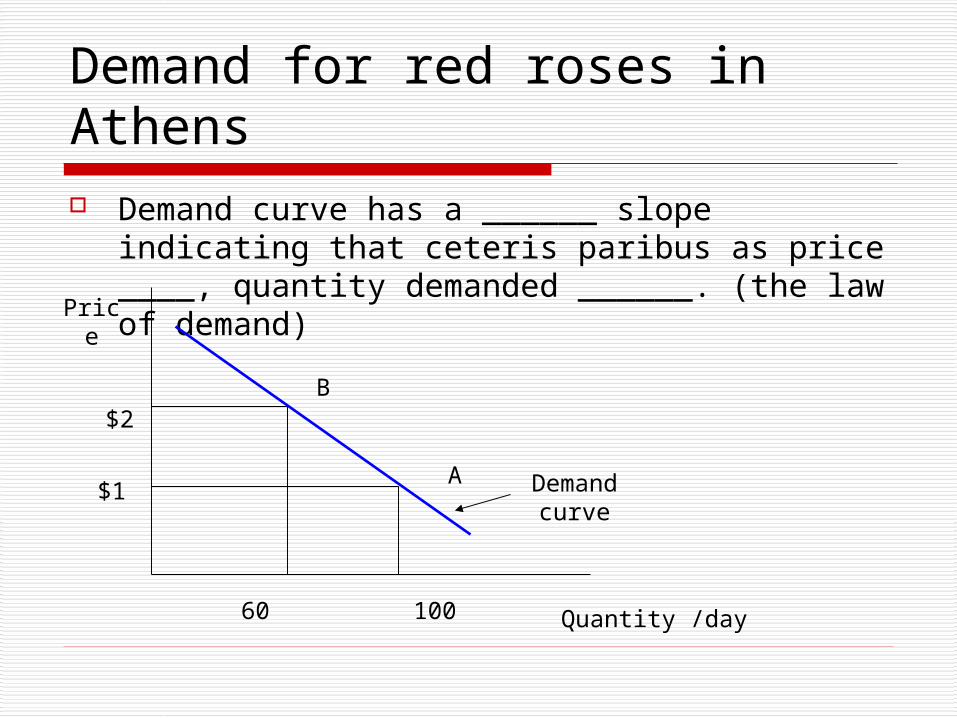
Demand for red roses in Athens Demand curve has a ______ slope indicating
that ceteris paribus as price ____, quantity demanded ______. (the law of demand)
Price
Quantity /day
A$1
$2B
Demand curve
10060
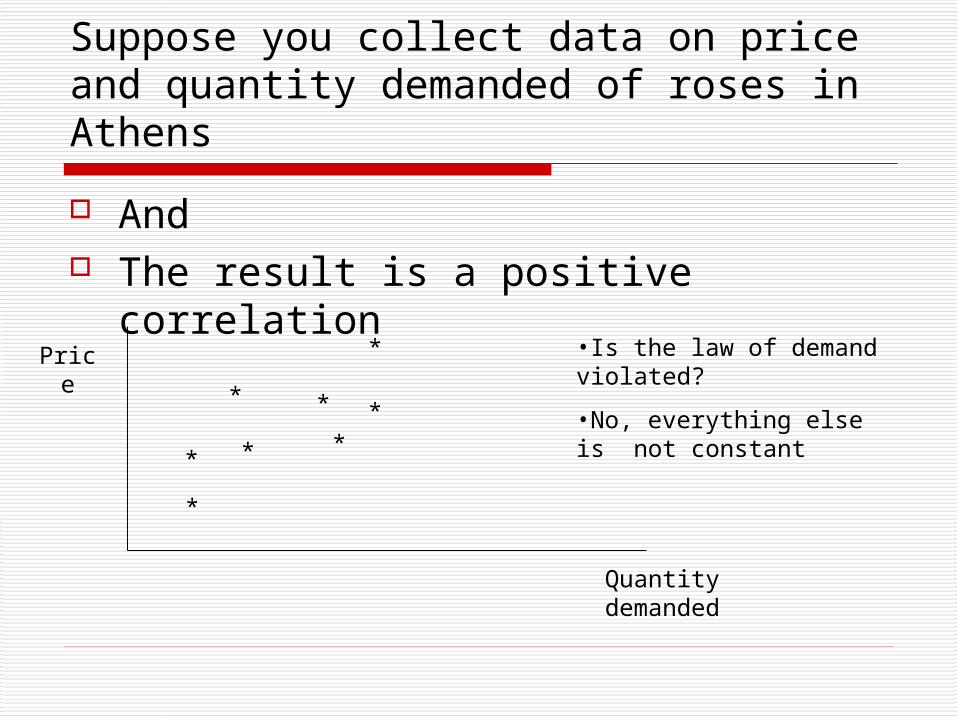
Suppose you collect data on price and quantity demanded of roses in Athens
And The result is a positive correlation
*
**
***
*
*
•Is the law of demand violated?
•No, everything else is not constant
Price
Quantity demanded
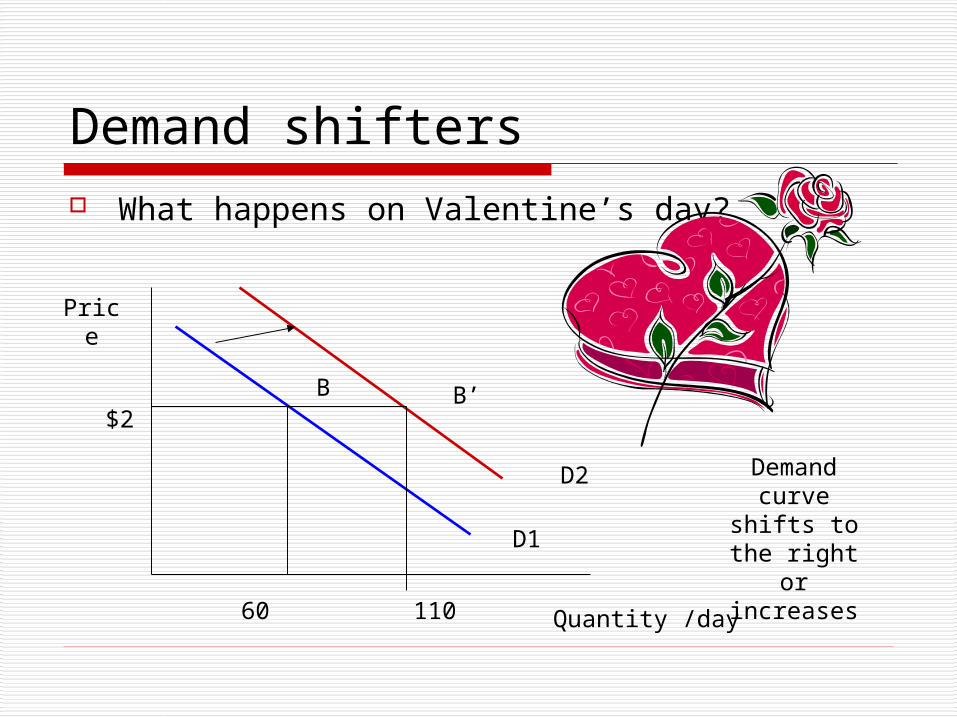
Demand shifters What happens on Valentine’s day?
Price
Quantity /day
$2B
D1
11060
B’
Demand curve shifts to the right or increases
D2
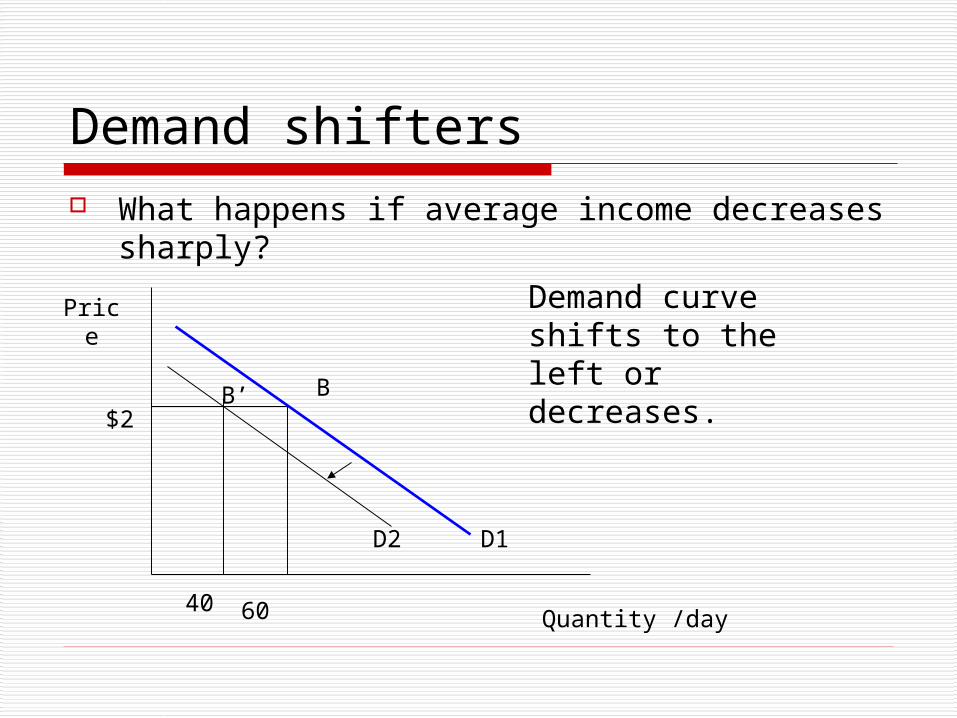
Demand shifters What happens if average income decreases
sharply?
Price
Quantity /day
$2B
D1
60
B’
40
D2
Demand curve shifts to the left or decreases.
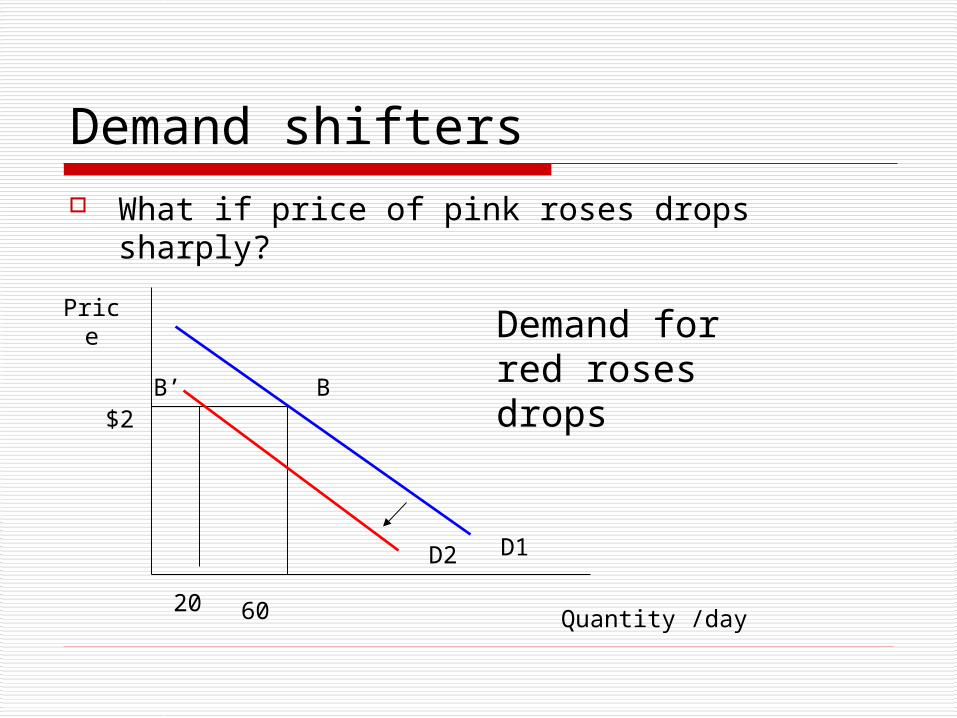
Demand shifters What if price of pink roses drops sharply?
Price
Quantity /day
$2B
60
D1D2
Demand for red roses drops
20
B’
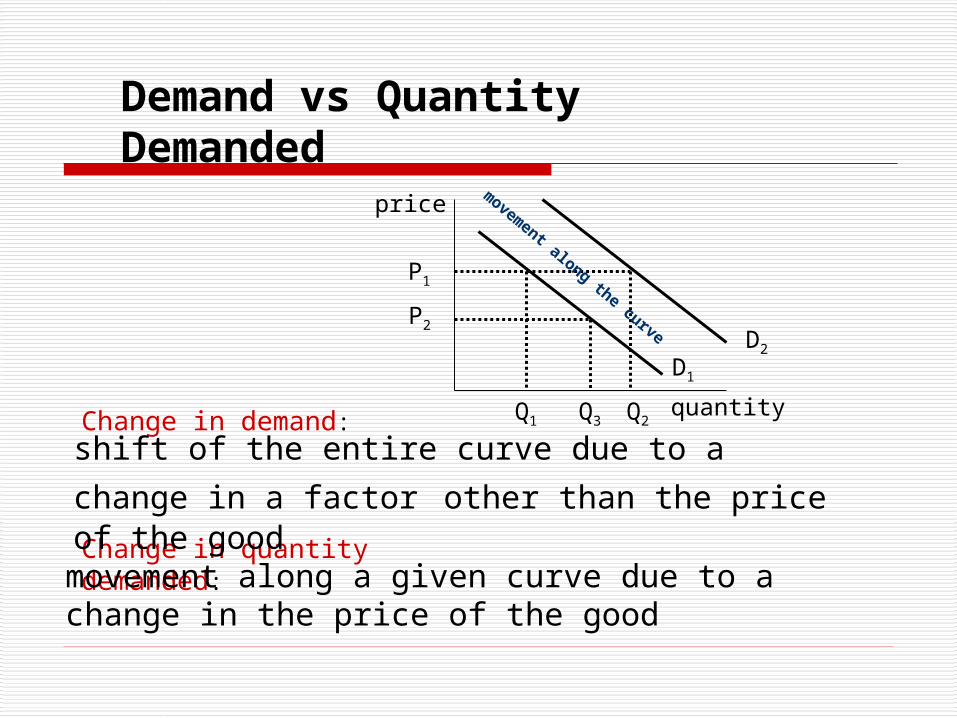
D1
quantity
price
P1
Q1Change in demand:
Change in quantity demanded:
shift of the entire curve due to a change in a factor other than the price of the good
movement along a given curve due to a change in the price of the good
D2
Q2
P2
Q3
movem
ent along the curve
Demand vs Quantity Demanded
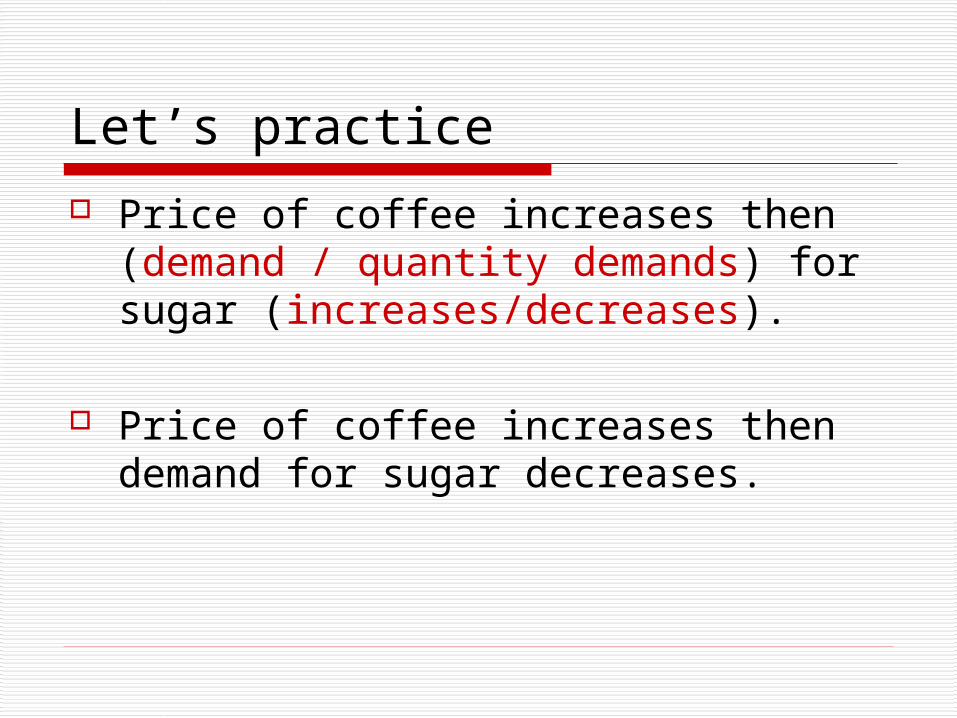
Let’s practice
Price of coffee increases then (demand / quantity demands) for sugar (increases/decreases).
Price of coffee increases then demand for sugar decreases.
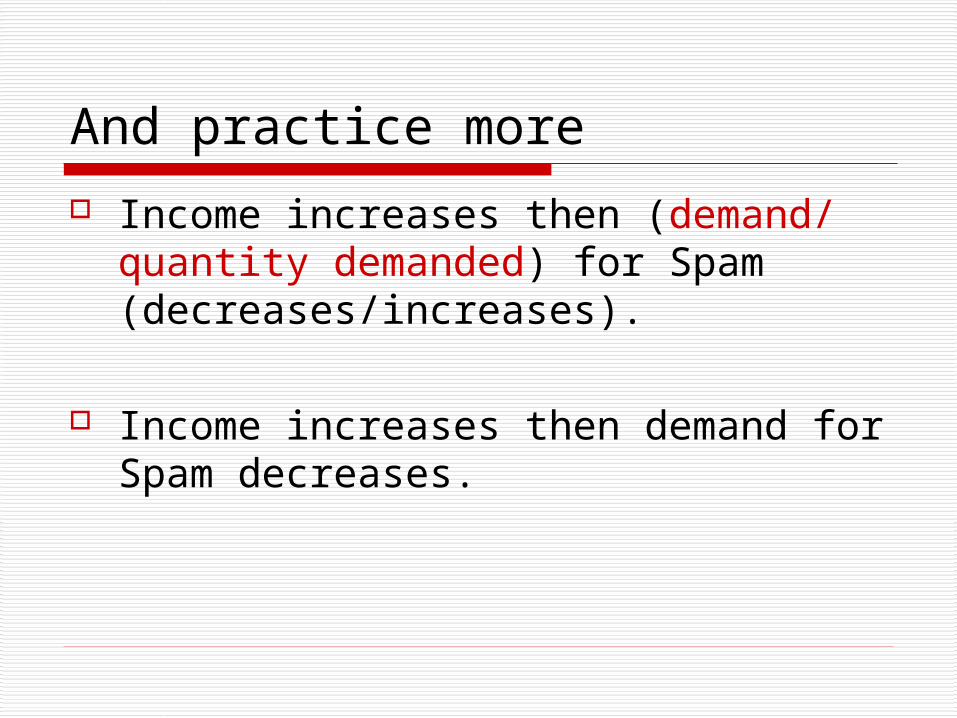
And practice more
Income increases then (demand/ quantity demanded) for Spam (decreases/increases).
Income increases then demand for Spam decreases.
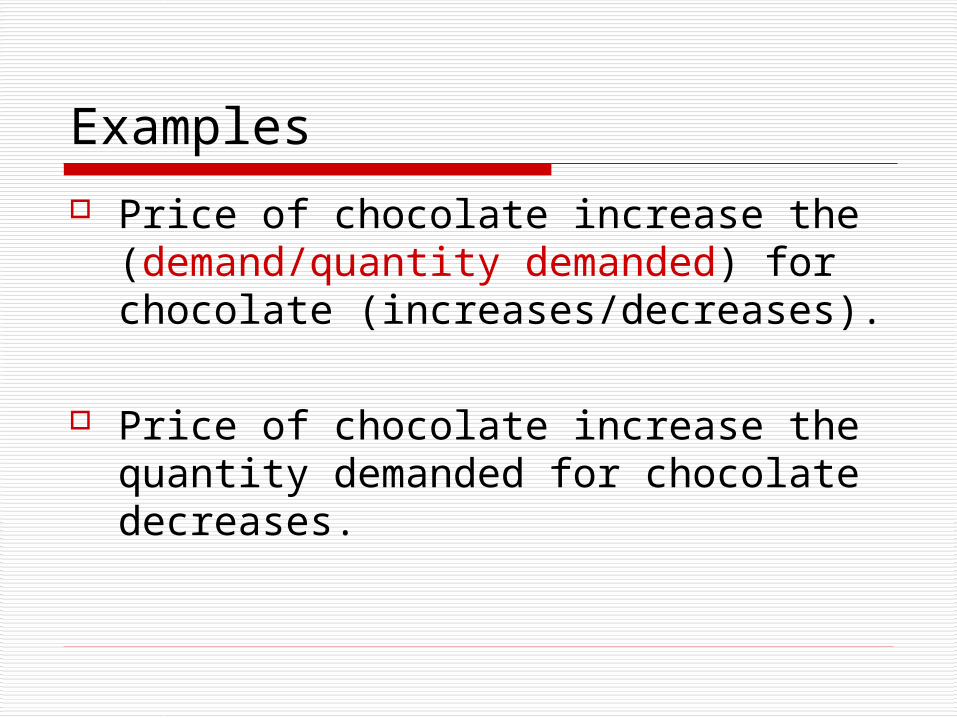
Examples
Price of chocolate increase the (demand/quantity demanded) for chocolate (increases/decreases).
Price of chocolate increase the
quantity demanded for chocolate decreases.
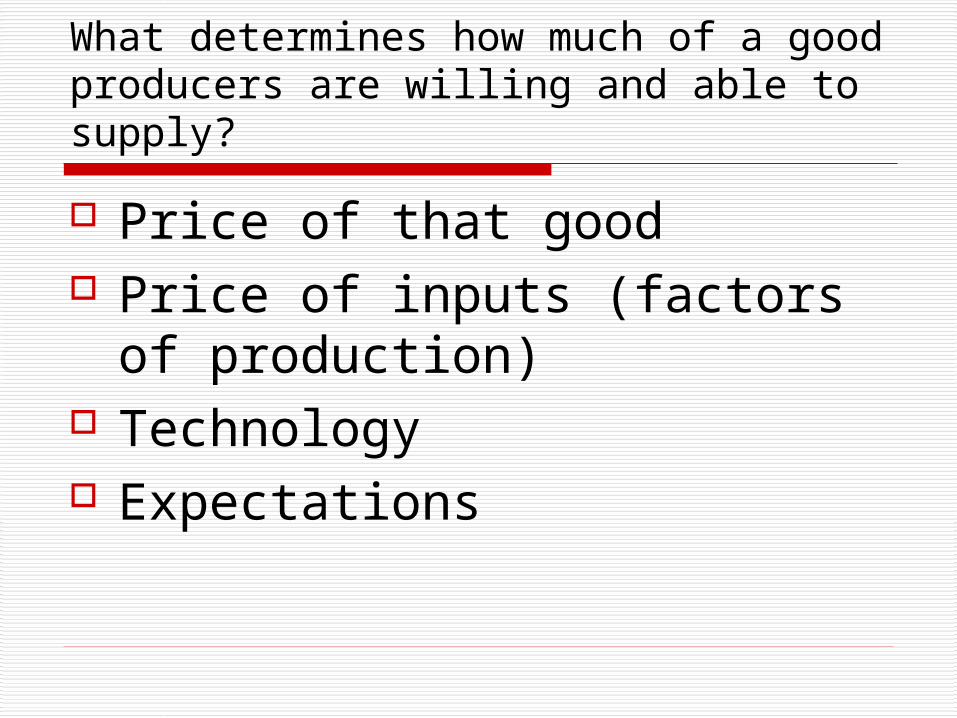
What determines how much of a good producers are willing and able to supply?
Price of that good Price of inputs (factors of
production) Technology Expectations
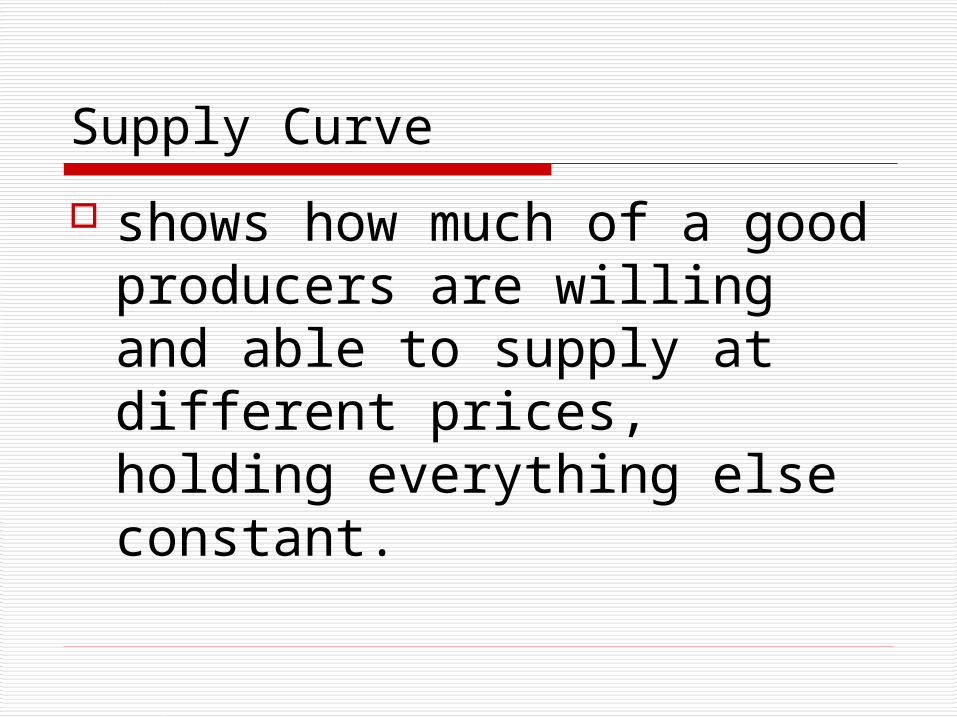
Supply Curve
shows how much of a good producers are willing and able to supply at different prices, holding everything else constant.
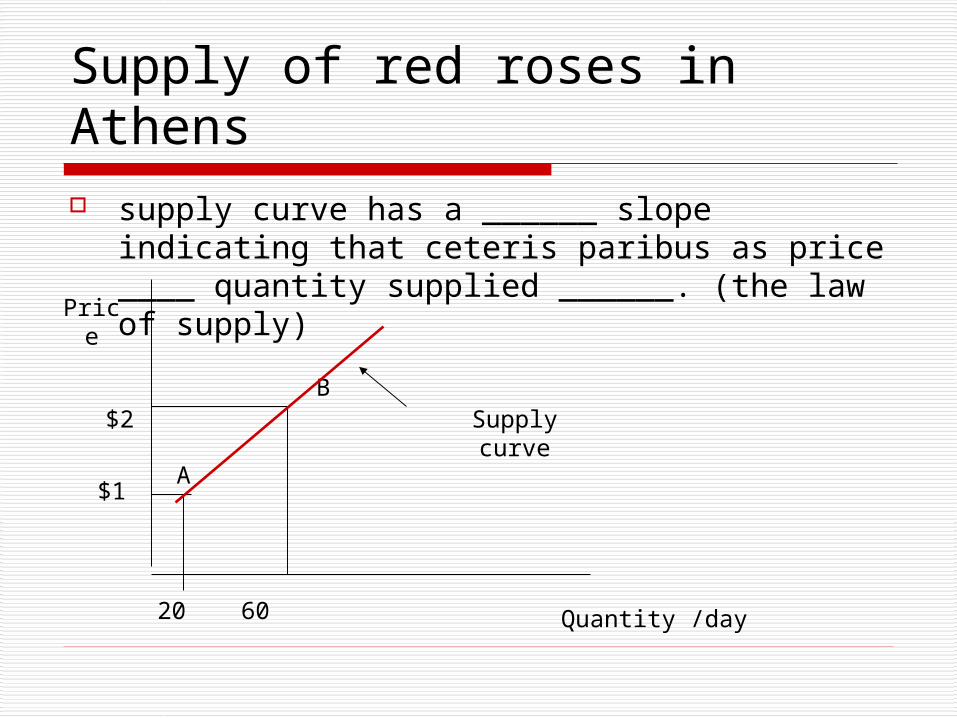
Supply of red roses in Athens supply curve has a ______ slope indicating that
ceteris paribus as price ____ quantity supplied ______. (the law of supply)
Price
Quantity /day
A$1
$2B
6020
Supply curve
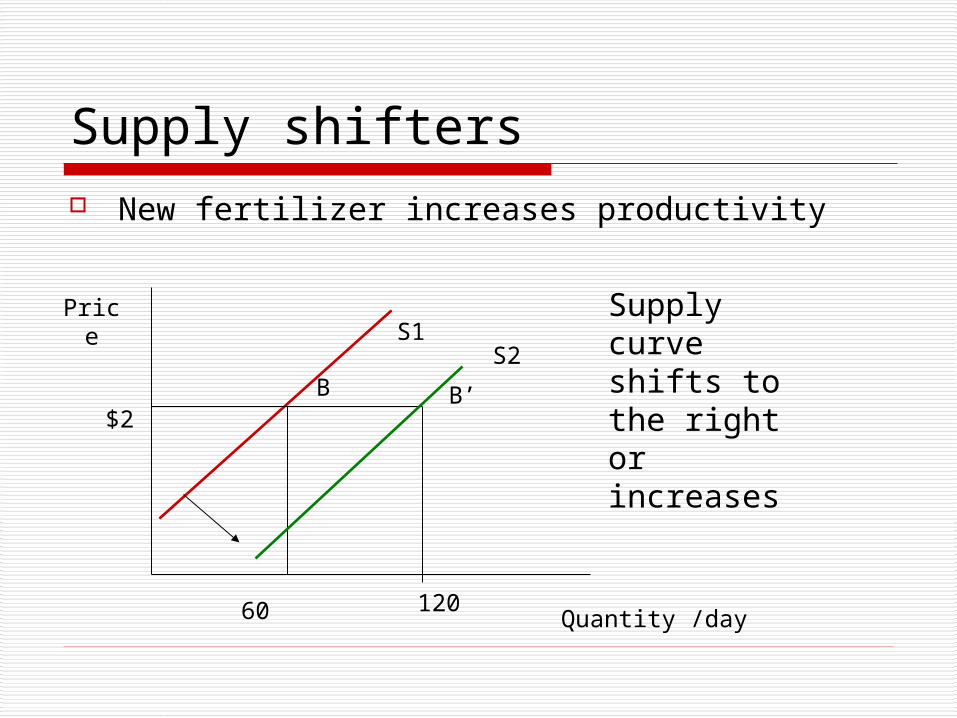
Supply shifters New fertilizer increases productivity
Price
Quantity /day
$2B
60
S1
120
B’
Supply curve shifts to the right or increases
S2
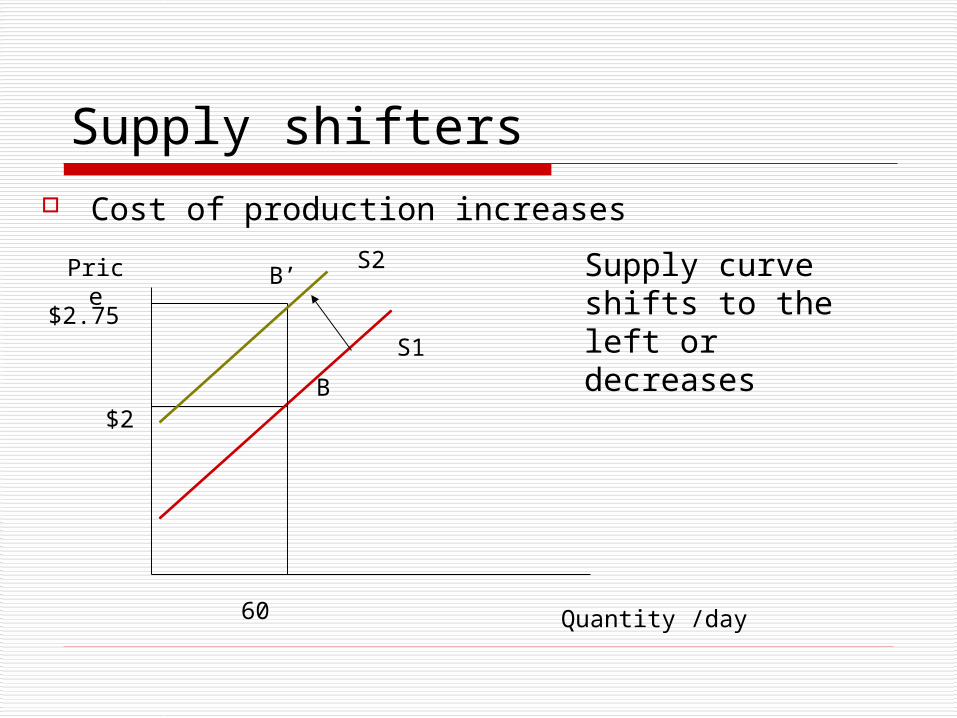
Supply shifters Cost of production increases
Price
Quantity /day
$2B
60
S1
Supply curve shifts to the left or decreases
$2.75
S2B’
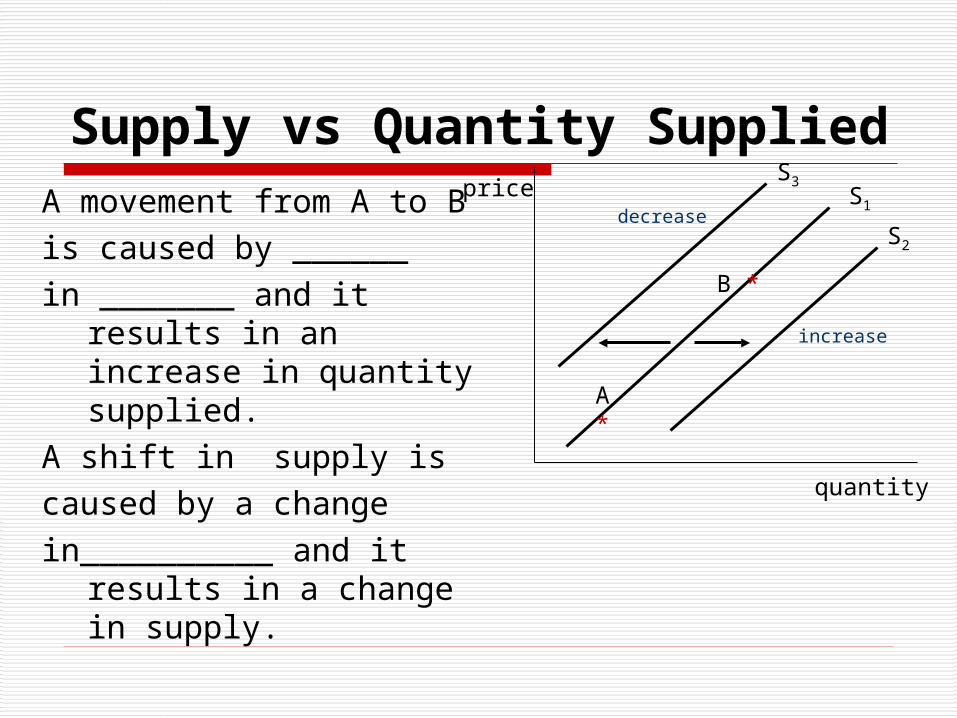
Supply vs Quantity SuppliedA movement from A to Bis caused by ______in _______ and it results in
an increase in quantity supplied.
A shift in supply iscaused by a changein__________ and it results
in a change in supply.
S1
quantity
price
S2
S3
increase
decrease
A *
B *
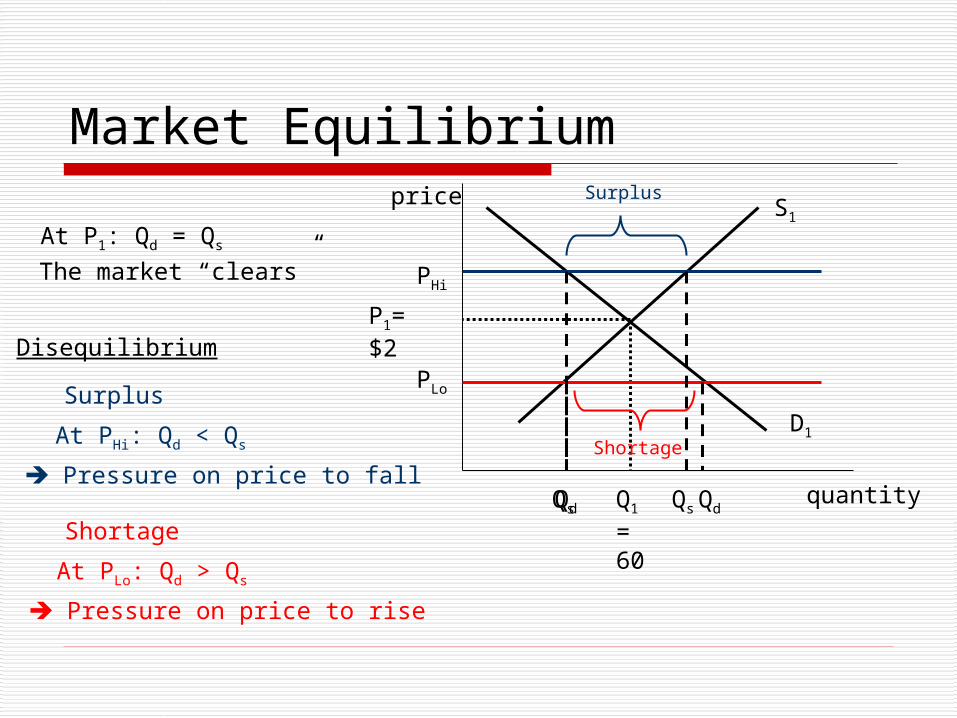
Market Equilibrium
quantity
price
D1
S1
P1= $2
Q1
= 60
At P1: Qd = Qs
PHi
PLo
QsQd
At PHi: Qd < Qs
Surplus
Pressure on price to fall
At PLo: Qd > Qs
Shortage
Pressure on price to rise
Disequilibrium
Surplus
The market “clears”
QdQs
Shortage
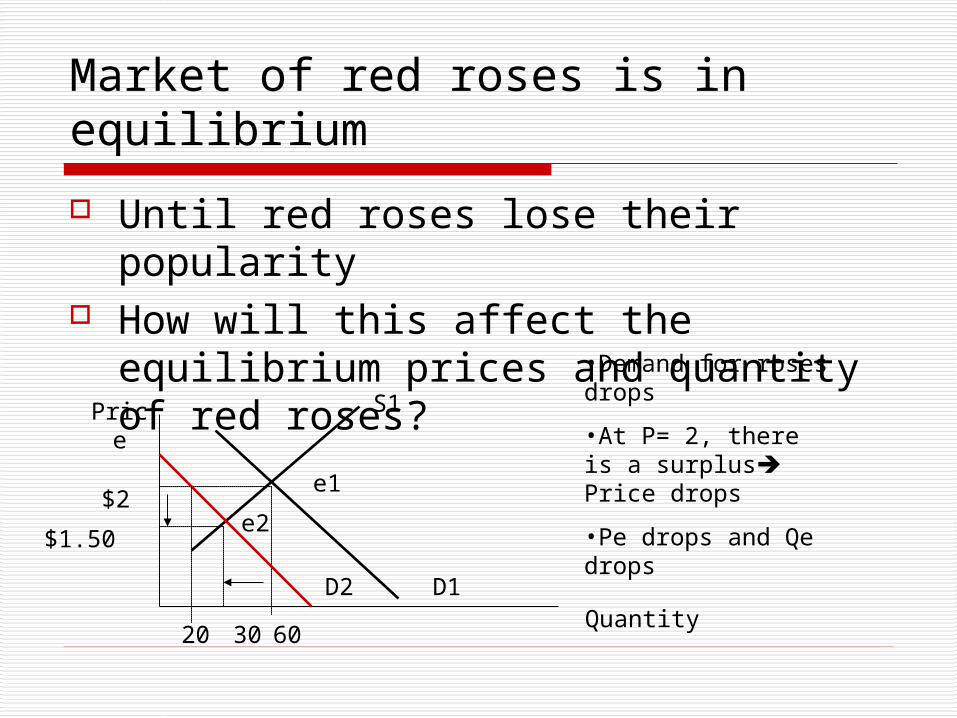
Market of red roses is in equilibrium
Until red roses lose their popularity How will this affect the equilibrium
prices and quantity of red roses?
Price
Quantity
S1
D1
$2
60
e1
D2
20
•Demand for roses drops
•At P= 2, there is a surplus Price drops
•Pe drops and Qe drops$1.50
e2
30
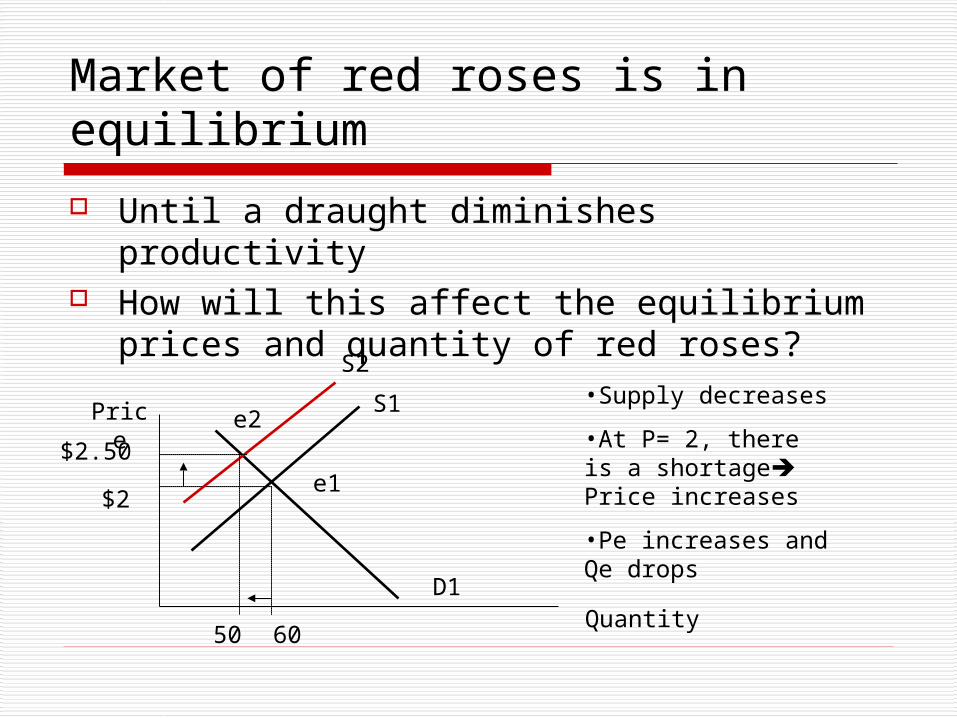
Market of red roses is in equilibrium
Until a draught diminishes productivity How will this affect the equilibrium prices
and quantity of red roses?
Price
Quantity
S1
D1
$2
60
e1
•Supply decreases
•At P= 2, there is a shortage Price increases
•Pe increases and Qe drops
S2
e2
50
$2.50
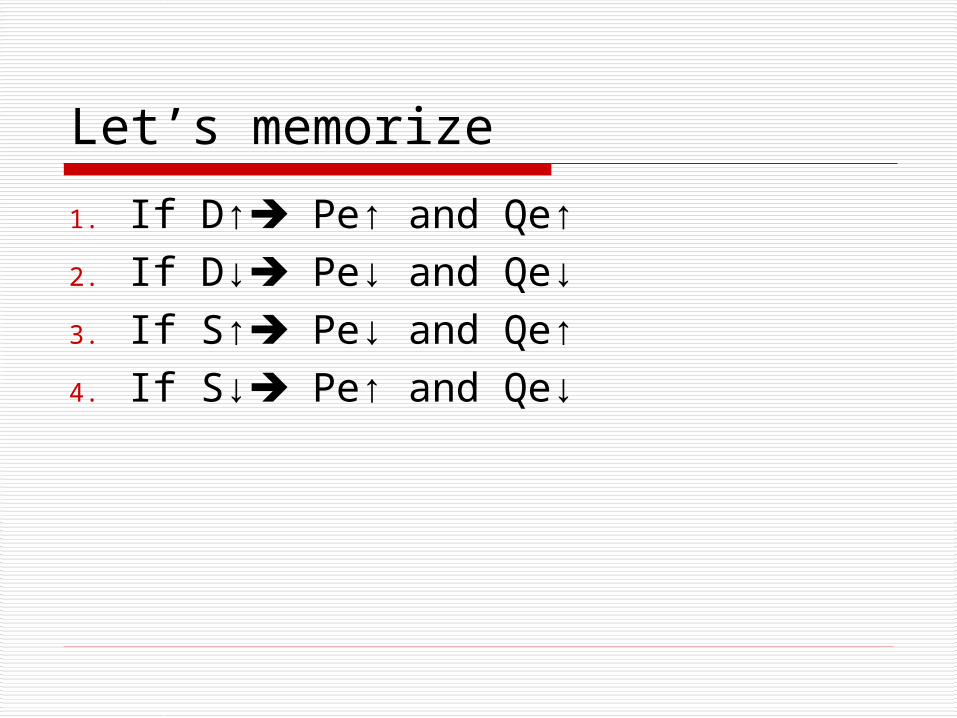
Let’s memorize
1. If D↑ Pe↑ and Qe↑2. If D↓ Pe↓ and Qe↓3. If S↑ Pe↓ and Qe↑4. If S↓ Pe↑ and Qe↓
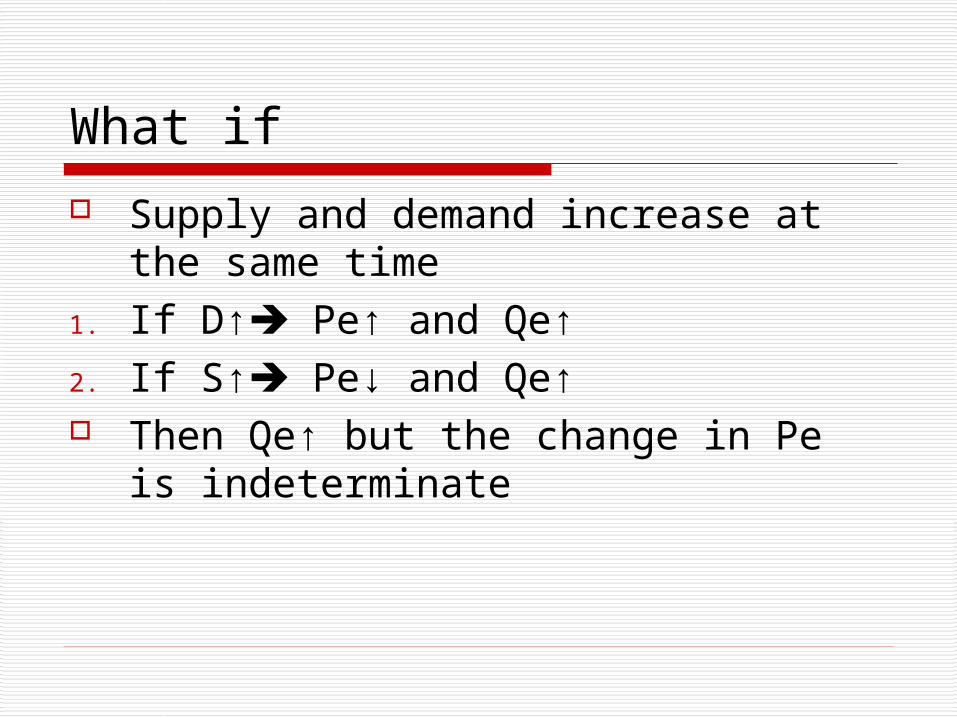
What if
Supply and demand increase at the same time
1. If D↑ Pe↑ and Qe↑2. If S↑ Pe↓ and Qe↑ Then Qe↑ but the change in Pe is
indeterminate
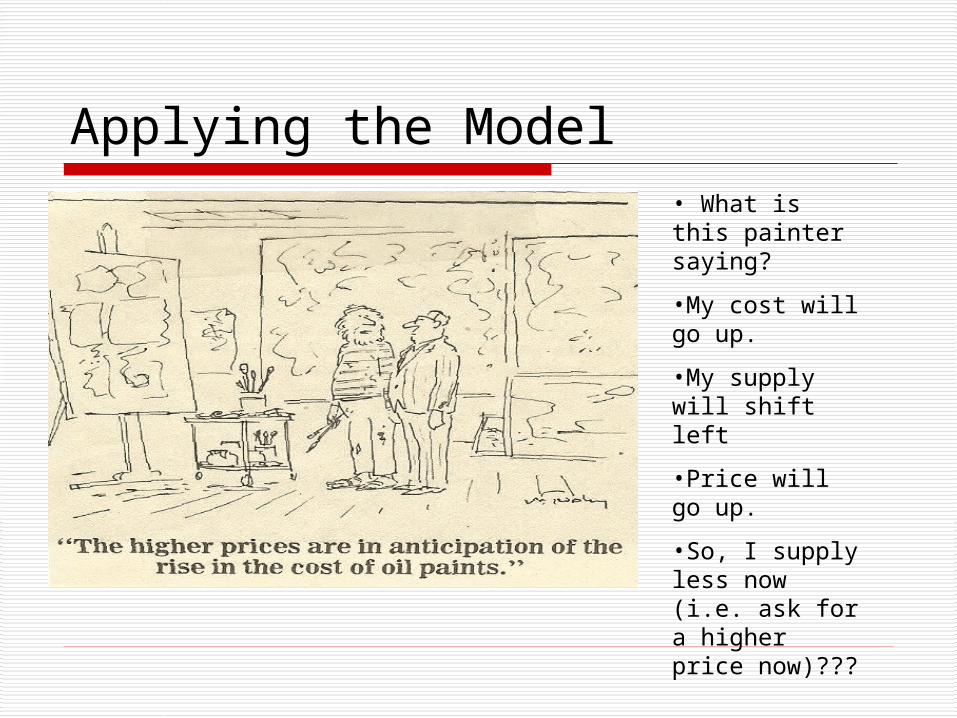
Applying the Model• What is this painter saying?
•My cost will go up.
•My supply will shift left
•Price will go up.
•So, I supply less now (i.e. ask for a higher price now)???
Gasoline prices are going down. Why?
In its monthly report, the International Energy Agency forecast world crude-oil demand in 2006 would be lower than previously expected at a time when inventories in the U.S. and Asia are at a 20-year high. In the near future, you can sell your oil for less
that you previously expected So sell more now S shifts right, Pe goes down.
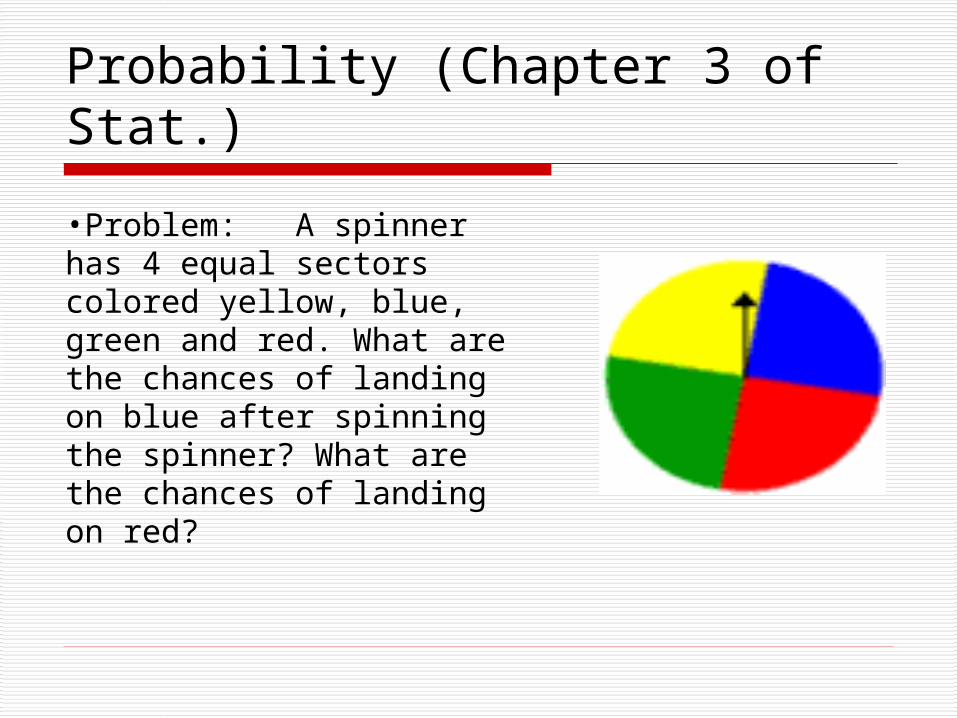
Probability (Chapter 3 of Stat.)
•Problem: A spinner has 4 equal sectors colored yellow, blue, green and red. What are the chances of landing on blue after spinning the spinner? What are the chances of landing on red?
Definitions Experiment: A situation involving chance or
probability that leads to results called outcomes. In the problem above, what is the experiment?
Outcome: The result of a single trial of an experiment. What are the possible outcomes of this experiment?
Event: One or more outcomes of an experiment. One event of this experiment is landing on _____.
Probability: Measure of how likely an event is. The probability of landing on blue is_______.
Probability Of An Event
P(A) = The number of ways event A can occur / the total number of possible outcomes
In our problem
P(yellow) = number of ways to land on yellow / total number of colors = 1/4
P(green) = 1/4 P(red) = 1/4 P(blue) = 1/4
Simple events
Are mutually exclusive Are the events in our example simple?
In simple event probabilities Each probability lies between 0 and 1 The sum of probabilities is 1
Let’s practice A pair of dice is rolled. Two possible
events are rolling a number greater than 8 and rolling an even number. Are these two events mutually exclusive events? Numbers greater than 8: 9,10,11, 12 Even numbers: 2,4,6,8,10,12 Two events share outcomes They are not mutually exclusive
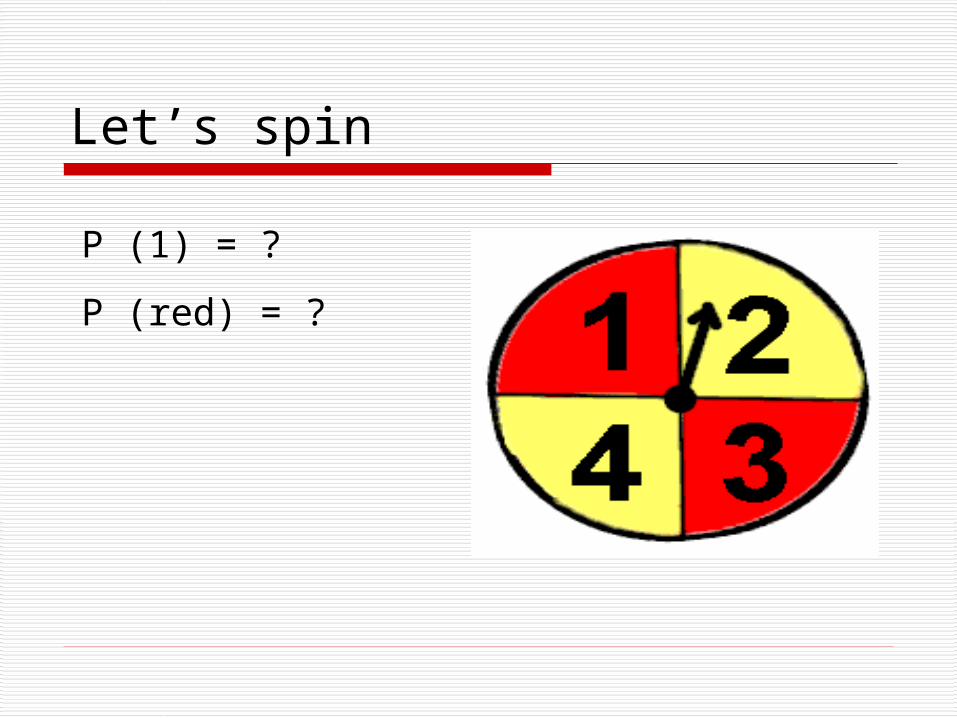
Let’s spin
P (1) = ?
P (red) = ?
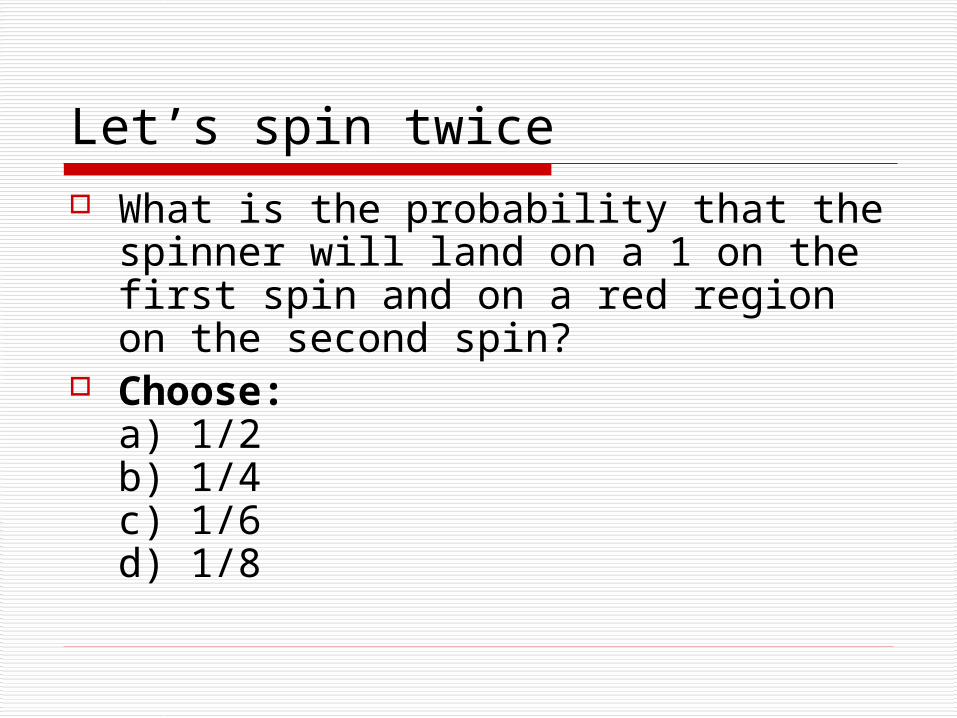
Let’s spin twice What is the probability that the
spinner will land on a 1 on the first spin and on a red region on the second spin?
Choose:a) 1/2b) 1/4c) 1/6 d) 1/8

Here is where a tree diagram will help
1st spin
P (1) 2nd spin P (red)
P (1 and red)
1 1/4 1/2 1/4 • 1/2 = 1/8

Independent events Two events are said to be
independent if the result of the second event is not affected by the result of the first event.
In our example, the event of a 1 on the first spin is independent from the event of a red on the second spin
If A and B are independent events,P(A and B) = P(A) x P(B).

Let’s spin once
P (1 and yellow) = ?
P (1 and yellow) =0
1 and yellow are mutually exclusive
So probability of both happening at the same time = 0

Let’s spin once
P (1 or yellow) = ?
P (1 or yellow) = ¼ + ½ = ¾
1 and yellow are mutually exclusive
So probability of 1 or yellow = P(1) + P (yellow)

Let’s spin
P (2 or 3 or 4)= ?
P (2 or 3 or 4)= ¾
Together 2 and 3 and 4 are complements of 1
P (complements of 1) = 1- P (1)