welcome to the future of guided analytics: introducing insights-as-a-service
TRANSCRIPT

Welcome to the Future of Guided Analytics: Introducing Insights-as-a-Service

SAme BI, DIFFerent DAy.
For 45 years, companies have been trying to solve the same problem — how to
organize and make sense of the information they need to run their business.
The good news is that, since Business Intelligence (BI) became a thing way back
in 1970, a lot more tools have been added to the proverbial tool kit, which in it’s
earliest stages consisted mostly of data warehousing tools provided by early
innovators, like IBM. Companies today have access to much more sophisticated
solutions to not just store their data, but bring it together and organize it into
dashboards and reports in an effort to extract meaning.
the reality is, most businesses are still challenged to turn data into results.

Sure, the tools have become more sophisticated, but not as fast as the
requirements have become more complicated. Business is moving faster
than most business intelligence solutions and providers can keep up.
The volume, variety, velocity, and most importantly, the value of big data
to an organization are outpacing not just the tools themselves, but companies’
and users’ ability to implement and use BI solutions effectively.

1970 1980 1990 2000 2010
Disparate records
and information
stored in the
first database
MRP, order entry
and accounting
solutions released
with slow, EOD
or weekly
batch-loading
capabilities
ERP systems
bring together
many solutions
within a central
database for
company-wide
reporting.
ETL allows for
growth. Data
querying messy
and unreliable.
Business Intelligence
is established as
a known term.
The first official BI
tools are released-
Cognos and
Business Objects.
First virtualized
(cloud) databases
take storage
into the terabytes,
and set the
stage for the
first wave of
exec dashboards.
LucidEra, one
of the first SaaS
BI providers,
begins offering
revenue and
sales analytics
on SFDC
AppExchange.
Large stack
vendors still
own 2/3 of
BI market.
LucidEra ceases
operations. SaaS
vendors GoodData
and Birst offer safe
harbor programs
for their customers
to continue doing
cloud BI.
Cloud BI begins
gaining traction
as sources and
scale climb.
Templatized
applications
emerge
focused less
on technology
and more on
user needs.
GoodData
becomes the
first entrant in the
Insights-as-a-Service
space, delivering
user driven BI
solutions that start
with insight.
Gartner notes
a shift of BI
ownership to
business groups,
as users struggle
to turn social,
marketing and sales
data into insight
in an effort to
move ahead of the
competition.
Digital data
grows to 1227
exabytes annually.
BI is pervasive in
35% of companies,
as people consume
3.6 zettabytes
of data. Data
sources multiply.
Data volume grows
to 161 exabytes
a year, IT teams
struggle to maintain
governance while
meeting growing
user needs. Business
users begin to make
BI decisions. And,
smartphones become
a thing.
Web based data
(social, internal,
SaaS) begins to
stress database
capabilities. Data
volume has hit 5
exabytes annually.
Volume, variety
and velocity
become challenges.
1.5 exabytes of
data is produced,
signaling the
advent of the
big data era.
The pressure
begins for IT to
deliver reports in
hours, not weeks
to business users
and execs.
ETL and data
warehousing
becomes the norm for
companies looking
to store increasing
amounts of data and
do faster reporting.
Vendors like Prism,
Informatica, and Ab
Initio lead the space.
Spreadsheet software
Lotus 1-2-3 is released,
for the first time users
can begin to access,
organize and control
their data.
IBM releases the first
PC. Transactional and
user-generated data
begins to grow at an
exponential rate.
BI technoloGy
BI requIrementS

WhAt’S the ProBlem here?
After almost half a century, why hasn’t the industry matured? The reason
BI hasn’t moved from the growth phase to the mature phase is because
the problem is always changing. That’s great news for cloud–based business
intelligence service providers like us who are continually challenged to innovate,
but not so great for the companies that depend on BI to deliver the insights
they need to grow their business and stay ahead of the competition.
So what’s the problem now? Believe it or not, as we sit in the middle of the
digital age, in an environment where everything is connected (people, devices,
machines and even things) — according to Gartner, the issue is communication.
Communication between the data we crave, the technology we need, and the
people who use it.

SAD FAct oF the DAy: 80% of BI Projects Still Fail.
% of win% of fail

PeoPle:75% of employees are now information workers, 100%
of business users still fighting with IT over speed/ease
of use vs. security/scale.
technoloGy:5 distinct, ever–changing technologies, most vendors
only handle 1-3.
DAtA:2.5 quintillion bytes of (potentially untrustworthy) data is
produced every day, most vendors not prepared to do the
dirty work on connection, integration, cleansing & quality.

Who’S DrIvInG the BuS...IneSS IntellIGence?
OK, it’s a bad joke, but still a good question. Who’s in charge of BI now on
the enterprise side? We know that vendors are working fast and furiously to
solve the challenges in connecting technology, data and people. (As a side
note, GoodData is end-to end across all 5 technologies. Plus we integrate
cloud data sources better than any solution on the market, seriously crushing
the competition at social and digital.) But who’s responsible for fixing the
disconnect on the corporate side of the equation?

You might be surprised. While IT is still actively involved in the process of
vetting and implementing BI solutions, business users are the ones driving
demand. A recently published Gartner report, “Market Trends: Business
Intelligence Tipping Points Herald a New Era of Analytics”, explains that
four distinct tipping points will accelerate the adoption of business intelligence
and analytics in 2014 and onwards — moving the market beyond systems analytics,
and even business analytics, into true personal analytics. One of those tipping
points? The need for real data discovery.
That’s right, CEOs, CMOs, CSOs, business unit managers and the analysts that
support them — are who’s driving requirements and the BI selection bus now.
And what do they want? They want insights, they want them fast, and they don’t
want to have to jump through hoops, or become a data scientist to find them.
This represents a huge shift from the days where older, semantic–layer architectures
fit the bill, to a new era where BI must be analysis (or better yet, insight) –centric,
instead of reporting–centric. (Read more about this trend on our blog)
What does that translate into in terms of platform requirements?

eASe oF uSe:Self-service exploration
PerSonAlIzAtIon:Customizable dashboards
SPeeD oF InSIGht:in memory data repositories

Fun FAct oF the DAy: 50% of Net-New Buying in BI Will Be Driven by Data Discovery Requirements in 2014.

let’S extrAct Some meAnInG
So what does this leave us? BI is now being led by business units and managers,
instead of corporate systems and IT. This changes everything.
Gartner suggests that the fundamental shift from reporting to analysis will disrupt
the market, allowing more agile entrants in the market to grab share from or even
displace legacy vendors, as they deliver new, differentiated capabilities focused
more on people and less on technology. The ones that will be the most successful
are those that can solve the communication (and enablement) challenges, allowing
users achieve faster discovery of critical business insights, while still conforming to
IT’s governance needs.
At the forefront of that fray? GoodData.

With major feature additions to our Open Analytics platform, we’re leading the
way into a bold new world of BI. See, the way we’re looking at things is that this
whole time — BI has been upside down in its approach. It’s been so heavily focused
on solving the technology and data portions of the communication conundrum with
infrastructure solutions — that the users (and the business context that they maintain)
have been left out in the cold.
Communication is the key to successful BI — but the real communication problem
has been between people, data and the insights they need to drive their business
forward. With business units now holding the proverbial keys (and budgets) to
the future of BI — we, and our competitors are being challenged to deliver solutions
that put decision-makers at the center, taking customers beyond the barriers of
traditional BI.

IntroDucInG InSIGhtS-AS-A-ServIce
As we enter this new era, with business users and units leading the charge in
sourcing and purchasing solutions that are less stack and more outcome-oriented,
there’s much to consider. Now that the traditional definition of BI has been
shattered, and the paradigms around who owns it, what it encompasses and
what it achieves challenged — is it still business intelligence, or is it something else?
We propose that we’re at the advent of a whole new category:
InSIGhtS-AS-A-ServIce: a subscription analytics delivery model that
abstracts the technology and management from the software, providing
a streamlined interface and experience focused on guided data discovery,
offering fast delivery of actionable insights.

What benefits will Insights–as–a–Service provide above traditional BI, and
what must providers do to get there?
exPeDIteS tIme to vAlue: When all of the technology and data complexity is abstracted from the implementation of an analytics tool, you start with analytics rather than data warehousing. True Insights–as–a–Service companies should produce insights in a matter of days.
IncreASeS uSer SelF-SuFFIcIency: In order to accomplish the personalization and self-service exploration that Gartner mentions as key tipping point requirements, Insights-as-a-Service companies must develop an experience that allows all levels of users to explore their data. The software not only needs to be easy to use, it also must reduce reliance on IT to bring in more information.
oFFerS more GuIDAnce thAn BuSIneSS IntellIGence: The benefit of abstracting the technology details from the analytics lifecycle is that businesses then have more time to focus on the decisions that are being made, based on the insights they get. Insights–as–a–Service companies must develop mechanisms to guide user
behavior and highlight unknown recommendations and relationships.
Gartner states that this tipping point has already begun, and we absolutely
agree. In fact, we, and leading market analysts, believe that GoodData is
strongly positioned to deliver the future of guided analytics, as the first entrant
in the Insights–as–a–Service category.

GuIDInG the Future oF AnAlytIcS
How did we arrive at this conclusion? Well, we’ve been doing this since 2007.
One thing (among many) that makes us really unique is that all of our customers
projects live on the same computing fabric, in our multi-tenant, cloud platform
environment. All 140,000 users; all 50,000 projects; and 100s of their data sources.
This gives us a significant advantage over our competitors, who are still deploying
projects in one-off silos, missing the opportunity to develop key learnings across
their customer base.
What it gives us in an unprecedented understanding into how and why our
customers succeed, leveraging best practices culled from every customer at
every step of the BI process — from data connection through visualization--via
our end–to–end, fully–managed platform. We then bounce these up against
our implementation and account management teams, identifying trends and
validating KPIs, essentially gathering BI on our own BI.

From templatized applications to fully–custom projects, we know what types
of data our customers care about; what challenges they face with that data;
how to model those various sources together; common KPIs and metrics for
various industries and projects; and even the ideal visualizations to communicate
those stories. Additionally, we’ve learned the importance of experience and
support — our services team is often the secret sauce that takes a project from
good to great, guiding our customers along the path to results based on the
lessons of thousands of project iterations.
We call the institutional knowledge we’ve developed from seven years
of deployments, services expertise and the activity and metadata that
exists within more than 50,000 projects in our cloud-based open
analytics platform — collective intelligence. It gives us an unmatched
ability to understand the best practice insights and processes that are
driving businesses today. And we’re using it to solve the communication
challenge between people, their data, and the insights they need, delivering a
one-of-a-kind, human experience that guides users to fast discovery and action.
PeoPle:We understand your business and challenges. We build
customized enterprise–grade solutions around the insights
you need.
InSIGhtS:We don’t stop at insights, we start there — giving the tools
you need to iterate and act upon best practice KPIs, without
engaging IT.
DAtA:We work as an extension of your team — managing the
entire data pipeline on your behalf. so you can focus
on decision–making.

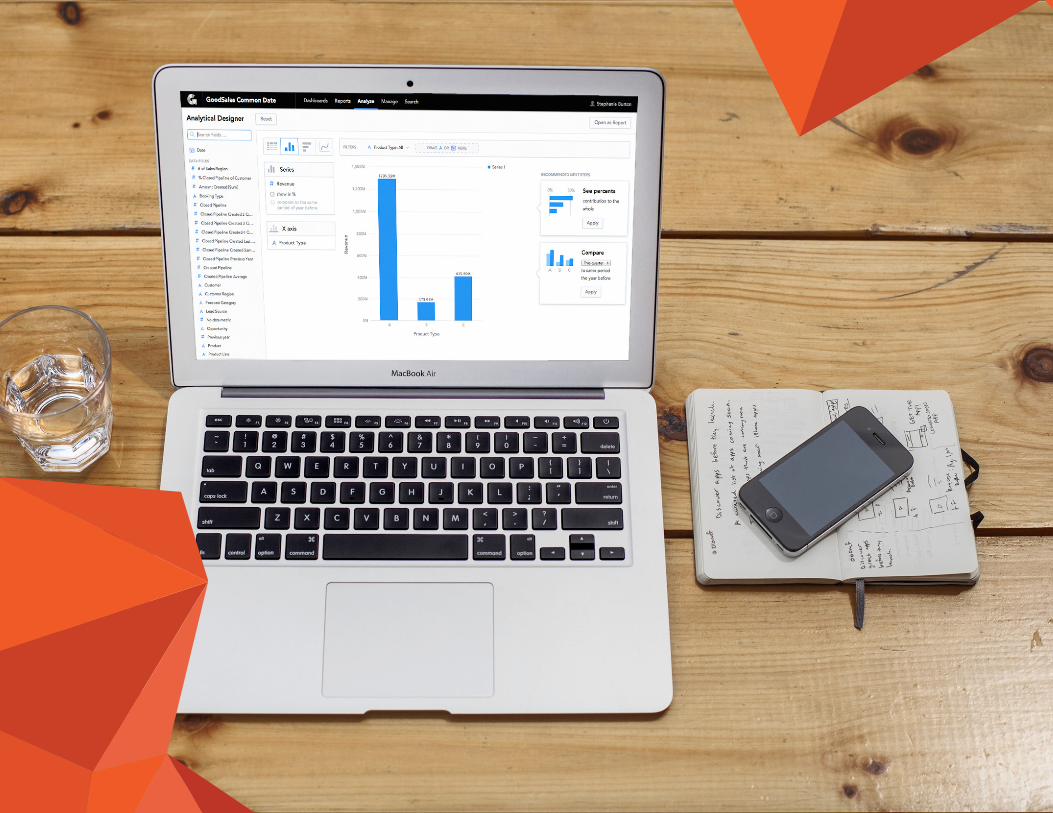
your PlAtForm For SucceSS
We’ve harnessed this collective intelligence in our powerful Insights Engine,
paving the way for a more intuitive and suggestive experience that actually
recommends better ways to explore your own data.
Our Analytical Designer delivers on business users’ need for powerful, fast
data discovery — suggesting best practice KPIs that expose people to new
perspectives on their data. With its easy drag and drop format, it serves as
a canvas for inspiration. The beauty of the guided interface is that it gives
business users and analysts the access they require to best practices,
while also allowing them the flexibility to integrate their own experiences
and judgement into the design of their visualizations. It’s the intersection
between your expertise and ours.
We also offer a unique interface called the Data Explorer. The Data Explorer
allows users to add and integrate newly available data, without requiring IT
support, alleviating communication challenges while speeding time to insight.
Want to see what data poetry looks like in motion? Check out the new interface.

GuIDInG the Future oF AnAlytIcS
With these changes, GoodData has turned the outdated, technology-driven
BI model inside out, pioneering a new category where insights (and the users
that turn them into action) come first, Insights–as–a–Service. Leveraging collective
intelligence, GoodData has disrupted the industry in much the same way as
Google, Amazon and Netflix did when they began using behavioral metadata
to improve search results, personalize the purchase experience, and recommend
products. Suddenly customers could find information more quickly, they were
better informed. They had a higher level of trust and confidence in their decisions.
Via the power of collective intelligence, GoodData is creating a new paradigm
with a guided analytics experience that is faster, smarter, more personal.
What else do we do really well?

We oWn your ProBlem:We build and run the technical infrastructure, reducing
complexity while managing scale and updates via our
SaaS-based solution.
We FInD your SolutIon:Whether you choose a templated solution, or a custom build,
we’re here to right fit your project to your org and give you
the support you need.
We PoWer your SucceSS:With our sales, marketing, and social accelerators, we’ll have
you to your first insight in weeks and we’ll stick with you as
your needs mature.

When your netWork IS your net Worth
What’s the opportunity then, for businesses who choose GoodData? It’s the
ability to benefit for the very first time from the “network effect” of other
companies using the same types of technologies. The chance to move faster
using best practices; sidestep pitfalls by avoiding past mistakes; work in an
environment of visibility instead of isolation; unfetter discovery while still ensuring
proper governance; spend more time taking action instead of managing complexity.
With the network, companies can focus on their net worth — making smarter
decisions and taking wiser actions in real-time to achieve business wins.
These are kinds of innovations businesses that adopt Insights-as-a-Service
solutions can expect to benefit from as we enter the next phase of guided
analytics. As your Analytics Ally, GoodData is here to help, as you take the
next step in your journey to insights.

Imagine the results you could achieve in a world where your:
cmo can react within 10 clicks and 2 minutes to news that
sales are off track. Using the Analytical Designer, she’s guided
for the first time to the discovery that upping the Facebook
ad spend will help her exceed marketing sourced revenue goals.
Clear Export to Report
FILTERS DRAG HEREORADate: This quarter
Series
Engagement
show in %compare to the same periodof year before
#
X axis
Date
group by quarter
4,178.004,557.00
5,187.004,813.00
Enga
gem
ent
US Short (Date)
6k Series 1
5k
3k
4k
2k
1k
0kQ1/2014 Q2/2014 Q3/2014 Q4/2014
Apply
Comparewith same periodthe year before
time
RECOMMENDED NEXT STEPS
Analytical Designer
engagement
DATA FIELDS
?Engagement
Engagement Goal
#Engagement % Till Goal#
#Engagement Prev Q#Engagement Rate % Chang...#Engagement Till Goal.#
Social E-Commerce Dashboards Reports Manage Search Data AnalystAnalyze

Imagine the results you could achieve in a world where your:
Director of Digital marketing can experiment with new
channels. Using the Data Explorer, he can easily pull in
new data sources, evaluate their projected contributions
based on best practices and invest in those with the highest
anticipated ROI.
Social E-Commerce Operational Metrics Forecasts Predictive Channels Yearly OverviewAdvanced Analytics
Social E-Commerce Help Chief Marketi...?
TIMELINEDEVICECAMPAIGNPRODUCTCHANNELTYPE
Filters
Paid All All All All Jul 2014 - Dec...
7,200
19,216
27% 110k
45%PREV Q
OF GOAL OF
MONTHLY HISTORY
SINCEPREV Q3,600
W1
This Last
0
Visits total
30k33%2,004
PREV Q
17% 20kOF GOAL OF
SINCEPREV Q
Engagement
3.34k
ENGAGEMENT HISTORY
26% 1MMOF GOAL OF
Jul 2
014
Aug 20
14
Sep 20
14
Oct 20
14
Nov 201
4
Dec 20
14
Conv % Chatter Act
Sales total
.32MM36%194k
PREV Q SINCEPREV Q
MONTHLY HISTORY
Impr
essio
ns
145,379
Company ComparisonConversion Funnel

Imagine the results you could achieve in a world where your:
Director of Analytics can respond to a request from the
CEO to take recently released market data to forecast the
impact of recent survey results on their share of voice and
sales for the quarter – all in less than 10 minutes.
Multiple Regression Analysis ( Using R)Historical Facebook Interactions Trend
Predicted Interactions
8
28
21
14
7
0
04/0
2/20
14
04/0
8/20
14
04/0
9/20
14
04/1
0/20
14
04/2
9/20
14
04/3
0/20
14
05/0
1/20
14
05/0
2/20
14
05/0
6/20
14
05/0
7/20
14
05/0
8/20
14
05/0
9/20
14
05/1
3/20
14
05/1
4/20
14
05/1
6/20
14
05/1
9/20
14
05/2
0/20
14
05/2
2/20
14
05/2
3/20
14
05/2
6/20
14
05/2
7/20
14
05/2
9/20
14
05/3
0/20
14
i Facebook Interactions = #Likes + #Comments + #Shares
MESSAGE DAY OF WEEK
MESSAGE POST HOUR
MESSAGE TYPE
PAGE FANS
1
2
3
4
Sunday
9:00 am
non-photo
2500
Forecast Dashboards Reports Manage Search Chief Marketi...Help?
Statistical AnalysisStat Functions Time Series Forecasting Regression Analysis Multiple Regression Analysis (Using R) Lagged Correlation Outlier Analysis Normality Check

About GoodDataThe industry’s first Insights–as–a–Service
provider, GoodData helps organizations
of all kinds tackle their data challenges,
delivering business-changing insights in
a fraction of the time.
Our Open Analytics Platform is the
only solution that puts the power of
Collective Intelligence at your fingertips
— leveraging best practices developed
from millions of user interactions to
recommend better ways to explore
your data.
GoodData. We start with insights, so
you can end with results.

[email protected] 415-200-0186 @gooddataGet in touch. gooddata.com
leArn more, Do more
Interesting in learning more? Watch this short video to see how
GoodData is changing the game.