welcome to the welcome to the sidestreamsidestream ... treatment webcast slides only...welcome to...
TRANSCRIPT

Welcome to the Welcome to the SidestreamSidestreamffTreatment for Nutrient Removal and Treatment for Nutrient Removal and
Recovery Webcast!Recovery Webcast!
The Webcast Will Begin Momentarily
Enjoy Information on Related WEF and WERF Activities

Related WEF Events
Urban River Restoration 2010 Conference (M h 7 10 2010) B t M h tt(March 7-10, 2010), Boston, Massachusetts http://www.wef.org/UrbanRiver/
Cities of the Future 2010 Conference (March 7 10 2010) Boston Massachusetts7-10, 2010), Boston, Massachusetts http://www.wef.org/CitiesoftheFuture/

Related WEF Events
Residuals & Biosolids 2010 Conference (May 23-26, 2010), Savannah, Georgia ( y , ), , ghttp://www.wef.org/ResidualsBiosolids/
WEF/IWA/WERF Nutrient Conference –1st Quarter 20111 Quarter 2011

Companion Publications
Design of Municipal Wastewater Treatment Plants — MOP 8, ,5th Edition• click here
• Sidestream Treatment chapter of MOP 8 available for individual purchaseMOP 8 available for individual purchase
• click here

WEF Committees & Groups Add i R l t d IAddressing Related Issues
• Municipal Wastewater Treatment DesignMunicipal Wastewater Treatment Design
• Plant Operations & Maintenance
• Residuals & Biosolids
• Algae Technologies
To Join Committees Go To:
Algae TechnologiesWorking Group
To Join Committees Go To: http://www.wefnet.org/onlineform/CommitteeMembership/CommitteeMembershipApplication.asp

WERF Nutrients ChallengePeople:• Core Leadership Team
Goals:• Develop and share credible
JB Neethling, HDR(lead principal investigator)
Amit Pramanik, WERF (program manager)
scientific information
• Better understand existing (program manager)Julian Sandino, CH2M-HILLH. David Stensel,
University of Washington
ette u de sta d e st gmechanisms of nutrient removal and best available technologies University of Washington
Roy Tsuchihashi, AECOMDavid Clark, HDR
• Issue Area TeamIssue Area Team(volunteer experts)
• Collaborators / Affiliates
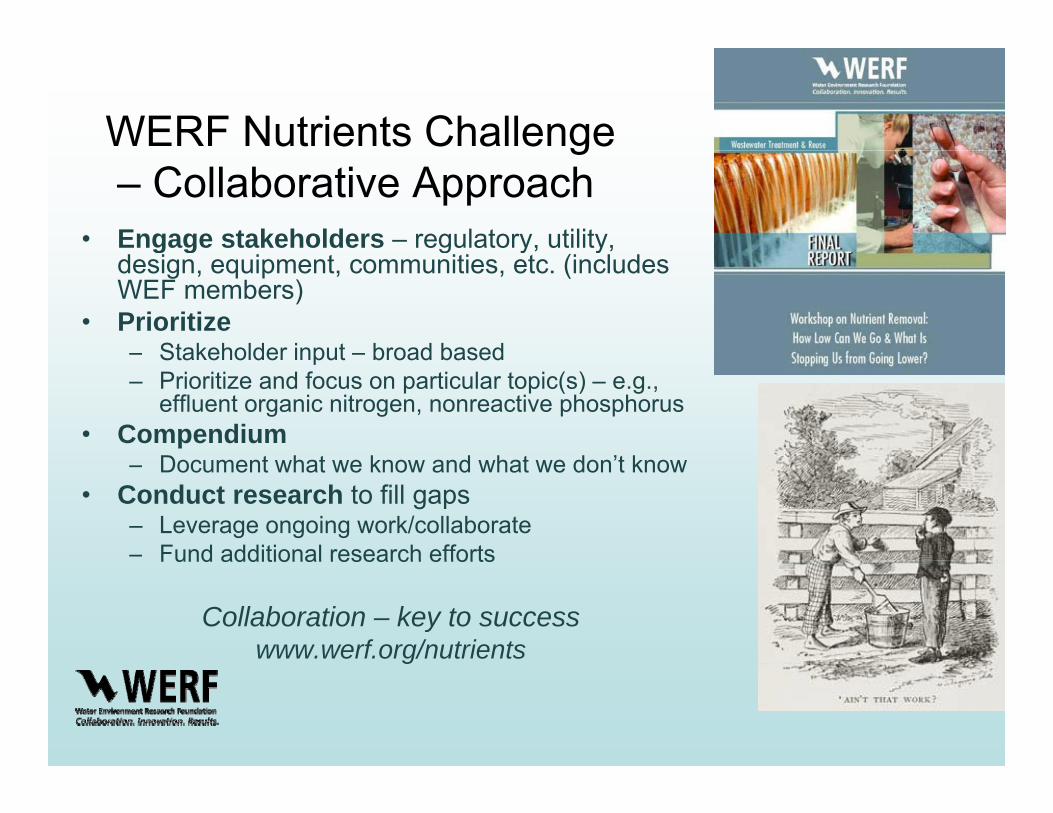
WERF Nutrients Challengeg– Collaborative Approach
• Engage stakeholders – regulatory, utility, g g g y ydesign, equipment, communities, etc. (includes WEF members)
• Prioritize– Stakeholder input – broad basedStakeholder input broad based– Prioritize and focus on particular topic(s) – e.g.,
effluent organic nitrogen, nonreactive phosphorus• Compendium
D t h t k d h t d ’t k– Document what we know and what we don’t know• Conduct research to fill gaps
– Leverage ongoing work/collaborate– Fund additional research effortsFund additional research efforts
Collaboration – key to successwww.werf.org/nutrientsg


GoToWebinar Attendee Interface1. Viewer Window 2. Control Panel

Webcast AgendaA. Sidestream Treatment – When is it Beneficial
and What are the Options? Sudhir Murthy, DCWSADCWSA
B. Design and Operating ConsiderationsConsiderationsBeverley Stinson, AECOM
C N th A i ’ Fi t F ll S l N t i tC. North America’s First Full Scale Nutrient Recovery Installation, Rob Baur, Clean Water Services, Portland, OregonServices, Portland, Oregon
D. Wrap-up and Discussion, Speakers and AttendeesAttendees

Sidestream TreatmentSidestream TreatmentWhen is it beneficial and What are the options?What are the options?
Sudhir Murthy, DC Water & Sewer AuthoritySudhir Murthy, DC Water & Sewer Authority

Acknowledgements
WEFTEC 2009 Workshop 203pCindy Wallis-Lage, Black and VeatchHeather Phillips Black and VeatchHeather Phillips, Black and VeatchBeverley Stinson, AECOMDenny Parker, Brown and Caldwell

OverviewOverview
• Where do nutrients come from?
• When is sidestream treatment beneficial?
• Sidestream management options
13

The Nutrient Challenge - Liquidsg q
• Chemical phosphorus or biological phosphorus removalChemical phosphorus or biological phosphorus removal• Nitrification• Denitrification

The Nutrient Challenge - Solids• 1% of Total Plant Influent Flow
• Rich in Nitrogen & Phosphorus
• 15 to 40% of the Total Plant TN loadBiosolids Processing FacilitiesBiosolids Processing Facilities
%
• 5 to 40% Total Phosphorus load
• Ammonium Conc. 800 to 1,500 mg-N/L
T t 30 38°C
Anaerobic Digester
Thickening Sidestream
(
Dewatering Sidestream
• Temperature 30 - 38°C
• Alkalinity insufficient for complete nitrification (50% in centrate)
P i bCOD ( bCOD TKN 0 4 1)g(some nutrients)
Sidestream40-60% VS destroyed
Dewatering
• Poor in rbCOD (rbCOD :TKN = 0.4 :1)
Thickened Cake
Solids (N&P)
Dewatering
N t i t i h id t t t li id t
Solids
Approx. Half of TKN and TP released as NH4-N and PO4- PNutrient rich sidestreams return to liquid stream

Integration of liquid and solids streams can result in nutrient challengesin nutrient challenges

When is sidestream treatmentWhen is sidestream treatment beneficial?

When is sidestream treatmentWhen is sidestream treatment beneficial?
1. Effluent nutrient limits2. Sustainable nutrient removal3. Plant operations3. Plant operations 4. Regionalization of biosolids
iprocessing

When is sidestream treatment beneficial?
11 Effluent nutrient limitsEffluent nutrient limits
beneficial?1.1. Effluent nutrient limitsEffluent nutrient limits
• Phosphorus regulations (water quality)• Ammonia regulations (aquatic toxicity)• Phosphorus regulations (water quality)• Ammonia regulations (aquatic toxicity)Ammonia regulations (aquatic toxicity)• Nitrate regulations (SDWA MCL)• Total nitrogen
Ammonia regulations (aquatic toxicity)• Nitrate regulations (SDWA MCL)• Total nitrogenTotal nitrogen• Permit type
– Daily, weekly, etc
Total nitrogen• Permit type
– Daily, weekly, etc
NH3N NO3N
NO2N Sol Org N
Part Org N
Sol. O
Part y, y,y, y, Org N Org NOP P

Sidestream Control Impacts Effluent QualityEffluent Quality
1.8
2.0
1.4
1.6
a (m
gN/L
)
Average effluent NH3N = 0.86 mg/L with equalized sidestream return
0 8
1.0
1.2
ent A
mm
onia with equalized sidestream return.
0.4
0.6
0.8
Plan
t Effl
u
0.0
0.2Average effluent NH3N = 0.50 mg/L with controlled sidestream return at night during low influent loads.
1 1.1 1.2 1.3 1.4 1.5 1.6 1.7 1.8 1.9 2
Time (days)

When is sidestream treatmentWhen is sidestream treatment beneficial?
1. Effluent nutrient limits2. Sustainable nutrient removal2. Sustainable nutrient removal
1. Can consume less energy2. Can require less carbonCa equ e ess ca bo3. Can optimize overall process capacity4. Can produce a resource (moves away from p ( y
“treating a waste” mindset)

Autotrophic HeterotrophicAutotrophic Heterotrophic
2-step Nitrification / Denification (simplified)
1 mol Nitrate(NO3
- )
izers
ter)
utot op cAerobic Environment
40% Carbon
HeterotrophicAnoxic Environment1 mol Nitrate
(NO3- )
izers
ter)
utot op cAerobic Environment
40% Carbon
HeterotrophicAnoxic Environment
1 mol Nitrite
Nitri
te O
xidiz
(e.g
. Nitr
obac
te
1 mol Nitrite
25% O2
1 mol Nitrite
Nitri
te O
xidiz
(e.g
. Nitr
obac
te
1 mol Nitrite
25% O2
1 mol Nitrite(NO2
- )
Oxid
izers
omon
as)
1 mol Nitrite(NO2
- ) 60% Carbon1 mol Nitrite
(NO2- )
Oxid
izers
omon
as)
1 mol Nitrite(NO2
- ) 60% Carbon
1 mol Ammonia
Amm
onia
O(e
.g. N
itros
o
75% O2
½ mol Nitrogen Gas(N )
1 mol Ammonia
Amm
onia
O(e
.g. N
itros
o
75% O2
½ mol Nitrogen Gas(N )(NH3/ NH4
+) (N2 )(NH3/ NH4 +) (N2 )
Oxygen demand 2 mole / mole = 4.57 g / g NH+4-N oxidized
Carbon demand = 2.86 (3 - 4.5) g CODs / g NO-3-N reduced( ) g g 3

Nitritation / denitritation (simplified)
1 mol Nitrate(NO - )
AutotrophicAerobic Environment
40% C b
HeterotrophicAnoxic Environment1 mol Nitrate
(NO - )
AutotrophicAerobic Environment
40% C b
HeterotrophicAnoxic Environment
Benefits;• 25% Reduction in Oxygen Demand(NO3 )
ite O
xidize
rs
Nitro
bact
er)
25% O
40% Carbon(NO3 )
ite O
xidize
rs
Nitro
bact
er)
25% O
40% Carbon• 40% Reduction in Carbon (e- donor) Demand• 40% Reduced Biomass Production
1 mol Nitrite(NO2
- )
rs
Nitri
te(e
.g. N
it
1 mol Nitrite(NO2
- )
25% O2
60% Carbon1 mol Nitrite
(NO2- )
rs
Nitri
te(e
.g. N
it
1 mol Nitrite(NO2
- )
25% O2
60% Carbon
mm
onia
Oxi
dize
rs
Nitro
som
onas
)
75% O2
mm
onia
Oxi
dize
rs
Nitro
som
onas
)
75% O2
1 mol Ammonia(NH3/ NH4
+)
Amm
(e.g
. N
½ mol Nitrogen Gas(N2 )
1 mol Ammonia(NH3/ NH4
+)
Amm
(e.g
. N
½ mol Nitrogen Gas(N2 )

Deammonification (simplified)
1 mol Nitrate(NO3
- )
AutotrophicAerobic Environment
40% Carbon
HeterotrophicAnoxic Environment1 mol Nitrate
(NO3- )
AutotrophicAerobic Environment
40% Carbon
HeterotrophicAnoxic Environment
Benefits:• 63% reduction in Oxygen Demand• Almost 100% reduction in Carbon Demand
Nitri
te O
xidize
rs
g. N
itrob
acte
r)
25% O2
Nitri
te O
xidize
rs
g. N
itrob
acte
r)
25% O2
Almost 100% reduction in Carbon Demand• Much reduced Biomass Production• Reduced CO2 emissions (4.7 - 0.7 ton CO2/ton N)
1 mol Nitrite(NO2
- )
zers
as)
Nit
(e.g
.
1 mol Nitrite(NO2
- ) 60% Carbon1 mol Nitrite
(NO2- )
zers
as)
Nit
(e.g
.
1 mol Nitrite(NO2
- ) 60% Carbon
Amm
onia
Oxi
diz
e.g.
Nitr
osom
ona
75% O2
Amm
onia
Oxi
diz
e.g.
Nitr
osom
ona
75% O2
AutotrophicAnaerobic
Environment1 mol Ammonia
(NH3/ NH4 +)
A (e.g
½ mol Nitrogen Gas(N2 )
1 mol Ammonia(NH3/ NH4
+)
A (e.g
½ mol Nitrogen Gas(N2 )
Environment
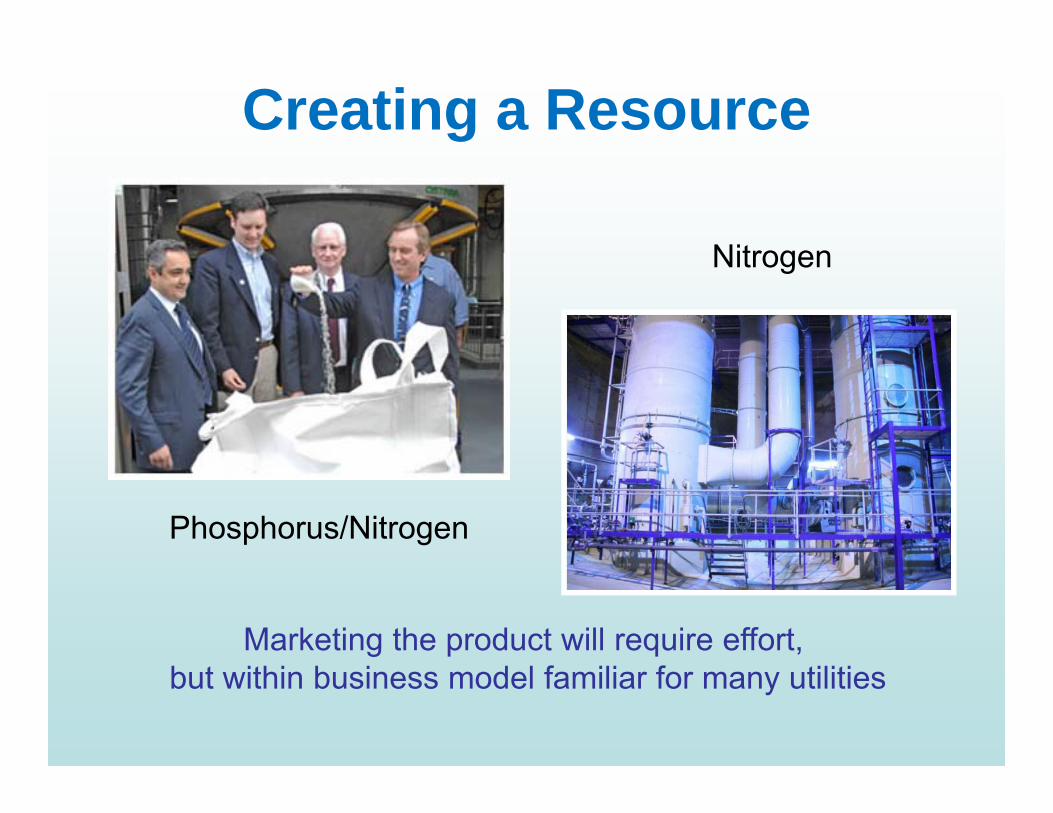
Creating a Resource
NitrogenNitrogen
Phosphorus/Nitrogen
Marketing the product will require effort, but within business model familiar for many utilities

Ammonia Stripping ChemistryThe ammonia gas molecule NH andThe ammonia gas molecule NH3 and
the ammonium ion NH4+ (perfers to be in solution)
NH + H O NH + + OH-NH3 + H2O NH4+ + OH-
• Shift equiibrium so that ammonium in centrate goes to ammonia gas
• Strip ammonia gasto the air
Ab b i i• Absorb ammonia in an acid solution
• Reuse as a fertilizerReuse as a fertilizer

Ammonia Stripping• Raising pH and/or
temperature penhances conversion to ammonia gasg
• Higher operating temperaturetemperature reduces caustic consumption– Reducing pH from
9.5 to 9.0 reduces caustic demand by ~ 50%~ 50%

When is sidestream treatmentWhen is sidestream treatment beneficial?
1. Effluent nutrient limits2. Sustainable nutrient removal3 Plant operations3. Plant operations
Dewatering equipmentDewatering schedulePretreatment/advanced digestiong

When is sidestream treatment beneficial?
1. Effluent nutrient limits2 Sustainable nutrient removal2. Sustainable nutrient removal3. Plant operations 4. Regionalization of biosolids processing

Regionalization of Biosolids Processing
Regionalization = Capital and O&M Cost Savings
A bi M h i lS lid f
BUT, increase in N and P in sidestreams
AnaerobicDigestion
MechanicalDewatering
Solids fromPlant A
Sidestream (NH3-N, PO4-P)
Solids fromPlant B
AnaerobicDigestion
MechanicalDewatering
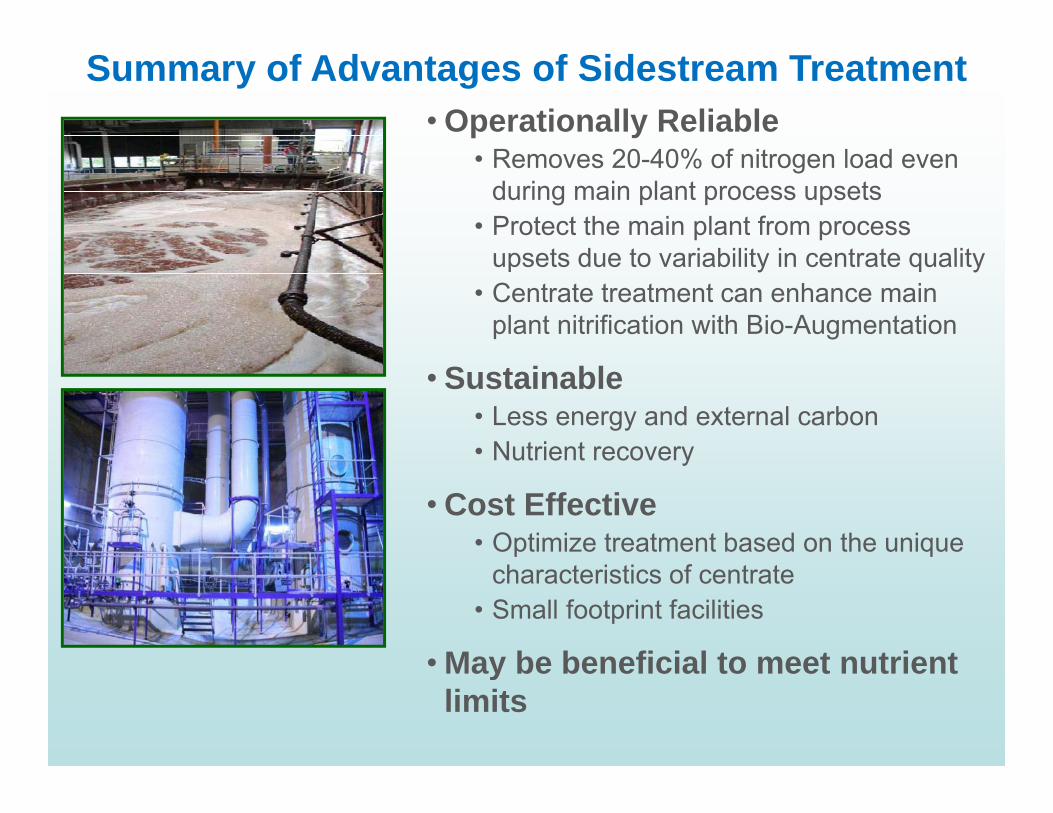
• Operationally Reliable R 20 40% f it l d
Summary of Advantages of Sidestream Treatment
• Removes 20-40% of nitrogen load even during main plant process upsets
• Protect the main plant from process psets d e to ariabilit in centrate q alitupsets due to variability in centrate quality
• Centrate treatment can enhance main plant nitrification with Bio-Augmentation
• Sustainable• Less energy and external carbon• Nutrient recoveryNutrient recovery
• Cost Effective• Optimize treatment based on the unique
characteristics of centrate• Small footprint facilities
• May be beneficial to meet nutrient• May be beneficial to meet nutrient limits

Sidestream Treatment Options
Novel Sidestream Treatment Options
Sidestream Treatment Options
Bi l i l Ph i l Ch i lBiological Physical-ChemicalNitrification / Denitrification& Bio-augmentation Ammonia Stripping
• Steam
Ion-Exchange
• With RAS & SRT Control• With RAS• Without RAS
Nitritation / Denitritation
Steam• Hot Air• Vacuum Distillation
Ion Exchange• ARP
Struvite Precipitation• MAP Process
Nitritation / Denitritation • Chemostat • SBR• Post Aerobic Digestion
• MAP ProcessDeammonification
• Suspended Growth SBR• Attached Growth MBBR• Upflow Fluidized Bed• Upflow Fluidized Bed

S D i d O ti C id tiSome Design and Operating Considerations to Help You Select the
Right Centrate Treatment Process for Your FacilityRight Centrate Treatment Process for Your Facility
Beverley Stinson, AECOMBeverley Stinson, AECOM

Sidestream Treatment Options
Novel Sidestream Treatment Options
Sidestream Treatment Options
Bi l i l Ph i l Ch i lBiological Physical-ChemicalNitrification / Denitrification& Bio-augmentation Ammonia Stripping
• Steam
Ion-Exchange
• With RAS & SRT Control• With RAS• Without RAS
Nitritation / Denitritation
Steam• Hot Air• Vacuum Distillation
Ion Exchange• ARP
Struvite Precipitation• MAP Process
Nitritation / Denitritation • Chemostat • SBR• Post Aerobic Digestion
• MAP ProcessDeammonification
• Suspended Growth SBR• Attached Growth MBBR• Upflow Granular Process• Upflow Granular Process

In-Nitri®,BAR, AT#3 & BABE Bioaugmentation
I b t l ti f it ifi d th d l th t th i t ti t d • Incubate a population of nitrifiers and then deploy them to the mainstream activated sludge (AS) system
• Mainstream AS volume / SRT can be reduced because of the elevated nitrifier population from this seeding processg p
1 mol Nitrate(NO3
- )40% Carbon
1 mol Nitrite(NO - )
1 mol Nitrite(NO2
- )
25% O2
60% Carbon(NO2 ) (NO2 )Nitritation / Denitritation
75% O2
½ mol Nitrogen Gas(N2 )1 mol Ammonia
(NH3 / NH4 +)
Nitrification / Denitrification

AT#3 & BABE(Chemostat) (SBR) (BioAugmentation Batch Enhancement)
Final Clarifiers
PrimaryInfluent Effluent
• Centrate treated in a small separate tank (~4 day HRT) • Portion of the mainstream RAS to centrate tank
Seeds nitrifiers, adds alkalinity & controls temperatureActivated
Sludge
Dewatering
RAS
Nitrifier Rich NOx laden MLSS
Introduces Nitrite oxidizing bacteria
AT#3• No dedicated clarifier
BABE (Commercial)• SBR – built in clarifier Centrate
Nitrifier & denitrifier Rich MLSS
AT #3 Chemostat
AnaerobicDigestion
Aeration AlkalinityMethanol
or RAS system• MLSS back to the
main AS process
• Control on SRT• WAS / Effluent back to the main
AS process• Clarifier effluent NOx to head of g• Clarifier effluent NOx to head of
plant for odor control (Phoenix)
• NOx denitrified in first anoxic zone of AS systemP bl ti i Bi P l t
Centrate
Clarified Effluent or Nitrifier Rich MLSS
Dewatering
• Problematic in a Bio-P plant• Can add methanol for denitrification and methanol degrader seeding• Several full scale installations - New York City (2), Hertogenbosch,
NL. Extensive piloting and research.
BABE SBR
AnaerobicDigestionp g
Nitrifier Rich WAS
Sludge

Plant without Bio-Aug Integration• Winter TN Removal Varied from 43% - 80% • Avg. 60%
Stinson et al., “ Evaluation and Optimization of a Side Stream Centrate Treatment System Integrated with a Secondary Step-Feed Process”, WEF / IWA Specialty Nutrient Conference, Baltimore 2007

Plant without Bio-Aug Integration• Winter TN Removal Varied from 60% - 90% • Avg. 75%
Stinson et al., “ Evaluation and Optimization of a Side Stream Centrate Treatment System Integrated with a Secondary Step-Feed Process”, WEF / IWA Specialty Nutrient Conference, Baltimore 2007

Operational Benefits
• “Nitrifier Incubator” enhanced Operational Reliability
• Enhanced winter performance• Enhanced winter performance• Mitigated storm washout impacts • Mitigated centrate inhibition impacts
26th Ward WPCP – 85 mgd
• Mitigated air limitations• Off-Loaded 30% TKN Load • Oxidized 70-95% Centrate TKN gOxidized 70 95% Centrate TKN• Denitrified in main plant anoxic zone using wastewater COD• >70% TN Removal Plant-Wide
• Nitrite Accumulation in Main Plant Suggested Selection of AOB over NOB

In-Nitri® BAR / RDN / CaRRB• Bioaugmentation Reaeration or Regeneration
R ti Nit ifi ti D it ifi ti
Primary Sludge
PrimarySedimentation
Tank
RawWastewater Aeration
TankSecondary
SedimentationTank
TreatedEffluent
• Reaeration Nitrification Denitrification• Centrate and RAS Reaeration Basin (CaRRB)
Final PrimaryI fl t Effl tActivated Primary SludgeThickening WAS
Thickening
DigesterSupernatant
ThickenedPrimary Sludge
ExcessNitrificationSludgeNitrified
DewateringLiquid
Dewatering
Clarifiersy
RAS
Influent Effluent
Centrate
Sludge
SludgeDewatering
Sludge forDisposal
DewateringReturn Stream
Side-streamNitrification
Alkalinity
AnaerobicDigestion
p
• Centrate aerated in a separate side stream tank with dedicated clarifier
• No main stream RAS
• Centrate aerated in first zone of AS tanks • All main stream RAS added to centrate
reducing temperature & adding alkalinity• Primary effluent can be added to enhance
settling & add alkalinity• No full scale installations• Bioaugmentation potential not verified
• PE directed to a downstream zone• Many full scale installations
–Appleton, Czech Republic (20), Inland Empire Blue Lake Denver• Bioaugmentation potential not verified
• Patented Process - RoyaltiesInland Empire, Blue Lake, Denver
• Bioaugmentation potential observed
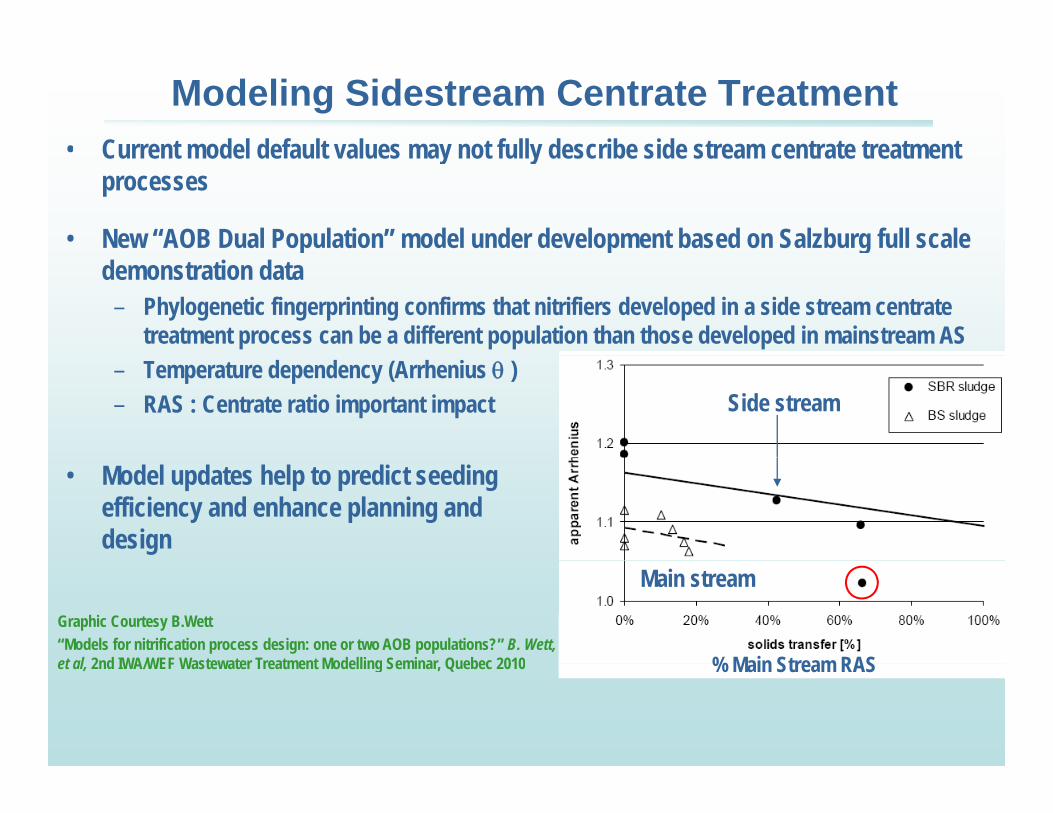
Modeling Sidestream Centrate Treatment• Current model default values may not fully describe side stream centrate treatment • Current model default values may not fully describe side stream centrate treatment
processes
• New “AOB Dual Population” model under development based on Salzburg full scale p p gdemonstration data
– Phylogenetic fingerprinting confirms that nitrifiers developed in a side stream centrate treatment process can be a different population than those developed in mainstream AS
– Temperature dependency (Arrhenius θ )– RAS : Centrate ratio important impact Side stream
• Model updates help to predict seeding efficiency and enhance planning and design
Graphic Courtesy B.Wett“Models for nitrification process design: one or two AOB populations?” B. Wett, et al 2nd IWA/WEF Wastewater Treatment Modelling Seminar Quebec 2010
Main stream
% Main Stream RASet al, 2nd IWA/WEF Wastewater Treatment Modelling Seminar, Quebec 2010 % Main Stream RAS

Key Design Consideration
O U t k R t C ld id• Oxygen Uptake Rate– OUR (>150 mg/ l hr) can define the size of tank– Select diffuser to operate at temperatures > 30C and
with intermittent aeration in an SBR (clogging)
Colder side stream process
with intermittent aeration in an SBR (clogging)
• Control RAS addition– Provides alkalinityProvides alkalinity– Develops an integrated culture of nitrifiers – Cools centrate – temp. difference important
• Too great nitrifers may not remain active in ASMore NO3-N
• Too great nitrifers may not remain active in AS• Too cool – loose selection for AOBs over NOBs
– Don’t want to recycle too many Nitrite Oxidizing Bacteria (NOBs)Bacteria (NOBs)
• May need to provide Alkalinity & OP addition
Courtesy B.Wett

Sidestream Treatment Options
Novel Sidestream Treatment Options
Sidestream Treatment Options
Bi l i l Ph i l Ch i lBiological Physical-ChemicalNitrification / Denitrification& Bio-augmentation Ammonia Stripping
• Steam
Ion-Exchange
• With RAS & SRT Control• With RAS• Without RAS
Nitritation / Denitritation
Steam• Hot Air• Vacuum Distillation
Ion Exchange• ARP
Struvite Precipitation• MAP Process
Nitritation / Denitritation • Chemostat • SBR• Post Aerobic Digestion
• MAP ProcessDeammonification
• Suspended Growth SBR• Attached Growth MBBR• Upflow Granular Process• Upflow Granular Process

A t t hiA t t hi
Nitritation / denitritation (simplified)
1 mol Nitrate(NO3
- )
ers r)
AutotrophicAerobic Environment
40% Carbon
HeterotrophicAnoxic Environment1 mol Nitrate
(NO3- )
ers r)
AutotrophicAerobic Environment
40% Carbon
HeterotrophicAnoxic Environment
Nitri
te O
xidize
r
(e.g
. Nitr
obac
ter)
1 l Nit it
25% O2
Nitri
te O
xidize
r
(e.g
. Nitr
obac
ter)
1 l Nit it
25% O2
1 mol Nitrite(NO2
- )
Oxid
izers
mon
as)
( 1 mol Nitrite(NO2
- ) 60% Carbon1 mol Nitrite
(NO2- )
Oxid
izers
mon
as)
( 1 mol Nitrite(NO2
- ) 60% Carbon
1 mol Ammonia
Amm
onia
Ox
(e.g
. Nitr
osom
75% O2
½ mol Nitrogen Gas1 mol Ammonia
Amm
onia
Ox
(e.g
. Nitr
osom
75% O2
½ mol Nitrogen Gas1 mol Ammonia(NH3/ NH4
+)½ mol Nitrogen Gas
(N2 )1 mol Ammonia
(NH3/ NH4 +)
½ mol Nitrogen Gas(N2 )
Advantages;• 25% Reduction in Oxygen Demand• 40% Reduction in Carbon (e- donor) Demand0% educt o Ca bo (e do o ) e a d• 40% Reduced Biomass Production

Sidestream TreatmentShort Circuit Conventional Process
75% Oxygen 25% Oxygen 40% Carbon 60% Carbon75% Oxygen 25% Oxygen 60% Carbon
NitriteAmmonia Nitrate Nitrite Nitrogen Gas
Control growth of Nitrite Oxidizing BacteriaControl growth of Nitrite Oxidizing Bacteria

Sidestream TreatmentShort Circuit Conventional Process
75% Oxygen 60% Carbon75% Oxygen 60% Carbon
NitriteAmmonia Nitrogen Gas
Short circuit the conventional processShort circuit the conventional process

• Temperature (30-38°C) favors growth kinetics of Ammonia Oxidizers
Nitritation / Denitritation Process Control • Temperature (30-38 C) favors growth kinetics of Ammonia Oxidizers
• SRT = HRT Sludge Age;
>Minimum for Ammonia Oxidizers, but < Minimum for Nitrite Oxidizers
Selects for Ammonia Oxidizers (AOBs) & De-selects for Nitrite oxidizers (NOBs)Courtesy: Grontmij
• pH in 6.6 to 7.2 range– Optimal range for AOBs
Courtesy: Grontmij
– Methanol for denitrification & alkalinity recovery
Min AOB SRTNitrite Route
• DO in the 0.3 to 2 mg/l range
35˚C

Chemostat Tank Configurations - SHARON Process Stable and High activity Ammonia Removal Over Nitrite
Completely Mixed tank with cyclical aeration pH controlled• Completely Mixed tank with cyclical aeration – pH controlled
• Plug flow with internal recycle– Accommodates modifications for ANAMMOX process in the futurep
Pump station
MethanolPump station
ANAMMOX½ Q
Nitritation
10Q ½ Q
• Concentric circles – feed the anoxic zone to utilize all CODs in centrate firstPump station Methanol
Phosphoric acid
Heat exchangers
Aerobic
Anoxic Effluent
Courtesy: GrontmijHeat exchangers
Cooling water(treated effluent)
Courtesy: Grontmij

Temperature Control
• Install heat exchangersEquipment;
• Blowers
• Mixers / IR pumps
• Heat exchangers

SHARON Process (Chemostat)Stable and High activity Ammonia Removal Over Nitrite
Courtesy: Grontmij
• Small Footprint– 2.5 day SRT = HRT
• Oxic SRT = 1 - 1 5 days
Courtesy: Grontmij
• Oxic SRT = 1 - 1.5 days• Anoxic SRT = 0.5 - 0.75 days
– No clarifiers– No pre-treatmentp
• 90% NH3-N removal
• Cost Reductions – 25% Oxygen demand– 40% COD demand
30% l d– 30% sludge– 20% CO2 emission

SHARON Experience• 6 operational >10 years experience• 5 planned• NYC DEP Wards Island
– First in USA & largest in world
WWTP Capacity(pe)
SHARONkgN/day
Operational
Ut ht 400 000 900 1997
≈ 30 - 40% TKN-load
Utrecht 400.000 900 1997
Rotterdam-Dokhaven 470.000 850 1999
Zwolle 200.000 410 2003
Beverwijk 320.000 1,200 2003
Groningen-Garmerwolde 300.000 2,400 2005
The Hague - Houtrust 430.000 1,300 2005
New York-Wards Island ∼2,000,000 5,770 2009
Whitlingham UK 275 000 1 500 2009Whitlingham, UK 275.000 1,500 2009
MVPC Shell Green, UK - 1,600 2009
Geneva – Aïre 2 600.000 1,900 2010
Paris Seine Grésillons 3,500 2010

SBR Tank Configuration STRASS Process
C t l SRT d HRT i d d tl• Control SRT and HRT independently– Single unit process with clarification step
• Easy adjustment to the aerobic vs anoxic cyclesy j y– “Invent type” mixer / aerator provides both aeration &
mixing – no diffusers – avoids clogging / cleaning concerns
• Beneficial to fill only during anoxic cycles to utilize available carbon for denitrification & alkalinity recovery
• Split WAS and effluent flow streams– WAS to activated sludge for seeding– Effluent to activated sludge for TN polishing – Effluent to activated sludge for TN polishing – Effluent to head of plant for odor control using NO2-N
STRASS SBR Process ControlB h d W tt W t S i & T h l V l 56 N 7 2007Bernhard Wett, Water Science & Technology Vol 56 No 7, 2007

Nitritation / Denitritation SBR ExperienceSTRASS Process
WWTP SalzburgWWTP Salzburg
WWTP Strass

Sidestream Treatment Options
Novel Sidestream Treatment Options
Sidestream Treatment Options
Bi l i l Ph i l Ch i lBiological Physical-ChemicalNitrification / Denitrification& Bio-augmentation Ammonia Stripping
• Steam
Ion-Exchange
• With RAS & SRT Control• With RAS• Without RAS
Nitritation / Denitritation
Steam• Hot Air• Vacuum Distillation
Ion Exchange• ARP
Struvite Precipitation• MAP Process
Nitritation / Denitritation • Chemostat • SBR• Post Aerobic Digestion
• MAP ProcessDeammonification
• Suspended Growth SBR• Attached Growth MBBR• Upflow Granular Process• Upflow Granular Process

A t t hiA t t hi
Deammonification (simplified)
1 mol Nitrate(NO3
- )
ers r)
AutotrophicAerobic Environment
40% Carbon
HeterotrophicAnoxic Environment1 mol Nitrate
(NO3- )
ers r)
AutotrophicAerobic Environment
40% Carbon
HeterotrophicAnoxic Environment
Nitri
te O
xidize
r
(e.g
. Nitr
obac
ter)
1 l Nit it
25% O2
Nitri
te O
xidize
r
(e.g
. Nitr
obac
ter)
1 l Nit it
25% O2
1 mol Nitrite(NO2
- )
Oxid
izers
mon
as)
( 1 mol Nitrite(NO2
- ) 60% Carbon1 mol Nitrite
(NO2- )
Oxid
izers
mon
as)
( 1 mol Nitrite(NO2
- ) 60% Carbon
1 mol Ammonia
Amm
onia
Ox
(e.g
. Nitr
osom
75% O2
½ mol Nitrogen Gas1 mol Ammonia
Amm
onia
Ox
(e.g
. Nitr
osom
75% O2
½ mol Nitrogen Gas
AutotrophicAnaerobic
Environment1 mol Ammonia
(NH3/ NH4 +)
½ mol Nitrogen Gas(N2 )
1 mol Ammonia(NH3/ NH4
+)½ mol Nitrogen Gas
(N2 )• 63% reduction in Oxygen demand• Almost 100% reduction in Carbon demand• Much reduced in Biomass production
R d d CO i i (4 7 0 7 )• Reduced CO2 emissions (4.7 - 0.7 ton CO2/ton N)

Deammonification• Low Growth Rate • Low Growth Rate
– 10 day doubling time at 20°C– SRT (30 - 50 days)
• Sensitive to;– Nitrite
• causes irreversible loss of activity – DO - reversible inhibitioncauses irreversible loss of activity • toxicity based on concentration &
exposure time • NH4
+ : NO2- ratio 1 : 1.32
– Free ammonia (<10 mg/l)– Temperature >30°C preferred– pH (neutral range)4 2 p ( g )
Bernhard Wett, 2005
1 Gallon 80 Gallons 635 Gallons 132,000 Gallons
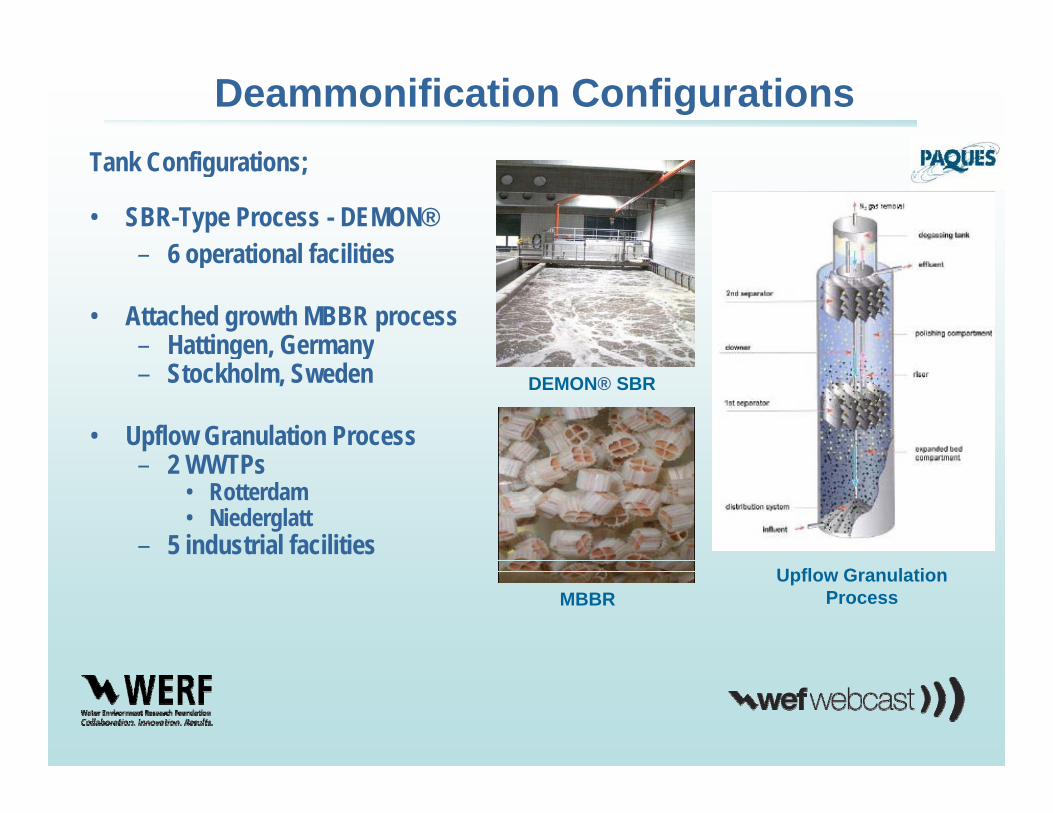
Deammonification ConfigurationsTank Configurations;
• SBR-Type Process - DEMON®6 operational facilities – 6 operational facilities
• Attached growth MBBR process– Hattingen, Germanyg , y– Stockholm, Sweden
• Upflow Granulation Process 2 WWTP
DEMON® SBR
– 2 WWTPs• Rotterdam • Niederglatt
– 5 industrial facilitiesUpflow Granulation
ProcessMBBR

Deammonification SBR ExperienceDEMON® Process
EinleitungOperational;• Strass, Austria• Glarnerland Switzerland
Apeldoorn (NL)
• Glarnerland, Switzerland• Thun, Switzerland• Plettenberg, Germany• Heidelberg, Germany • Apeldoorn, Netherlands
Heidelberg (D)Several under construction; • Croatia
Strass (A)
• Austria • Germany
Thun (CH)

DEMON® Sequencing Batch Reactor
• 84% TN Removal• 0.7 kg ammonia N per m3
• Reduced energy demand to 1 3 kW hr / kg N removedReduced energy demand to 1.3 kW hr / kg N removed
B h d W tt M h 2009Bernhard Wett, March 2009

DEMON® Sequencing Batch Reactor
• Plant undertook many energy efficiency activities • With the introduction of DEMON it became a net energy producer
Bernhard Wett, March 2007

Demon® Process Control
DEMON depends on 3 main controls (in order of hierarchy);
Ti – Time – pH – DO
Provides accurate adjustment of all three key aspectsy p
– ammonia inhibition, – nitrite toxicity
inorganic carbon limitation– inorganic carbon limitation
Bernhard Wett, Water Science & Technology Vol 56 No 7 pp 81–88 Q IWA Publishing 2007

Comparison of Process Control requirements for Nitritation / Denitritation vs. Deammonification
Nitritation / Denitritation• pH range 7.3 to 7.7• DO range 0.5 to 2.0 mg/lg g
Bernhard Wett, Water Science & Technology Vol 56 No 7, 2007
Deammonification• pH range 7.06 to 7.07• DO range 0 to 0.3 mg/l

Transition from Nitritation / Denitritation to DeammonificationDeammonification
• In general the startup • In general the startup period for deammonification is slow
• Strass started up over a 2 year period
• Startup of Glamerland, Switzerland occurred within 50 days using seed y gfrom Strass WWTP
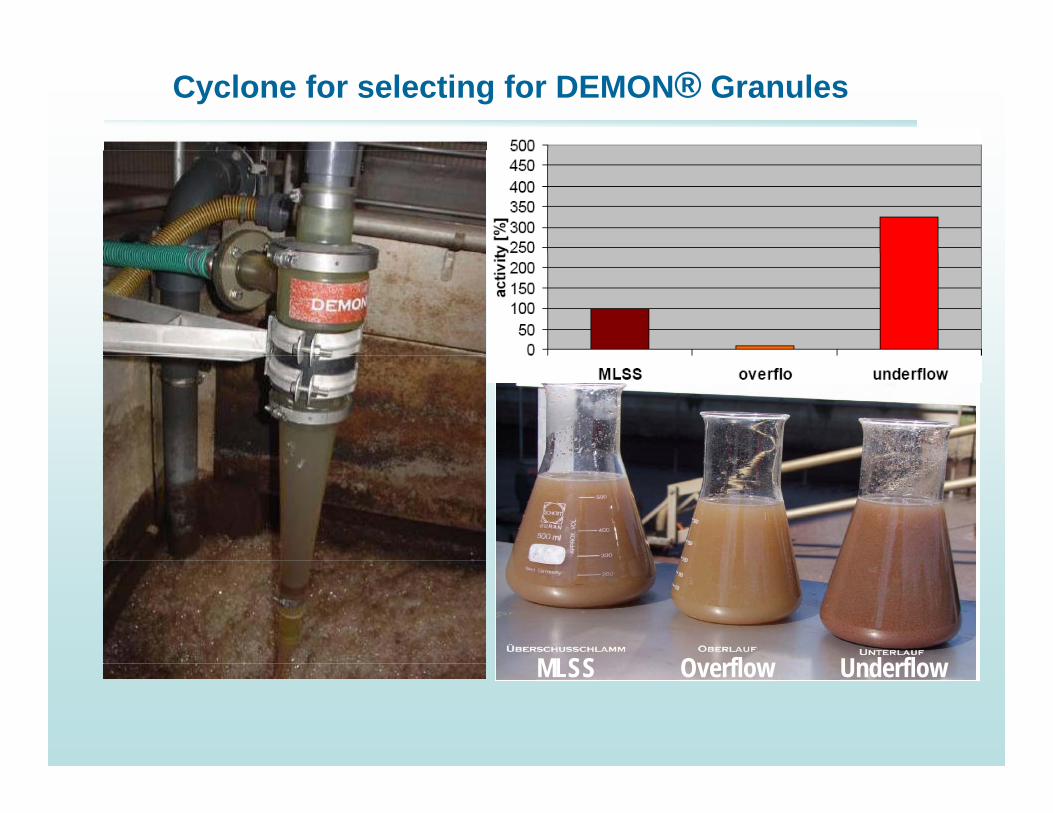
Cyclone for selecting for DEMON® Granules
MLSS O erflo UnderfloMLSS Overflow Underflow

MBBR Attached Growth DeammonificationHattingen, Germany & Stockholm, Sweden
• Fully Autotrophic ANAMMOX-like Reaction
• Biomass Exists on Media for Stability40% K1 media fill– 40% K1 media fill
– Less sensitive to nitrite concentration– Completely mixed tanks with
I t itt t ti l DOIntermittent aeration low DO
• >70% ammonium removal
E ti TN load In
• Energy consumption ~ 4.5 kW-hr/kg-N vs. 1.16 kW-hr/kg-N i STRASS SBR
TN load Removed
in STRASS SBR
Norbert, J et al., 2006, “Treatment of sludge return li E i f th ti f f llliquors: Experiences from the operation of full-scale plants,” proceedings WETEC’06, WEF, Alexandria, VA., p 5237-5255.

Upflow Granulation Process: ANAMMOX
• 2 WWTPs - Rotterdam, Niederglatt
• 5 Industrial FacilitiesNH4
+
• Rotterdam ANAMMOX startup 2002
• Initially designed as a two-step process
NO2-
p– SHARON - 1800 m3
– ANAMMOX – 72 m3
TN remo al > 90%• TN removal > 90%
• Effluent NO2-N < 10 mg/l
• Van der Star, W. R. L. et al., 2007, “Startup of Reactors for Anoxic Ammonium Oxidation: Experiences from the First Full-scale Anammox Reactor in pRotterdam.” Water Research, (41), 4149-4163.

• Granular biomass beneficial
Upflow Granulation Process: ANAMMOXGranular biomass beneficial
– low sensitivity to inhibition e.g. nitrite > 30 mg/l
– Concentrated & compact - 17 times reduction in volume vs conventionalreduction in volume vs. conventional
– Easily separated from flock-type biomass so can handle elevated TSS from upset centrifuge operationsp g p
• Granulation strongly dependent on upflow velocityN t ti d i Si l St
Inf NH4• Next generation design: Single Stage Attached Growth Process
– Olburgen, NL, Potato Processing Facility, 3 years operation (startup 2006)
4
Eff NH Eff NOEff NOy p ( p )
“Upgrading of sewage treatment plant by sustainable & cost effective separate treatment of industrial wastewater” IWA Krakow 2009, W.R. Abma, W D i R H h i M C M L d ht
Eff NH4 Eff NO3Eff NO2
W. Driessen, R. Haarhuis, M.C.M van Loosdrecht

Universal Tank Concept
• Design to operate in multiple modes– Seasonal Bioaugmentation in the winter
Nit it ti / d it it ti i th f t i– Nitritation / denitritation in the summer for cost savings– Compatible with DEMON implementation over time
• SBR configuration very effective– Disconnect SRT and HRT
Easy to modify aerobic & anoxic cycle times– Easy to modify aerobic & anoxic cycle times– Split WAS and effluent flow streams– Mechanically simple
• single aeration / mixing system • no diffusers

Sidestream Treatment Options
Novel Sidestream Treatment Options
Sidestream Treatment Options
Bi l i l Ph i l Ch i lBiological Physical-ChemicalNitrification / Denitrification& Bio-augmentation Ammonia Stripping
• Steam
Ion-Exchange
• With RAS & SRT Control• With RAS• Without RAS
Nitritation / Denitritation
Steam• Hot Air• Vacuum Distillation
Ion Exchange• ARP
Struvite Precipitation• MAP Process
Nitritation / Denitritation • Chemostat • SBR• Post Aerobic Digestion
• MAP ProcessDeammonification
• Suspended Growth SBR• Attached Growth MBBR• Upflow Granular Process• Upflow Granular Process

Enhanced Nutrient Recovery
• Recover and beneficially reuse both nitrogen & phosphorus– Finite amount of good quality Phosphorus resources available
• Several emerging technologies – Air or Steam Stripping– CAST Vacuum distillation – Struvite PrecipitationStruvite Precipitation
• Sell nutrient rich products as fertilizers
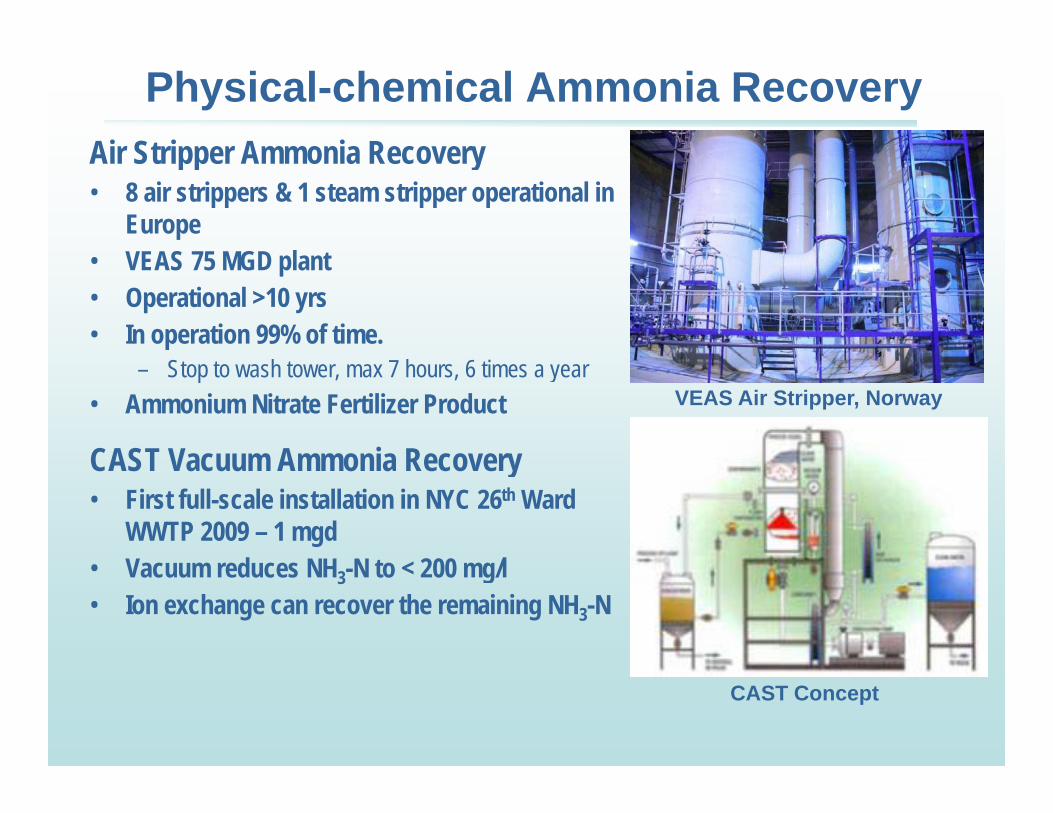
Physical-chemical Ammonia RecoveryAir Stripper Ammonia Recovery Air Stripper Ammonia Recovery • 8 air strippers & 1 steam stripper operational in
Europe VEAS 75 MGD l t • VEAS 75 MGD plant
• Operational >10 yrs• In operation 99% of time.
– Stop to wash tower, max 7 hours, 6 times a year• Ammonium Nitrate Fertilizer Product
CAST Vacuum Ammonia Recovery
VEAS Air Stripper, Norway
CAST Vacuum Ammonia Recovery • First full-scale installation in NYC 26th Ward
WWTP 2009 – 1 mgdV d NH N t 200 /l• Vacuum reduces NH3-N to < 200 mg/l
• Ion exchange can recover the remaining NH3-N
CAST Concept

View of Sidestream Treatment From Europe
Graphic from Markus Grömping, Atemis, 2009Norbert, J et al., 2006, “Treatment of sludge return liquors: Experiences from the operation of full-scale plants,” proceedings WETEC’06, WEF, Alexandria, VA., p 5237-5255.

Sidestream Treatment Options
Novel Sidestream Treatment Options
Sidestream Treatment Options
Bi l i l Ph i l Ch i lBiological Physical-ChemicalNitrification / Denitrification& Bio-augmentation Ammonia Stripping
• Steam
Ion-Exchange
• With RAS & SRT Control• With RAS• Without RAS
Nitritation / Denitritation
Steam• Hot Air• Vacuum Distillation
Ion Exchange• ARP
Struvite Precipitation• MAP Process
Nitritation / Denitritation • Chemostat • SBR• Post Aerobic Digestion
• MAP ProcessDeammonification
• Suspended Growth SBR• Attached Growth MBBR• Upflow Granular Process• Upflow Granular Process
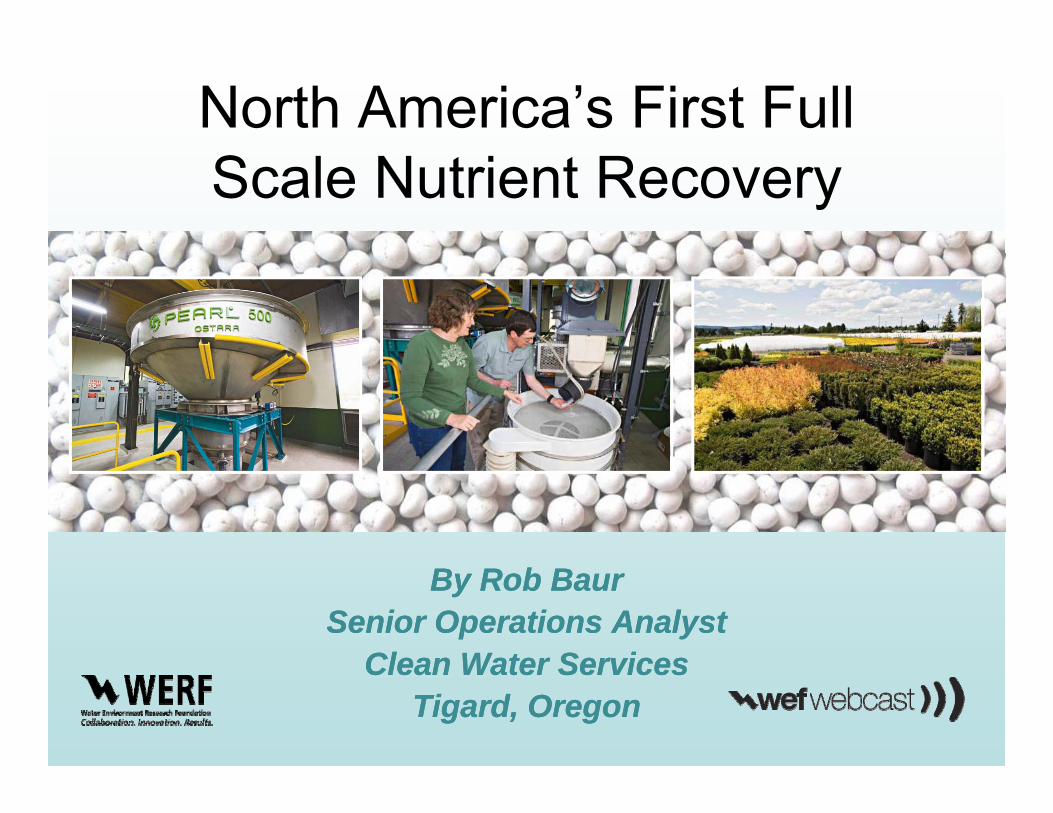
North America’s First Full Scale Nutrient Recovery
By Rob BaurBy Rob BaurSenior Operations AnalystSenior Operations Analyst
Clean Water ServicesClean Water ServicesClean Water ServicesClean Water ServicesTigard, OregonTigard, Oregon

Overview• Why nutrient recovery?
• Why struvite?• Why struvite?
• Why Durham?
• Pilot results
Contract negotiation• Contract negotiation
• Full scale implementation
• Startup and operationp p

Sidestream Treatment with Metal Salts SRemoval VS Recovery
Removal Recovery
+ Better mole ratio
y
+ Conserving resources
+ Sustainable production- Create chemical sludge and disposal costs
+ Sustainable production
+ Reduction in biosolids cost
- Iron may create vivianite, Fe3(PO4)2. 8(H2O) at point of injection
cost
+ Growing revenue streampoint of injection
- Alum may create additional H2S
- New technology
- New companiesadditional H2S
- Unfamiliar markets

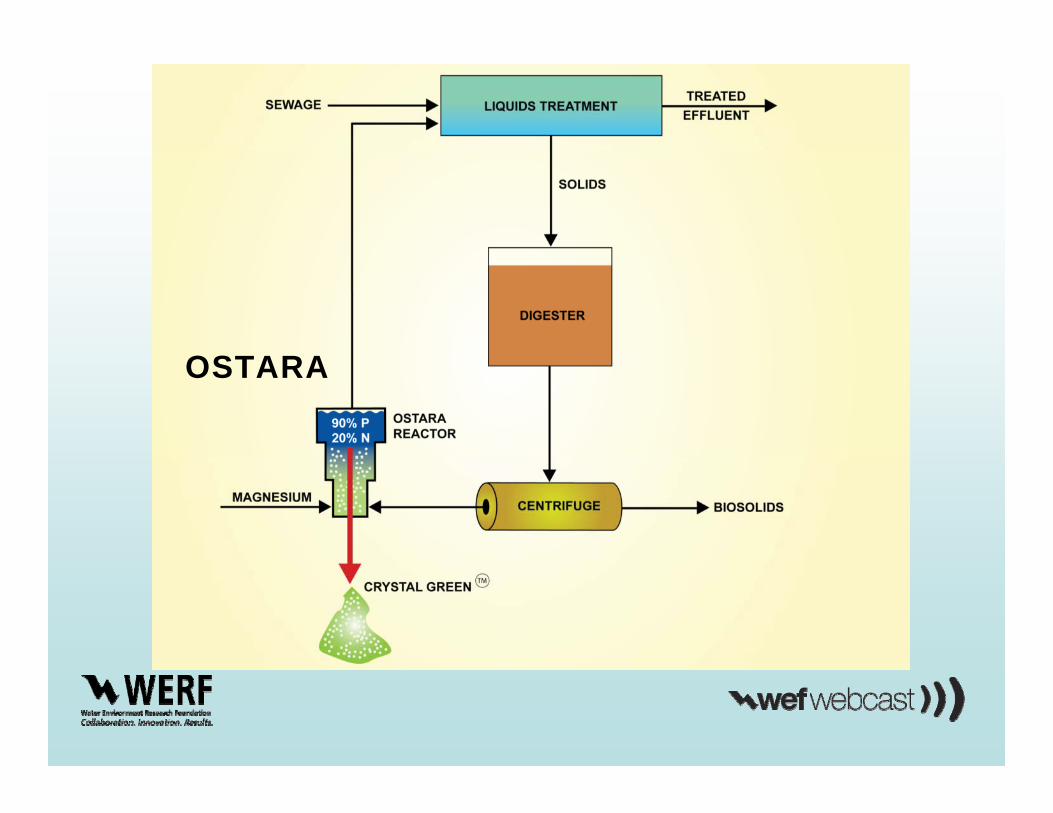
Struvite Precipitation Reaction• NH3 + PO4 + Mg + 6 H2O ↓NH3PO4Mg * 6 H2O↓NH3PO4Mg 6 H2O
• pH dependent. CO2↑ = pH ↑ = struvite↓
• Removes equi-molar ammonia and phosphorusp p
• Known as: Struvite, MAGamp, MAP
• Magnesium is the limiting element
pH pushes the reaction• pH pushes the reaction

Why Durham?• Durham received first US phosphorus TMDL in
1988
• 0.070 mg/l T-PO4 monthly median permit 1994
Rela ed to 0 10 in 2004• Relaxed to 0.10 in 2004
• 20 mgd dry weather flow
• Struvite problems from EBPR solved
• Centrate return still a problem• Centrate return still a problem
• Sidestream treatment option

Ostara Pilot
• 1 lpm pilot, 6 p pmeters tall

Pilot Results
• 90% P removal
• 20% ammonia
N ti d• No caustic used
• CO2 off gassing in supply tanks
• No reactor scaling
• Stable operationp

Removal GraphNutrient removal
100 0
80.0
100.0
40.0
60.0
% re
mov
al
% Ortho-P removal
% Ammonia removal
0 0
20.0
0.04/28 5/8 5/18 5/28 6/7 6/17 6/27
days of operation

Edmonton Full Scale Reactor
• SludgeSludge lagoon return Prillsreturn. Prillsharder, more dense anddense and smoother than pilotthan pilot.


Pilot vs. Full Scale Prills

Shimane Prefecture sewage works. Osaka, JapanJapan

European Struvite Recoveryp y

Crystal Green ™• 5-28-0 10% Mg fertilizer• 5% N - 28% P2O5 (12 6% P) – 0% Potassium5% N 28% P2O5 (12.6% P) 0% Potassium
(K)• Slow release 6 to 9 months on surface 3Slow release 6 to 9 months on surface, 3
months in soil, 1 month in a river. Larger prills slower, smaller faster
• Soil less container plants & golf courses• Not competing with bulk soluble fertilizersNot competing with bulk soluble fertilizers• NOT A BIOSOLID. Licensed by Department
of Agriculture as a fertilizer manufacturerof Agriculture as a fertilizer manufacturer. Not waste derived
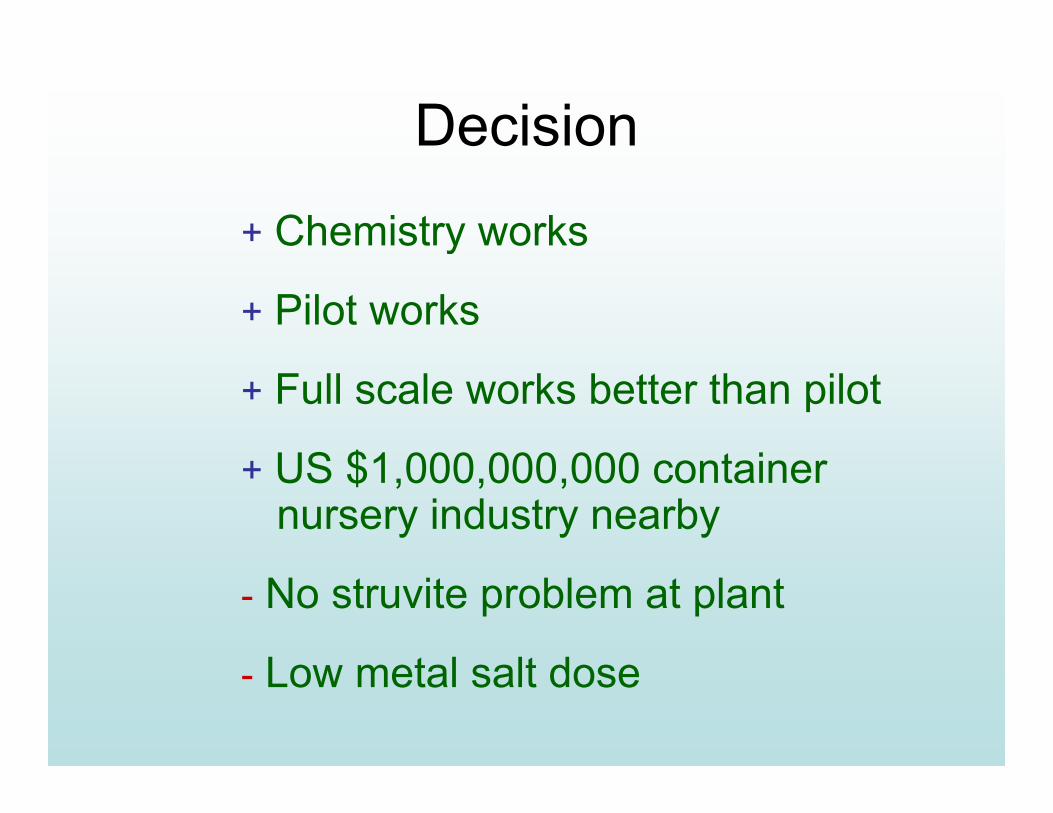
Decision
+ Chemistry worksy
+ Pilot works
+ Full scale works better than pilot
US $1 000 000 000 t i+ US $1,000,000,000 container nursery industry nearby
- No struvite problem at plant
L t l lt d- Low metal salt dose

Decision+ Innovative public/private partnering
+ Growing revenue stream
+ Larger influent phosphorus reduction than phosphate detergent ban
+ Sustainably produced fertilizer
+ Potential carbon credits
- New technology riskNew technology risk

Contract• No risk, turnkey, “fee for removal” option
t hnot chosen
• Outright purchase $2.5 M, revenue from g pstruvite
• Saved $1 1 million by usingSaved $1.1 million by using decommissioned pump station building
I ti t t 7 b k d b• Incentives to meet 7 year payback and be the first full plant scale system

OSTARAOSTARA


Recirculation Pumpp

Dryer Heater

Water Separation

Water Removal, Dryingd S tiand Sorting

Ready to Use After Drying, N P t P iNo Post Processing

Silos, Bagging and Hoist, gg g


Startup• April 16 -- Seeding each reactor 1 tonne
• April 27 24 hour operation of 3 reactors• April 27 -- 24 hour operation of 3 reactors
• May 11 -- first harvest!
• Mike Mengelkoch, Operations Control Analyst, “It’s like having another aeration train on line
i h h ”removing phosphorus”
• Initial poor quality centrate did not affect prillquality
• As of November 1, 100 tons produced, 25,000 , p , ,#P and 11,400 #N removed from recycle stream

Savings Accrued• 11.8% reduction in dry tons biosolids hauled
• More than reduction in phosphorus• More than reduction in phosphorus
• 23% reduction in alum use due to lower P inventory and ongoing improvements in EBPR stability
• Synergistic improvements, Ostara reduces P = better EBPR = less alum = more P to Ostara = lower alum cost + increased revenuelower alum cost + increased revenue
• Opposite is true, EBPR upset = more alum $ = less struvite revenue

Public/Private PartnershipPublic/Private Partnership• Both parties able to make decisions rapidly
• Risk sharing with common goal of optimizing production which benefits both partiesproduction which benefits both parties
• CWS under no obligation to produce productg p p
• Ostara remotely controls chemical feed, flow rates and harvest set pointsand harvest set points
• CWS does material handling and maintenanceg
Lessons learned On ImplementingLessons learned On Implementing New Technology
• Pilot new technology• Visit a full scale system if one existsVisit a full scale system if one exists• Share risk and reward on the new technology
Board in ol ement and s pport er important• Board involvement and support very important• Be ready for startup issues and continuous
improvementimprovement• Cultivate champions in Operations and
MaintenanceMaintenance

Additional Installations
• Edmonton AB, full scale reactor pilot
• Signed contracts:
• York PA, 2 reactors, fee for service
• Hampton Roads Sanitation District• Hampton Roads Sanitation District VA, 3 reactors purchased
• Clean Water Services evaluating for the Rock Creek plant. 5+ reactors
Conclusion• Nutrient recovery is no longer an idea, it is a
reality
• We are commercially generating a sustainably produced high value slow release fertilizer
• Significant lowering of plant influent nutrient loading from recycle streams via side streamloading from recycle streams via side stream treatment
Fi i h h l f EBPR i• Finishes the goal of EBPR to remove nutrients
• Provides positive feedback to EBPR by reducingProvides positive feedback to EBPR by reducing recycle

Webcast Housekeeping
• Site Attendee List
• Evaluation Form
• Professional Development Hours

Webcast Wrap-Up & Discussion

Related WEF Events
Urban River Restoration 2010 Conference (M h 7 10 2010) B t M h tt(March 7-10, 2010), Boston, Massachusetts http://www.wef.org/UrbanRiver/
Cities of the Future 2010 Conference (March 7 10 2010) Boston Massachusetts7-10, 2010), Boston, Massachusetts http://www.wef.org/CitiesoftheFuture/

Related WEF Events
Residuals & Biosolids 2010 Conference (May 23-26, 2010), Savannah, Georgia ( y , ), , ghttp://www.wef.org/ResidualsBiosolids/
WEF/IWA/WERF Nutrient Conference –1st Quarter 20111 Quarter 2011

Companion Publications
Design of Municipal Wastewater Treatment Plants — MOP 8, ,5th Edition• click here
• Sidestream Treatment chapter of MOP 8 available for individual purchaseMOP 8 available for individual purchase
• click here

WEF Committees & Groups Add i R l t d IAddressing Related Issues
• Municipal Wastewater Treatment DesignMunicipal Wastewater Treatment Design
• Plant Operations & Maintenance
• Residuals & Biosolids
• Algae Technologies
To Join Committees Go To:
Algae TechnologiesWorking Group
To Join Committees Go To: http://www.wefnet.org/onlineform/CommitteeMembership/CommitteeMembershipApplication.asp

WERF Nutrients ChallengePeople:• Core Leadership Team
Goals:• Develop and share credible
JB Neethling, HDR(lead principal investigator)
Amit Pramanik, WERF (program manager)
scientific information
• Better understand existing (program manager)Julian Sandino, CH2M-HILLH. David Stensel,
University of Washington
ette u de sta d e st gmechanisms of nutrient removal and best available technologies University of Washington
Roy Tsuchihashi, AECOMDavid Clark, HDR
• Issue Area TeamIssue Area Team(volunteer experts)
• Collaborators / Affiliates

WERF Nutrients Challengeg– Collaborative Approach
• Engage stakeholders – regulatory, utility, g g g y ydesign, equipment, communities, etc. (includes WEF members)
• Prioritize– Stakeholder input – broad basedStakeholder input broad based– Prioritize and focus on particular topic(s) – e.g.,
effluent organic nitrogen, nonreactive phosphorus• Compendium
D t h t k d h t d ’t k– Document what we know and what we don’t know• Conduct research to fill gaps
– Leverage ongoing work/collaborate– Fund additional research effortsFund additional research efforts
Collaboration – key to successwww.werf.org/nutrientsg

Webcast Wrap-Up & Discussion