welcome to this act webinar - association of corporate ... · director of european corporate...
TRANSCRIPT

Welcome to this ACT webinarCase studies on FX risk management
• Sponsored by
16 July 2015| 12.30-13.15 BST
Sponsored by

Introduction
Will Spinney
Associate Director of Education
ACT

Interactive widgets
Please take a minute to familiarise yourself with the widgets on your screen. They can be moved around the screen and maximised/minimised to suit you.
Click on the help widget if you experience any technical difficulties during the webinar.
Download speaker presentations during the webinar by clicking on the resource widget.
Submit your questions to our speakers throughout the webinar by using the Q&A widget.
Please take a few minutes at the end of the webinar to provide your feedback.
Follow us on twitter at @actupdate and tweet live during the webinar using #ACTwebinar.

AgendaIntroduction
Will Spinney
Associate Director of Education, ACT
Presentation from Chatham Financial
Paolo Esposito
Director of European Corporate Advisory, Chatham Financial
Anh Nguyen
Financial Risk Management Adviser, Chatham Financial
Panel discussion and Q&A

Presentation from Chatham Financial
Paolo Esposito
Director of European Corporate Advisory
Chatham Financial
Anh Nguyen
Financial Risk Management Adviser
Chatham Financial

Case studies on FX risk management
July 16th, 2015Anh Nguyen & Paolo Esposito

Advisory:Expert debt
& derivatives practitioners
Solutions:Integrated approach tailored to your needs
Technology:Proven risk
management platform
Intelligent Solutions for Risk Management
Interest Rate Hedging FX Hedging Commodity Hedging Hedge Accounting Advisory Regulatory Advisory Debt & Capital Advisory
Full web-based platform Financial risk mgmt modules Debt management modules Covered by SSAE 16 audit
Serving >1600 clients annually $2.5 trillion notional transacted 6 Locations globally in Europe,
U.S., Asia and Australia
Overview of Chatham Financial:Largest independent advisory and technology firm in Financial Risk Management

ForeignRevenue/Expenses
Booked
ForeignRevenue/Expenses
Paid
2016Now Future
ForeignRevenue/Expenses
Forecasted
1 year60 days
“Margin” RiskSubject to long periods of
currency volatility
Re-measurement RiskSubject to short periods of
currency volatility
How does FX risk impact a typical revenue/expense cycle?An illustrative example

ForeignRevenue/Expenses
Booked
ForeignRevenue/Expenses
Paid
ForeignRevenue/Expenses
Forecasted
Re-measurement Risk “Margin” Risk
Transactional Risk
Transactional Risk simply tells you the risk is located in a single legal entity as opposed to across several entities.
It conflates Margin Risk and Re-measurement Risk into a single category, and as a result, one loses some valuable granularity.
Translational Risk
Translational risk represents the impact of FX through the consolidation chain. Also translational risk is too broad a category (as it mixes Margin and Re-
measurement risk together). It is useful as an accounting construct.
Margin/Re-measurement vs. Transactional/Translational

Factors Driving Value at Risk
Magnitude
& Direction
of ExposuresCorrelations
Volatilities
• A company that has exposures to multiple currencies (specifically when they are in opposite directions) will experience some degree of diversification benefits such that its overall risk is not as large as it could have been.
• Correlation is one of several factors that can help quantify the degree of diversification benefit, and to help fine-tune the measurement of the efficacies of different hedging strategies.
• We use forward looking volatility implied from option prices. This volatility reflects the market’s expectation for the future and not necessarily what has happened in the past.
• The more volatile a currency is, the greater the risk associated with this exposure.
• The biggest driver of risk is the magnitude and direction of currency exposures.
• The direction of exposures is particularly crucial. Having exposures in opposite directions will generally translate to more diversification benefits than having exposures in similar directions.
Value
at Risk

0
1
2
3
4
5
6
7
8
260 270 280 290 300 310 320 330
Nu
mb
er o
f O
ccu
rren
ces
(th
ou
san
ds)
Unhedged EBITDA-at-risk
Hedge GBP
Hedge GBP, ZAR
Hedge GBP, ZAR, INR
Hedge GBP, ZAR, INR, RUB
Hedge GBP, ZAR, INR, RUB, AUD
Monte-CarloMetric-At-Risk Model
Optimal Risk Reduction to Reduce Hedge CostsIncremental Risk Reduction for Top FX Pairs on metric-at-risk
Case Study #1: Optimal strategy might not be the most obvious

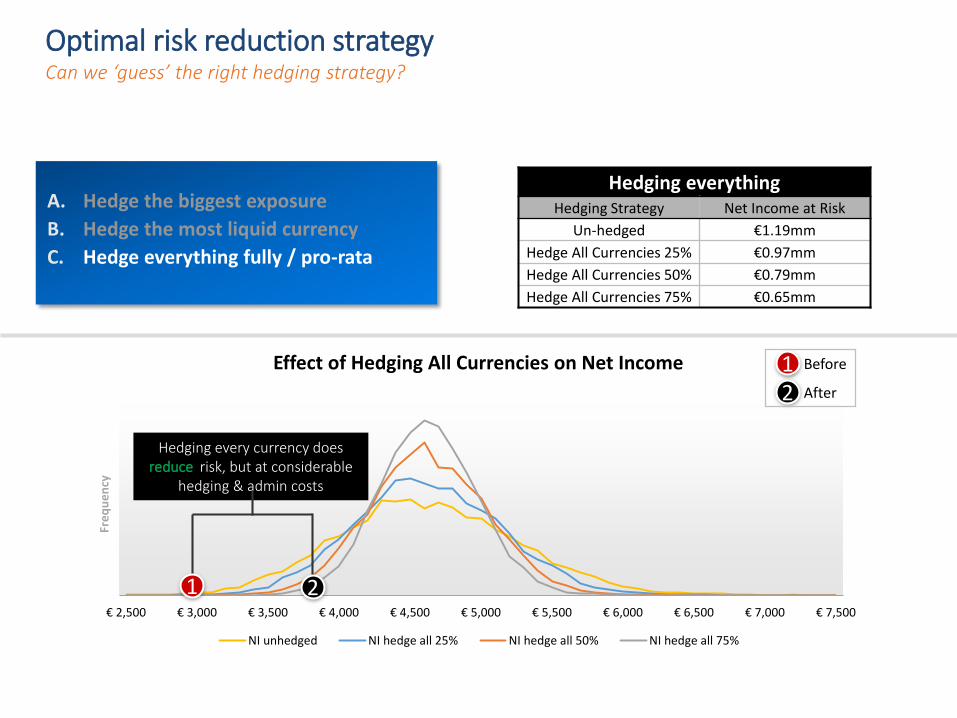
Optimal risk reduction strategyCan we ‘guess’ the right hedging strategy?
What is the best hedging strategy?
A. Hedge the biggest exposure
B. Hedge the most liquid currency
C. Hedge everything fully / pro-rata
Forecasted Revenue, Expenses(in millions)
EUR
USDAUD
CNY
PLN
CZK
(€ 10)
(€ 5)
€ 0
€ 5
€ 10

€ 2,500 € 3,000 € 3,500 € 4,000 € 4,500 € 5,000 € 5,500 € 6,000 € 6,500 € 7,000 € 7,500
Fre
qu
en
cy
Effect of Hedging CNY on Net Income
NI unhedged NI - Hedge Only USD
Hedging big & liquid exposures
Hedging Strategy Net Income at Risk
Un-hedged €1.19mm
Hedge CNY €1.60mm
A. Hedge the biggest exposure
B. Hedge the most liquid currency
C. Hedge everything fully / pro-rata
Hedging forecasted CNY revenue increases Net Income risk even more
Before
After
12
12
Optimal risk reduction strategyCan we ‘guess’ the right hedging strategy?
CNY
€ 2,500 € 3,000 € 3,500 € 4,000 € 4,500 € 5,000 € 5,500 € 6,000 € 6,500 € 7,000 € 7,500
Fre
qu
en
cy
Effect of Hedging All Currencies on Net Income
NI unhedged NI hedge all 25% NI hedge all 50% NI hedge all 75%
Hedging everythingHedging Strategy Net Income at Risk
Un-hedged €1.19mm
Hedge All Currencies 25% €0.97mm
Hedge All Currencies 50% €0.79mm
Hedge All Currencies 75% €0.65mm
Hedging every currency does reduce risk, but at considerable
hedging & admin costs
Before
After
12
1 2
Optimal risk reduction strategyCan we ‘guess’ the right hedging strategy?
A. Hedge the biggest exposure
B. Hedge the most liquid currency
C. Hedge everything fully / pro-rata

Optimal risk reduction strategyWhat is the most efficient way to hedge?
Bad! Neutral Good• CNY• USD• CZK
• USD-CZK• PLN-CNY
• PLN • USD-CNY• PLN-CZK• AUD-CZK
• 25% of everything• 50% of everything• 75% of everything
• AUD-CNY• AUD
CNY USD AUD PLN CZK
CNY EUR-CNY
USD USD-CNY EUR-USD
AUD AUD-CNY AUD-USD EUR-AUD
PLN PLN-CNY USD-PLN AUD-PLN EUR-PLN
CZK CZK-CNY USD-CZK AUD-CZK PLN-CZK EUR-CZK
There are numerous potential hedges

Case Study #2:Dangers of oversimplified assumptions

Foreign Currency Operating Cash Flows (in USD millions)
2015 Forecasts used for the purposes of this analysis.
CAD$101 NOK
$53 GBP$46
AUD$43
CHF$20
EUR$15
DKK$9
CLP$3
NZD$1
PLN$1
RUB$1
HUF$(3)
MXN$(3)
SEK$(7)
MYR$(14)
IDR$(20)
$(800)
$(600)
$(400)
$(200)
$-
$200
$400
$600
$800
Mill
ion
s
Revenues Expenses Net
Foreign exposures are diverse and therefore provide some natural offset within each currency and across currencies.

AUD CAD CHF CLP DKK EUR GBP HUF IDR MXN MYR NOK NZD PLN RUB SEK
AUD 1.00 0.62 0.35 0.42 0.38 0.38 0.43 0.43 -0.07 0.57 0.13 0.40 0.83 0.42 0.53 0.41
CAD 0.62 1.00 0.48 0.34 0.51 0.51 0.46 0.44 -0.15 0.48 0.06 0.51 0.56 0.44 0.46 0.53
CHF 0.35 0.48 1.00 0.01 0.81 0.81 0.65 0.48 -0.13 0.18 -0.08 0.53 0.35 0.53 0.30 0.62
CLP 0.42 0.34 0.01 1.00 0.10 0.10 0.09 0.34 0.05 0.47 0.33 0.40 0.44 0.29 0.44 0.28
DKK 0.38 0.51 0.81 0.10 1.00 1.00 0.52 0.64 -0.15 0.35 0.04 0.69 0.39 0.76 0.46 0.74
EUR 0.38 0.51 0.81 0.10 1.00 1.00 0.52 0.64 -0.14 0.35 0.04 0.69 0.38 0.77 0.46 0.74
GBP 0.43 0.46 0.65 0.09 0.52 0.52 1.00 0.36 -0.05 0.22 0.04 0.39 0.37 0.36 0.28 0.30
HUF 0.43 0.44 0.48 0.34 0.64 0.64 0.36 1.00 -0.09 0.46 0.09 0.54 0.39 0.73 0.53 0.53
IDR -0.07 -0.15 -0.13 0.05 -0.15 -0.14 -0.05 -0.09 1.00 -0.03 0.27 0.01 -0.13 -0.10 -0.04 -0.05
MXN 0.57 0.48 0.18 0.47 0.35 0.35 0.22 0.46 -0.03 1.00 0.20 0.37 0.55 0.52 0.52 0.35
MYR 0.13 0.06 -0.08 0.33 0.04 0.04 0.04 0.09 0.27 0.20 1.00 0.30 0.11 0.15 0.22 0.20
NOK 0.40 0.51 0.53 0.40 0.69 0.69 0.39 0.54 0.01 0.37 0.30 1.00 0.44 0.63 0.47 0.82
NZD 0.83 0.56 0.35 0.44 0.39 0.38 0.37 0.39 -0.13 0.55 0.11 0.44 1.00 0.39 0.53 0.43
PLN 0.42 0.44 0.53 0.29 0.76 0.77 0.36 0.73 -0.10 0.52 0.15 0.63 0.39 1.00 0.59 0.60
RUB 0.53 0.46 0.30 0.44 0.46 0.46 0.28 0.53 -0.04 0.52 0.22 0.47 0.53 0.59 1.00 0.45
SEK 0.41 0.53 0.62 0.28 0.74 0.74 0.30 0.53 -0.05 0.35 0.20 0.82 0.43 0.60 0.45 1.00
Currency Correlations
SOURCE: Data based on six month historical period (which is the weighted average time of a hedging program that covers one operating year).
Based on the Company’s exposure profile (where foreign exposures are in both revenues and expenses), correlation drives the amount of diversification benefit the company expects to see. For example, if CAD weakens against USD, it is likely that the other major net profit currencies will also weaken (NOK, GBP, AUD).

Unhedged$30.7
+CAD$22.5
+NOK$18.1
+AUD$14.3
+GBP$10.7
+CHF/IDR$8.0 +EUR
$6.4 +DKK/MYR$5.6
+IDR$5.2
+CLP/MYR$5.1
+NZD$4.9
+CHF$4.8
+MYR$4.8
+PLN$4.7
+CLP$4.7
+RUB$4.6
+DKK$4.6
$0
$5
$10
$15
$20
$25
$30
$35
$40
EBITDA-at-risk
Impact of Hedging EBITDA-at-Risk for the next 12 monthsAssuming the company limits the maximum hedge ratio at 80% of exposures
Expected EBITDA: $340mm
Hedging the first 4most impactful
currencies reduces risk by 65% to $10.7mm
Hedging the next 3 most impactful
currency pairs reduces risk by an additional 17% to
$5.6mm
• Changes in exchange rates can have a significant effect on EBITDA (up to $30.7mm deviation from the expected EBITDA in either direction).
• 99% of the time, Company 2 should not experience an FX loss greater than the EBITDA at risk*, as seen in the graph.

Case Study #3: Challenges in mitigating risk across multiple asset classes

Forecasted ExposuresThe forecasted revenue and expenses are based on the forward curve for each currency / commodity over the next 12 months.
CNY-$292
Copper-$259
EUR$51
Aluminum-$50
Other-$46
INR$37
GBP-$32
JPY$30
CZK-$29
AUD$19
BRL$18
TWD$10
ZAR$8
HKD$6
$(350)
$(300)
$(250)
$(200)
$(150)
$(100)
$(50)
$-
$50
$100
Forecasted Exposures (in USD, in millions)

$14
$4
$15
$14
$4
$15
$12
$4
$13
$10
$4
$10
$530 $540 $550 $560 $570 $580 $590 $600
Total EBITDA at Risk
Total EBITDA at RiskHow may FX and commodity exposure interact with each another
What’s the risk to EBITDA from commodities alone?
What’s the risk to EBITDA from currencies alone?
What is the total risk exposure from currencies and
commodities combined?
-1 SD34%
-2 SD13.6%
+2 SD13.6%
+1 SD34%
meanbad good
+
=
Commodities are the primary drivers of overall EBITDA at Risk. FX exposure provides some offset such that the combined risks are lower than the risk from commodities alone.

Questions?
www.ChathamFinancial.com
Paolo Esposito
Director, European Corporate Advisory
T: +44 (0)20 7766 5715
Anh Nguyen
Financial Risk Management Advisor
T: +44 (0)20 7766 5717
Kennett Square235 Whitehorse LaneKennett Square, PA 19348610.925.3120
Denver10026 West San Juan Way, Ste 150Littleton, CO 80127United States720.221.3500
LondonBurdett House, 4th Floor15-16 Buckingham StreetLondon WC2N 6DUUnited Kingdom+44 (0)20.7766.5700
Krakowul. Rakowicka 7, III p.31-511 KrakówPoland+48 (0)12.294.6160
Singapore20 Cross StreetChina Square Central #02-16/17Singapore, 048422+65 6507.0680
SydneyL8, 66 Hunter StreetSydney, Australia, 2000+61 2 8003.4240
15-0016

The panel
Chair
Will Spinney
Associate Director of Education, ACT
Speakers
Paolo Esposito
Director of European Corporate Advisory, Chatham Financial
Anh Nguyen
Financial Risk Management Adviser, Chatham Financial

FORTHCOMING EVENTS
treasurers.org/events
ACT Asia Conference 2015: treasury in the Pacific Age02 September 2015 | Hong Kong
ACT Working Capital Conference 15 September 2015 | London
ACT Corporate Funding Conference28 October 2015 | London
ACT Annual Dinner11 November 2015 | London
ACT Middle East Annual Conference23-24 November 2015 | Dubai

Thank you for listening
Please take a few moments to provide your feedback by selecting the icon.
Sponsored by