welfare reform in california - rand.org · the 1999 questionnaire includes 22 questions, many of...
TRANSCRIPT

Welfare Reformin CaliforniaResults of the 1999 All-CountyImplementation Survey
Jacob Alex Klerman
Patricia A. Ebener
Prepared for the CaliforniaDepartment of Social Services
LABOR AND POPULATION

iii
Preface
In response to national welfare reform legislation—the PersonalResponsibility and Work Opportunity Reconciliation Act (PRWORA), whichwas signed in August 1996—California passed legislation on August 11, 1997that replaced the existing Aid to Families with Dependent Children (AFDC)and Greater Avenues for Independence (GAIN) programs with theCalifornia Work Opportunity and Responsibility to Kids (CalWORKs)program. Following an open and competitive bidding process, the CaliforniaDepartment of Social Services (CDSS), which administers CalWORKs,awarded a contract to RAND to conduct a statewide evaluation of theCalWORKs program.
This RAND report presents the results of the second of three annual All-County Implementation Surveys (ACIS) to be conducted as part of thestatewide evaluation of CalWORKs.
Complete survey responses from the 58 counties are available on theevaluation’s web page at http://www.rand.org/CalWORKs. Anotherreport—MR-1777-CDSS, Welfare Reform in California: State and County
Implementation of CalWORKs in the Second Year, and its Executive Summary,
MR-1777/1—combines information from this survey with information fromkey informant interviews and other sources to present a richer picture of theongoing implementation of CalWORKs programs in state government and inthe focus and follow-up counties participating in the evaluation. Finally,MR-1052-CDSS (Welfare Reform in California: Results of the 1998 All-County
Implementation Survey) presents the results from the 1998 All-CountyImplementation Survey. In addition to this process study, there is a parallelimpact and cost-benefit study. Preliminary results from that study will bereleased in October 2000, with the final results in October 2001.
For more information about the evaluation, see http://www.rand.org/CalWORKs or contact:

iv
Jacob Alex Klerman Aris St. JamesRAND CDSS1700 Main StreetP.O. Box 2138Santa Monica, CA 90407-2138
744 P Street, MS 12-56Sacramento, CA 95814
(310) 393-0411 [email protected]
(916) [email protected]

v
Contents
Preface................................................... iii
Figures .................................................. vii
Tables .................................................. ix
Summary................................................. xi
Acknowledgments .......................................... xiii
Glossary ................................................. xv
1. INTRODUCTION....................................... 1Background ........................................... 1Objectives............................................. 2Research Methods....................................... 2
Sample ............................................. 3Survey Questionnaire................................... 4Mail-Out and Follow-Up ................................ 4Plans for Next Year’s ACIS ............................... 5
Organization of This Document............................. 5
2. CalWORKs PROGRAM ORGANIZATION AND PROVISIONOF SERVICES.......................................... 7Structure and Organization of CalWORKs Programs ............. 7
CWD Staffing......................................... 7Models of Interagency Coordination ........................ 10Outsourcing.......................................... 13
Services Provided ....................................... 15Home Visits.......................................... 16
Statistical Reporting ..................................... 16
3. CHANGES IN COUNTY CASELOADS, STAFFING, ANDRESOURCES .......................................... 21Caseload Declines....................................... 21Staffing Increases ....................................... 21Other Resources ........................................ 22
Services Capacity ...................................... 22Services Funding ...................................... 23Incentive Funds ....................................... 25
4. COUNTIES’ VIEWS OF CalWORKs SUCCESS ANDCHALLENGES......................................... 27Successful Strategies to Address Implementation Challenges........ 27
Strategies to Deal with Implementation Challenges ............. 30Implementing the Rules .................................. 34
Two-Parent Family Participation Requirements ................ 37Factors That Hinder and Facilitate Implementation............... 38

vi
5. CONCLUSIONS........................................ 39
APPENDIXACIS Questionnaire ..................................... 41
REFERENCES ............................................. 63

vii
Figures
2.1. CalWORKs Staffing Models ............................. 82.2. Ongoing Implementation of Staffing Models ................. 102.3. CalWORKs Interagency Models .......................... 112.4. Interagency Models ................................... 132.5. Widespread Availability of Statistical Reports ................ 173.1. Capacity Shortfalls .................................... 223.2. Capacity Shortfalls—Children’s Services, 1998 vs. 1999.......... 233.3. Funding Shortfalls .................................... 243.4. Funding Shortfalls, 1998 vs. 1999.......................... 254.1. More Counties Report Successful Implementation Strategies
in 1999............................................. 314.2. CalWORKs Program Elements ........................... 344.3. Rules Least Likely to Present Implementation Problems ......... 354.4. Rules Most Likely to Present Implementation Problems,
1998 vs. 1999 ........................................ 364.5. Factors That Hinder and Facilitate Implementation ............ 384.6. Factors That Hinder and Facilitate Implementation,
1998 vs. 1999 ........................................ 39


ix
Tables
2.1. Counties with CalWORKs Staffing Models in PlaceCountywide......................................... 9
2.2. Counties with Interagency Models in Place Countywide......... 122.3. Approaches to Providing CalWORKs Program Components
and Services......................................... 142.4. Services Not Provided ................................. 152.5. Use of Home Visits by Counties .......................... 162.6. Statistical Reporting by Level of CalWORKs Managers.......... 183.1. Use of Incentive Funds ................................. 264.1. Strategies for Implementation ............................ 284.2. Two-Parent Participation Barriers ......................... 37


xi
Summary
This report provides the results of the 1999 All-County ImplementationSurvey (ACIS) conducted as part of RAND’s statewide evaluation ofCalWORKs. It summarizes the responses of all 58 California counties toquestions about their experiences to date with implementing CalWORKs.
The contract between CDSS and RAND for the Statewide CalWORKsEvaluation requires an All-County Implementation Survey (ACIS) in the Fallof 1998, 1999, and 2000 and specifies a response rate of at least 80 percent.This second ACIS was developed in collaboration with CDSS and other stateand county agencies and stakeholders. It was reviewed at the county welfaredepartment (CWD) level by the six coordinators in the evaluation’s focuscounties. The 1999 questionnaire includes 22 questions, many of which werealso included in the 1998 questionnaire. The final survey was mailed outSeptember 29, 1999. By November 16, 1999, responses had been receivedfrom all 58 California counties.
Overall, the responses to the 1999 ACIS indicate that California countiescontinue to explore a variety of approaches to CalWORKs programimplementation. Their experiences continue to vary significantly throughoutthe state in terms of what works well and what remains a problem. There arefew areas in which all counties agree on a single approach or innovativestrategies, though almost all reported some successful strategies. Theimplementation challenges most frequently noted were use of postemployment/job retention services, improving computer systems, andobtaining compliance with required CalWORKs activities. Coordinating thethree stages of child care and monitoring and reporting on programperformance were the most often cited implementation problems. Fifty-onecounties reported that public transportation hinders CalWORKsimplementation, and 45 of 58 agree that interagency relationships facilitateimplementation. Most counties have seen some CalWORKs caseload decline,and most have added staff during the past 12 months.
The 1999 survey results show a more positive picture than the 1998 results—more counties reported successful strategies in 1999 and fewer countiesreported implementation problems with most CalWORKs requirements andrules. The majority of counties agree that funding is not a current problem in

xii
most service areas other than Stage 2 and Stage 3 child care, although findingthe capacity in their counties for adequate service delivery, especially forchild care and transportation, is of concern to many.
This report summarizes results from the 1999 ACIS. RAND will conduct afinal ACIS in the fall of 2000.
These all-county surveys are only one component of RAND’s StatewideCalWORKs Evaluation. A parallel report on implementation, Welfare Reform
in California: State and County Implementation of CalWORKs in the Second Year,combines these ACIS results with information from interviews in 6 focuscounties and 18 follow-up counties and from reviews of official documentsand the secondary literature to give a richer description of theimplementation of CalWORKs through summer 1999. Additional field workin the focus counties and less intensive visits to the larger number of follow-up counties will yield even richer characterizations of the implementation ofCalWORKs in a third report to be released in February 2001. Finally, RANDwill release reports in October 2000 and 2001 based on a parallel analysis ofthe impact of CalWORKs.

xiii
Acknowledgments
This report was made possible by the cooperation of all 58 county welfaredepartments in California, who completed the 1999 All-CountyImplementation Survey (ACIS). We thank the individuals who weregenerous with their time and took responsibility for ensuring the completionof the questionnaire. In addition, we are grateful to Denice Dotson, MarlenePascua, Inslee Pitou, Kay Riley, Althea Shirley, and Mark Woo, who tooktime from their busy schedules to thoroughly review a draft of thequestionnaire. Finally, thanks to our sponsor agency staff for coordinatinginternal and external CDSS review, which provided additional helpful inputon the draft questionnaire.
At RAND, we are grateful to Survey Research Group (SRG) colleaguesKirsten Becker, who assisted with the design of the questionnaire; LindaDaly, who typed the questionnaire; to Patricia Frick, who set up the recordmanagement system and mailed out the survey materials and letters; to EllynBloomfield, who followed up with the counties and kept track of surveyprogress; to Carole Berkson, who oversaw receipt and processing ofincoming questionnaires; to Tom Bogdon, who helped to input the surveydata quickly for the programming team; and to Shaoling Zhu, who preparedthe data files for analysis. We would also like to thank RAND colleagues SueHosek and Bob Schoeni, who provided reviews and helpful comments onthis draft.
Finally, a document such as this emerges because of the dedicated behind-the-scenes efforts of secretaries and publications staff members. They havehandled the time pressures with grace and charity. Secretarial assistance wasprovided by Ann DeVille and Christopher Dirks. We are also grateful to thestaff of RAND’s Publications Department who worked on this documentunder a tight schedule. They include Betty Amo and Benson Wong.


xv
Glossary
ACIS RAND’s All-County Implementation Survey
ADP Alcohol and Drug Programs
AFDC Aid to Families with Dependent Children
APP Alternative Payment Provider
CalWORKs California Work Opportunity and Responsibility to KidsAct of 1997
CBO Community-based organization
CDSS California Department of Social Services
CW Combined Worker
CWD County Welfare Department
EDD Economic Development Department
FBO Faith-based organization
GAIN Greater Avenues for Independence (training program)
JTPA Job Training Partnership Act
MOU Memorandum of Understanding
PRWORA Personal Responsibility and Work OpportunityReconciliation Act of 1996
REB CDSS Research and Evaluation Branch
RFP Request for Proposal
SIP Self-Initiated Program (of education)
SRG RAND’s Survey Research Group
TANF Temporary Assistance to Needy Families
WIA Workforce Investment Act
WtW U.S. Department of Labor Welfare-to-Work grants
WTW Welfare-to-Work programs


1
1. Introduction
Background
Continuing California’s tradition of county administration of welfare programs,California’s implementation of welfare reform—the California WorkOpportunity and Responsibility to Kids (CalWORKs) program—grantedconsiderable discretion to the state’s counties in designing their welfareprograms. Areas of county discretion included:
• Designing welfare-to-work (WTW) activities and services;
• Determining what activities to allow toward work requirements and whomto exempt from work requirements and for how long;
• Deciding what form collaboration should take among agencies and theprivate sector to provide training and support services and to identify jobs;
• Deciding what programs should be implemented to provide neededsubstance abuse and mental health services, child care, transportation, anddomestic abuse assistance;
• Designing job retention and community service programs;
• Providing assistance for families transitioning off aid; and
• Providing public input to CalWORKs planning.
In addition, individual counties are responsible for the implementation of boththe statewide changes and the county-specific plans. Counties were under tighttime pressures to design a system to deliver the services that would moverecipients into the work force and then to self-sufficiency within the statutorytime limits. Counties are subject to financial sanctions for failure to meet federalparticipation requirements and can receive fiscal incentives for a percentage ofgrant savings due to exits from aid, work, and diversion. After the initial periodof planning and the focus on enrollment and activities such as Job Club, whichare part of the early stages of CalWORKs participation, during 1999 countieshave begun to modify and refine their programs and to add components such aspost employment services and community service jobs.

2
Objectives
This RAND report describes the results of a survey to track ongoingimplementation of CalWORKs. The survey was conducted as part of alegislatively mandated independent evaluation of CalWORKs. The CaliforniaDepartment of Social Services’ (CDSS’s) Request for Proposal (RFP) for theindependent evaluation included a requirement for an annual countyimplementation survey to be conducted by mail “to determine the problemsencountered, resolutions reached, and innovations created by the counties.” TheRFP listed specific aspects of administering CalWORKs that needed to beincluded in the first survey. Finally, the RFP required a county response rate ofat least 80 percent.
Through a collaborative process with CDSS Research and Evaluation Branch(REB) staff, other CDSS staff, other state agencies, and representatives fromseveral county welfare departments, RAND developed a questionnaire inSeptember and early October of 1998. After analyzing those results andconducting further fieldwork, the 1999 ACIS was somewhat modified to expandthe topics covered. Another review by state and local stakeholders helpedfinalize the content of the questionnaire. The 1999 survey was mailed September29, and 50 counties had returned completed questionnaires by November 1. All58 had replied by November 16, resulting in a 100 percent response rate for thesecond consecutive year.
Research Methods
Several considerations have guided the design of the 1999 All-CountyImplementation Survey (ACIS). First, the evaluation was more mature. Whenthe survey was first fielded in 1998, it represented the first data collection task ofthe RAND CalWORKs evaluation, which started in September 1998. Thecontract called for a draft report on the survey results by January to provide earlyfeedback to a variety of state and local stakeholders. Given the tight time frame,ACIS design took place before project staff had completed a first round of visitsto counties selected as focus counties by CDSS.
For the second ACIS the situation was different. We had completed a first roundof fieldwork and were in the process of conducting a second round of keyinformant interviews throughout 6 focus and 18 follow-up counties participatingin the evaluation. Based on this fieldwork experience we knew that a number ofissues had changed and that some CalWORKs components had become more

3
routinized while others were now early in the implementation process. Wewanted the survey to reflect current issues but also to facilitate comparison overtime. We tried to incorporate into the ACIS some questions that we werepursuing in the field component of the process evaluation. Finally, we needed tohold down the size of the survey to minimize burden on the counties, and soseveral questions were dropped in order to make room for others.
Second, because the responses from each county were to again be published, wehad to anticipate that counties would be unwilling to address some topics on therecord.
Third, we knew that experiences among the counties were likely to vary, just asother characteristics of population, geography, and local government varythroughout California. This survey is the only part of the evaluation that enablesus to collect data from all 58 of California’s counties. It collects information ontheir perceptions of the context in which implementation is proceeding and on itsprogress. As such, it is an important tool for gathering information to helpunderstand and interpret the differences we observe in administrative caseloadand indicator data at the county level.
Fourth, the survey was to be conducted by mail with telephone follow-up. Thisfield approach required a standardized questionnaire suitable for self-administration and a reasonable period of time to permit counties to respond.
Sample
The 1999 ACIS sample, like the 1998 survey, consisted of county welfare agencyrepresentatives. The 1998 list was updated before mailing in 1999. Theaddressee was the CalWORKs program director or the county welfaredepartment (CWD) director when no CalWORKs program director had beenappointed.
In addition, in 1999 a completely separate survey module was administered withthe directors of non-CWD Alternative Payment Providers (APP) on the topic ofchild care. The results from that separate module are discussed in Chapter 7 ofthe report, Welfare Reform in California: State and County Implementation of
CalWORKs in the Second Year.1
_________________ 1Klerman, Jacob Alex, et al. Welfare Reform in California: State and County Implementation of
CalWORKs in the Second Year. Santa Monica, Calif.: RAND, MR-1777-CDSS, 2000.

4
Survey Questionnaire2
During the summer of 1999, RAND staff developed the survey materials incollaboration with CDSS REB staff and reviewers from other state agencies andthe counties. The evaluation coordinators from the evaluation’s focus countiesalso reviewed the draft questionnaire. Topics were drawn from the list in theCDSS evaluation RFP and from topics that were clearly of importancethroughout the state as implementation proceeded. Questions focused on:
• CWD organizational models for staffing, interagency arrangements, andprovision of services;
• Caseloads, staffing, and resources;
• Success and problems, innovative strategies and programs; and
• The context in which implementation was occurring.
Mail-Out and Follow-Up
On September 29, 1999, survey packets were mailed to all counties, using prioritymail service. The packets included a cover letter explaining the purpose of thesurvey and that responses would be published, the questionnaire, answers toquestions frequently asked about the survey, and a brief overview of the RANDCalWORKs evaluation. A postage-paid envelope pre-addressed to RAND wasincluded with the questionnaire.
One week after the initial mail-out, a follow-up letter was mailed to all countiesas a “thank you” and reminder of the date for return of completed questionnaires(October 20).
Telephone reminders to the CalWORKs county contact in counties that had notyet returned the questionnaire began a week before the return date. These callswere intended to confirm that the questionnaire had been received and would becompleted and returned. The calls typically involved a brief voice mail messageor very brief conversation to answer any questions or ensure that thequestionnaire had reached the appropriate person to complete it. Severalquestionnaires were remailed following these calls, and revised contactinformation was updated in the survey records management database.
Only one-third of the counties returned the questionnaire by the early due date.By November 1, 50 questionnaires had been returned and further telephone
________________ 2A copy of the questionnaire can be found in the Appendix.

5
follow-up and remailings of the questionnaire boosted the response rate to 100percent by November 16.
Plans for Next Year’s ACIS
Based on our original proposal and our experiences this year in designing andimplementing the ACIS, we plan to again expand the survey sample beyond thewelfare agency in each county to include other agencies and community-basedorganizations (CBOs) that receive CalWORKs funding, contract with the welfareagency, or serve CalWORKs participants.
We will also use the ACIS to address issues and themes that arise in the focuscounty and follow-up county fieldwork conducted during 2000 and to assess thegeneralizability of the interview findings.
Organization of This Document
The remaining sections present the results of the 1999 ACIS. Section 2 discussesorganizational issues including how the counties have staffed their CalWORKsprograms, their interagency arrangements, what services are available and howthey are provided, and what information counties have available about variouscategories of participants. Section 3 describes caseload, staffing, capacity, andfunding changes during the past year. Section 4 summarizes reports from thecounties about their successes and about continuing challenges and problemswith CalWORKs program requirements and rules. Section 5 summarizes ourfindings and identifies several themes that have emerged. An appendix containsa copy of the survey materials mailed to the counties. In addition, the detailedresults can be accessed for each county and separate groups of counties using anew database query facility provided at our CalWORKs web site: http://www.rand.org/CalWORKs/AllCounty.


7
2. CalWORKs Program Organization andProvision of Services
The 1998 ACIS documented the variation in implementation patterns across thestate.1 We found that the counties varied in how they organized their programs,what services were available, and what problems and successes they experiencedin the first year of the program. These are characteristics worth monitoring overtime. This year we asked for more specifics about county welfare department(CWD) staffing, interagency relationships, what services are offered and how theyare provided, and what kinds of information counties have about their variouscategories of CalWORKs participants. The findings are not intended to providedetail on implementation but to shed some light on the variation across the stateand on where there is and is not consensus among the counties.
Structure and Organization of CalWORKs Programs
In the 1998 ACIS we found that extensive organizational changes wereaccompanying CalWORKs implementation across the state. In 1999 we alsoasked about the structure and organization of CalWORKs programs,concentrating on general models for CWD CalWORKs staffing, interagencyarrangements, and provision of services.
CWD Staffing
Staffing has been an important issue in most counties. During our site visits inthe counties, key informants discussed staff shortages, need for training, laborproblems, and how job functions of former eligibility and GAIN staff havechanged with the shift from AFDC to Temporary Assistance to Needy Families(TANF).2 We asked the counties to report on several staffing models, includingwhether they have combined the job of eligibility and employment/Welfare toWork (WTW) caseworker, reclassified caseworker positions, co-located eligibilityand employment staff, decided which personnel conduct CalWORKs orientationin their county, or outsourced their CalWORKs WTW operations. Figure 2.1
_________________ 1Ebener, Patricia A., and Jacob Alex Klerman. Welfare Reform in California: Results of the 1998 All-
County Implementation Survey. Santa Monica, Calif.: RAND, MR-1052-CDSS, 1999.2See Chapter 5 of Klerman et al., 2000.

8
Figure 2.1—CalWORKs Staffing Models(For the other models, see Figure 2.2)
shows that the counties still vary considerably in approaches to staffingCalWORKs. It shows the number of counties that have each model in placecountywide and the number that have not considered or considered and decidednot to adopt each model. The names of counties that have these models in placecountywide are shown in Table 2.1.
The only widespread consensus is that wholesale outsourcing of WTWoperations has not been popular. About 60 percent report that they have co-located their eligibility and employment staff, while few report rejecting thismodel. About 70 percent conduct CalWORKs orientation usingemployment/welfare to work staff. However, about 40 percent use eligibilityworkers for CalWORKs orientation while an almost equal number have decidednot to adopt this model. Sixteen counties are using both categories of workers.Thirty percent reported that reclassification of caseworkers had taken place orthat they had combined the jobs of eligibility and WTW caseworkers. Greaterpercentages reported that these two models had not been considered or wereconsidered, but not adopted.
Figure 2.1 also shows that not all counties are accounted for. As shown in Figure2.2, in some counties, one or more of these models have been adopted but only

9
Table 2.1
Counties with CalWORKs Staffing Models in Place Countywide
Outsourceall of
CalWORKswelfare to
workoperation
Co-locatedwelfare
departmentCalWORKs
eligibility andemployment
staff
Employment/WTW staff
conductCalWORKsorientation*
Eligibilityworkersconduct
CalWORKsorientation*
Reclassifiedcaseworker
positions
Combined thejobs of
eligibility andemployment/
WTWcaseworker
Alameda ✓ ✓
Alpine ✓ ✓ ✓
Amador ✓ ✓
Butte ✓ ✓
Calaveras ✓ ✓
Colusa ✓ ✓
Contra Costa ✓ ✓ ✓
Del Norte ✓ ✓ ✓ ✓
El Dorado ✓ ✓ ✓
Fresno ✓ ✓
Glenn ✓ ✓
Humboldt ✓ ✓
Imperial ✓ ✓
Inyo ✓ ✓ ✓
Kern ✓ ✓ ✓ ✓
Kings ✓ ✓
Lake ✓ ✓ ✓ ✓
Lassen ✓ ✓ ✓ ✓
Los Angeles ✓
Madera ✓ ✓
Marin* ✓ ✓
Mariposa ✓
Mendocino ✓
Merced ✓
Modoc ✓
Mono ✓ ✓
Napa ✓ ✓ ✓ ✓
Orange ✓ ✓ ✓
Placer ✓
Plumas ✓ ✓ ✓
Riverside ✓
Sacramento ✓ ✓ ✓
San Benito ✓ ✓ ✓
San Bernardino ✓
San Diego ✓
San Francisco ✓ ✓ ✓ ✓
San Joaquin ✓ ✓
San Luis Obispo ✓ ✓
San Mateo ✓ ✓ ✓ ✓
Santa Barbara ✓
Santa Cruz ✓ ✓ ✓ ✓
Shasta ✓ ✓
Sierra ✓ ✓
Solano* ✓ ✓ ✓ ✓ ✓
Sonoma ✓ ✓ ✓
Stanislaus ✓
Sutter* ✓ ✓
Tehama ✓ ✓
Trinity ✓
Tulare ✓ ✓ ✓
Tuolumne ✓
Ventura ✓ ✓ ✓ ✓
Yolo ✓ ✓
Yuba ✓ ✓ ✓ ✓ ✓
*Teams/combinations of workers conduct orientation.

10
Figure 2.2—Ongoing Implementation of Staffing Models
partially, in others their implementation (countywide or part-county) is currentlyunderway and in others still under consideration.
For example, while 31 percent of counties have completed reclassification ofcaseworker positions, and another 38 percent have not considered reclassificationor decided not to adopt this option, still another 31 percent have reclassificationunderway or under consideration at this time. The extent of partial or ongoingimplementation and consideration of staffing changes suggests that a significantnumber of counties are still exploring alternative staffing models and that furtherchanges should be expected.
Models of Interagency Coordination
The CalWORKs program clearly calls for interagency coordination andcooperation in a number of areas. Key informants described a variety of ways inwhich the CWDs have tried to accomplish this, many without much priorexperience in working with other agencies.3 Co-locating CalWORKs staff withstaff from partner agencies, interagency case management, and pooling of fundsfor services delivery are among the models being used. The 1999 ACIS asked all
________________ 3Klerman et al., 2000.

11
counties to report on their use of these approaches. The results are summarizedin Figure 2.3. The names of the counties that report having adopted theseinteragency models countywide are shown in Table 2.2.
The most frequently adopted approach on a countywide basis is co-locatingbehavioral health and CWD CalWORKs staff, which just over half the countiesreported in place countywide and few have so far ruled out. Forty percent of thecounties have in place using interagency teams to provide case management andfewer than 10 percent have so far ruled out this model. Countywide interagencyco-location between CWD CalWORKs and behavioral health department orEDD/JTPA/WtW Grant providers was reported by almost 30 percent of thecounties and few have decided not to adopt this approach. About 40 percenthave decided not to adopt or not considered the option of pooling funds orsharing costs across agencies. Much more common, as we discuss below, is thepractice of Memorandum of Understanding (MOU) or other interagencyarrangements for referring CalWORKs clients directly from CWDs to agencieswith funding for specific services.
Figure 2.3 shows that quite a few counties have yet to fully implement or even toconsider interagency options. From 40 to 60 percent, depending on the specificapproach, are still dealing with the consideration or implementation of these
Figure 2.3—CalWORKs Interagency Models

12
Table 2.2
Counties with Interagency Models in Place Countywide
Pool funds/sharecosts across
multiple agencies
Co-located staff fromwelfare and mental
health and/or alcoholand drug agencies in
CalWORKs offices
Co-locatedCalWORKs EDD,
JTPA/WIA and/orWelfare to Work
grant services
Use interagencyteams to provide
case managementAlameda ✓
Alpine ✓
Amador ✓
Butte ✓
Colusa ✓
Contra Costa ✓
El Dorado ✓ ✓
Glenn ✓ ✓ ✓ ✓
Humboldt ✓
Inyo ✓
Kern ✓ ✓ ✓ ✓
Lake ✓ ✓
Lassen ✓ ✓
Madera ✓
Marin ✓ ✓ ✓
Mariposa ✓ ✓
Mendocino ✓
Modoc ✓ ✓
Mono ✓ ✓
Monterey ✓
Napa ✓ ✓ ✓
Orange ✓ ✓
Placer ✓ ✓
Plumas ✓
Riverside ✓
Sacramento ✓
San Benito ✓
San Francisco ✓ ✓ ✓ ✓
San Joaquin ✓ ✓
San Luis Obispo ✓
San Mateo ✓ ✓
Santa Cruz ✓ ✓ ✓
Sierra ✓ ✓
Siskiyou ✓ ✓ ✓
Solano ✓
Sonoma ✓ ✓ ✓
Stanislaus ✓ ✓
Sutter ✓
Tehama ✓ ✓
Trinity ✓
Tulare ✓
Ventura ✓ ✓ ✓
Yolo ✓ ✓
Yuba ✓ ✓
models of interagency working relationships. For example, as shown in Figure2.4, another 45 percent of the counties have partially co-located CWD andEDD/JTPA, WtW Grant personnel, and a few more have this approach underconsideration.

13
Figure 2.4—Interagency Models
Likewise, in addition to the 40 percent of counties with countywide interagencycase management for CalWORKs clients, 28 percent have interagency casemanagement in some of their CalWORKs offices and 21 percent are consideringthis approach. Two points are evident from these results. First, further changesin organizational approaches should be expected. Second, even when countiesreport similar implementation approaches they may have different implicationsin terms of the scale of implementation so far completed.
Outsourcing
As noted above, few counties have outsourced their entire WTW operation. Butoutsourcing is popular with the counties in a variety of service areas. Theyaccomplish this in two ways: first, by contracting with community organizationsto provide the service and second, by arrangements with other county agenciesfunded directly to provide such services, e.g., mental health and substance abusetreatment. In other areas the counties tend to provide services directly.However, as shown in Table 2.3, often a variety of mechanisms are used toprovide CalWORKs program components and services for special populations.

14
Table 2.3
Approaches to Providing CalWORKs Program Components and Services
Number of Counties
Program ComponentsDirectly byCWD Only
ContractedOnly
MOU/Referral
Only Combination
CalWORKs orientation 53 1 0 4
Job assessment 28 11 2 16
Screening and referral fordomestic abuse services 28 2 9 18
Stage 1 child careadministration 25 28 2 3
Screening and referral formental health services 22 7 13 16
Post employment services 22 7 5 23
Screening and referral forsubstance abuse 20 7 13 18
Job Club 20 16 7 15
Stage 3 child care 1 25 28 3
Stage 2 child care 4 24 24 5
Services for work barriers
No high school diploma 2 11 39 6
Limited literacy skills 1 7 34 14
No work experience 13 9 6 29
Chronic health problem/disability 1 5 28 10
Language barrier 12 7 13 30
Legal problems 6 6 20 11
Remote location/lack oftransportation 22 7 3 13
Substance abuse treatment 1 13 35 8
Mental health treatment 2 13 34 9
Educational services 2 9 34 12
Domestic abuse services 2 12 31 11
Vocational training 2 8 33 13
Services targeting refugeefamilies 9 7 2 9
Services targeting non–English-speaking families 13 7 6 24

15
Services Provided
Another variation across the counties is in the types of services offered. While allcounties provide all the basic components of CalWORKs such as orientation, JobClub, and job assessments, they vary somewhat in terms of other services, e.g.,for specific work barriers such as health and legal problems, services for refugeefamilies, and transportation. Table 2.4 shows the variability in services provided.
Table 2.4
Services Not Provided
Counties Where ServicesAre Not Provided
Program Components Number Percentage
CalWORKs orientation 0 0Job assessment 0 0Screening and referral fordomestic abuse services 0 0Stage 1 child care administration 0 0Screening and referral for mentalhealth services 0 0Post employment services 2 3Screening and referral for substanceabuse 0 0
Job Club 0 0Stage 3 child care 1 2Stage 2 child care 1 2Services for work barriers
No high school diploma 0 0Limited literacy skills 2 3No work experience 0 0Chronic health problem/disability 11 19Language barrier 5 9Legal problems 15 26Remote location/lack of transportation 10 17
Substance abuse treatment 0 0Mental health treatment 0 0Educational services 1 2Domestic abuse services 1 2Vocational training 2 3Services targeting refugee families 29 50Services targeting non–English-speaking families 7 12

16
Home Visits
During key informant interviews with our focus and follow-up counties welearned that quite a few counties have begun to make home visits as part of theirCalWORKs program. In the ACIS we asked all the counties to report on whetherand when they make home visits for new applicants, participants about to besanctioned, and participants who have had a sanction applied. Their replies aresummarized in Table 2.5.
Few counties make home visits to applicants before eligibility determination, andthe few that do mostly do so on a selective or a pilot basis. However, altogether34 counties are making home visits either before or after applying sanctions,though few do so in all cases. Several that do not indicated that they areplanning such programs for the future. Home visits to prevent or follow up onsanctions are in use throughout the state by all sizes of county though large- andmedium-size counties are slightly overrepresented in this group.
Thirty-five counties reported that they make home visits for other purposes insome or all cases. Most frequently named purposes were for fraud prevention ordetection (9 counties); intensive case management or families with specialbarriers (8 counties); follow-up on “no shows” (6 counties); and whentransportation, remote location, or illness make it impossible for clients to visitCalWORKs offices (6 cases).
Table 2.5
Use of Home Visits by Counties
In All Cases
Pilot Projector Subset of
Cases
Never orAlmostNever
New applicants before eligibilitydetermination 9% 14% 72%
Before sanctions are applied 15% 29% 50%
After sanctions have been applied 14% 41% 38%
Other 24% 36% 19%
Statistical Reporting
CalWORKs caseloads can be divided into many categories of participants, thestatus of which are useful to monitor for planning, operations, and evaluationpurposes. As implementation proceeds we were interested in learning about theextent to which the counties have been monitoring the various categories of

17
participants. One question in the 1999 ACIS asked how many counties receiveregular (defined as at least quarterly) statistical reports on different categories ofparticipants. The categories are shown in Figure 2.5 along with the number andpercent of counties that have statistical reporting on each category.
Statistical reporting is widespread. Not surprisingly given the monthly WTW 25report (instituted as of the July 1999 reporting period as the survey was beingfilled out), 98 percent of counties have regular statistical reporting on theparticipants enrolled in welfare to work activities, employed, using subsidizedchild care, and enrolled in WtW grant program services. At the opposite end ofthe continuum 57 percent have no statistical reporting on participantsapproaching 60-month time limits and 26 percent have no regular statistics onparticipants approaching the 18/24-month time limit, items that are not includedin the WTW 25. Across the various categories, it appears that large and mediumcounties are more likely to lack statistical reporting than small counties.
The ACIS question asked about statistical reporting for 20 categories ofparticipants and diversions. Twelve counties indicated that they receivestatistical reporting for all 20 categories. Twenty-two reported that they havereporting on all except 1 or 2 categories, and another ten counties lack reportingfor only 3 to 5 categories of participants. Only two counties lack reporting forover half of the categories of participants included.
Figure 2.5—Widespread Availability of Statistical Reports

18
The ACIS also asked about the level of management—county level seniormanagement, district managers, and supervisors—at which statistical reportingwas available. Table 2.6 shows the percentage of counties with regular statisticalreporting at the three levels of management by category of reporting. It is clearfrom this table that statistical reporting is most widespread at the supervisorlevel of management. Only a few categories, such as diversions, are more likelyto be available at the senior management level than at the supervisor level. It isworth noting that the numbers for district manager level are lower probablybecause many small counties do not have district managers rather than becausethey receive fewer statistical reports in the counties where they exist.
Table 2.6
Statistical Reporting by Level of CalWORKs Managers
Number of Counties
SeniorManagement
DistrictManagers Supervisors
Enrolled in welfare to work activities 41 33 44
Employed 43 32 42
Employed 32 hours 25 26 35
Meeting TANF work requirements 26 24 37
Using subsidized child care 30 28 37
Failing to attend Job Club 16 23 41
Out of compliance with work activityparticipation requirements 18 24 37
Sanctioned 35 32 40
Approaching 18/24-month limit 18 22 35
Approaching 60-month time limit 7 8 16
Enrolled in WtW grant program services 26 29 38
Referred to mental health services 26 24 36
Referred to substance abuse services 25 24 36
Referred to domestic violence services 19 23 35
Utilizing mental health services 24 22 33
Utilizing substance abuse services 23 22 32
Utilizing domestic abuse services 14 18 30
SIPs 25 25 41
Declared exempt 30 25 39
Diversions 32 21 24

19
Within counties the most typical pattern is for statistical reports to be available atmultiple levels of management. Only ten counties limit reporting to a singlelevel, either supervisors or senior management, and most of these are smallcounties where there are fewer levels of management. In six counties reports onsome categories of participants are received at one level and reports on othercategories are received at another level.


21
3. Changes in County Caseloads, Staffing,and Resources
In addition to asking about CalWORKs program organizational differencesamong counties the ACIS asked counties to report on changes in their caseloads,staffing, and resources. Differences among the counties and changes over timemay help explain differences in outcomes and implementation experiences. TheACIS included questions about changes in caseload and staff increases duringthe past 12 months. It also repeated the 1998 ACIS question about capacity andfunding resources for a variety of services.
Caseload Declines
Twenty-three counties, 40 percent of the 58 counties, reported that the per-worker caseloads of both eligibility workers and employment/welfare to work(WTW) workers have declined over the past 12 months. Only two countiesreported increases in caseloads for both types of workers and eight countiesreported that caseloads had remained about the same for most eligibility andWTW workers. The remaining twenty-two counties that replied to this questionhad experienced some caseload increase, mostly for WTW workers, and somedecrease. Sixteen counties, 28 percent of the total, reported increases in thecaseloads of most WTW workers. Increases occurred disproportionately amongthe medium-sized counties. However, in most of the counties where increases inWTW caseloads occurred, there were decreases in the eligibility workers’caseloads during the same period. Only six counties reported eligibility workercaseload increases.
Staffing Increases
Most counties increased their CalWORKs staffing during the past 12 months.Forty-four counties increased the number of eligibility and/or WTW caseworkersand 36 added supervisory and/or management staff. Just over half, 33, hired atboth levels. Eight counties did not add CalWORKs staff during the past year.Most of the increase in caseworkers was accomplished from a combination offilling vacancies and hiring for new positions, while hiring for new positions wasthe means most often used to add supervisory/management staff. Large

22
counties were more likely and small counties less likely to report increases intheir CalWORKs staff.
Other Resources
Services Capacity
In both years of the survey we asked the counties to indicate any shortfalls,current or anticipated, in capacity to deliver a variety of different services fromchild care to training. Figure 3.1 displays the counties’ 1999 responses forcapacity shortfalls.
It shows off hours and weekend child care, transportation, mildly ill and infantchild care topping the list of services with current capacity shortfalls. These samefour areas ranked at the top of the list in 1998. Half or more of the countiesreport current or anticipated capacity shortfalls for ten of the seventeen serviceareas shown on Figure 3.1.
Shown at the bottom portion of the chart are the seven areas where a majority ofcounties, about 70 percent or more, report no shortfall.
Counties vary somewhat in current shortfalls based on size. For example, 91percent of small counties report current capacity shortfalls for off hours/weekend child care compared to 62 percent and 71 percent for medium and largecounties, respectively. While almost 50 percent of small counties report current
Figure 3.1—Capacity Shortfalls

23
capacity shortfalls for community service, only 19 percent of medium and 7percent of large counties do so. Finally, close to 90 percent of both small andmedium counties report current capacity shortfalls for transportation, while littleover 60 percent of large counties report such shortfalls.
Figure 3.2 shows the differences in current and anticipated capacity shortfalls for1998 and 1999 for children’s services. What is somewhat different between thetwo years is that fewer counties report in 1999 that they anticipate futureshortfalls for a variety of services especially those for children. For half or fewercounties, with the exception of mildly ill child care, the numbers anticipatingshortfalls in 1999 are significantly fewer than in 1998. The numbers reportingcurrent shortfalls are little changed between 1998 and 1999.
Figure 3.2—Capacity Shortfalls—Children’s Services, 1998 vs. 1999
Services Funding
The ACIS also asked the counties to report on funding shortfalls to pay for thesame services. Figure 3.3 shows the 1999 results. The result is somewhatdifferent from the capacity story.
Most counties report only a few service areas with current funding shortfalls.Stage 2 and Stage 3 child care top the list with 35 and 38 counties respectivelyreporting current funding shortfalls for these services. Those who report current

24
Figure 3.3—Funding Shortfalls
or anticipated shortfalls do so most in the children's services area.Approximately 40 percent of both small and medium counties report currentfunding shortfalls for vocational rehabilitation whereas only 14 percent of largecounties report such funding shortfalls. In contrast with the capacity shortfallpicture, large counties are more likely to report child care funding shortfalls thansmall counties.
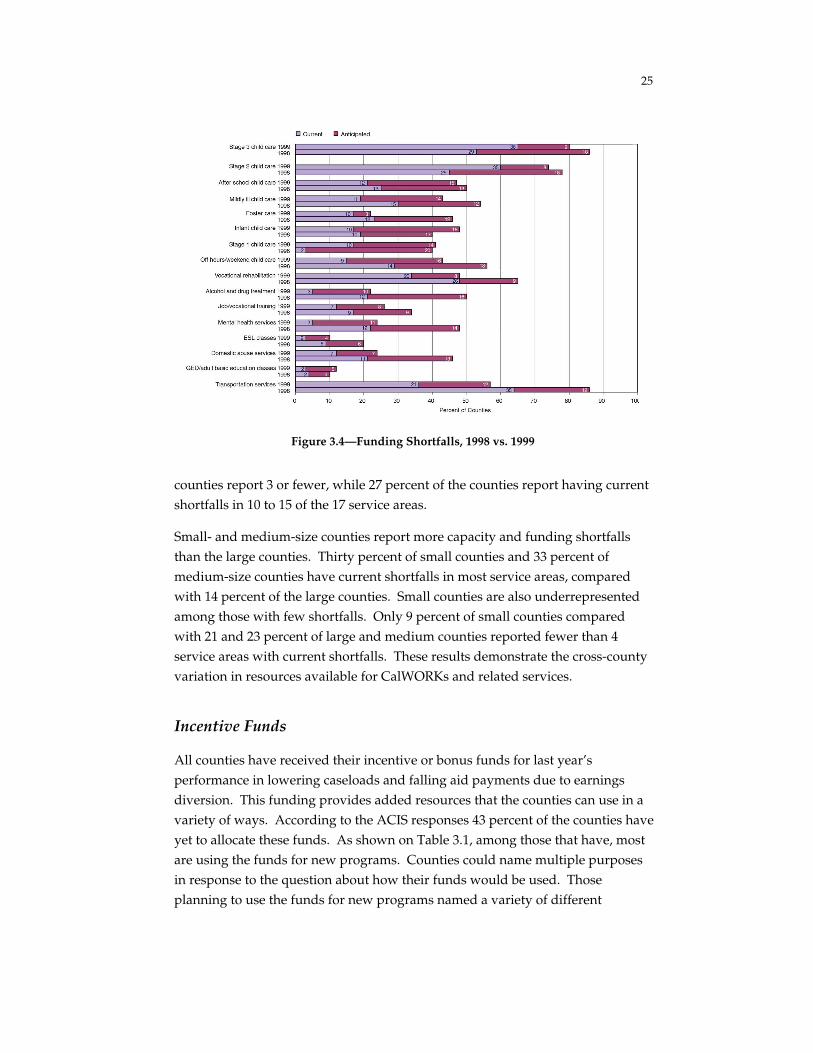
The trend is mixed. For Stage 1, 2, and 3 child care, more counties report currentshortfalls in 1999 than in 1998. For several other children's services, morecounties anticipate shortfalls than in 1998. About 30 percent now anticipateshortfalls in funding for off hours, mildly ill, infant, and after school child care.For job training and other supportive services such as treatment, fewer countiesreport current or anticipated shortfalls in 1999 but more report current shortfallsfor job/vocational training, ESL classes, GED/basic education services, andtransportation. These comparisons are shown in Figure 3.4.
Another way to assess the resource limitations that some counties face is toexamine the number of counties that respond to having shortfalls in bothcapacity and funding. Looking across capacity and funding figures, we find thatcurrent shortfalls in both are most common for Stage 2 and Stage 3 child care,transportation services, and vocational rehabilitation.
Of the 17 included services, the average number of reported current shortfalls ineither or both capacity and funding per county is 7. Seventeen percent of the
25
Figure 3.4—Funding Shortfalls, 1998 vs. 1999
counties report 3 or fewer, while 27 percent of the counties report having currentshortfalls in 10 to 15 of the 17 service areas.
Small- and medium-size counties report more capacity and funding shortfallsthan the large counties. Thirty percent of small counties and 33 percent ofmedium-size counties have current shortfalls in most service areas, comparedwith 14 percent of the large counties. Small counties are also underrepresentedamong those with few shortfalls. Only 9 percent of small counties comparedwith 21 and 23 percent of large and medium counties reported fewer than 4service areas with current shortfalls. These results demonstrate the cross-countyvariation in resources available for CalWORKs and related services.
Incentive Funds
All counties have received their incentive or bonus funds for last year’sperformance in lowering caseloads and falling aid payments due to earningsdiversion. This funding provides added resources that the counties can use in avariety of ways. According to the ACIS responses 43 percent of the counties haveyet to allocate these funds. As shown on Table 3.1, among those that have, mostare using the funds for new programs. Counties could name multiple purposesin response to the question about how their funds would be used. Thoseplanning to use the funds for new programs named a variety of different

26
Table 3.1
Use of Incentive Funds
Use of FundsNumber ofCounties
Percentage ofCounties
Not yet planned/allocated 25 43
New programs 25 40
Reserve 8 14
New staff 8 14
Capital improvements 6 10
Other 10 17
programs. Those mentioned most frequently include loan programs, health andbehavioral health programs, transportation, and employment services.

27
4. Counties’ Views of CalWORKs Successand Challenges
The ACIS is the only component of the Statewide CalWORKs Evaluation thatprovides qualitative information about the implementation experiences of all 58counties. This section provides the results from questions that asked the countiesto assess how well various aspects of their CalWORKs programs are workingand what challenges remain.
Where possible we compare their responses with those from the 1998 ACIS.
Successful Strategies to Address ImplementationChallenges
Providing feedback to stakeholders on successful implementation strategies isone of the purposes of the ACIS. This year’s questionnaire included a list of 18implementation challenges (see Table 4.1) and asked that counties report onthose for which they believed they had particularly successful strategies. Thedefinition of success was left to the counties. One county, Plumas, noted inresponse that it is involved with strategies in many of the areas listed but it hadno data or impressions of which were more effective than others. Few countieshave systematically evaluated interventions or program modifications designedto address implementation problems. Nonetheless the inventory of strategiesprovided by the counties in response to this question does illustrate the rangeand variation in strategies being adopted to address implementation problemssuch as noncompliance, transportation assistance, and monitoring programoutcomes. Table 4.1 lists each of the implementation challenges included in theACIS question and the counties that described strategies for addressing them intheir ACIS reply.
Half or more of the counties indicated that they had successful strategies for thefollowing implementation challenges:
•Working with the community (e.g., community based organizations [CBOs],faith based organizations [FBOs], employers, and business groups);

28
Table 4.1
Strategies for Implementation

29
Table 4.1 (Continued)

30
•Identifying needs and providing services for participants with mental health,domestic abuse, or substance abuse problems;
•Home visits to prevent or remedy sanctions;
•Coordinating with WtW grant providers;
•Linking participants with job training programs; and
•Communicating CalWORKs program requirements and rules to non–English-speaking applicants and participants.
Fewer than half indicated successful strategies in the following areas ofimplementation:
•Implementing sanctions;
•Detecting and prosecuting fraud;
•Increasing participation rates among two-parent families;
•Implementing diversion programs;
•Promoting economic development;
•Encouraging use of post employment/job retention services;
•Monitoring program performance outcomes;
•Providing transportation assistance;
•Ensuring continuing child care, MediCal, and/or Food Stamps for familiesleaving aid;
•Increasing utilization of subsidized child care;
•Improving computer systems; and
•Increasing compliance with required CalWORKs activities (e.g., limiting “noshows”).
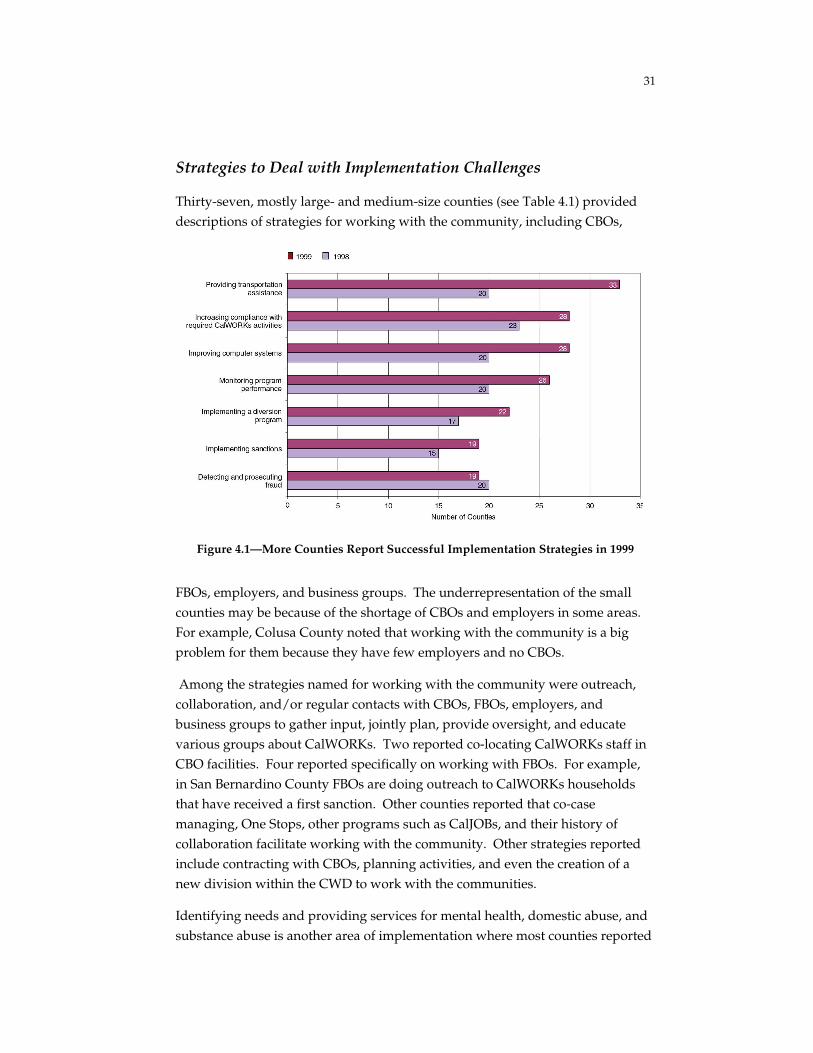
We compared the 1999 responses with those from 1998 for the implementationchallenges included in both years’ questionnaires and found, as shown in Figure4.1, increased numbers of counties reporting successful strategies in 1999compared to 1998 for six out of seven implementation challenges. This resultsuggests that the counties may be making progress in their efforts to addressimplementation problems.
31
Strategies to Deal with Implementation Challenges
Thirty-seven, mostly large- and medium-size counties (see Table 4.1) provideddescriptions of strategies for working with the community, including CBOs,
Figure 4.1—More Counties Report Successful Implementation Strategies in 1999
FBOs, employers, and business groups. The underrepresentation of the smallcounties may be because of the shortage of CBOs and employers in some areas.For example, Colusa County noted that working with the community is a bigproblem for them because they have few employers and no CBOs.
Among the strategies named for working with the community were outreach,collaboration, and/or regular contacts with CBOs, FBOs, employers, andbusiness groups to gather input, jointly plan, provide oversight, and educatevarious groups about CalWORKs. Two reported co-locating CalWORKs staff inCBO facilities. Four reported specifically on working with FBOs. For example,in San Bernardino County FBOs are doing outreach to CalWORKs householdsthat have received a first sanction. Other counties reported that co-casemanaging, One Stops, other programs such as CalJOBs, and their history ofcollaboration facilitate working with the community. Other strategies reportedinclude contracting with CBOs, planning activities, and even the creation of anew division within the CWD to work with the communities.
Identifying needs and providing services for mental health, domestic abuse, andsubstance abuse is another area of implementation where most counties reported

32
successful strategies. We were somewhat surprised that 40 counties hadsuccessful strategies to describe, given the low rate of referral and utilization ofthese services by CalWORKs clients.1 The most frequently named strategy wasco-location of staff from the alcohol and drug programs (ADPs), mental health(MH), and domestic abuse services areas with CalWORKs staff. However, fromthe 20 descriptions of co-location provided it is clear that co-location meansdifferent things in different places. Co-located behavioral health and domesticabuse staff perform a variety of functions including training CWD staff;providing information about services to CalWORKs clients at orientations,workshops, and seminars; screening and assessments; referral and liaison withservice providers, including monitoring progress in treatment; providingtherapeutic services; and co-case managing with CalWORKs staff. Other lessfrequently named strategies included contracting to provide outreach withclients in the community, use of specially trained CWD staff, staff training,contracting with CBOs to provide services, and efforts to identify problems “upfront” or during orientation. In Monterey County, county behavioral health staffprovide a “stress management module” and describe services available as part ofCalWORKs orientation. Several counties named multiple strategies being used incombination, and one, Fresno, reported that it had recently completed anevaluation of how it was providing substance abuse services for its clients.
Twenty-eight counties described strategies for meeting transportation problems.Small counties were again underrepresented in this group relative to theirpercentage of the total. Transportation problems can be especially acute in ruralareas and while 8 small counties were included in the 28, it is not surprising thatmost small counties did not report successful strategies in this area. Colusaindicated that transportation problems are one of their worst barriers. About 10counties said the CWD itself provides or contracts to provide rides forCalWORKs clients; another 10 said they had arranged for the expansion of routesor extension of hours for public bus service to improve access for CalWORKsclients. Twelve counties reported on a variety of subsidy programs to providefor repairs, purchase of vehicles, loans, and payment of automobile insurance forparticipants.
For other implementation challenges far fewer counties claimed they hadsuccessful strategies. For example, only 12 described successful strategies forimplementing sanctions and most of these involved strategies to avoid sanctions,such as outreach with noncompliant households and use of incentives anddisincentives. These counties had few cases sanctioned, while others indicated
_________________1Klerman et al., 2000.

33
that they had been active in processing sanctions. Solano County reported that ithas strategies designed to avoid the need for additional sanctions but alsoprovides training for staff on noncompliance and expects timely imposition ofsanctions.
Encouraging use of post employment and job retention services has also provendifficult, and many counties are currently focused on this component of theirprograms. This is evident from the ACIS responses as few counties offeredspecific strategies and several indicated that they were planning this program orhiring new staff or piloting or considering other options. Two reported that jobretention hot lines were in use, one provides incentives such as gift certificates tothose who remained employed for a certain period of time, and several talkedabout the need for outreach to remind clients that post employment services areavailable and to encourage their use.
Increasing participation rates among two-parent families can be anotherchallenging area, although some counties that responded to this questionindicated that the participation rate for two-parent families was not a problemfor them. The successful strategies described by the counties fell into three areas:identifying the needs of both parents; prioritizing two-parent families forservices, such as referral to WtW grant program; and providing additionalservices such as intensive case management, family- versus participant-focusedservices, and services addressing cultural issues.
Implementing diversion programs (in which a potential recipient receives a lumpsum payment rather than becoming a welfare recipient) has also posed problemsfor some counties that report that few clients make use of this program. Otherssuch as Fresno, Lake, Orange, and Sonoma have had successful experiences (e.g.,clients not coming back on aid) with diverting cases although they had notdiverted large numbers. Some described their approach as utilizing flexiblecriteria and/or a case by case approach. San Luis Obispo reported that workerstake the time to fully explore options with their clients.
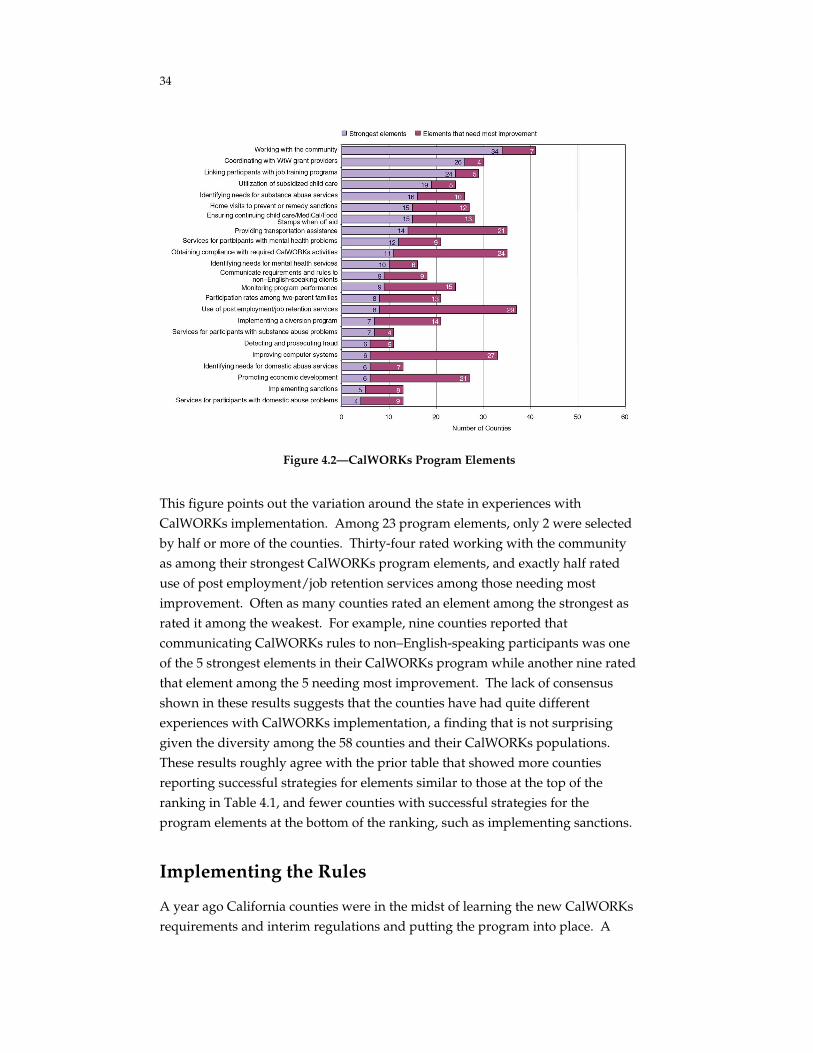
The ACIS also asked the counties to review a related list of CalWORKs programcomponents and to select five that were the strongest elements of their programand five that needed the most improvement or modification in order to meetCalWORKs goals. The program components from which they selected areshown in Figure 4.2. They are ranked according to the number of counties thatnamed each as among the five strongest elements of their CalWORKs program.Also shown is the number of counties naming the element among the fiveneeding most improvement.
34
Figure 4.2—CalWORKs Program Elements
This figure points out the variation around the state in experiences withCalWORKs implementation. Among 23 program elements, only 2 were selectedby half or more of the counties. Thirty-four rated working with the communityas among their strongest CalWORKs program elements, and exactly half rateduse of post employment/job retention services among those needing mostimprovement. Often as many counties rated an element among the strongest asrated it among the weakest. For example, nine counties reported thatcommunicating CalWORKs rules to non–English-speaking participants was oneof the 5 strongest elements in their CalWORKs program while another nine ratedthat element among the 5 needing most improvement. The lack of consensusshown in these results suggests that the counties have had quite differentexperiences with CalWORKs implementation, a finding that is not surprisinggiven the diversity among the 58 counties and their CalWORKs populations.These results roughly agree with the prior table that showed more countiesreporting successful strategies for elements similar to those at the top of theranking in Table 4.1, and fewer counties with successful strategies for theprogram elements at the bottom of the ranking, such as implementing sanctions.
Implementing the Rules
A year ago California counties were in the midst of learning the new CalWORKsrequirements and interim regulations and putting the program into place. A

35
year later we were anxious to determine whether there have been changes inhow the counties view the CalWORKs program rules and requirements. Weagain asked the counties to review a long list of the program’s requirements andrules and to indicate whether these rules were presenting temporary or ongoingproblems or were not a problem at this time. The 1999 list somewhat overlappedwith the list presented in 1998. The results are fairly consistent with significantagreement among the counties that most rules are not posing implementationproblems. Figure 4.3 presents the list ranked by the percent of counties reportingthat it is not a problem at this time. Among the 20 rules listed in the 1999questionnaire, a majority of counties indicated that 11 of the 20 were not aproblem in their counties at this time. Between 45 and 50 percent said thatanother 5 of the rules were not posing a problem at this time. Only 2requirements, coordinating of three stages of child care and monitoring/reporting on county performance outcomes were reported by a majority of thecounties to pose ongoing problems at this time. These requirements also toppedthe list in the 1998 survey.
Of the 20 CalWORKs program requirements and rules included in the ACIS list,the average number posing ongoing problems per county is 6. Twenty-twopercent of the counties report 3 or fewer, while 12 percent report that 10 to 15 of
Figure 4.3—Rules Least Likely to Present Implementation Problems

36
the CalWORKs rules are presenting ongoing problems. While small countiesreported more shortfalls in resources than large counties, small counties reportedfewer problems with CalWORKs requirements and rules than did large counties.Only 4 percent of small counties had ongoing problems with many requirementscompared with 14 percent of large counties. Forty percent of small countiesreported 3 or fewer problem areas compared with only 7 percent of largecounties. Among medium counties the results are more mixed. Nineteenpercent were at the high end with 10 or more problem areas while 14 percentwere at the low end with fewer than 4 ongoing problem areas related toCalWORKs requirements and rules.
Not surprisingly, the number of counties reporting start-up or transitionalproblems has declined significantly from last year. In some cases transitionalproblems appear to have been resolved and in others to have become ongoing.Figure 4.4 shows the difference between 1998 and 1999 for the CalWORKs rulesthat were most likely to be a problem in 1998. Over time, some turn out to beposing ongoing problems in more counties and others in fewer. For example, thenumber of counties that say coordinating the three stages of child care presentsan ongoing problem increased from 21 to 35 counties over the past year; whilethe number of counties reporting that work requirement rates for two-parentfamilies presented an ongoing problem decreased from 35 to 27.
Figure 4.4—Rules Most Likely to Present Implementation Problems, 1998 vs. 1999

37
Two-Parent Family Participation Requirements
Meeting work participation requirements for two-parent families has been anongoing concern at the state level, though the experience at the county level hasvaried depending on how many two-parent families are in the caseload andwhat their employment experience has been. Immigrant and refugee familiesmake up a significant portion of the two-parent family caseload. These familiesmay be at higher risk for poor job histories because of language difficulties, pooreducational attainment, and cultural barriers. This year the ACIS questionnaireasked about the work barriers and other issues that are problems for two-parentfamilies in the CalWORKs caseload. The counties were asked to select up tothree barriers or challenges, from a list of fourteen,2 that are particularlyprevalent or difficult for three groups: two-parent refugee families, two-parentimmigrant families and two-parent non-refugee, non-immigrant families. Table4.2 shows the barriers named most frequently and the number of counties thatassociated them with each group. It is not surprising that socio-cultural andlanguage barriers topped the list, but there are some notable differences. Almosttwice as many counties name limited literacy skills as a problem for immigrantfamilies compared with refugee families and non-refugee, non-immigrant
Table 4.2
Two-Parent Participation Barriers
Number of Counties
Two-ParentRefugeeFamilies
Two-ParentImmigrant
Families
Two-ParentNon-refugee,
Non-immigrantFamilies
Socio-cultural barriers 23 25 7Language barriers: obtainingemployment 21 32 0Limited literacy skills 12 26 14Language barriers:understanding/using CalWORKs 11 12 1No work history/experience 3 3 28Lack of transportation 2 6 17No high school diploma/GED 1 3 16Legal problems 1 3 12Substance abuse problems 0 0 30
_________________2No high school diploma, limited literacy skills, no work history/experience, mental health
problems, substance abuse problems, domestic abuse problems, chronic health problems/disabilityin family, children ill or with special needs, language barriers: obtaining employment, languagebarriers: understanding and using CalWORKs, socio-cultural barriers, legal problems, remotelocation, lack of transportation.

38
families. The counties named quite different barriers for non-refugee, non-immigrant families.
Factors That Hinder and Facilitate Implementation
As noted above, counties have different structural and organizationalapproaches to CalWORKs programming and report differences inimplementation successes and problems. We asked counties to review a list ofcharacteristics associated with communities and CWDs and to indicate whichhave hindered and which have facilitated implementation of CalWORKs, orwhether they have had no effect to date. The results, ranked by those most likelyto hinder implementation, are shown on Figure 4.5 for the 1999 survey list ofcharacteristics. This chart shows a fair amount of agreement among the countieson what hinders and what facilitates implementation. At the top of the chart arethe characteristics that almost all counties agree are hindering implementation.At the bottom are those where a large majority agree that they facilitateimplementation. The supply of entry-level jobs appears to hurt in about half thecounties and to help in the other half. Similarly welfare department stafftraining, experience, and culture are factors on which counties differ on whetherthey hinder or facilitate implementation.
In general the counties seem to be more positive about the influence ofcharacteristics of their economies and the CWD on implementation in 1999 thanthey were in 1998. Among eight characteristics included on the survey both
Figure 4.5—Factors That Hinder and Facilitate Implementation

39
years, more counties reported that they facilitated implementation in 1999 thanin 1998, for all except one factor—county welfare staff experience. For this factor,the number that reported it hinders implementation increased from 17 in 1998 to27 in 1999. The comparison between years is shown on Figure 4.6.
Figure 4.6—Factors That Hinder and Facilitate Implementation, 1998 vs. 1999


41
5. Conclusions
In general, California counties reported a more favorable view of CalWORKs in1999 compared to 1998. Fewer reported problems with CalWORKs requirementsand rules, and fewer CWD and economic factors hinder implementation. Morecounties reported they had successful implementation strategies in a variety ofareas. Most indicated that they have regular statistical reporting on the status ofthe various categories of CalWORKs caseloads. Over the past year, caseloaddeclines were more common than increases, although 16 counties did reportincreases in the caseloads of most employment/WTW staff. In spite of declinesin numbers of cases, most counties added CalWORKs staff. Over half hired bothcaseworkers and supervisory management staff in what appears to be an effort tomeet the increased workload for the remaining caseload. For example, half thecounties have started to make home visits part of their CalWORKs program.
In most categories of CalWORKs services except Stage 2 and Stage 3 child care,few counties report current funding shortfalls. Looking at the capacity toprovide services, most counties reported current or anticipated shortfalls in avariety of child care types, transportation, and community service jobs. Forty-three percent of counties have as yet unallocated incentive funds, and about 40percent said they will use the funds for new programs. Our findings on CWDresources support the contention of many of our key informants that linkingclients with needed services can be difficult if capacity is inadequate and requiresincreased staff in spite of caseload declines. The availability of funding includingincentive funds suggests that if new programs and increased capacity can bedeveloped, funding will not be a problem in the short term.
Organizational changes continue at CWD and interagency levels. Some modelshave become fairly common. For example, almost 60 percent now co-locateeligibility and employment/WTW CalWORKs staff. Fifty-five percent co-locateCWD CalWORKs staff and mental health or behavioral health department staff.Many other approaches are less widespread with as many counties rejecting anapproach as have adopted it. About equal numbers provide Stage 1 child carevia CWD as contract out this service. Many counties are using a combination ofmechanisms including CWD staff, contracts with CBOs, and MOUs with othercounty agencies, to provide CalWORKs program components and services forwork barriers.

42
Clearly the ACIS does not provide the context or the details of implementationthat our key informant interviews and site visits provide in 6 focus and 18follow-up counties participating in the evaluation. What the reports from 58counties do provide is a broad picture of implementation statewide and a view ofprogress over time that other components of the evaluation cannot offer. Giventhe differences in approach, scope, and content of CalWORKs programcomponents that the ACIS reveals, it is our conclusion that comparisons acrosscounties must be made with caution when trying to explain differences inoutcomes using implementation information provided in the ACIS.
We conclude from these data that implementation continues within a variety ofstaffing and interagency organizational models and that further organizationalchanges may be in store, especially in the use of home visits for pre- and post-sanction CalWORKs families and in the development of post employment/jobretention and community service job programs.
As implementation continues, the counties face a number of remainingchallenges that could affect their success in meeting CalWORKs goals. Amongthe frequently named program elements in most need of improvement were postemployment/job retention services and obtaining compliance with requiredCalWORKs activities. Few had successful strategies to offer in these areas. Fewhad successful sanctions strategies. Few have yet to focus on monitoringprogress of their caseload toward the 60-month lifetime limit.
We expect that the third ACIS in the summer of 2000 will provide another updateon implementation progress and highlight the variation among counties and theongoing challenges facing most counties.
43
Appendix
ACIS Questionnaire
Following is a replica of the 1999 All-County CalWORKs Implementation Surveythat was sent to all 58 counties.

44
LABEL HERE – COUNTY NAME– COUNTY ID
1999 ALL-COUNTY CalWORKsIMPLEMENTATION SURVEY
County contact person for follow-up/clarification of questionnaire responses:
Name: _________________________ Title: _____________________________
Telephone: ( ) _______________ Fax: ( )_________________________
Office Use Only
Received _____ / _____ / 99
TSC ID _____ / _____ / 99
TSC _____ / _____ / 99
Please use the enclosed pre-addressed return envelope to send this completedquestionnaire and any enclosures to:
R
1700 Main StreetP.O. Box 2138
Santa Monica, CA 90407-2138
ATTN: Pat Ebener, M-18

45
Instructions for Completing this Questionnaire
• This questionnaire should be completed by the person directing theCounty’s implementation of CalWORKs or his or her designee.
• There are no right or wrong answers to these questions. Please read thequestions carefully and use your best judgment in selecting responses.If you find that some of the choices printed in the questionnaire do notallow you to describe the experience of your county adequately, pleasefeel free to respond in your own words.
• Please mark response choices clearly.
• Feel free to add comments. Use additional space provided at the end ofthe questionnaire or add pages or other materials, whichever is easier.
• Specific instructions are provided for each question.
• Please return completed questionnaire no later than October 20, 1999 toR ATTN: Pat Ebener, M-18, 1700 Main Street, P.O. Box 2138, Santa
Monica, CA 90407-2138.
• Remember to enter contact information on the front cover and to encloseany supplemental materials.
• If you have any questions, please feel free to contact Pat Ebener, R,
(310) 393-0411, x7905, or via email: [email protected], or Kirsten Becker,R, x6480.

46
1. There are several variations across counties in the structure and organizationof their CalWORKs programs. This question is about how your countyprogram is structured and organized.
STRUCTURE ANDORGANIZATION OF
CalWORKs PROGRAM
In PlaceCounty
Wide
In PlaceIn Partof the
County
ImplementationUnderway At
This Time
UnderConsideration/
Planning AtThis Time
Check Here IfNOT
ConsideredOr
Rejected
(Check One Box on Each Line)
a) Co-located welfaredepartment CalWORKseligibility andemployment staff............... ❑ ❑ ❑ ❑ ❑
b) Combined the jobs ofeligibility andemployment/welfareto work caseworker ........... ❑ ❑ ❑ ❑ ❑
c) Co-located staff fromwelfare and mental healthand/or alcohol and drugagencies in CalWORKsoffices .................................. ❑ ❑ ❑ ❑ ❑
d) Co-located CalWORKsEDD, JTPA/WIA and/orWelfare to Work grantservices ................................ ❑ ❑ ❑ ❑ ❑
e) Use interagency teams toprovide casemanagement....................... ❑ ❑ ❑ ❑ ❑
f) Outsource all ofCalWORKs welfare towork operations................. ❑ ❑ ❑ ❑ ❑
g) Reclassified caseworkerpositions.............................. ❑ ❑ ❑ ❑ ❑
h) Pool funds/share costsacross multiple agencies(not contracts) .................... ❑ ❑ ❑ ❑ ❑
i) Eligibility workersconduct CalWORKsorientation .......................... ❑ ❑ ❑ ❑ ❑
j) Employment/welfare towork staff conductCalWORKs orientation ..... ❑ ❑ ❑ ❑ ❑
k) Other, please specify: ........ ❑ ❑ ❑ ❑ ❑
______________________

47
2. There are also differences in how counties deliver components of theirCalWORKs programs. This question is about whether your welfaredepartment provides these components directly or outsources them and if so,to whom. Check the box on the far right if a component or service is notprovided.
How are these services provided?
PROGRAM COMPONENTS
Directly byCalWORKs
Agency
ThroughWelfareDept.
Contractwith
NonprofitProvider
ThroughWelfare
Dept.Contract
withFor ProfitProvider
Referral/MOUwith
AgenciesFunded to
ProvideService
OR,CheckHere ifService
NotProvided
(Check All That Apply on Each Line)
a) CalWORKs orientation ......................... ❑ ❑ ❑ ❑ ❑
b) Job Club ................................................... ❑ ❑ ❑ ❑ ❑
c) Job assessment ........................................ ❑ ❑ ❑ ❑ ❑
d) Vocational training ................................ ❑ ❑ ❑ ❑ ❑
e) Educational services .............................. ❑ ❑ ❑ ❑ ❑
f) Post employment services .................... ❑ ❑ ❑ ❑ ❑
g) Stage 1 child care administration ........ ❑ ❑ ❑ ❑ ❑
h) Stage 2 child care administration ........ ❑ ❑ ❑ ❑ ❑
I) Stage 3 child care administration ........ ❑ ❑ ❑ ❑ ❑
j) Screening and referral formental health services ........................... ❑ ❑ ❑ ❑ ❑
k) Mental health treatment........................ ❑ ❑ ❑ ❑ ❑
l) Screening and referral forsubstance abuse services ....................... ❑ ❑ ❑ ❑ ❑
m) Substance abuse treatment ................... ❑ ❑ ❑ ❑ ❑
n) Screening and referral fordomestic abuse services ........................ ❑ ❑ ❑ ❑ ❑
o) Domestic abuse services ....................... ❑ ❑ ❑ ❑ ❑
p) Services targeting refugeefamilies .................................................... ❑ ❑ ❑ ❑ ❑
q) Services targeting non–English-speaking families ................................... ❑ ❑ ❑ ❑ ❑
3. Throughout California, stakeholders are anxious to obtain feedback fromcounties on the innovative strategies and successes that have madeCalWORKs implementation possible. Some counties have developedstrategies they believe are particularly successful in supportingimplementation of their CalWORKs programs. Please indicate whetheryour county has found any of its strategies in the following areas to beparticularly successful. Check all that apply and provide a brief descriptionof your strategy or program or attach an already existing description,whichever is easier.

48
❑ a) Communicating CalWORKs program requirements and rules to non–English-speaking applicants and participants
_______________________________________________________________________
❑ b) Linking participants with job training programs ____________________________
_______________________________________________________________________
❑ c) Increasing compliance with required CalWORKs activities (e.g., limiting “noshows”)
_______________________________________________________________________
❑ d) Increasing utilization of subsidized child care ______________________________
_______________________________________________________________________
❑ e) Increasing participation rates among two-parent families ____________________
_______________________________________________________________________
❑ f) Home visits to prevent or remedy sanctions _______________________________
_______________________________________________________________________
❑ g) Implementing a diversion program _______________________________________
_______________________________________________________________________
❑ h) Detecting and prosecuting fraud _________________________________________
_______________________________________________________________________
❑ i) Providing transportation assistance ______________________________________
_______________________________________________________________________
❑ j) Ensuring continuing child care, MediCal and/or Food Stamps for familiesleaving aid ____________________________________________________________
_______________________________________________________________________
❑ k) Implementing sanctions _________________________________________________
_______________________________________________________________________
❑ l) Working with the community (e.g., CBOs, faith based organizations, employersand business groups)
_______________________________________________________________________
❑ m) Coordinating with Welfare to Work grant providers ________________________
_______________________________________________________________________

49
❑ n) Improving computer systems ___________________________________________
______________________________________________________________________
❑ o) Monitoring program performance (e.g., of contractors, County CalWORKsemployees, County’s overall CalWORKs performance)
______________________________________________________________________
❑ p) Identifying needs and providing services for participants with mental health,domestic abuse or substance abuse problems
______________________________________________________________________
❑ q) Promoting economic development _______________________________________
______________________________________________________________________
❑ r) Encouraging use of post employment/job retention services ________________
______________________________________________________________________
❑ s) Other, please specify: __________________________________________________
______________________________________________________________________

50
4. Which five of the program components listed in the box below would youselect as the strongest elements of your CalWORKs program? Enter theletters corresponding to the program components you select.
5. Which five of the program components listed in the box below are you leastsatisfied with, or believe need the most improvement or modification inorder to meet your county’s CalWORKs goals? Enter the letterscorresponding to the program components you select.
PROGRAM COMPONENTS
A. Communicating CalWORKs programrequirements and rules to non–English-speaking applicants andparticipants
B. Linking participants with job trainingprograms
C. Obtaining compliance with requiredCalWORKs activities
D. Utilization of subsidized child care
E. Participation rates among two-parentfamilies
F. Home visits to prevent or remedysanctions
G. Implementing a diversion program
H. Detecting and prosecuting fraus
I. Providing transportation assistance
J. Ensuring continuing child care,MediCal and/or Food Stamps forfamilies leaving aid
K. Implementing sanctions
L. Working with the community
M. Coordinating with Welfare to Workgrant providers
N. Improving computer systems
O. Monitoring program performance
P. Identifying participants with needsfor mental health services
Q. Identifying participants with needsfor domestic abuse services
R. Identifying participants with needsfor substance abuse services
S. Providing services for participantswith mental health problems
T. Providing services for participantswith domestic abuse problems
U. Providing services for participantswith substance abuse problems
V. Promoting economic development
W. Utilization of post employment/jobretention services

51
6. Counties are using a variety of approaches to providing services to addressspecial needs and barriers to work. Please indicate if you have a program toaddress the following needs and how you deliver the program. Check thebox on the right if no services are available for a specific barrier/need.
How are these services provided?
SPECIALNEEDS/BARRIERS
Directly byCalWORKs
Agency
ThroughWelfare Dept.Contract with
NonprofitProvider
ThroughWelfare Dept.Contract with
For ProfitProvider
Referral/MOU withAgenciesFunded toProvideService
OR,Check HereIf Service
NotProvided
(Check All That Apply on Each Line)
a) No high school diploma .. ❑ ❑ ❑ ❑ ❑
b) Limited literacy skills ....... ❑ ❑ ❑ ❑ ❑
c) No work experience ......... ❑ ❑ ❑ ❑ ❑
d) Chronic healthproblem/disability ........... ❑ ❑ ❑ ❑ ❑
e) Language barrier ............... ❑ ❑ ❑ ❑ ❑
f) Legal problems(warrants, convictions)..... ❑ ❑ ❑ ❑ ❑
g) Remote location/lackof transportation ............... ❑ ❑ ❑ ❑ ❑
7. Does your county conduct home visits.....
In All CasesPilot Project or
Subset of CasesNever or
Almost Never
(Check One Box on Each Line)
a) for new applicants before eligibilitydetermination? ............................................................... ❑ ❑ ❑
b) before sanctions are applied? ....................................... ❑ ❑ ❑
c) after a sanction has been applied?............................... ❑ ❑ ❑
d) in other circumstances? Please specify: ..................... ❑ ❑ ❑
______________________

52
8. Successful implementation often depends on adequate capacity in thecommunity to deliver a needed service and on adequate funding to supportthe demand for a service. For example, some have argued that certain typesof child care (e.g., infant care) are in short supply even though funding forchild care demand may be adequate. Please indicate whether your county ishaving and/or anticipates having a shortage of service capacity and/orfunding for each of the following services.
A. CAPACITY SHORTFALL B. FUNDING SHORTFALLNone Current Anticipated None Current Anticipated
(Check One Box on Each Line) (Check One Box on Each Line)
a) Infant child care ....................... ❑ ❑ ❑ ❑ ❑ ❑
b) After school child care............. ❑ ❑ ❑ ❑ ❑ ❑
c) Mildly ill child care.................. ❑ ❑ ❑ ❑ ❑ ❑
d) Off hours/weekendchild care ................................... ❑ ❑ ❑ ❑ ❑ ❑
e) Stage 1 child care...................... ❑ ❑ ❑ ❑ ❑ ❑
f) Stage 2 child care...................... ❑ ❑ ❑ ❑ ❑ ❑
g) Stage 3 child care...................... ❑ ❑ ❑ ❑ ❑ ❑
h) GED/adult basiceducation classes ...................... ❑ ❑ ❑ ❑ ❑ ❑
i) ESL classes ................................ ❑ ❑ ❑ ❑ ❑ ❑
j) Alcohol and drugtreatment ................................... ❑ ❑ ❑ ❑ ❑ ❑
k) Services for victims ofdomestic abuse ......................... ❑ ❑ ❑ ❑ ❑ ❑
l) Mental health services ............. ❑ ❑ ❑ ❑ ❑ ❑
m) Foster care ................................. ❑ ❑ ❑ ❑ ❑ ❑
n) Vocational rehabilitation ........ ❑ ❑ ❑ ❑ ❑ ❑
o) Job/vocational training........... ❑ ❑ ❑ ❑ ❑ ❑
p) Transportation services ........... ❑ ❑ ❑ ❑ ❑ ❑
q) Community service jobs ......... ❑ ❑ ❑ ❑ ❑ ❑

53
9. Counties report difficulties in meeting the two-parent family participationrate. This question is about special barriers and issues that limit participationamong two-parent families in your county. Please note any problems orchallenges that are particularly prevalent or difficult for each group listedbelow.
Special Problems or Issues
(Select Codes From Below)
a) Two-parent refugeefamilies
Other, specify: __________________
________________________________
b) Two-parent immigrantfamilies
Other, specify: __________________
________________________________
c) Two-parent non-refugee,non-immigrant families
Other, specify: __________________
________________________________
PARTICIPATION BARRIERS AND ISSUES
A. No high school diploma/GED
B. Limited literacy skills
C. No work history/experience
D. Mental health problems
E. Substance abuse problems
F. Domestic abuse problems
G. Chronic health problems/disability infamily
H. Children ill or with special needs
I. Language barriers: obtainingemployment
J. Language barriers: understandingand using CalWORKs
K. Socio-cultural barriers
L. Legal problems
M. Remote location
N. Lack of transportation


55
10. Please indicate whether the CalWORKs rules listed below are presentingtemporary or ongoing problems or are not a problem in your country at thistime. Check the box on the far right if you anticipate a future problem.
CalWORKs RULES
Not AProblemAt ThisTime
Startup/Transitional
ProblemOnly
MinorOngoingProblem
MajorOngoingProblem
AND CheckHere If YouAnticipateA FutureProblem
(Check One Box on Each Line)
a) 18/24-month work requirement.......... ❑ ❑ ❑ ❑ ❑
b) Work participation rates forone-parent assistance units .................. ❑ ❑ ❑ ❑ ❑
c) Work participation rates fortwo-parent assistance units .................. ❑ ❑ ❑ ❑ ❑
d) Child support cooperation ................... ❑ ❑ ❑ ❑ ❑
e) School attendance for children inassistance units ....................................... ❑ ❑ ❑ ❑ ❑
f) Immunization ......................................... ❑ ❑ ❑ ❑ ❑
g) Coordination of three stages ofchild care ................................................. ❑ ❑ ❑ ❑ ❑
h) Monitoring participation inapproved work activities ...................... ❑ ❑ ❑ ❑ ❑
i) Due process before sanctioning ........... ❑ ❑ ❑ ❑ ❑
j) Vendor voucher payment system ....... ❑ ❑ ❑ ❑ ❑
k) Child care monthly report(CW115) ................................................... ❑ ❑ ❑ ❑ ❑
l) Monitoring/reporting on countyperformance outcomes.......................... ❑ ❑ ❑ ❑ ❑
m) Self Initiated Plans (SIPs) ...................... ❑ ❑ ❑ ❑ ❑
n) Determining waivers for goodcause ........................................................ ❑ ❑ ❑ ❑ ❑
o) Sanctions ................................................. ❑ ❑ ❑ ❑ ❑
p) Coordination with Welfare to Workgrant providers....................................... ❑ ❑ ❑ ❑ ❑
q) New income/grant structure rules ..... ❑ ❑ ❑ ❑ ❑
r) New property rules ............................... ❑ ❑ ❑ ❑ ❑

56
CalWORKs RULES
Not AProblemAt ThisTime
Startup/Transitional
ProblemOnly
MinorOngoingProblem
MajorOngoingProblem
AND CheckHere If YouAnticipateA FutureProblem
(Check One Box on Each Line)
s) New transfer of assets rules ................. ❑ ❑ ❑ ❑ ❑
t) Implementation of new penalties ....... ❑ ❑ ❑ ❑ ❑
u) Other, please specify ............................. ❑ ❑ ❑ ❑ ❑
______________________
11. What is the period of exemption in your county for participants...
a. when they have a first child afterbeginning to participate in CalWORKs? __________ Months
b. who have a second child whileparticipating in CalWORKs? __________ Months
12. Did your county extend the 18-month CalWORKs time limit for all newapplicants to 24 months?
❑ Yes ❑ No
13. Last year, counties could choose the number of hours that single parent caseswere required to work or participate in approved welfare to work activities.How many hours were required to meet the participation requirement inyour county as of July 1, 1998?
__________ Hours per week
14. How is your county spending (planning to spend) its incentive funds? (Checkall that apply)
❑ Not yet planned/allocated ❑ New staff ❑ New programs, specify:
❑ Capital improvements ❑ Other, specify: _____________________
❑ Reserve ___________________ _____________________
___________________ _____________________
15. During the past 12 months has the caseload increased, decreased or remainedabout the same for:
Increased Decreased
RemainedAbout the
SameDon’tKnow
(Check One)
a) most eligibility caseworkers? ................... ❑ ❑ ❑ ❑
b) most employment/welfareto work caseworkers? ................................ ❑ ❑ ❑ ❑

57
16. Characteristics of county welfare populations, economic environments, andexisting government structures have sometimes been cited as hindering orfacilitating CalWORKs implementation. Please indicate whether, in youropinion, each of the following has hindered, facilitated, or had no effect onimplementation of CalWORKs in your county during the past year.
GreatlyHindered
Slightly/SomewhatHindered
No KnownEffect/TooSoon To
Tell
Slightly/SomewhatFacilitated
GreatlyFacilitated
(Check One Box on Each Line)
a) Supply of entry level jobs ................ ❑ ❑ ❑ ❑ ❑
b) Location of entry level jobs.............. ❑ ❑ ❑ ❑ ❑
c) Supply of “better” jobs ..................... ❑ ❑ ❑ ❑ ❑
d) Seasonality of work .......................... ❑ ❑ ❑ ❑ ❑
e) Local unemployment rate................ ❑ ❑ ❑ ❑ ❑
f) Procuring additional office space ... ❑ ❑ ❑ ❑ ❑
g) County limits on hiring.................... ❑ ❑ ❑ ❑ ❑
h) Supply of low income housing ....... ❑ ❑ ❑ ❑ ❑
i) Public transportation ........................ ❑ ❑ ❑ ❑ ❑
j) Language/cultural barrier .............. ❑ ❑ ❑ ❑ ❑
k) Welfare agency culture .................... ❑ ❑ ❑ ❑ ❑
l) Size and budget of welfareagency ................................................. ❑ ❑ ❑ ❑ ❑
m) Availability of qualified stafffor CalWORKs positions.................. ❑ ❑ ❑ ❑ ❑
n) Welfare agency staff experience ..... ❑ ❑ ❑ ❑ ❑
o) Welfare agency computersystems ............................................... ❑ ❑ ❑ ❑ ❑
p) Welfare agency staff training .......... ❑ ❑ ❑ ❑ ❑
q) Interagency relationships ................ ❑ ❑ ❑ ❑ ❑
r) Contracting for services ................... ❑ ❑ ❑ ❑ ❑
s) Other, please specify ........................ ❑ ❑ ❑ ❑ ❑
______________________________


59
17. Which CalWORKs managers receive regular (at least quarterly) statisticalreports on the following categories of participants?
County LevelSenior
ManagementDistrict
Managers Supervisors
OR,Check Here
If NoStatisticalReporting
(Check One Box on Each Line)
a) Participants enrolled in welfareto work activities ............................... ❑ ❑ ❑ ❑
b) Participants employed ..................... ❑ ❑ ❑ ❑
c) Participants employed 32 hours ..... ❑ ❑ ❑ ❑
d) Participants failing to attendJob Club .............................................. ❑ ❑ ❑ ❑
e) Participants declared exempt .......... ❑ ❑ ❑ ❑
f) Participants sanctioned .................... ❑ ❑ ❑ ❑
g) Participants out of compliancewith work activity participationrequirements ...................................... ❑ ❑ ❑ ❑
h) Diversions .......................................... ❑ ❑ ❑ ❑
i) Participants approaching18/24-month limit ............................ ❑ ❑ ❑ ❑
j) Participants approaching 60-monthtime limit ............................................. ❑ ❑ ❑ ❑
k) Participants meeting TANF workrequirements ...................................... ❑ ❑ ❑ ❑
l) Participants enrolled in Welfare toWork grant program services ......... ❑ ❑ ❑ ❑
m) Participants with SIPs ...................... ❑ ❑ ❑ ❑
n) Participants using subsidizedchild care ............................................ ❑ ❑ ❑ ❑
o) Participants referred to mentalhealth services ................................... ❑ ❑ ❑ ❑
p) Participants utilizing mentalhealth services ................................... ❑ ❑ ❑ ❑

60
County LevelSenior
ManagementDistrict
Managers Supervisors
OR,Check Here
If NoStatisticalReporting
(Check One Box on Each Line)
q) Participants referred to substanceabuse services .................................................... ❑ ❑ ❑ ❑
r) Participants utilizing substance abuseservices ............................................................... ❑ ❑ ❑ ❑
s) Participants referred to domesticviolence services ............................................... ❑ ❑ ❑ ❑
t) Participants utilizing domesticviolence services ............................................... ❑ ❑ ❑ ❑
18. If possible, please include one recent example of each of the reports available to county levelsenior management.
19. During the past 12 months, has your county increased the number of CalWORKs eligibility orwelfare to work caseworkers by either hiring for new positions or filling existing vacancies?(Check one)
❑ Hired for new positions
❑ Filled vacancies
❑ Both
❑ Neither
❑ Don’t know
20. During the past 12 months, has your county increased the number of supervisory and/orCalWORKs management staff either by hiring for new positions or filling existing vacancies?(Check one)
❑ Hired for new positions
❑ Filled vacancies
❑ Both
❑ Neither
❑ Don’t know

61
21. Major organizational changes in local government have accompanied the adoption of welfarereform in some counties. To enable the evaluation to gauge these changes, please provide acopy of the current organizational chart for the agency or agencies charged with the overalladministration of CalWORKs, including TANF and welfare to work programs. If majororganizational changes are anticipated over the next 6 months, please include a copy, ifavailable, of the proposed organization chart for the agency or agencies within whichCalWORKs will be administered.
22. This questionnaire may not have addressed all the CalWORKs implementation issues ofimportance in your county. Please use this space or attach additional pages if you wish to addcomments about your implementation experiences, problems, and successes.
____________________________________________________________________________________
____________________________________________________________________________________
____________________________________________________________________________________
____________________________________________________________________________________
____________________________________________________________________________________
____________________________________________________________________________________
____________________________________________________________________________________
____________________________________________________________________________________
____________________________________________________________________________________
____________________________________________________________________________________
____________________________________________________________________________________
____________________________________________________________________________________
____________________________________________________________________________________
____________________________________________________________________________________
Thank you for taking the time to complete this questionnaire.
Further information on RAND’s statewide CalWORKs evaluation is available online athttp://www.rand.org/CalWORKs. The survey results will be available mid-February 2000.


63
References
Ebener, Patricia A., and Jacob Alex Klerman. Welfare Reform in California: Resultsof the 1998 All-County Implementation Survey. Santa Monica, Calif.: RAND,MR-1052-CDSS, 1999.
Klerman, Jacob, Tammi Chun, Patricia Ebener, Donna Farley, Nicole Humphrey,Elaine Reardon, and Gail Zellman. Welfare Reform in California: State andCounty Implementation of CalWORKs in the Second Year. Santa Monica,Calif.: RAND, MR-1777-CDSS, 2000.
Zellman, Gail, Jacob Klerman, Elaine Reardon, and Paul Steinberg. WelfareReform in California: State and County Implementation of CalWORKs in theSecond Year, Executive Summary. Santa Monica, Calif.: RAND, MR-1777/1-CDSS, 2000.