well clear: general aviation and commercial pilots
TRANSCRIPT

San Jose State UniversitySJSU ScholarWorks
Master's Theses Master's Theses and Graduate Research
2014
Well Clear: General Aviation and CommercialPilots' Perception of Unmanned Aerial Vehicles inthe National Airspace SystemJoseph Taylor OttSan Jose State University
Follow this and additional works at: http://scholarworks.sjsu.edu/etd_theses
This Thesis is brought to you for free and open access by the Master's Theses and Graduate Research at SJSU ScholarWorks. It has been accepted forinclusion in Master's Theses by an authorized administrator of SJSU ScholarWorks. For more information, please contact [email protected].
Recommended CitationOtt, Joseph Taylor, "Well Clear: General Aviation and Commercial Pilots' Perception of Unmanned Aerial Vehicles in the NationalAirspace System" (2014). Master's Theses. Paper 4508.

WELL CLEAR:
GENERAL AVIATION AND COMMERCIAL PILOTS’ PERCEPTION OF UNMANNED
AERIAL VEHICLES IN THE NATIONAL AIRSPACE SYSTEM
A Thesis
Presented to
The Faculty of the Graduate Program in Human Factors/Ergonomics
San José State University
In Partial Fulfillment
of the Requirements for the Degree
Master of Science
by
Joseph T. Ott
December 2014

© 2014
Joseph T. Ott
ALL RIGHTS RESERVED

The Designated Thesis Committee Approves the Thesis Titled
WELL CLEAR:
GENERAL AVIATION AND COMMERCIAL PILOTS’ PERCEPTION OF UNMANNED
AERIAL VEHICLES IN THE NATIONAL AIRSPACE SYSTEM
by
Joseph T. Ott
APPROVED FOR THE GRADUATE PROGRAM IN HUMAN FACTORS/ERGONOMICS
SAN JOSÉ STATE UNIVERSITY
December 2014
Kevin Jordan, Ph.D. Department of Psychology
Sean Laraway, Ph.D. Department of Psychology
R. Jay Shively, M.S. NASA Ames Research Center
ABSTRACT
WELL CLEAR:
GENERAL AVIATION AND COMMERCIAL PILOTS’ PERCEPTION OF UNMANNED
AERIAL VEHICLES IN THE NATIONAL AIRSPACE SYSTEM
The purpose of this research was to determine how different pilot types
perceived the subjective concept of the Well Clear Boundary (WCB) and to
observe if that boundary changed when dealing with manned versus unmanned
aircraft systems (UAS) as well as the effects of other variables. Pilots’
perceptions of the WCB were collected objectively through simulator recordings
and subjectively through questionnaires. Together, these metrics provided
quantitative and qualitative data about pilot WCB perception. The objective
results of this study showed significant differences in WCB perception between
two different pilot types, as well as WCB significant differences when comparing
two different intruder types (manned versus unmanned aircraft). These
differences were dependent on other manipulated variables, including intruder
approach angle, ownship speed, and background traffic levels. Subjectively,
there were evident differences in WCB perception across pilot types; general
aviation (GA) pilots appeared to trust UAS aircraft slightly more than did the more
experienced Airline Transport Pilots (ATPs). Overall, it is concluded that pilots’
mental models of the WCB are more easily perceived as time-based boundaries
in front of ownship, while being more easily perceived as distance-based
boundaries to the rear of ownship.

v
ACKNOWLEDGEMENTS
I want to thank my thesis committee members for guiding me and providing
enduring support throughout this research. A special thank you to the following NASA
AMES Flight Deck Display Research Lab, Unmanned Aerial Systems integration into the
National Airspace System, and Flight Research Associates groups for providing
supportive feedback and allotting me the resources, time, and advice necessary for this
research: Vern Battiste, Walt Johnson, Quang Dao, Conrad Rorie, Lisa Fern, Wayne
Bridges, David Brown, Srba Jovic, Confessor Santiago, Jacob Pfeiffer, and Eric Mueller.
This research would not have been possible without the help you graciously provided.
I would like to deeply thank the professors, both undergraduate and graduate,
who taught and nurtured my human factors background from the beginning: Dr. Jason
Kring, Prof. Beth Blickensderfer, Prof. Eric Vaden, Dr. Sean Doherty, and Dr. Tony
Andre. I would not be an academic without you all, thanks for pushing me to succeed.
Thank you to my little sister Emily Ott, I know you are bound to do great things in
this life, your passion is inspiring and I love you tremendously. Thank you to my
incredible girlfriend Amy Golomb for standing loyally at my side all these years, you have
been my pillar of strength and sanity throughout all of this, I love you.
Above all else, I dedicate this thesis research to my incredibly inspiring parents,
Lisa and Steve Ott. Without your unwavering love, support, gratitude, self-esteem,
financial guidance, moral grounding, and exuberantly nurturing souls I would be nothing.
I genuinely appreciate you being such astounding people to each other, to my friends, to
our pets, and of course, to me. Words simply cannot express the amount of love and
respect I hold deep in my heart for you both. Thank you sincerely, for everything.

vi
TABLE OF CONTENTS
SECTION PAGE
Introduction ........................................................................................................... 1
Next Generation National Airspace System (NextGen NAS) ............................ 1
Unmanned Aerial Systems (UAS) ..................................................................... 1
UAS Technological Challenges ......................................................................... 3
UAS Human Factors Challenges ...................................................................... 6
The Issue at Hand - Well Clear ......................................................................... 8
Similar Terms and Concepts. ......................................................................... 9
Proposed Well Clear Definitions and Values. ............................................... 11
Purpose ........................................................................................................... 17
Safety. .......................................................................................................... 18
Efficiency. ..................................................................................................... 20
Methods .............................................................................................................. 21
Participants ..................................................................................................... 21
Experimental Design ....................................................................................... 22
Apparatus ........................................................................................................ 24
Stimuli ............................................................................................................. 25
Simulator Experimental Environment. .......................................................... 25
Intruder Approach Geometry Levels ............................................................ 27
Distractor Traffic Levels. .............................................................................. 29
Ownship Speed Levels. ............................................................................... 29
Practice Scenarios. ...................................................................................... 30
Experimental Scenarios. .............................................................................. 31
Procedure ........................................................................................................ 32
Measures ........................................................................................................ 33
Objective Metrics. ........................................................................................ 33
Subjective Metrics. ....................................................................................... 34
Analysis ........................................................................................................... 35

vii
Results ............................................................................................................... 36
WCB Maps ...................................................................................................... 36
Objective Metrics Results ................................................................................ 45
Interaction Plots for WCB Distance from Ownship Metrics. ......................... 51
Interaction Plots for WCB Time to Closest Point of Approach Metrics ......... 61
Subjective Metrics Results .............................................................................. 68
Subjective WCB Map Drawings ...................................................................... 73
Discussion .......................................................................................................... 76
The Well Clear Boundary ................................................................................ 76
Future Research Recommendations ............................................................... 88
Conclusion .......................................................................................................... 89
References ......................................................................................................... 97
Appendix A: San Jose State University IRB Approval ...................................... 100
Appendix B: NASA Ames Informed Consent .................................................... 101
Appendix C: Subjective WCB Map Drawings ................................................... 102
Appendix D: Post-Simulation Pilot Questionnaire ............................................. 111

viii
LIST OF TABLES
TABLE PAGE
Table 1: Means and Standard Deviations for dOWN in feet ............................... 46
Table 2: Five-way Mixed ANOVA Results for dOWN in feet (p* = significant) .... 50
Table 3: Means and Standard Deviations for tCPA in seconds .......................... 55
Table 4: Effects of all interactions for tCPA in seconds (p* = significant) ........... 60
Table 5: Subjective Questions about WCB Perception ....................................... 68
Table 6: Subjective Questions about Manned vs. Unmanned Intruders ............. 70
Table 7: Subjective Questions UAS Specific ...................................................... 71
Table 8: Subjective Questions about CDTI/CSD Technology ............................. 72
Table 9: Subjective Question about WCB Opinion of other Pilot Type ............... 72
Table 10: WCB Drawing Shape Summary ......................................................... 75
ix
LIST OF FIGURES
FIGURE PAGE
Figure 1. Proposed WCB Definition - CPA and tCPA ......................................... 12
Figure 2. Proposed WCB Definition - Tau and Modified Tau .............................. 13
Figure 3. Proposed WCB Definition - Ellipsoid defined by Tau with Tapered
Vertical Separation (Cook & Davis, 2013) .......................................................... 14
Figure 4. Proposed WCB Definition - Conditional Probability of NMAC (Weibel,
Edwards, & Fernandes, June, 2011) .................................................................. 15
Figure 5: Cockpit Situational Display in simple 2D mode (Alerts Disabled) ........ 27
Figure 6: Intruder approach angles depicted on CSD ......................................... 28
Figure 7. WCB by Direction ................................................................................ 37
Figure 8. dOWN of WCB by Pilot Type ............................................................... 38
Figure 9. tCPA of WCB by Pilot Type ................................................................. 38
Figure 10. dOWN of WCB by Ownship Speed ................................................... 40
Figure 11. tCPA of WCB by Ownship Speed ...................................................... 40
Figure 12. dOWN WCB by Intruder Type ........................................................... 42
Figure 13. tCPA of WCB by Intruder Type .......................................................... 42
Figure 14. dOWN of WCB by Traffic Level ......................................................... 44
Figure 15. tCPA of WCB by Traffic Level ........................................................... 44
Figure 16a. Means of WCB by Ownship Speed between Intruder Types for ATPs
........................................................................................................................... 51
Figure 16b. Means of WCB by Ownship Speed between Intruder Types for GA Pilots …………………………………………………………………………………... 52 Figure 17. Means of WCB by Intruder Approach Angle for all Pilots …………... 53 Figure 18a. Mean Time to CPA by Intruder Approach Angle between Ownship Speeds for ATPs interacting with Manned Intruders …………………………...... 62 Figure 18b. Mean Time to CPA by Intruder Approach Angle between Ownship Speeds for GA Pilots interacting with Manned Intruders ………………………... 62 Figure 18c. Mean Time to CPA by Intruder Approach Angle between Ownship Speeds for ATPs interacting with UAS Intruders ………………………………… 64 Figure 18d. Mean Time to CPA by Intruder Approach Angle between Ownship Speeds for GA Pilots interacting with UAS Intruders ……………………………. 64 Figure 19a. Time to CPA for Intruder Types based on Ownship Speed in Low Traffic Level …………………………………………………………………………... 66 Figure 19b. Time to CPA for Intruder Types based on Ownship Speed in Medium Traffic Level …………………………………………………………………………... 66 Figure 20. Time to CPA by intruder Approach Angle between Ownship Speeds67 Figure 21. WCB drawing example – greater distance in front with less in rear . 74 Figure 22. WCB drawing example – circular …………………………………….. 74 Figure 23. WCB drawing example – other ………………………………………... 75 Figure 24. Pilot WCB Perception – Time in Front and by Distance to Rear …... 92

x
LIST OF ABBREVIATIONS
ANOVA = Analysis of Variance
ATC = Air Traffic Control
ATP = Airline Transport Pilot
CDTI = Cockpit Display of Traffic Information
CPA = Closest Point of Approach
CSD = Cockpit Situational Display
dOWN = Distance from Ownship
EMI = Electromagnetic Interference
FAA = Federal Aviation Administration
FARs = Federal Aviation Regulations
FDDRL = Flight Deck Display Research Lab
GA = General Aviation
GCS = Ground Control Station
IFR = Instrument Flight Rules
Kts = Knots
LOS = Loss of Signal
MACS = Multi-Aircraft Control Simulator
MIT = Massachusetts Institute of Technology
NAS = National Airspace System
NASA = National Aeronautics and Space Administration
NextGen = Next Generation Airspace System
NMAC = Near Mid-Air Collision
nmi = Nautical Miles
OTW = Out-the-Window
RTCA = Radio Technical Commission for Aeronautics
SAA = Sense and Avoid
SC 228 = RTCA Special Committee 228
SJSURF = San José State University Research Foundation
TCAS = Traffic Collision Avoidance System
tCPA = Time to Closest Point of Approach
UA = Unmanned Aircraft
UAS = Unmanned Aerial System
UAV = Unmanned Aerial Vehicle
US = United States
VFR = Visual Flight Rules
WCB = Well Clear Boundary

1
Introduction
Next Generation National Airspace System (NextGen NAS)
Our NAS is currently undergoing a major transition, as it is upgraded to
the NextGen environment. Systems are moving away from traditional ground
radar-based air traffic control to satellite-based systems and data connections for
air traffic management. This vital upgrade is imperative to our NAS’s future,
which will face challenges of higher air traffic levels, more congested airports,
and the need for precise timing and coordination to avoid a “gridlock” scenario in
the skies (FAA, 2013). The NextGen NAS will allow a higher number of aircraft to
fly closer together on more direct flight routes with the goal of reducing delays
and providing unprecedented benefits for the environment and the economy
through reducing carbon emissions and fuel consumption. It will ensure that our
nation’s skies have room for continued growth, increased safety, and reduced
environmental impact (FAA, 2013).
Unmanned Aerial Systems (UAS)
Unmanned aerial systems (UAS) consist of an unmanned aircraft (UA)
and all of the supporting equipment, control stations, data links, telemetry,
communication links, and navigation equipment that work together to allow the
UA to operate safely. The UA is piloted by humans working in a ground-control
station, and other UAs can be controlled autonomously via on-board computers
or communication links (FAA, 2013). UAS are entering a pivotal stage in their

2
technological advancement with the corresponding need to become integrated
into civilian operations. Many UAS aircraft originally designed for use in combat
are now in high demand for use in the current NAS for a multitude of civilian
and/or less traditional military roles. The potential that such UAS technology
holds, if safely integrated into the NAS, is tremendous and its use can be highly
beneficial to many sectors of society. For example, some of the currently
proposed civil and commercial applications of UAS include: security awareness,
disaster response, rescue team search and support, communications and
broadcast, cargo transport, surface spectral and thermal analysis, vital
infrastructure monitoring, commercial photography, aerial mapping and charting,
and aerial advertising (FAA, 2014).
With their wide range of uses, the safe and proper integration of UAS into
civilian airspace given current FARs remains largely a work in progress. Current
ambitions and research initiatives issued to the FAA by the Congressional FAA
Modernization and Reform Act of 2012 aim to have all regulations for UAS
integration into the NAS in place by 2015. Section 322 of the House Bill,
“…requires the Secretary of Transportation to develop a plan, in consultation with
aviation and Unmanned Aircraft Systems (UAS) industry representatives, within
nine months of enactment, for the safe integration of civil UASs into the National
Airspace (NAS). This plan must contain a review of technologies and research to
assist in this goal, recommendations for rulemaking on the definition of
acceptable standards, ensure civil UASs have sense and avoid capability,

3
develop standards and requirements for operators and pilots of UASs, and
recommendations for all aspects of UAS integration. The plan must include a
realistic time frame for UAS integration into the NAS, but no later than September
30, 2015” (U.S. House of Representatives, 2012).
UAS Technological Challenges
Although the FAA is pushing the future development of our NAS to include
UASs, large challenges are still quite evident in our efforts to safely integrate
UASs into our airspace. Perhaps due to the technological complexity of drones
and their operators, very little media attention has examined the actual feasibility
of pervasive domestic drone development. The important question to ask is
whether it is even possible to have thousands of unmanned aircraft operating in
our domestic airspace, which is already crowded with civilian and commercial air
traffic. Exploring this feasibility further, it is important to note vulnerabilities UASs
may have in their inherent architecture. In order to be controlled from a remote
location, UASs must communicate with pilots on the ground through a data link.
This link is, as are all wireless communications, vulnerable to electromagnetic
interference (EMI). One of the major issues surrounding the viability of UAS
integration is what happens when a link is lost between a UAS ground control
station (GCS) and its unmanned aircraft? Sometimes the link can be
reestablished quickly, but there remain many instances in which reconnection
attempts have failed and have led to unintended consequences (Public
Intelligence, 2012). This issue of lost-link events is considered “a major concern

4
and failure of communications due to EMI has resulted in numerous UAS
accidents” (p. 78) according to a 2010 U.S. Army Command and General Staff
College Report (Major Yochim, 2010).
As recently as 2011, an unmanned drone collision with a manned aircraft
occurred in Afghanistan between a RQ-7 Shadow UAV and an Air Force Special
Operations Command C-130. Luckily, no one was hurt or injured, but the collision
completely obliterated the UAV and caused major ruptures to the wing fuel tank
and the wing box of the C-130 (Reed, 2011). Had it not been for the sheer
difference in size between the small UAV (wingspan: 20’4”, weight: 450lbs) and
the C-130 (wingspan: 130’, weight: 83,000+ lbs.) the outcome could have been
catastrophic. It is important to note that the RQ-7 is a relatively small UAV
compared to most other long distance UAVs; many of the military drones being
proposed for use in the NAS are closer in size to manned size aircraft. Aside
from this incident, over 100 other incidents or accidents involving UASs have
been experienced globally, and this figure continues to rise (Drone Wars UK,
2013). The majority of these UASs were US Military and/or US manufactured,
and most incidents and accidents resulted from mechanical failure or loss of
signal events. Such occurrences set the stage for a great debate on the safety of
drone use in domestic airspace and raise important questions about the
feasibility of successful UAS integration into the NAS.
Another major challenge facing UAS integration is their unavoidable
interaction with the most numerous pilot type in our NAS, General Aviation (GA)

5
pilots. GA is entirely comprised of civil aviation operations, as opposed to
scheduled air services and non-scheduled air transport operations. GA flights
include everything from single engine trainer aircraft to small corporate jets. As of
March 2011, the number of GA certificated pilots in the US was 339,127, more
than any other pilot type out of the total US pilot population of 627,588. Of those
GA pilots, 119,119 of them were student pilots who were learning to fly and had
very little experience (Aircraft Owners and Pilots Association, 2011). The
integration of UAS into the NAS poses a great threat to GA pilots, particularly to
the student pilots still learning how to fly. This is due to the current approach for
preventing mid-air collisions, which is largely based on a see-and-avoid strategy
in the GA domain.
The currently implemented tiers of collision protection include radar, which
has been in place for decades. Radar essentially provides a bird’s-eye-view of
surrounding airspace that allows for conflicts to been seen and predicted before
they occur, allowing pilots to take collision avoidance action if necessary. Aside
from radar, there are also mandated separation minimums, such as the 1,000ft
vertical separation for IFR en route traffic that was created so even if one cannot
see a potential threat, the buffer of space in-between aircraft will help prevent
collisions (granted the aircraft involved are following FAA regulations). Finally,
there is also aircraft mounted collision avoidance equipment such as the Traffic
Collision Avoidance System (TCAS II) that provides traffic or resolution
advisories that command pilots to maneuver out of the predicted path of other

6
TCAS II enabled aircraft. The problem is, TCAS II is expensive and not installed
on most GA aircraft, especially not on student aircraft. Also, radar is only
effective if humans are cognitively aware of how to use it and what to do when a
conflict is detected (Goyer, 2012). The result is that see-and-avoid strategies are
still very much in effect for proper collision avoidance, and it is very difficult to
translate this type of strategy to an automated system in the event of a link-loss.
Aside from all of these technological challenges that face the integration of UASs
into the NAS, challenges are compounded by another complex but highly
imperative factor, the Human Factor.
UAS Human Factors Challenges
Human Factors has a, “broad remit, covering all manner of analysis from
human interaction with devices, to the design of tools and machines… and
various other general aspects of work and organizational design” (Stanton,
Salmon, Walker, Baber, & Jenkins, 2005). With regard to aviation, and
particularly with the control of UASs, many human factors issues can arise. Most
UASs involve a ground control station (GCS) with an operator, or UAS pilot,
interacting with displays presenting different flight parameters and current
conditions of the UAS. One of the big challenges is successfully controlling UASs
remotely, which includes tasks such as mapping, camera view management, and
multiple vehicle operations and interfaces. Humans can certainly navigate
through natural environments with ease, and this is mainly due to the
sophisticated capabilities of our perceptual mechanisms such as our visual,

7
cognitive, and motor processes. While controlling remote vehicles through
unfamiliar/unnatural environments, restrictions of available visual information,
and limitations in perceptual modality, as well as constraints of physiological
motor movement all result in extreme discontinuities experienced by operators in
terms of their perception and comprehension of remote spatial information. The
perceptual issues in controlling UAS through limited GCS displays are so widely
accepted in the aviation and human factors community that GCS displays have
been dubbed “soda straw” displays because they limit the operator’s view of the
world severely, congruent to navigating only being able to look though a soda
straw. Additionally, research has shown that there are a great deal of individual
differences in the processing of spatial information , use of wide angle camera
views, as well as specific impacts associated with multiple vehicles (Cooke,
2006). This presents a tremendous challenge to the proper design of UAS GCSs.
At present, the general methodology for developing and incorporating
UAS technologies into the NAS involves taking current regulations regarding vital
flight rules and parameters for current manned aircraft, such as safe operating
distances (i.e. separation assurance), up-to-date regulatory requirements, and
even emergency procedures, then engineering proper algorithms and intelligence
logic for unmanned technologies to encompass the aforementioned parameters.
From a human factors perspective, once it is understood how this process of
translating current regulation of manned aircraft to unmanned systems works, the
proper framework for UAS development can be designed to abide by the above

8
mentioned parameters both manually through the UAS pilot’s GCS, and
autonomously in the event of a loss of signal (LOS). In this methodology, there
remain many challenges to be overcome in order to successfully transfer what
has been up to this point mostly human generated skill, judgment, and
knowledge in manned aircraft over to the UAS platforms. One particularly
challenging area of this manned to unmanned conversion is the concept of “Well
Clear”.
The Issue at Hand - Well Clear
The term “Well Clear” originated as a phrase used in Air Traffic Control
(ATC) environment when interacting with manned aircraft over the radio
communications. Typically, a controller will issue an alert to pilots over the radio
that nearby traffic has the possibility of breaching legal separation, or may come
close to doing so. After notifying pilots of such possible incursions, ATC will then
ask them to report once they are “Clear” (i.e., “Well Clear”) from the aircraft that
posed a collision concern. There are currently no regulated time- or distance-
based standards regarding what it means for two aircraft to be ‘well clear’.” (Lee,
Park, Johnson, & Mueller, 2013, p. 1). Due to the highly dynamic and ever-
changing flight environment of the NAS, pilots are left on their own to determine
when and where they feel this “Well Clear” boundary exists, and they must rely
on their own skills and senses in reporting once they believe a collision is no
longer possible with the intruding aircraft indicated by ATC. Because there is a
lack of an objective definition for “Well Clear”, otherwise referred to as the “Well

9
Clear Boundary” (WCB), and because there is wide variability in human
perception across pilots (Cooke, 2006), it is highly likely that different pilots have
different opinions of what the well clear boundary is since it is currently entirely
subjective in meaning. Additionally, there are also several similar, yet different
conceptions to the WCB that pilots may use in determining the term’s definition.
Similar Terms and Concepts. Since no regulation for the definition of
the WCB exists, it is conceivable that pilots may use alternate similar, however
different concepts to help form their mental model of the WCB. Such similar
concepts include Lateral Separation Minima, Self-Visual Separation Procedures,
and Collision Avoidance Procedures. Lateral Separation Minima are federal
regulations in the Federal Aviation Regulations (FARs) governing the horizontal
distance planes are required to maintain from each other. The FARs for
Instrument Federal Regulations (IFRs), are rules pilots must follow under
meteorological conditions that result in poor visibility and necessitate flight
navigation primarily by flight instruments. They require a 3 mile horizontal and
1,000 feet vertical separation. FARs for Visual Flight Regulations (VFRs), the
rules for pilots flying in visibly clear meteorological flying conditions, state that
between VFR and IFR, as well as between VFR and other VFR aircraft must
separate themselves based on traffic advisories and safety alerts (issued by
ATC over the radios). In en route airspace, these safety alerts are normally given
when aircraft fly within 3-5 miles of each other, depending on their trajectories
and speeds (FAA, 2014). This is different from Well Clear because it enforces

10
measurable distances to maintain for IFR aircraft, and heavily depends on ATC
for VFR aircraft.
Self-Visual Separation Procedures, otherwise known as See and Avoid,
more typically occur in terminal airspace. These procedures are used when ATC
instructs a pilot to follow another aircraft in an arrival sequence once the pilot
confirms that the leading aircraft is in sight. Then, they require the pilot to
maintain vigilance in constant visual surveillance of the leading aircraft and not
pass it until it is no longer a factor. This form of pilot self-spacing relies solely on
out-the-window (OTW) sightings and is therefore limited to use in good visibility
conditions. Self-Visual Separation can also incorporate right-of-way compliant
maneuvers as well. Self-Visual Separation is different from Well Clear as it is
purely based on visual contact after confirmed ATC separation has occurred
(FAA, 2005).
Additionally, there are Collision Avoidance Procedures all pilots must
follow. These include adhering to all clearances and regulations in the FARs as
well as various sources of information attempting to advise pilots on proper
avoidance procedures. These sources include FAR 91.113 (b), “Regardless of …
IFR or VFR … all pilots will observe “See and Avoid” procedures. There is also
an Advisory Circular that has not been updated since the early 1980’s, AC 90-
48C entitled “Pilots role in collision avoidance” (FAA, 1983) that outlines various
effective visual clearing and scanning procedures for see and avoid. These
scanning techniques are further described in the Airman’s Information Manual

11
(AIM) section 4-4-13(d), and the helpful FAA Library article entitled, “How to
Avoid a Mid Air Collision - P-8740-51.” (FAA, n.d.) Additionally, more recent
flight safety programs and commercial flight operations have used Traffic
Collision Avoidance Systems (TCAS) and/or a Cockpit Display of Traffic
Information (CDTI) to help pilots avoid collision. These Collision Avoidance
Procedures are different from Well Clear since they are defined in a number of
different locations spanning different time periods and they use different forms of
collision avoidance assurance.
Proposed Well Clear Definitions and Values. At the time the current
thesis began, there were no accepted time or distance-based standards for the
definition of the WCB or what it means for an aircraft to remain “well clear.”
During the final phases of the present research, a special committee for aviation
standards organization, the Radio Technical Commission for Aeronautics (RTCA
SC 228), has since settled on an accepted definition which is explained at the
end of this section. Before this agreement for the WCB definition was reached,
there were several debated methods of measuring safe separation thresholds to
apply to UAS automated separation standards. These proposed WCB definitions
are described in-depth in the closely related research articles entitled,
“Investigating the Effects of “Well Clear” Definitions on UAS Sense-And-Avoid
Operations” (Lee, Park, Johnson, & Mueller, 2013), “Establishing a Risk-Based
Separation Standard for Unmanned Aircraft Self Separation” (Weibel, Edwards,
& Fernandes, June, 2011), and in SC 228’s consideration material (Cook &

12
Davis, 2013). These sources include three suggested definitions to close the
WCB knowledge gap.
The first considers distance to closest point of approach (CPA) between
two aircraft, combined with time to CPA in order to calculate a CPA boundary. As
can be seen in the figure below there is a declaration time assigned to intruding
aircraft and a time to CPA (tCPA) boundary is generated in the shape of an
ellipsoid whose broad side is parallel with ownship trajectory, which equates to a
tCPA boundary. This is depicted in Figure 1 below:
The second proposed definition is a computational method defined by a
distance value known as Tau + Distance modification + Horizontal Miss Distance.
Here, two types of Tau Range, Tau (𝜏range) and Vertical Tau (𝜏vert), are combined
to give a value. Range Tau is calculated as a ratio of range between aircraft (𝑟),
to their range rate (ṙ) which is expressed in seconds:
𝜏range = −𝑟
ṙ
Figure 1. Proposed WCB Definition - CPA and tCPA (Cook & Davis, 2013). Reprinted with permission.

13
Range Tau’s counterpart, Vertical Tau, is calculated as the ratio of altitude
separation (∆ℎ), to the vertical closure rate (ḣ) and is also expressed in seconds:
𝜏vert= −∆ℎ
ḣ
When combined, these Tau values amount to a positive numerical value when
intruders converge with a UAS, and a negative value upon their divergence,
representing an approximation of time to CPA or tCPA. However, this equation
only works in the case of a direct collision course with a straight line of
intersection. This Tau concept can be visualized below in Figure 2:
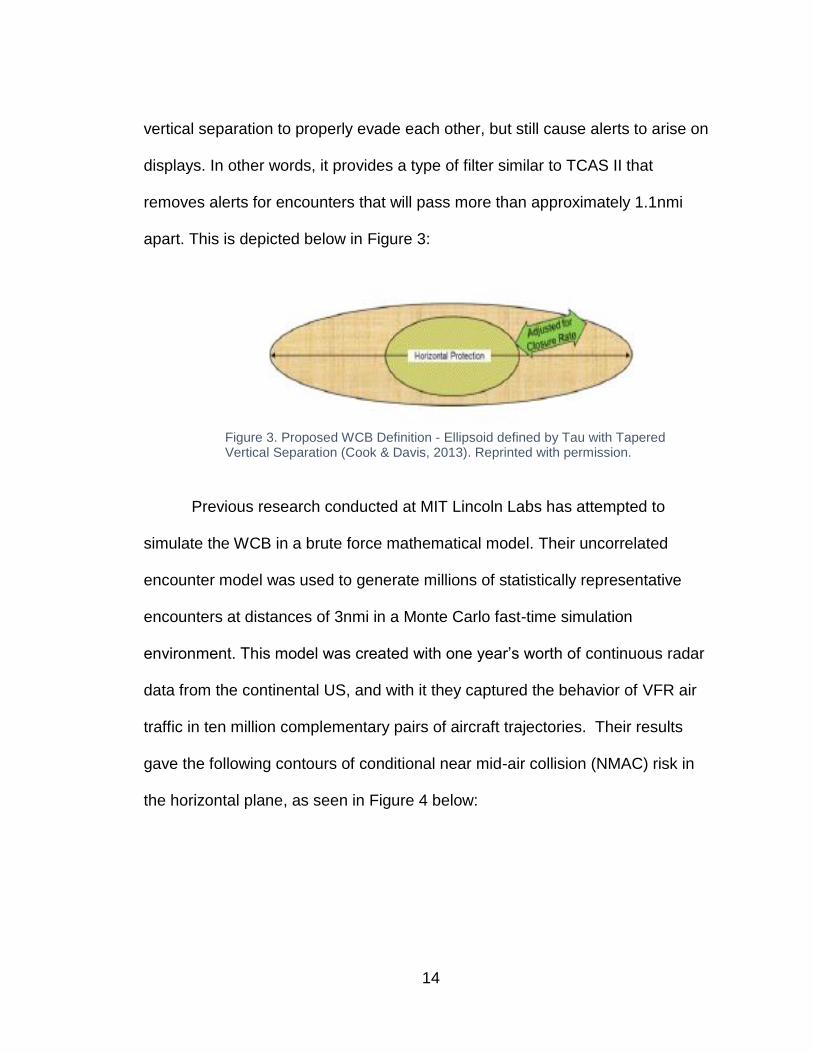
The third proposed definition is referred to as the “Ellipsoid defined by Tau
with tapered vertical separation.” Whereas the previous two definitions can cause
issues when two aircraft are encountering each other very quickly (due to alerts
being generated far beyond the range of required action by the pilot as a result of
the nature of their equations), this ellipsoid uses a tapered vertical separation to
avoid “nuisance” alerts resulting from intercepting aircraft that may have enough
Figure 2. Proposed WCB Definition - Tau and Modified Tau (Cook & Davis, 2013). Reprinted with permission.
14
vertical separation to properly evade each other, but still cause alerts to arise on
displays. In other words, it provides a type of filter similar to TCAS II that
removes alerts for encounters that will pass more than approximately 1.1nmi
apart. This is depicted below in Figure 3:
Previous research conducted at MIT Lincoln Labs has attempted to
simulate the WCB in a brute force mathematical model. Their uncorrelated
encounter model was used to generate millions of statistically representative
encounters at distances of 3nmi in a Monte Carlo fast-time simulation
environment. This model was created with one year’s worth of continuous radar
data from the continental US, and with it they captured the behavior of VFR air
traffic in ten million complementary pairs of aircraft trajectories. Their results
gave the following contours of conditional near mid-air collision (NMAC) risk in
the horizontal plane, as seen in Figure 4 below:
Figure 3. Proposed WCB Definition - Ellipsoid defined by Tau with Tapered Vertical Separation (Cook & Davis, 2013). Reprinted with permission.

15
Here, each contour indicates the conditional probability of NMAC, and
NMAC risk contours of 1, 0.5, 0.2, 0.1, and 0.05 are shown (Note - there is a
probability of 1 that an aircraft is an NMAC within the 500 ft. horizontal boundary
defining an NMAC and risk decreases as range from the aircraft increases).
Clearly, the asymmetric collision risk contours for likelihoods below 0.5 suggest
that conflicts that occur less frequently are dominated by traffic approaching
head-on. This can be observed as the NMAC contours widen and spread out
much further from ownship towards the front of the aircraft, i.e. head-on as their
probability decreases to 0.05. There are also very few overtaking conflicts
Figure 4. Proposed WCB Definition - Conditional Probability of NMAC (Weibel, Edwards, & Fernandes, June, 2011). Reprinted with permission.
Nort
h (
ft)

16
evident in their simulation analysis. This research suggests the WCB is generally
represented by the results of their simulation, and the WCB should be defined
according to their contours (Weibel, Edwards, & Fernandes, June, 2011). This
MIT Lincoln Labs WCB explanation was eventually voted upon by SC 228 to
become the current accepted definition for WCB. However, their “simulation
encounter models were built from radar-surveyed performance of existing aircraft
under the current structure of the NAS” (Weibel, Edwards, & Fernandes, June,
2011), ignoring concepts of future NAS structure and also only consider manned
aircraft encounters with other manned aircraft.
Taking these proposed definitions in mind, several recent FAA sponsored
workshops have provided the following description of Well Clear; “Well Clear is
the state of being able to maintain a safe distance from other aircraft so as not to
cause the initiation of a collision avoidance maneuver” (Lee, Park, Johnson, &
Mueller, 2013). This definition is a step closer to the goal of providing a discrete
value to what the WCB is and how to measure it. However, this definition can
still be extremely subjective in any practical sense. It is likely that pilot perception
of WCB is different across pilot types due to various skill levels. It is also possible
that pilot perception of the WCB with regards to a manned aircraft is different
than their perception of WCB from an unmanned vehicle due to various
parameters such as size and speed differences, as well as trust in automation
and/or new technology that has not met to test of time. The current research
aimed to uncover these differences, if any, and also to determine if UAS aircraft

17
are perceived and/or trusted at different levels than manned aircraft. If there is
indeed a difference in the perceived WCB between manned and unmanned
vehicles, then this difference will likely be intensely measured and researched in
order to be integrated in future UAS transition into the NAS.
Purpose
The purpose of this experiment was to explore and measure perceptions
of “Well Clear” boundaries for both General Aviation and Commercial pilots, and
to investigate any differences in these perceived boundaries between manned
and unmanned vehicles operating in the NAS. As mentioned, a recent FAA
sponsored Sense and Avoid (SAA) Workshop defined well clear as “The state of
being able to maintain a safe distance from other aircraft so as not to cause the
initiation of a collision avoidance maneuver.” (Lee, Park, Johnson, & Mueller,
2013). Aside from this ambiguous definition, it is also unknown whether there are
differences in the perception of well clear boundaries between different pilot
types, or between manned and unmanned intruders (aircraft on intercept course
with a pilot’s ownship). Additionally, it is presently unknown what elements of the
flight environment may have influence on one’s perception of the WCB. The
future goal of successfully integrating UAS into the NAS will require an absolute
definition of well clear in order to safely develop SAA algorithms intelligent
enough to maintain safe operating distances from other aircraft in a manner that
makes current manned aircraft feel safe. The current study attempted to provide
insight into this absolute definition by measuring and creating a model of the

18
perceived WCB aggregated from participants’ performance, all captured
quantitatively from a part task simulator environment as well as qualitatively
through extensive subjective feedback. With many forms of UASs proposed to
operate in all domains of the current NAS, it is vital that any differences in WCB
perception between pilot populations and between manned versus unmanned
aircraft be determined early in the developmental process in order to design
systems as safely as possible.
Safety. Safety is the FAA’s top priority, as the FAA currently governs the
world’s safest aviation system. When faced with the task of safely introducing
UASs into the NAS, they openly admit it is quite a challenging issue. They claim
that, “Safe integration of UAS involves gaining a better understanding of
operational issues, such as training requirements, operational specifications and
technology considerations.” (FAA, 2014). In addition to the UAS technological
challenges mentioned in previous background sections of this research, The
Washington Post launched an investigation into drone crash accidents. They
discovered that the number of drone accidents is disproportionately high relative
to manned aircraft. Since 2001, drones have been involved in more than 400
major accidents around the world. Their investigative documents describe a
multitude of costly mistakes by remote-control pilots, not only in combat zones
overseas, but also in the United States during test and training flights gone wrong
(The Washington Post, 2014).

19
The Washington Post claims, “In April [2014], a 375-pound Army drone
crashed next to an elementary-school playground in Pennsylvania, just a few
minutes after students went home for the day. In Upstate New York, the Air
Force still cannot find a Reaper that has been missing since November, when it
plunged into Lake Ontario. In June 2012, a Navy RQ-4 surveillance drone with a
wingspan as wide as a Boeing 757′s nose-dived into Maryland’s Eastern Shore,
igniting a wildfire.” According to their investigation, the above crashes resulted
from issues such as pilot error, mechanical defects, unreliable communication
links; one of the biggest concerns was the limited ability to detect and avoid
trouble. “Cameras and high-tech sensors on a drone cannot fully replace a pilot’s
eyes and ears and nose in the cockpit. Most remotely controlled planes are not
equipped with radar or anti-collision systems designed to prevent midair
disasters” (The Washington Post, 2014).
The present research aimed to help gain higher understanding currently
needed by the FAA to provide safer integration of UASs into our airspace. By
collecting empirical data, it is the goal of this research to help better develop
more intelligent UAS systems that will bring new sensing algorithms and
successful avoidance techniques from other aircraft through understanding how
humans perceive and treat them in the skies. By uncovering information of pilot
perceptions concerning how close they will comfortably operate to UASs in
current airspace and conveying that information to engineers, the goal is to help

20
design efficient sense-and-avoid technologies to keep manned aircraft safe from
UASs in the NAS.
Efficiency. Aside from safety, the FAA also prides itself on creating and
maintaining the most efficient aerospace system in the world. As mentioned, the
projected increase in aviation traffic and the integration of new UAS technology
into the NAS will create a strong need for extremely efficient airspace spacing
and operating procedures. Along with the upgrade to NextGen systems, UASs
need to follow the same course of efficiency in order to properly mesh with our
new aviation environment. Due to the very nature of UAS and their intelligent
flight software, they have the potential to fly more efficiently than humans in
terms of fuel consumption and direct flight paths, and are not subject to the same
limitations humans experience in terms of g-forces, fatigue, and risk of human
life. This research will assist in determining how to incorporate the flight paths of
UASs into the NAS efficiently by measuring perceived safe operating distances
by manned pilots, while maintaining efficient flight parameters throughout all UAS
operations by planning accordingly based off this safe operating distance.

21
Methods
Participants
A total of 34 participants between the ages of 21 and 69 with a mean age
of 41 were recruited through the San José State University Research
Foundation’s (SJSURF) Test Subject Recruitment Office at the NASA
Ames Research Center. The participants consisted of 3 females and 31 males.
Collectively, the pilots had a total of 173,405 flight hours, with a total of 78,325 of
those hours spent in glass cockpits (cockpits with screen displays instead of
purely gauges to present avionics information). This led to an average of 5,100
total flight hours, with an average of 2,373 of those hours being in glass cockpits
per pilot. In terms of years of experience flying, this study averaged 20 years of
flight across each pilot.
Participants were required to be licensed pilots. The experimental design
for this study is explained in the following section. Because examining
differences between pilot types involved a direct comparison, an equal number of
General Aviation (GA) and Commercial/ATP (Airline Transport Pilot) pilots was
selected, with 17 of each type of pilot. The Commercial/ATP pilots averaged 48
years of age with 28 years of flying experience. They also averaged 9,627 flight
hours, averaging 4,533 in glass cockpits. The GA pilots had a mean age of 34,
averaging 13 years of flying experience. They averaged 573 flight hours, with a
mean of 79 hours in glass cockpits.

22
Aside from having a valid FAA Pilots License for their particular pilot group
(more experienced ATP and less experienced GA pilots), no other experience
requirements were necessary. Participants with both regular and corrected
vision (glasses or contact lenses) were recruited, as long as their vision was
concordant with current FARs regarding vision proficiency. All participants were
compensated for their efforts.
Experimental Design
The current study used a mixed design; there were several within-subject
variables with pilot type as a between-subjects variable. In order to assess
differences in WCB perception across the two different pilot types, a five-factor
mixed design was implemented. The between-subjects variable of pilot type was
the comparison of highest interest in the current study, as it sheds light on
potential differences in WCB between pilots of different experience levels.
Interest in the comparison of pilot type was closely followed by the interest in
comparison of intruder type, which varied between manned and unmanned
aircraft throughout the experimental scenarios. This variable allowed us to
observe any differences arising from manned pilots interacting with other
manned versus unmanned aircraft, an important factor in designing the future
parameters of our airspace and successfully integrating UASs into the NAS.
To determine what affects the WCB perception for pilots in the NAS, four
independent variables were compared across both pilot groups. These repeated
measures factors were; intruder type (2 levels), intruder aircraft approach

23
geometry (8 levels), background distractor traffic (2 levels: high and low), and
ownship speed (2 levels). As previously mentioned, the between groups variable
of pilot type was used in this mixed design, which had two levels as well. The
two levels of intruder aircraft type were used to uncover if pilots had differences
in their opinion of the well clear boundary when interacting with manned vs.
unmanned intruding aircraft in the NAS. Approach geometries were designed to
be from 8 different directions surrounding ownship to examine the WCB from
different approach angles. The study by Weibel et al. (2011) cited earlier
suggests an important role for approach geometry in the definition of WCB. The
final two independent variables of background traffic level and ownship speed.
Each had two levels and was used to see if those parameters of the flight
environment affected the perception of the WCB. Altogether, this yielded an
8x2x2x2x2 design. In order to control for any order and/or learning effects
resulting from the factorial combination of the four within-subjects variables,
presentation of all combinations were randomized for all participants. These
independent variables are discussed in the section below entitled “Stimuli”.
Due to the constraints of limited pilot availability and research resources,
the researcher was unable to provide a participant pool large enough to likely
yield significant results in the comparison of pilot type. Proper statistical
significance would not likely be present without a pilot sample population size of
at approximately 240+ participants (as determined through statistical software)
and simply was not feasible in this research setting. Therefore, it must be noted
24
that all findings for the between-groups variable of pilot types may suffer from a
low statistical power. However, this research highlights general findings for a
decent sample size that can be used as future research framework, and sheds
important light on the unknown subjective and objective pilot definition of WCB.
Apparatus
The testing took place in the Flight Deck Display Research Lab (FDDRL)
at NASA Ames Research Center located in Moffett Field, California. The FDDRL-
developed Cockpit Situational Display (CSD) was used as the primary display for
this research. The CSD was designed for FDDRL’s advanced Cockpit Display of
Traffic Information (CDTI) experimental needs, and is configurable to display
simple and advanced interfaces. For this research, the CSD was configured in a
simple, 2D top down view mode with conflict detection, flight path predictors,
weather mapping, and route re-planning disabled to create a bare bones display
similar to present day traffic collision avoidance systems (TCAS). The CSD was
displayed on a desktop computer running the Windows 7 operating system. The
computer had an Intel Core i7-2600K Sandy Bridge 3.4GHz processor, 8GB of
DDR3 1600 RAM, utilizing an ASUS P8P67EVO Motherboard, with a Western
Digital 1TB HDD (7200rpm, 64MB Cache, 6GB/s), and a GIGABYTE GeForce
GTX 460 video card that had a Dell 3007WFP supporting resolution of
2560x1600 or better. The computer monitor used measured 19” diagonally and
had a 4:3 aspect ratio full color flat screen LCD display. Participants were also
recorded during the open discussion they had with the researcher at the end of

25
the study in order to properly review their subjective feedback. No other form of
recording or photography took place. For scenario development, the NASA
Ames-made Multi Aircraft Control Simulator (MACS) software was utilized to
create conflicts and manage the interaction of aircraft in a high-fidelity simulation
of local northern California airspace.
Stimuli
Simulator Experimental Environment. The environment in the Multi-
Aircraft Control Simulator (MACS) was modeled after real-world air traffic
controlled airspace of sectors 40 and 41, centered over the Santa Rosa airport in
northern California. No out-the-window view was provided, the only display
available was the Cockpit Situational Display (CSD), which essentially served as
a Cockpit Display of Traffic Information (CDTI) with a 2-dimensional simplified
top-down view of the environment surrounding ownship. Flight conditions were
nominal, with no wind or other weather involved. There were no active air traffic
controllers speaking with or directing pilots, as pilots had no control over their
aircraft’s pre-designated flight path and were only flying in the airspace for a
couple of minutes at a time.
Pilots viewed the CSD display with their ownship at the center of the traffic
display. In the MACS environment, there were two types of traffic flying in the
airspace surrounding ownship, consisting of both distractor traffic and intruder
traffic. Distractor traffic served the purpose of simulating a regularly-crowded
airspace typically encountered in routine flights. They were not meant to

26
negatively impact participants’ attention, but served to recreate normal traffic
levels that any pilot is likely to experience. The flight path of all distractor traffic
was designed fly at altitudes different than ownship, so as not to cause any
conflicts or be confused with intruder traffic. The intruder traffic was of primary
interest in this research, and there was only one of them displayed on the CSD
per scenario. The single intruder varied between being a manned or unmanned
aircraft (indicated by “NASA11” for manned, and “UAS11” for UAS in their data
tags next to aircraft icon on CSD) per scenario as well. The intruder was on a
straight and level course that would eventually violate legal separation, and was
always set to be on a collision course with ownship. See example in Figure 5.
It is important to note that while observing the CSD, pilots had control over
range zoom on the display and had the ability to change zoom levels at will. On
current day traffic and moving map displays, the ability to change range via the
flick of a knob or button press is standard, as different scenarios call for different
range views. Pilots dynamically switch ranges to observe different factors of their
current flight environment, so they were allowed to do this freely in the simulator
environment. The range rings surrounded ownship position, moving and re-
centering along as the map moved below ownship. They were displayed as
circles of light grey tint across the black background of the CSD, and can be
seen in Figure 5 below.

27
Intruder Approach Geometry Levels. The approach geometries of
intruder aircraft were of particular interest in this study. This independent
variable involved intruder aircraft, which varied from being either manned or
unmanned as counterbalanced throughout scenarios. Intruder aircraft differed
from distractor traffic in that there was only one intruder aircraft per scenario, and
the intruder was always aimed at the participant’s ownship and would imminently
cause a collision (or at the very least cause a severe breach of self-separation
with ownship). All intruder aircraft were set at co-altitude with ownship. The
Figure 5: Cockpit Situational Display in simple 2D mode (Alerts Disabled)

28
purpose of the intruder aircraft was to put it on a collision path, then instruct
participants to press a button to pause the simulation once they felt the intruder
reached the well clear boundary surrounding ownship. Once the simulation was
paused, the location of the intruder ship was recorded by the researcher.
Participants were told how to identify the difference between a manned and
unmanned aircraft on the CSD, as it was depicted with a different icon on the
CSD than other traffic. There were eight different approach geometries for the
intruder aircraft and it approached from one geometry per scenario. The
geometries are shown below in Figure 6, with four geometries approaching from
the four cardinal directions (N, S, E, W), and another four set on a 45 offset from
the original four, dissecting all four quadrants in half, totaling of eight geometries.
Figure 6: Intruder approach angles depicted on CSD

29
Distractor Traffic Levels. There were two levels of the distractor traffic
variable involved in the scenarios. This air traffic served to create a real-world
representation of traffic loads that can be typically experienced in the immediate
surrounding airspace of ownship. This traffic was all flown on pre-designated
flight plans that were not controlled in real time. These aircraft were all fully
simulated in the trials and were placed on straight and level flight paths that
would not cause any conflicts with ownship. To accomplish this, all distractor
traffic was flown at altitudes at least 2,000 feet above or below ownship, as
indicated by their data tags on the display. Depending on the scenario, each trial
involved either a low level of distractor traffic consisting of 4 planes, or a medium
level of traffic involving 8 planes. These quantities for traffic density were chosen
based on previous research conducted with the CSD at NASA Ames, and are
typical traffic levels for this type of research (Vu, Strybel, Battiste, & Johnson,
2011; Johnson, Jordan, Liao, & Granada, 2003)
Ownship Speed Levels. Two different levels of the ownship speed
independent variable were designed into the scenarios. The goal for this
independent variable was to test ownship speeds that represented a realistic
middle ground for what speeds the two different pilot types would typically
encounter. Because ATP pilots normally fly at much faster speeds than General
Aviation pilots, , the high speed selected was 250 knots since this is the
maximum speed limit for controlled airspace within the NAS, and it is not
inconceivable for GA pilots to reach these speeds (depending on the aircraft they

30
are piloting). For the lower speed, 150 knots was chosen since this is a bit faster
than trainer aircraft normally fly, but should be a familiar speed within reach of
most GA pilots and their typical aircraft. Different speeds for ownship were
chosen in order to investigate if the WCB changes with the speed of ownship,
possibly growing at higher speeds since objects in the sky are approaching
ownship at much higher rates.
Through the repetitive process of administering intruder aircraft from
different approach angles surrounding ownship throughout 64 trials, the goal was
to create a picture of the perceived WCB points for each pilot. After recording
the perceived boundary points for each pilot, we averaged the boundary points of
each pilot type (8 GA pilots averaged across each other, and 8 Commercial pilots
averaged across each other, separately) to depict the general WCB as perceived
by that pilot type. We also created two different versions of the averaged WCB
pictures by intruder aircraft type that is, manned vs. unmanned within each pilot
type, to discover if intruder type had any impact on the boundary.
Practice Scenarios. Before data was collected in the experimental
scenarios, all pilots had an opportunity to use the CSD through 5 practice
scenarios. Although many pilots in this study were well familiar with 2-
dimensional traffic displays, these practice trials allowed pilots to better
comprehend the unique properties of the CSD (such as directional traffic
information and data tags next to traffic icons) allowing for roughly equal
experience with the simulator environment. The practice trials also helped

31
eliminate any simulator adaption issues that may have hindered the results of the
experimental trials. During practice pilots had constant interaction and feedback
from the Researcher, who ensured any questions about the display were
thoroughly answered. In the practice trials, pilots were able to view the normal
distractor traffic, as well as different scenario recreations with both manned and
unmanned intruder aircraft in order to help them correctly differentiate the
different icons representing different types of aircraft.
Experimental Scenarios. Once the practice scenarios were complete,
the experimental trials began. The data from these scenarios were recorded for
analysis. The experimental trials were created to encompass a full factorial
design of all combinations of the above mentioned variables (two traffic levels,
two ownship speeds, two intruder types, and eight intruder aircraft approach
geometries), which yielded 64 different combinations, each of which were tested
on each of the 17 participants in the two pilot groups. Conflicts were pre-
scripted with the intruder aircraft always designed to be on a conflict/collision
course with the straight and level flight path of ownship in every scenario. All
scenarios began with ownship traveling at one of the two above mentioned cruise
speeds, with distractor traffic and an intruder aircraft flying in surrounding
airspace. Intruders were designed to come into conflict with ownship within
approximately two minutes for each scenario, yielding quick and easily
administered trials. The only objective given to the pilots was to click the right
mouse button on the computer running the simulation once an intruder aircraft

32
crossed what they felt was their perceived WCB, and believed the intruder could
become problematic if it continued on its current trajectory.
Procedure
After institutional review board approval the experiment took place in a
simulator room that was isolated from any distractions. Before beginning, pilots
signed an informed consent form, then were briefed about the background of the
study and current FAA regulations/definitions of similar concepts to the WCB
concept to help differentiate and eliminate possible confusion of terms. Similar
concepts to well clear included legal separation, collision avoidance procedures,
and self-separation procedures (all previously explained above in the section
entitled “Similar Terms and Concepts”). Following the explanations, pilots were
then briefed on the best and most recent FAA definition for the concept of well
clear. After the pre-simulation brief, pilots had an opportunity to ask questions in
order to clarify their understanding of the definitions of the similar concepts. The
researcher replied thoroughly with great care given not to contaminate their
notion of well clear, emphasizing the subjectivity of its current definition.
After the briefing, pilots were then subjected to a series of trials designed
to measure perceived WCBs from both manned and unmanned vehicles using a
single display platform. The primary task accomplished by participants was the
experimental task. No other tasks such as manual flying or monitoring of any
other displays were involved, as this was a part task simulator-based study.
Participants viewed the CSD with ownship located at the center of screen, and

33
other aircraft traffic surrounding their current location. Before data collection
began, participants first had practice trials that consisted of five scenario runs,
each lasting approximately 2 minutes. Again, during these practice runs pilots
had the freedom to ask any questions they wished in order to better acclimate
themselves to the CSD and the part-task simulator environment.
After the practice runs, all participants went through a series of 64
experimental trials in rapid succession, with appropriate breaks given at the
participants’ discretion. The researcher controlled the initiation of each trial. The
randomized experimental order allowed for a good distribution of exposure order
for the different scenarios in this study. Each trial involved either 4 or 8 distractor
aircraft that were evenly dispersed around the airspace of ownship, and 1
intruder aircraft showing up from 8 different geometries surrounding ownship (1
geometry per scenario), and the participants ended the scenario with a mouse
click once that intruder had breached the WCB. Once each scenario ended, the
position of each intruder, along with the distance from CPA, and tCPA were all
recorded by the CSD software. Through this repetitive process we were able to
create a spatial representation of the averaged WCB directly surrounding
ownship by combining the WCB positions of all intruder aircraft for each
participant’s trials and aggregating the measurement data.
Measures
Objective Metrics. The objective metrics collected in this study were
primarily aimed at measuring the WCB as it was perceived by pilots in all

34
scenarios. The intruder aircraft’s final recorded position, direction and speed in
the simulator were used to calculate the main objective metrics for the perception
of well clear. The WCB points were indicated by participants clicking a mouse
button when the intruder passed what they considered the WCB, allowing for the
intruder’s distance from ownship and time until CPA to be calculated in feet (all
regarding the horizontal plane distance only). The intruder aircraft approached
ownship from eight different geometries surrounding it, and once all of the
locations were mapped from all scenarios, an averaged top down view map of
perceived WCBs for all intruders was created. Multiple WCB maps were created
with the distance in feet metric, one for each variable collapsed across the
others, as well as an overall WCB map. In addition to measuring the WCB in
distance from ownship (dOWN) in feet, it was also measured in tCPA in seconds.
The tCPA for each approach angle was calculated as t (time) = d (distance) ÷ r
(rate) with distance the length of last recorded position of the intruder ship to the
point where ownship and intruder intersected. The main WCB maps of interest
were for the two different pilot types, and for the two different intruder types. The
result was an accurate measureable comparative representation of different
pilots’ perception of the WCB for both UAS and manned aircraft in the NAS.
Subjective Metrics. The subjective metrics utilized were designed to
complement the objective metrics, along with providing further insight into the
concept of the WCB. During the experimental trials, any significant comments
made by the pilots regarding WCB or their perception of it were recorded by the

35
researcher, and were used to supplement the post-experiment questionnaire.
There was no post-trial questionnaire administered, since each trial was short,
and administering a questionnaire after each trial would be intrusive. After all
experimental trials were complete, a post-experiment questionnaire was
administered to the participants. It consisted of 15 open-ended, and 5 rating
scale questions designed to provide detailed insight about their thoughts and
interpretations of the WCB (see Appendix D). A final question asked the pilots to
illustrate through drawing a picture what they perceived the WCB to be for both
manned and unmanned aircraft surrounding ownship. The drawing questions
provided a page with a blank CSD display, with ownship indicated at the center,
and range unlabeled range rings were provided. They were asked to not only
draw the shape of the WCB, but also indicate the appropriate range on the range
rings to more accurately depict their perception. Drawings were done to
determine if pilots’ perceived WCB matched their actual recorded WCB, another
important human factors measure. The drawings were then sorted by common
shapes/features and tallied up to summarize findings. This subjective feedback
was compared to the objective data described above.
Analysis
The WCB data were analyzed with a five-way mixed ANOVA to analyze
differences across all variables and to assess any interactions. For all tests,
alpha (significance level) was set to .05.

36
Results
WCB Maps
The results of all WCB measurements are presented below in the form of
maps, with separate maps for the dOWN metric as well as the tCPA
measurements. These maps have not been subjected to any form of statistical
analysis other than averaging results per intruder approach angle to aggregate
mean values. Helping to visualize measurements, multiple maps were created
by collapsing data across every independent variable to show the effect each
one had on the overall WCB map shape. All maps have ownship heading north
(000°). The seemingly inverse relationship between the dOWN and tCPA maps
is due to closure rate. Distances are large with small times in front of ownship
because closure rate was high, so pilots wanted the most distance because they
had the least time to react in a head-on scenario. Distances are small and times
are great in the rear because closure rates were small, so pilots allowed small
distances due to high time to collision.
Figure 7 below shows the difference in the WCB values across different
intruder approach angles and collapsed across all other independent variables,
with the head-on angle having over double the value of the rear value for dOWN.
The peripherals appear largely uniform with very little variation compared to their
horizontal symmetric counterpoint. The tCPA also follows suit, with an inverse
relationship in values for head-on and rear directions as explained in the previous

37
paragraph. These maps are cohesive with the logic of closure speed and
time/distance needed to safely react throughout different encounter situations.
The following maps in Figures 8 through 15 are provided to display the
effects that each independent variable (IV) had on the WCB (pilot type, ownship
speed, intruder type, and traffic levels), collapsing across the effects of all other
IVs except approach angle. They visually highlight isolated effects, which may or
may not be statistically significant, allowing for good conception of each IV’s role
in WCB perception. Ignoring all other IVs, Figures 8 and 9 show between pilot
type maps, with GA pilots having a much larger WCB than ATP pilots. Each GA
pilot data point is several thousand feet greater than the ATP pilot dOWN values.
Figure 7. WCB by Direction

38
The tCPA values follow suit, and show the GA pilots having greater values by at
least 3 seconds, and as much as 16 seconds difference from ATP pilots.
Figure 8. dOWN of WCB by Pilot Type
Figure 9. tCPA of WCB by Pilot Type

39
In Figures 10 and 11, ignoring all other IVs, ownship speed appears to
change the values of dOWN measurements slightly, with small increases in the
higher speed scenarios. The shape of the 250 knot map is also considerably
wider specifically in the 315° and 045° angles (or the forward 45° angles from
ownship). Conversely, the tCPA values are all larger on the 150 knot map,
except for the head-on angle of 000°, which appeared less in the 150 knot map
compared to the 250 knot map. Reasoning for this is provided in the Discussion
section.

40
Figure 10. dOWN of WCB by Ownship Speed
Figure 11. tCPA of WCB by Ownship Speed
41
In Figures 12 and 13 we can observe interesting results. There appear to
be mixed dOWN value differences across intruder types. The manned intruders
have slightly larger dOWN values for the head-on and rear approach angles, as
well as the 90° and 270° angles than UAS intruders. However, the manned
intruders have slightly smaller values for the 315°, 45°, 225°, and 135° angles
than UAS. The tCPA values also follow suit here, with nearly identical difference
patters.

42
Figure 12. dOWN WCB by Intruder Type
Figure 13. tCPA of WCB by Intruder Type

43
Below, Figures 14 and 15 show slightly smaller dOWN values in the
medium background traffic level (8 background aircraft) than the low traffic level
(4 background aircraft) scenarios. The tCPA values followed suit here, but with
slightly less noticeable differences. This trend was evident for all angle directions
in these maps.

44
Figure 14. dOWN of WCB by Traffic Level
Figure 15. tCPA of WCB by Traffic Level

45
Objective Metrics Results
The WCB was measured in two ways to provide a full understanding of its
parameters, measured by dOWN in feet, and tCPA in seconds. Therefore, two
five-way mixed analyses of variance (ANOVA) were used to analyze these
quantitative WCB measures. The five factors in the mixed ANOVAs were the
between subjects variable of pilot type and intruder approach angle, intruder
type, ownship speed, and traffic level.
Distance from Ownship (dOWN). The first five-way ANOVA was
performed on the dOWN measure, which was the distance from ownship in feet
indicating the WCB. This consisted of an 8 x 2 x 2 x 2 x 2 ANOVA for significant
differences among approach angles, intruder types, ownship speeds, traffic
levels, and pilot types. Results found two significant interactions and three main
effects. A significant three-way interaction was evident among intruder type,
ownship speed, and pilot type, F(1, 32) = 4.56, p = .041. This indicates that the
effect of intruder type depends on ownship speed and that differs across pilot
type. A significant two-way interaction was also observed with ownship speed
and intruder approach angle, F(5,175) = 6.85, p = .004. Main effects were also
found for intruder approach angle, F(1, 55) = 27.68, p < 0.001, ownship speed,
F(1, 32) = 9.76, p = 0.004, and traffic level, F(1, 32) = 5, p = 0.045. Besides
these interactions, no other effects for the metric of dOWN in feet were found to
be significant. For all dOWN means and standard deviations, as well as full
dOWN interaction results, see Tables 1 and 2 below.

46
Table 1: Means and Standard Deviations for dOWN in feet Scenario Pilot Type Mean Std. Deviation
Manned Intruder_Low Traffic_150knots_Angle 1 ATP 13752 4347
GA 17300 15439
Total 15526 11313
Manned Intruder_Low Traffic_150knots_Angle 2 ATP 17389 7788
GA 24532 18106
Total 20960 14195
Manned Intruder_Low Traffic_150knots_Angle 3 ATP 24170 13004
GA 27453 16515
Total 25812 14732
Manned Intruder_Low Traffic_150knots_Angle 4 ATP 23269 13642
GA 29931 17533
Total 26600 15834
Manned Intruder_Low Traffic_150knots_Angle 5 ATP 35069 25209
GA 37173 23135
Total 36121 23849
Manned Intruder_Low Traffic_150knots_Angle 6 ATP 26588 15086
GA 28761 16694
Total 27675 15707
Manned Intruder_Low Traffic_150knots_Angle 7 ATP 22944 13716
GA 29012 16473
Total 25978 15241
Manned Intruder_Low Traffic_150knots_Angle 8 ATP 18465 8811
GA 25112 15962
Total 21789 13136
Manned Intruder_Low Traffic_250knots_Angle 1 ATP 13593 4434
GA 17935 13557
Total 15764 10173
Manned Intruder_Low Traffic_250knots_Angle 2 ATP 19068 9729
GA 22508 12579
Total 20788 11210
Manned Intruder_Low Traffic_250knots_Angle 3 ATP 23510 14718
GA 30366 19799
Total 26938 17527
Manned Intruder_Low Traffic_250knots_Angle 4 ATP 30790 20730
GA 30803 17245
Total 30797 18776
Manned Intruder_Low Traffic_250knots_Angle 5 ATP 34710 27162
GA 39142 24306
Total 36926 25480
Manned Intruder_Low Traffic_250knots_Angle 6 ATP 29474 21650
GA 31829 19106
Total 30652 20141
Manned Intruder_Low Traffic_250knots_Angle 7 ATP 23623 15083
GA 30070 19594
Total 26846 17526
Manned Intruder_Low Traffic_250knots_Angle 8 ATP 16665 8272
GA 22335 12727

47
Total 19500 10954
Manned Intruder_Medium Traffic_150knots_Angle 1 ATP 17606 19959
GA 16700 12591
Total 17153 16438
Manned Intruder_Medium Traffic_150knots_Angle 2 ATP 18092 9254
GA 23182 10365
Total 20637 10014
Manned Intruder_Medium Traffic_150knots_Angle 3 ATP 22061 12871
GA 26644 15158
Total 24353 14040
Manned Intruder_Medium Traffic_150knots_Angle 4 ATP 25054 16788
GA 26527 16598
Total 25791 16455
Manned Intruder_Medium Traffic_150knots_Angle 5 ATP 34427 25357
GA 33808 17907
Total 34117 21617
Manned Intruder_Medium Traffic_150knots_Angle 6 ATP 24865 14726
GA 28165 18153
Total 26515 16362
Manned Intruder_Medium Traffic_150knots_Angle 7 ATP 21436 10901
GA 27267 13723
Total 24351 12557
Manned Intruder_Medium Traffic_150knots_Angle 8 ATP 17492 7987
GA 22307 11986
Total 19899 10322
Manned Intruder_Medium Traffic_250knots_Angle 1 ATP 14771 5696
GA 18249 13035
Total 16510 10061
Manned Intruder_Medium Traffic_250knots_Angle 2 ATP 17123 8127
GA 22247 12606
Total 19685 10763
Manned Intruder_Medium Traffic_250knots_Angle 3 ATP 24640 17047
GA 31023 19514
Total 27831 18331
Manned Intruder_Medium Traffic_250knots_Angle 4 ATP 28275 20025
GA 34294 19524
Total 31285 19712
Manned Intruder_Medium Traffic_250knots_Angle 5 ATP 33239 24256
GA 39645 29035
Total 36442 26544
Manned Intruder_Medium Traffic_250knots_Angle 6 ATP 28134 16324
GA 30597 19286
Total 29366 17638
Manned Intruder_Medium Traffic_250knots_Angle 7 ATP 22547 14175
GA 31419 17878
Total 26983 16513
Manned Intruder_Medium Traffic_250knots_Angle 8 ATP 16869 9038
GA 22801 12814
Total 19835 11326
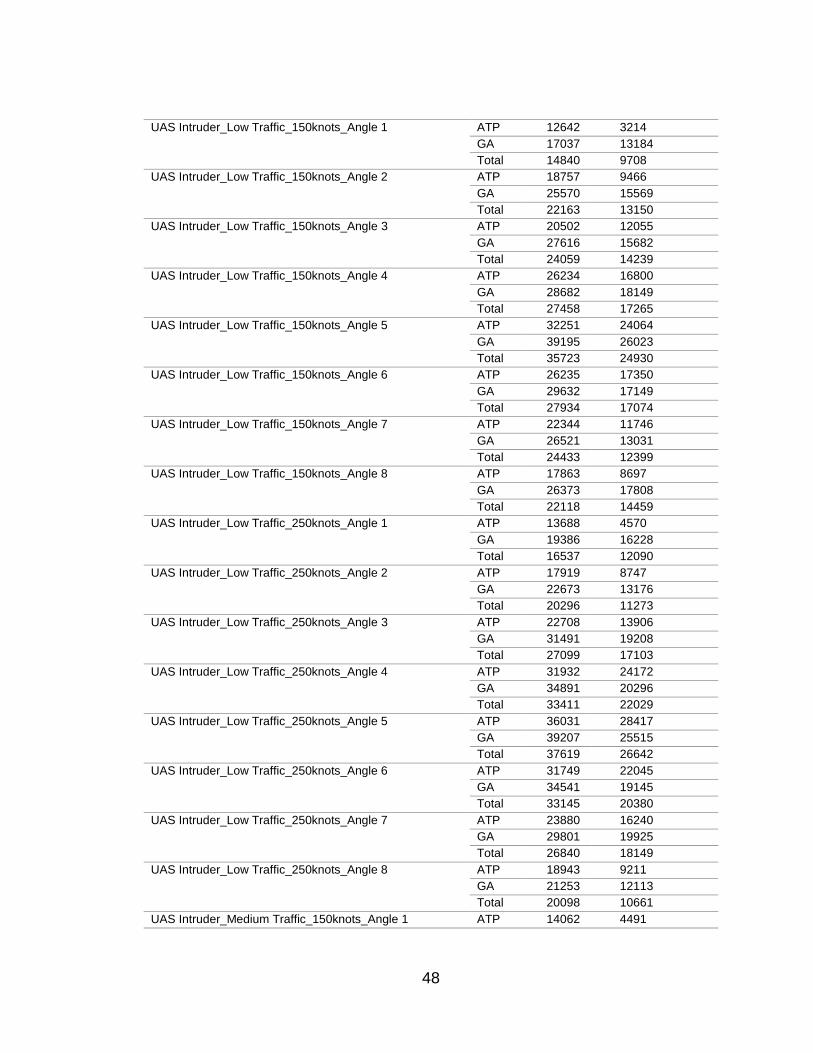
48
UAS Intruder_Low Traffic_150knots_Angle 1 ATP 12642 3214
GA 17037 13184
Total 14840 9708
UAS Intruder_Low Traffic_150knots_Angle 2 ATP 18757 9466
GA 25570 15569
Total 22163 13150
UAS Intruder_Low Traffic_150knots_Angle 3 ATP 20502 12055
GA 27616 15682
Total 24059 14239
UAS Intruder_Low Traffic_150knots_Angle 4 ATP 26234 16800
GA 28682 18149
Total 27458 17265
UAS Intruder_Low Traffic_150knots_Angle 5 ATP 32251 24064
GA 39195 26023
Total 35723 24930
UAS Intruder_Low Traffic_150knots_Angle 6 ATP 26235 17350
GA 29632 17149
Total 27934 17074
UAS Intruder_Low Traffic_150knots_Angle 7 ATP 22344 11746
GA 26521 13031
Total 24433 12399
UAS Intruder_Low Traffic_150knots_Angle 8 ATP 17863 8697
GA 26373 17808
Total 22118 14459
UAS Intruder_Low Traffic_250knots_Angle 1 ATP 13688 4570
GA 19386 16228
Total 16537 12090
UAS Intruder_Low Traffic_250knots_Angle 2 ATP 17919 8747
GA 22673 13176
Total 20296 11273
UAS Intruder_Low Traffic_250knots_Angle 3 ATP 22708 13906
GA 31491 19208
Total 27099 17103
UAS Intruder_Low Traffic_250knots_Angle 4 ATP 31932 24172
GA 34891 20296
Total 33411 22029
UAS Intruder_Low Traffic_250knots_Angle 5 ATP 36031 28417
GA 39207 25515
Total 37619 26642
UAS Intruder_Low Traffic_250knots_Angle 6 ATP 31749 22045
GA 34541 19145
Total 33145 20380
UAS Intruder_Low Traffic_250knots_Angle 7 ATP 23880 16240
GA 29801 19925
Total 26840 18149
UAS Intruder_Low Traffic_250knots_Angle 8 ATP 18943 9211
GA 21253 12113
Total 20098 10661
UAS Intruder_Medium Traffic_150knots_Angle 1 ATP 14062 4491

49
GA 14562 4738
Total 14312 4553
UAS Intruder_Medium Traffic_150knots_Angle 2 ATP 17715 8197
GA 22798 13944
Total 20256 11554
UAS Intruder_Medium Traffic_150knots_Angle 3 ATP 20671 9089
GA 27622 15934
Total 24146 13251
UAS Intruder_Medium Traffic_150knots_Angle 4 ATP 24389 14562
GA 29804 18592
Total 27097 16672
UAS Intruder_Medium Traffic_150knots_Angle 5 ATP 29598 18579
GA 37846 20891
Total 33722 19912
UAS Intruder_Medium Traffic_150knots_Angle 6 ATP 25288 17559
GA 29859 16335
Total 27573 16859
UAS Intruder_Medium Traffic_150knots_Angle 7 ATP 21703 12363
GA 29678 14526
Total 25690 13885
UAS Intruder_Medium Traffic_150knots_Angle 8 ATP 17632 9483
GA 21858 11243
Total 19745 10464
UAS Intruder_Medium Traffic_250knots_Angle 1 ATP 13549 4429
GA 14115 4936
Total 13832 4627
UAS Intruder_Medium Traffic_250knots_Angle 2 ATP 18426 8963
GA 23382 13968
Total 20904 11826
UAS Intruder_Medium Traffic_250knots_Angle 3 ATP 23164 14079
GA 28853 17478
Total 26009 15892
UAS Intruder_Medium Traffic_250knots_Angle 4 ATP 31322 22423
GA 35065 19928
Total 33194 20974
UAS Intruder_Medium Traffic_250knots_Angle 5 ATP 33690 25922
GA 36187 20076
Total 34939 22865
UAS Intruder_Medium Traffic_250knots_Angle 6 ATP 28722 17616
GA 35363 21049
Total 32042 19407
UAS Intruder_Medium Traffic_250knots_Angle 7 ATP 23344 15602
GA 28955 19903
Total 26150 17838
UAS Intruder_Medium Traffic_250knots_Angle 8 ATP 18152 9453
GA 22265 11183
Total 20208 10408

50
Table 2: Five-way Mixed ANOVA Results for dOWN in feet (p* = significant)
Effect F df p
Angle 27.68 2, 56 < .001*
IntruderType <1 1, 32 .692
OwnSpeed 9.75 1, 32 .004*
TrafficLevel 4.35 1, 32 .045*
Angle * Pilot_Type <1 2, 56 .703
IntruderType * Angle 2.86 5, 175 .014*
IntruderType * OwnSpeed 1.08 1, 32 .306
IntruderType * Pilot_Type <1 1, 32 .407
IntruderType * TrafficLevel 1.16 1, 32 .289
OwnSpeed * Angle 6.85 5, 175 < .001*
OwnSpeed * Pilot_Type <1 1, 32 .989
TrafficLevel * Angle <1 5, 146 .701
TrafficLevel * OwnSpeed <1 1, 32 .509
TrafficLevel * Pilot_Type <1 1, 32 .764
IntruderType * Angle * Pilot_Type <1 5, 175 .489
IntruderType * OwnSpeed * Angle <1 5, 176 .920
IntruderType * OwnSpeed * Pilot_Type 4.56 1, 32 .041*
IntruderType * TrafficLevel * Angle <1 5, 171 .604
IntruderType * TrafficLevel * OwnSpeed 1.44 1, 32 .239
IntruderType * TrafficLevel * Pilot_Type <1 1, 32 .967
OwnSpeed * Angle * Pilot_Type <1 5, 175 .768
TrafficLevel * Angle * Pilot_Type 1.37 5, 146 .243
TrafficLevel * OwnSpeed * Angle <1 6, 182 .731
TrafficLevel * OwnSpeed * Pilot_Type 1.83 1, 32 .186
IntruderType * OwnSpeed * Angle * Pilot_Type 2 5, 176 .165
IntruderType * TrafficLevel * Angle * Pilot_Type 1.57 5, 171 .927
IntruderType * TrafficLevel * OwnSpeed * Angle <1 6, 183 .599
IntruderType * TrafficLevel * OwnSpeed * Pilot_Type 3.26 1, 32 .080
TrafficLevel * OwnSpeed * Angle * Pilot_Type <1 6, 182 .696
IntruderType * TrafficLevel * OwnSpeed * Angle * Pilot_Type 1.27 6, 183 .277
Tests of Between-Subjects Effects F df p
Pilot_Type <1 1, 32 .337

51
Interaction Plots for WCB Distance from Ownship Metrics. Figure 16a
is one of two figures that depicts the three way interaction present among
intruder type, ownship speed, and pilot type measured by dOWN. It shows the
interaction for ATPs. We can see how the effect of intruder and ownship speed
interact, and when compared to Figure 16b below, how this interaction differs
across pilot type. In Figure 16a, it evident that when ATPs traveled at the slower
speed of 150 knots, they averaged a smaller WCB for UAS than manned
intruders. However, when traveling at the higher speed of 250 knots, they
indicated a significantly larger WCB for UAS over manned intruders.
Manned UAS
150 knots 250 knots
Dis
tan
ce
fro
m O
wn
sh
ip (
fee
t)
Figure 16a. Means of WCB by Ownship Speed between Intruder Types for ATPs

52
Figure 16b is the second of two depicting the three way interaction
between intruder type, ownship speed, and pilot measured by dOWN, showing
the effects of ownship speed and intruder type for GA pilots. We can see the
effect of intruder and ownship speed for GA pilots differ from ATPs when
compared to Figure 16a above. Here in Figure 16b it is evident that regardless of
whether GA pilots were travelling at the slower or faster speeds, they averaged a
larger WCB for UAS than manned intruders. This differs significantly from the
WCB for ATPs, which changed between ownship speeds depending on intruder
types.
150 knots 250 knots
Manned UAS
Dis
tan
ce
fro
m O
wn
sh
ip (
fee
t)
Figure 16b. Means of WCB by Ownship Speed between Intruder Types for GA Pilots

53
Figure 18 shows how the effect of ownship speed on the WCB depends
on intruder approach angle when measured by dOWN for all pilots. So, aside
from pilots averaging different WCB distances depending on intruder approach
angle, these distances also differed significantly based on ownship speed. The
largest differences in the WCB between ownship speeds are at the 315° and
045° angles (all relative to ownship bearing 000°). Oddly, we also see the WCB
150kts 250kts
Dis
tan
ce
fro
m O
wn
sh
ip (
fee
t)
180° 225° 270° 315° 000° 045° 090° 135°
Figure 17. Means of WCB by Intruder Approach Angle for all Pilots

54
having smaller values at the higher speed of 250 knots from the 225° and 135°
angles, an opposite trend from all other angles.
Time to Closest Point of Approach (tCPA). The second five-way ANOVA
was performed on the tCPA measurement results, which were the times until
ownship was projected to intersect flight paths (closest point of approach) with
ownship from each of the eight intruder approach angles. This 8x2x2x2x2
ANOVA was used to analyze these data. Three interactions (see Figures 18-20)
and two main effects were statistically significant. There was a significant four-
way interaction among intruder type, traffic level, ownship speed, and intruder
approach angle, F(6,200) = 6.28, p = 0.008. This shows that the effect of
intruder type depends on traffic level and ownship speed, and this relationship
differs across intruder approach angles. A significant three-way interaction was
found among intruder type, traffic level, and ownship speed, F(1, 32) = 4.16, p =
0.049. This means that the effect of intruder type depends on traffic level, which
differs across ownship speeds. A significant two-way interaction was observed
between ownship speed and intruder approach angle, F(5,170) = 6.85, p < 0.001,
indicating that the effect of ownship speed depends on intruder approach angle.
Main effects were also found for intruder approach angle, F(2, 83) = 370.02, p <
0.001, and for ownship speed, F(1, 32) = 8.57, p = 0.006. Aside from these
interactions, all other effects for the metric of tCPA in feet were not significant.
For all tCPA means and standard deviations, as well as full tCPA interaction
results, see Tables 3 and 4 below.

55
Table 3: Means and Standard Deviations for tCPA in seconds Scenario Pilot Type Mean Std. Deviation
Manned Intruder_Low Traffic_150knots_Angle 1 ATP 146.0471 23.29343
GA 156.5706 44.36533
Total 151.3088 35.29752
Manned Intruder_Low Traffic_150knots_Angle 2 ATP 58.0235 26.14459
GA 78.3118 51.06435
Total 68.1676 41.25178
Manned Intruder_Low Traffic_150knots_Angle 3 ATP 53.7176 26.39650
GA 60.3824 33.51450
Total 57.0500 29.89755
Manned Intruder_Low Traffic_150knots_Angle 4 ATP 42.0353 21.61458
GA 52.6059 27.85883
Total 47.3206 25.13155
Manned Intruder_Low Traffic_150knots_Angle 5 ATP 32.1176 29.78905
GA 30.5235 30.60538
Total 31.3206 29.74988
Manned Intruder_Low Traffic_150knots_Angle 6 ATP 48.0824 23.95666
GA 51.5118 26.54058
Total 49.7971 24.95642
Manned Intruder_Low Traffic_150knots_Angle 7 ATP 51.0882 27.84374
GA 63.4000 33.46171
Total 57.2441 30.94853
Manned Intruder_Low Traffic_150knots_Angle 8 ATP 61.9000 29.93881
GA 81.8824 46.25137
Total 71.8912 39.68144
Manned Intruder_Low Traffic_250knots_Angle 1 ATP 138.4059 30.41060
GA 154.3353 45.25983
Total 146.3706 38.81930
Manned Intruder_Low Traffic_250knots_Angle 2 ATP 62.5235 30.07546
GA 71.2412 33.69967
Total 66.8824 31.76103
Manned Intruder_Low Traffic_250knots_Angle 3 ATP 42.3706 24.52338
GA 53.8000 33.03642
Total 48.0853 29.23011
Manned Intruder_Low Traffic_250knots_Angle 4 ATP 42.3235 26.41904
GA 42.2941 22.00033
Total 42.3088 23.93912
Manned Intruder_Low Traffic_250knots_Angle 5 ATP 43.9882 32.00306
GA 49.1706 28.64910
Total 46.5794 30.02411

56
Manned Intruder_Low Traffic_250knots_Angle 6 ATP 40.7588 27.56726
GA 43.7118 24.33408
Total 42.2353 25.64781
Manned Intruder_Low Traffic_250knots_Angle 7 ATP 42.7529 25.00258
GA 53.4059 32.76657
Total 48.0794 29.20412
Manned Intruder_Low Traffic_250knots_Angle 8 ATP 54.5765 25.54996
GA 70.1412 34.11006
Total 62.3588 30.70878
Manned Intruder_Medium Traffic_150knots_Angle 1 ATP 139.0353 28.49995
GA 155.7588 38.24644
Total 147.3971 34.27953
Manned Intruder_Medium Traffic_150knots_Angle 2 ATP 60.2824 31.36322
GA 76.9000 33.09732
Total 68.5912 32.85071
Manned Intruder_Medium Traffic_150knots_Angle 3 ATP 49.4353 26.12247
GA 58.7412 30.76028
Total 54.0882 28.49421
Manned Intruder_Medium Traffic_150knots_Angle 4 ATP 44.8765 26.64208
GA 47.2000 26.37314
Total 46.0382 26.12985
Manned Intruder_Medium Traffic_150knots_Angle 5 ATP 31.2647 30.25213
GA 25.8412 22.26845
Total 28.5529 26.30084
Manned Intruder_Medium Traffic_150knots_Angle 6 ATP 45.3294 23.37880
GA 50.5824 28.85453
Total 47.9559 25.99591
Manned Intruder_Medium Traffic_150knots_Angle 7 ATP 48.0176 22.14182
GA 59.8588 27.87062
Total 53.9382 25.50361
Manned Intruder_Medium Traffic_150knots_Angle 8 ATP 58.8412 26.82881
GA 73.5941 35.88371
Total 66.2176 32.08362
Manned Intruder_Medium Traffic_250knots_Angle 1 ATP 145.9235 34.74058
GA 157.1824 44.47027
Total 151.5529 39.70714
Manned Intruder_Medium Traffic_250knots_Angle 2 ATP 56.5118 25.12491
GA 70.5176 33.74925
Total 63.5147 30.14699
Manned Intruder_Medium Traffic_250knots_Angle 3 ATP 44.2882 28.37263
GA 54.8882 32.57315

57
Total 49.5882 30.55612
Manned Intruder_Medium Traffic_250knots_Angle 4 ATP 39.1235 25.47956
GA 46.7529 24.90535
Total 42.9382 25.10977
Manned Intruder_Medium Traffic_250knots_Angle 5 ATP 42.2353 28.57241
GA 49.7647 34.26228
Total 46.0000 31.29840
Manned Intruder_Medium Traffic_250knots_Angle 6 ATP 39.0235 20.75595
GA 42.1294 24.60236
Total 40.5765 22.46840
Manned Intruder_Medium Traffic_250knots_Angle 7 ATP 40.8824 23.63769
GA 55.6647 29.87541
Total 48.2735 27.56694
Manned Intruder_Medium Traffic_250knots_Angle 8 ATP 55.2059 27.96083
GA 72.0000 35.78049
Total 63.6029 32.74798
UAS Intruder_Low Traffic_150knots_Angle 1 ATP 141.5882 23.56390
GA 157.1412 35.96140
Total 149.3647 30.96028
UAS Intruder_Low Traffic_150knots_Angle 2 ATP 62.4647 32.12291
GA 82.3706 44.84892
Total 72.4176 39.71909
UAS Intruder_Low Traffic_150knots_Angle 3 ATP 46.2824 24.46925
GA 60.7118 31.82558
Total 53.4971 28.89665
UAS Intruder_Low Traffic_150knots_Angle 4 ATP 46.7647 26.65774
GA 50.6353 28.83301
Total 48.7000 27.41321
UAS Intruder_Low Traffic_150knots_Angle 5 ATP 28.5412 28.41751
GA 34.5059 33.89339
Total 31.5235 30.94643
UAS Intruder_Low Traffic_150knots_Angle 6 ATP 47.5235 27.56174
GA 52.9118 27.26951
Total 50.2176 27.13557
UAS Intruder_Low Traffic_150knots_Angle 7 ATP 49.8529 23.83517
GA 58.3588 26.47976
Total 54.1059 25.18035
UAS Intruder_Low Traffic_150knots_Angle 8 ATP 60.0471 29.21288
GA 84.9118 50.15820
Total 72.4794 42.34167
UAS Intruder_Low Traffic_250knots_Angle 1 ATP 140.7294 32.54848

58
GA 160.4588 48.23870
Total 150.5941 41.73896
UAS Intruder_Low Traffic_250knots_Angle 2 ATP 58.9765 27.03739
GA 71.7118 35.46921
Total 65.3441 31.72035
UAS Intruder_Low Traffic_250knots_Angle 3 ATP 41.0353 23.14716
GA 55.6706 32.04522
Total 48.3529 28.51030
UAS Intruder_Low Traffic_250knots_Angle 4 ATP 43.7882 30.82410
GA 47.5176 25.90367
Total 45.6529 28.09951
UAS Intruder_Low Traffic_250knots_Angle 5 ATP 45.5588 33.48923
GA 49.2529 30.08758
Total 47.4059 31.40385
UAS Intruder_Low Traffic_250knots_Angle 6 ATP 43.6235 28.07858
GA 47.1294 24.43133
Total 45.3765 25.97739
UAS Intruder_Low Traffic_250knots_Angle 7 ATP 43.1000 27.09986
GA 52.9765 33.30448
Total 48.0382 30.31480
UAS Intruder_Low Traffic_250knots_Angle 8 ATP 61.6118 28.48850
GA 67.7294 35.00791
Total 64.6706 31.58082
UAS Intruder_Medium Traffic_150knots_Angle 1 ATP 147.2706 24.92155
GA 155.0588 21.27087
Total 151.1647 23.15437
UAS Intruder_Medium Traffic_150knots_Angle 2 ATP 59.0000 27.96672
GA 74.7471 42.08414
Total 66.8735 36.08036
UAS Intruder_Medium Traffic_150knots_Angle 3 ATP 46.6059 18.45367
GA 60.7176 32.33911
Total 53.6618 26.89734
UAS Intruder_Medium Traffic_150knots_Angle 4 ATP 43.8059 23.09403
GA 52.4235 29.55490
Total 48.1147 26.48067
UAS Intruder_Medium Traffic_150knots_Angle 5 ATP 24.3000 19.75373
GA 32.0353 26.02698
Total 28.1676 23.08772
UAS Intruder_Medium Traffic_150knots_Angle 6 ATP 46.0353 27.86878
GA 53.2588 25.96681
Total 49.6471 26.77551

59
UAS Intruder_Medium Traffic_150knots_Angle 7 ATP 48.5765 25.09000
GA 64.7706 29.50095
Total 56.6735 28.19099
UAS Intruder_Medium Traffic_150knots_Angle 8 ATP 59.1235 32.09799
GA 72.6529 35.30462
Total 65.8882 33.92641
UAS Intruder_Medium Traffic_250knots_Angle 1 ATP 141.2412 34.27423
GA 146.7176 30.10586
Total 143.9794 31.88630
UAS Intruder_Medium Traffic_250knots_Angle 2 ATP 60.5412 27.69574
GA 73.5588 36.82813
Total 67.0500 32.75910
UAS Intruder_Medium Traffic_250knots_Angle 3 ATP 41.8000 23.45365
GA 51.2706 29.15012
Total 46.5353 26.49142
UAS Intruder_Medium Traffic_250knots_Angle 4 ATP 43.0000 28.56851
GA 47.7412 25.41739
Total 45.3706 26.73457
UAS Intruder_Medium Traffic_250knots_Angle 5 ATP 42.7824 30.54004
GA 45.6706 23.64191
Total 44.2265 26.93260
UAS Intruder_Medium Traffic_250knots_Angle 6 ATP 39.7765 22.38215
GA 48.2294 26.85370
Total 44.0029 24.71697
UAS Intruder_Medium Traffic_250knots_Angle 7 ATP 42.2059 26.01561
GA 51.5588 33.25643
Total 46.8824 29.78122
UAS Intruder_Medium Traffic_250knots_Angle 8 ATP 59.1647 29.24060
GA 71.0235 32.70456
Total 65.0941 31.13459
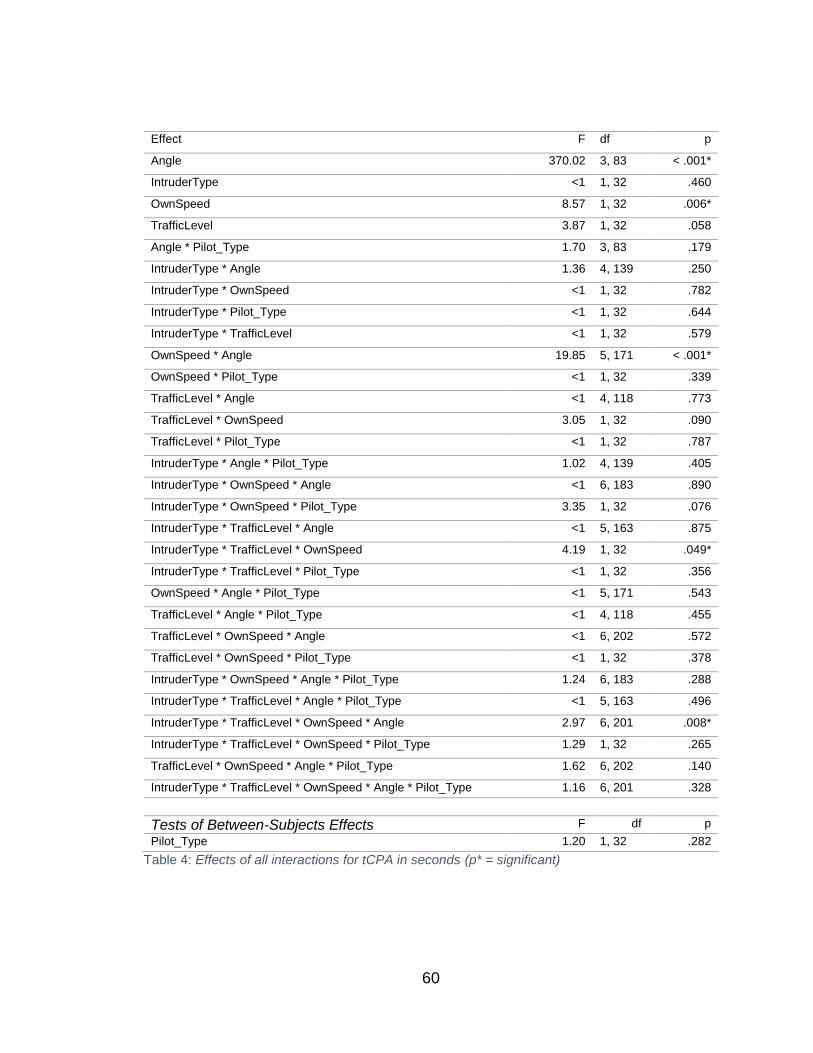
60
Table 4: Effects of all interactions for tCPA in seconds (p* = significant)
Effect F df p
Angle 370.02 3, 83 < .001*
IntruderType <1 1, 32 .460
OwnSpeed 8.57 1, 32 .006*
TrafficLevel 3.87 1, 32 .058
Angle * Pilot_Type 1.70 3, 83 .179
IntruderType * Angle 1.36 4, 139 .250
IntruderType * OwnSpeed <1 1, 32 .782
IntruderType * Pilot_Type <1 1, 32 .644
IntruderType * TrafficLevel <1 1, 32 .579
OwnSpeed * Angle 19.85 5, 171 < .001*
OwnSpeed * Pilot_Type <1 1, 32 .339
TrafficLevel * Angle <1 4, 118 .773
TrafficLevel * OwnSpeed 3.05 1, 32 .090
TrafficLevel * Pilot_Type <1 1, 32 .787
IntruderType * Angle * Pilot_Type 1.02 4, 139 .405
IntruderType * OwnSpeed * Angle <1 6, 183 .890
IntruderType * OwnSpeed * Pilot_Type 3.35 1, 32 .076
IntruderType * TrafficLevel * Angle <1 5, 163 .875
IntruderType * TrafficLevel * OwnSpeed 4.19 1, 32 .049*
IntruderType * TrafficLevel * Pilot_Type <1 1, 32 .356
OwnSpeed * Angle * Pilot_Type <1 5, 171 .543
TrafficLevel * Angle * Pilot_Type <1 4, 118 .455
TrafficLevel * OwnSpeed * Angle <1 6, 202 .572
TrafficLevel * OwnSpeed * Pilot_Type <1 1, 32 .378
IntruderType * OwnSpeed * Angle * Pilot_Type 1.24 6, 183 .288
IntruderType * TrafficLevel * Angle * Pilot_Type <1 5, 163 .496
IntruderType * TrafficLevel * OwnSpeed * Angle 2.97 6, 201 .008*
IntruderType * TrafficLevel * OwnSpeed * Pilot_Type 1.29 1, 32 .265
TrafficLevel * OwnSpeed * Angle * Pilot_Type 1.62 6, 202 .140
IntruderType * TrafficLevel * OwnSpeed * Angle * Pilot_Type 1.16 6, 201 .328
Tests of Between-Subjects Effects F df p
Pilot_Type 1.20 1, 32 .282
61
Interaction Plots for WCB Time to Closest Point of Approach Metrics.
Figures 18a through 18d collectively depict the four-way interaction observed
among intruder type, traffic level, ownship speed, and intruder approach angle.
Figure 18a represents a portion of the four-way interaction showing average time
to closest point of approach by intruder approach angle across ownship speeds
for ATPs interacting with manned intruders. Figure 18b shows another portion of
the same interaction, but for GA pilots interacting with manned intruders. In both
of these plots we can see ATP and GA pilots averaging a significantly larger
tCPA when traveling at the lower speed of 150 knots for all intruder approach
angles, except for 000° (the head-on angle). In the head-on angle we can see a
significantly lower tCPA value compared to all other angles. This head-on value
difference is even more drastic in the GA pilot plot in Figure 18b when compared
to the ATP plot in Figure 18a. Additionally, we can see that ownship speed had
less of an effect on tCPA for GA pilots than for ATPs in this particular interaction.
While Figures 19 and 20 only represent half of the four-way interaction (all
interactions with manned intruders only), Figures 19 and 20 below them
represent the remaining portions of the interaction.

62
150kts 250kts
Figure 18b. Mean Time to CPA by Intruder Approach Angle between Ownship Speeds for GA Pilots interacting with Manned Intruders
180° 225° 270° 315° 000° 045° 090° 135°
150kts 250kts
Tim
e t
o C
los
est
Po
int
of
Ap
pro
ac
h (
se
c)
Figure 18a. Mean Time to CPA by Intruder Approach Angle between Ownship Speeds for ATPs interacting with Manned Intruders
180° 225° 270° 315° 000° 045° 090° 135°
Tim
e t
o C
los
est
Po
int
of
Ap
pro
ac
h (
se
c) 150kts
250kts

63
Figures 18c and 18d depict the second half of the four-way interaction
observed among intruder type, traffic level, ownship speed, and intruder
approach angle. Figure 18c represents the portion of the four-way interaction
showing average time to closest point of approach by intruder approach angle
across ownship speeds for ATPs interacting with UAS intruders. Figure 18d
shows another portion of the same interaction, but for GA pilots interacting with
UAS intruders. Just as seen in the first two plots for this interaction in Figures 19
and 20, both of the plots in Figures 21 and 22 show ATP and GA pilots averaging
a significantly larger tCPA when traveling at the lower speed of 150 knots for all
intruder approach angles, except for 000° (the head-on angle). In the head-on
angle we can see a significantly lower tCPA value compared to all other angles.
However, this time the head-on value difference is more drastic in the ATPs’ (as
opposed to with GA pilots in Figures 19 and 20) plot in Figure 18c when
compared to the GA pilots plot in Figure 18d. Additionally, we can see that
ownship speed had less of an effect on tCPA for GA pilots than for ATPs in this
particular interaction. The last thing to notice in this four-way interaction is that
we can see that the effect of ownship speed had greater differences in tCPA
values with ATPs interacting with manned intruders (Figure 18b) when compared
to ATPs interacting with UAS intruders (Figure 18d), except of course for the
head-on condition where the opposite is true.

64
Figure 18c. Mean Time to CPA by Intruder Approach Angle between Ownship Speeds for ATPs interacting with UAS Intruders
150kts 250kts
180° 225° 270° 315° 000° 045° 090° 135°
Tim
e t
o C
los
est
Po
int
of
Ap
pro
ac
h (
se
c)
Figure 18d. Mean Time to CPA by Intruder Approach Angle between Ownship Speeds for GA Pilots interacting with UAS Intruders
150kts 250kts
180° 225° 270° 315° 000° 045° 090° 135°
Tim
e t
o C
los
est
Po
int
of
Ap
pro
ac
h (
se
c)

65
Figures 19a and 19b below depict the three way interaction among
intruder types, traffic levels, and ownship speeds. Figure 19a shows average
time to CPA for intruder types based on ownship speed in low traffic level. This
plot indicates that while interacting with the low background traffic level, all pilots
had a slightly larger value of the WCB for the manned over UAS intruders at the
lower ownship speed of 150 knots, while having a significantly smaller WCB for
manned compared to UAS intruders at the higher ownship speed of 250 knots.
Conversely, we can see in Figure 19b that when interacting with the medium
background traffic level all pilots showed a significantly larger WCB for UAS
compared to manned intruders at the lower ownship speed, and a slightly smaller
WCB for UAS over manned intruders at the higher ownship speed.
The final plot in Figure 20 below depicts the significant two-way interaction
between ownship speed and intruder approach angle when measured by time to
CPA. Similar to the findings mentioned previously for the dOWN measurements,
the plot shows larger values for the slower ownship speed of 150 knots versus
the faster speed of 250 knots due to the difference in closure rate given the
intruder angle. Again we see an exception for the 000° or head-on angle where
the value trend reverses from all other angle-ownship speed differences. In the
head-on angle we see a significantly lower tCPA WCB value for the 150 knot
ownship speed as opposed to other angles and ownship speeds.

66
Figure 19a. Time to CPA for Intruder Types based on Ownship Speed in Low Traffic Level
150 kts 250 kts
Manned UAS
Tim
e t
o C
los
est
Po
int
of
Ap
pro
ac
h (
se
c)
Figure 19b. Time to CPA for Intruder Types based on Ownship Speed in Medium Traffic Level
150 kts 250 kts
Manned UAS
Tim
e t
o C
los
est
Po
int
of
Ap
pro
ac
h (
se
c)

67
Figure 20. Time to CPA by intruder Approach Angle between Ownship Speeds
Tim
e t
o C
los
est
Po
int
of
Ap
pro
ac
h (
se
c)
150kts 250kts

68
Subjective Metrics Results
Pilot post-simulation subjective questionnaires are listed by question type:
WCB perception, CDTI/CSD technology preferences, manned vs. unmanned
intruder types, UAS specific questions, and other pilot type opinions. The tables
below show responses given by pilots, broken down into percentages of overall
responses and also corresponding responses by pilot type. If any instance of
answer percentages does not sum to 100%, it was due to some questions being
omitted or misinterpreted by participants.
Table 5: Subjective Questions about WCB Perception
Question Overall Response Response by Pilot Type
What unit of measurement do you first think of when measuring the well clear boundary (WCB) from ownship position?
Distance = %32.4 Time = %35.3 Both = %32.4
ATP = %17.6 ATP = %41.2 ATP = %41.2
GA = %47.1 GA = %26.4 GA = %23.5
What affects your opinion of the WCB the most?
Closure Rate = %47.1 Intruder Angle = %11.8
Maneuverability = %17.6
ATP = %52.9 ATP = %5.9
ATP = %17.6
GA = %41.2 GA = %17.6 GA = %17.6
How do you believe WCB to be different from other similarly defined terms?
Varies Subjectively = %76.5 Has lower minimums = %5.9 VFR Conditions only = %8.9
ATP = %76.5 ATP = %5.9
ATP = %11.8
GA = %76.5 GA = %5.9 GA = %5.9
Do you feel comfortable with the current definition of Well Clear?
Yes = %55.9 No = %32.4
Depends (equipment/WX) = %11.8
ATP = %58.8 ATP = %35.3
ATP = %5.9
GA = %52.9 GA = %29.4 GA = %17.6
All scenarios measured WCB in 2D. What should the vertical WCB be?
1000' = %70.6 >1000 = %8.9
Too complicated = %26.5
ATP = %23.5 ATP = %23.5
ATP = %5.9
GA = %47.1 GA = %29.4 GA = %11.8
Rating Scale Questions (1 Strongly Disagree – 5 Strongly Agree)
Did you feel speed of ownship changed your perceived dimensions of the WCB?
4 ATP = 4.2 GA = 3.9
Do you believe traffic density in your surroundings affected your perception of WCB?
3 ATP = 2.9 GA = 2.5
In Table 5, it can be collectively observed that responses for how
participants primarily perceived the WCB indicated that they consider it to be a
factor of distance, time, or both. Yet, more than double the percentage of GA

69
pilots thought of the WCB as a measurement of distance. Almost double the
percentage of ATPs primarily thought of the WCB in terms of time, or
combination of time and distance than GA pilots did. When asked what affected
the WCB opinion the most, all pilot types mostly agreed closure rate was the
biggest factor over intruder angle or aircraft maneuverability. All pilots believed
the WCB to be different from other similar terms mainly because it varies
personally while other definitions have set parameters. Over half of overall pilot
responses showed they were comfortable with the current definition of Well
Clear. When asked what the vertical component of WCB should be most pilots
thought it should be 1000 feet vertical separation. ATPs were split in their want
between 1000 feet and greater than 1000 feet while most GA pilots agreed upon
1000 feet. Both pilot types strongly agreed that ownship speed affected WCB
dimensions. Pilots moderately agreed that background traffic density affected the
WCB.
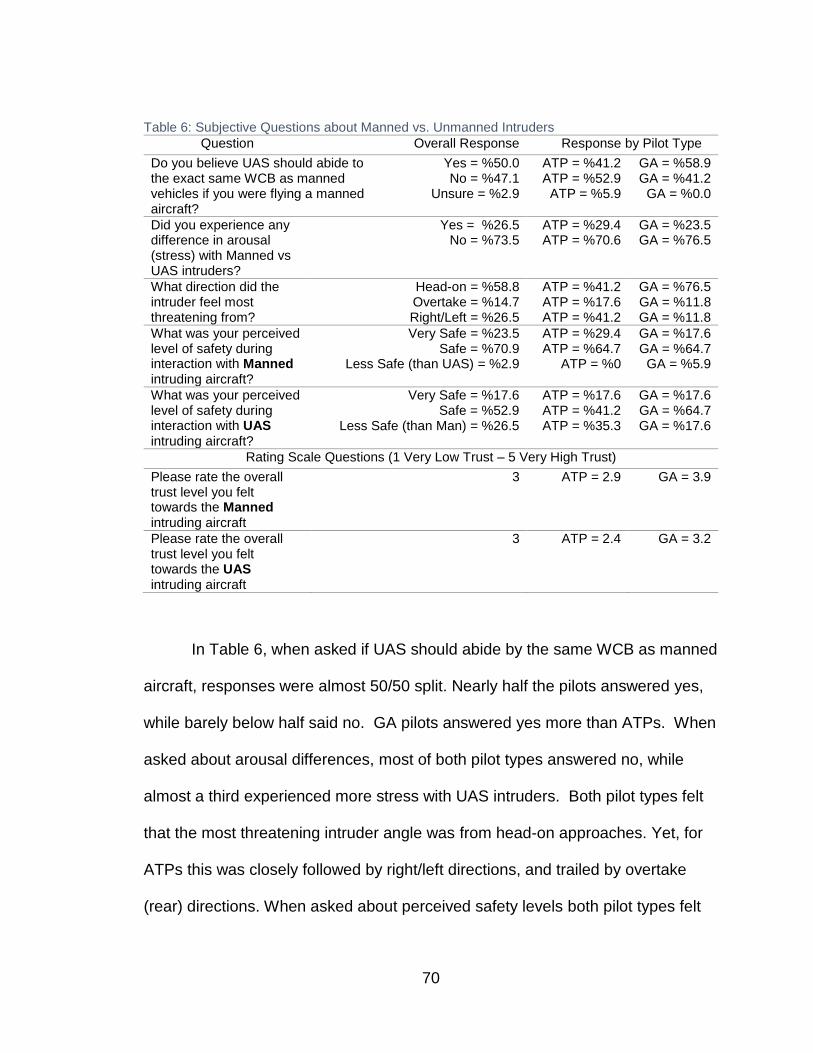
70
Table 6: Subjective Questions about Manned vs. Unmanned Intruders
Question Overall Response Response by Pilot Type
Do you believe UAS should abide to the exact same WCB as manned vehicles if you were flying a manned aircraft?
Yes = %50.0 No = %47.1
Unsure = %2.9
ATP = %41.2 ATP = %52.9
ATP = %5.9
GA = %58.9 GA = %41.2
GA = %0.0
Did you experience any difference in arousal (stress) with Manned vs UAS intruders?
Yes = %26.5 No = %73.5
ATP = %29.4 ATP = %70.6
GA = %23.5 GA = %76.5
What direction did the intruder feel most threatening from?
Head-on = %58.8 Overtake = %14.7 Right/Left = %26.5
ATP = %41.2 ATP = %17.6 ATP = %41.2
GA = %76.5 GA = %11.8 GA = %11.8
What was your perceived level of safety during interaction with Manned intruding aircraft?
Very Safe = %23.5 Safe = %70.9
Less Safe (than UAS) = %2.9
ATP = %29.4 ATP = %64.7
ATP = %0
GA = %17.6 GA = %64.7
GA = %5.9
What was your perceived level of safety during interaction with UAS intruding aircraft?
Very Safe = %17.6 Safe = %52.9
Less Safe (than Man) = %26.5
ATP = %17.6 ATP = %41.2 ATP = %35.3
GA = %17.6 GA = %64.7 GA = %17.6
Rating Scale Questions (1 Very Low Trust – 5 Very High Trust)
Please rate the overall trust level you felt towards the Manned intruding aircraft
3 ATP = 2.9 GA = 3.9
Please rate the overall trust level you felt towards the UAS intruding aircraft
3 ATP = 2.4 GA = 3.2
In Table 6, when asked if UAS should abide by the same WCB as manned
aircraft, responses were almost 50/50 split. Nearly half the pilots answered yes,
while barely below half said no. GA pilots answered yes more than ATPs. When
asked about arousal differences, most of both pilot types answered no, while
almost a third experienced more stress with UAS intruders. Both pilot types felt
that the most threatening intruder angle was from head-on approaches. Yet, for
ATPs this was closely followed by right/left directions, and trailed by overtake
(rear) directions. When asked about perceived safety levels both pilot types felt

71
much safer with manned intruders over UAS. Yet, GA pilots showed an even split
in opinion. When asked to rate perceived trust levels between intruder types,
both pilot types trusted manned and UAS evenly. GA pilots showed higher trust
ratings. When dissected by pilot type the responses showed slightly higher
ratings for manned trust than UAS intruders overall.
Table 7: Subjective Questions UAS Specific
Question Overall Response Response by Pilot Type
Do you feel confident that the UAS can abide by current WCB definition autonomously?
Yes = %35.3 No = %55.9
Depends on equipment = %11.8
ATP = %29.4 ATP = %58.8 ATP = %11.8
GA = %41.2 GA = %52.9 GA = %11.8
Would your WCB change if there were 2 or more UASs involved instead of just one?
Yes = %35.3 No = %55.9
Maybe = %8.8
ATP = %58.8 ATP = %29.4 ATP = %11.8
GA = %11.8 GA = %82.4
GA = %5.9
How do you feel in terms of the safe integration of UAS’s into our national airspace system?
Safe if proven = %34.7 Unsafe/complicates things = %23.5
Mixed feelings = %11.8
ATP = %64.7 ATP = %29.4 ATP = %23.5
GA = %64.7 GA = %17.6 GA = %17.6
In Table 7, we can see when asked if UAS could autonomously abide the
current WCB definition, over half of all pilots and pilot types said no with a higher
yes answer percentage for GA pilots over ATPs. When asked if their WCB would
change if two or more UASs were involved, half of all pilots said no. When
broken down by pilot type most GA pilots said no, while over half of ATPs said
yes. When asked how they felt about UAS integration, most pilots answered
safe if proven. A lower percentage felt that it was unsafe, with more ATPs than
GA pilots offering the response of unsafe.

72
Table 8: Subjective Questions about CDTI/CSD Technology
Question Overall Response Response by Pilot Type
What system (if any) do you primarily use as a CDTI?
TCAS = %41.2 Other = %11.8 None = %47.1
ATP = %76.5 ATP = %17.6
ATP = %5.9
GA = %5.9 GA = %5.9
GA = %88.2
Do you feel your current CDTI display is adequate enough to allow safe perception of WCB?
Yes = %26.5 No = %26.5
N/A (Mostly GA) = %47.1
ATP = %52.9 ATP = %41.2
ATP = %5.9
GA = %0.0 GA = %11.8 GA = %88.2
Do you envision yourself relying more on a CDTI to maintain the WCB, or out-the-window view?
CDTI = %58.8 Out-the-Window = %38.2
ATP = %47.1 ATP = %52.9
GA = %70.6 GA = %23.5
Rating Scale Question (1 Strongly Disagree – 5 Strongly Agree)
Did the CSD have positive impact on WCB perception compared to your CDTI?
4 ATP = 3.9 GA = 3.9
As can be seen in Table 8, although most GA pilots did not have any experience
with a CDTI while most ATPs did. For ATPs, when asked if their current display
was adequate for WCB perception, more than half said yes with just over 40%
said no. Pilots were also asked if they envisioned themselves primarily utilizing a
CDTI or out-the-window view to maintain WCB, and most answered they would
use a CDTI. All pilots strongly agreed that the CSD was better for WCB
perception compared to their current CDTI or other detection method.
Table 9: Subjective Question about WCB Opinion of other Pilot Type
Question Response
ATP Pilots Only – Do you believe pilots with less experience than you would have a different opinion of the WCB?
Yes = %94.1 No = %5.8
Maybe = %0.0
GA Pilots Only – Do you believe pilots with more experience than you would have a different opinion of the WCB?
Yes = %41.2 No = %29.4
Maybe = %29.4

73
Table 9 shows that all ATPs except one agreed yes to the question, while
GA pilots often responded yes with an equal split response between no and
maybe.
Subjective WCB Map Drawings
After all subjective and objective data collection took place, pilots were
asked to draw their version of a WCB map in terms of distance surrounding
ownship. The only instruction given was to draw it as they saw fit on a blank map
that only had ownship in the center as well as two range rings for scale, and to
indicate a range on one of the range rings to help gauge the drawing’s WCB size.
They were asked to draw two maps, one for manned, and one for unmanned
intruders. This hand-drawn map was done to visualize pilot’s top down view of
the WCB, as well as further depict any differences that intruder type had on the
WCB. Drawings were first grouped by shape type, then by WCB size, and tallied
accordingly. Full depictions of every map can be seen in Appendix Section C.
Maps were categorized initially by three general shape categories: greater
distance in front with less in rear, circular, and other. An example of each can be
seen below in Figures 21, 22, and 23.

74
Figure 21. WCB drawing example – greater distance in front with less in rear
Figure 22. WCB drawing example – circular

75
Table 10: WCB Drawing Shape Summary
WCB Drawing general Shape Overall ATPs GA Pilots
Greater distance in front, less in rear
%50.0 %47.1 %52.9
Circular %41.2 %47.1 %35.3
Other %8.8 %5.9 %11.8
As we can see in Table 10, overall half of both pilot types depicted WCB
maps with greater distance in front and less in the rear. This percentage was
slightly higher with GA pilots than ATPs. Circular WCB maps closely followed for
both pilot types, matching the percentage for greater in front less in rear for
ATPs, and consisting of about 1/3 of the opinion for GA pilots. WCB maps
classified as “other” made up a very small percentage, and serve to illustrate how
differently humans can think and vary their opinion even when given the same
information.
Figure 23. WCB drawing example – other
76
Discussion
The purpose of this thesis research was to determine how different pilot
types perceived the subjective concept of the Well Clear Boundary, and to
observe if that boundary changed when dealing with manned versus unmanned
aircraft. The present study used an 8 x 2 x 2 x 2 x 2 mixed design that included
four repeated-measures factors and a single between-subjects factor.
Independent manipulations consisted of intruder approach angle (8 angles every
45° surrounding ownship), intruder type (manned vs. UAS), ownship speed (150
knots vs. 250 knots), traffic level (4 background aircraft vs. 8 background
aircraft), and the between-subjects variable of pilot type (Commercial/ATP vs. GA
pilots). The effects of these variables were assessed through objective measures
of distance from ownship and time to closest point of approach, as well as
subjectively through custom questionnaires to gauge overall perception of the
WCB.
The Well Clear Boundary
To quantifiably determine pilot perception of the WCB, experimental data
were recorded in a part-task CDTI simulator. WCB was determined by
simulating multiple intruding aircraft set on a collision course with participants’
ownship as indicated on the display. Pilots indicated the WCB by clicking a
mouse button when an intruder was felt to no longer be well clear from them, with
each trial representing a different combination of independent variables present

77
during encounters from 8 angles surrounding ownship. Recording the position,
trajectory, and speeds of ownship and intruders allowed the WCB to be
calculated in two ways.
The dOWN Metric. The first method of calculating the WCB was by
distance from ownship (dOWN), in other words an own-ship-centric metric with
ownship located in the middle of a surrounding boundary measured in feet from
ownship to intruding aircraft crossing the WCB. Overall, when measured by
dOWN, the WCB followed the findings and propositions of suggested WCB
definitions, with a much larger distance value in front of ownship compared to the
rear. In this experiment, the WCB was found to average 35,701 feet directly in
front of ownship, while it was 15,559 feet directly behind the aircraft. The two
angles 45° to the left and right of ownship nose averaged 29,362 and 29,454 feet
respectively, while the two angles 45° to the left and right of the rear of ownship
measured 20,399 and 20,711 respectively. The 90° angles right and left of
ownship measuring 25,909 and 25,781 respectively. We can observe an obvious
pattern of greater values in the front with lower values in the rear of ownship are
evident when measured in dOWN. Of course, this is due to difference in closure
rates from these different angles. However, notice the extreme lower variability
(as in the difference from angle to angle in dOWN values) in distance values for
the 90° sides and all rear angles as opposed to the high degree of variability of
the 3 angles in front of the aircraft. This could be key in fully understanding pilot
perception of the WCB in terms of direction and distance.

78
The WCB measured in dOWN also displayed differences when collapsed
across different independent variables. When WCB measurements were
compared by pilot type, GA pilots averaged a larger value for every angle than
ATPs did. This could be due to the fact most GA piloting experiences involve
flying smaller aircraft at lower altitudes and slower airspeeds than ATPs.
Therefore, they are not only more accustomed to having more time to react, but
they are also used to an environment of looser ATC control over their aircraft
since they travel in class E (uncontrolled airspace) much more frequently than
ATPs in scheduled airlines. Additionally, most GA pilots did not have experience
with cockpit traffic display technology of any kind and consequently rely on out-
the window visual monitoring to avoid aircraft. Since this experiment only had a
CDTI view (no out-the-window), perhaps GA pilots were more conservative in
their WCB interpretations due to lack of CDTI experience.
The most significant differences in WCB dOWN appeared between the
alternate ownship speeds tested. Ownship speed was present in all dOWN
significant interactions, clearly having a strong effect on the WCB. Faster speeds
yielded a larger WCB value for every approach angle. At 250 knots ownship
speed all pilots pushed out the WCB in every angle, but especially at the front
45° left and right of their nose. These angles (315° and 45° relative to ownship)
showed differences of nearly 4000’ as opposed to approximately 1000’ for other
angles. This indicates the importance of the forward 45° angles from ownship
nose in pilots’ WCB perception. This may be not only be because intruders

79
approaching from the front have a high closure rate, but because they likely
would have a hard time judging an aircraft’s distance and direction from these
angles. For example, if an intruding aircraft is turning at these angles, the
direction that it starts turning in may be difficult to interpret due to relative motion
between ownship and intruder. If the intruder turned to the right, while ownship
moved forward, the intruder may turn at a rate that appears to have no relative
motion if their turn is gradual enough. This can add confusion since intruders with
no relative motion in the sky are of the most danger since this indicates they can
be heading straight for ownship. However the intruder turn could continue to the
right and change visual relative motion cues often during its maneuver, creating
the potential to mislead.
Another interesting dOWN WCB finding had to do with differences
between intruder types. Although significant differences in intruder type
depended on ownship speed which differed across pilot type, the manned
intruders had slightly larger values for the head-on and rear approach angles, as
well as the 90° and 270° angles than UAS intruders. Yet, the manned intruders
had slightly smaller values for the 315°, 45°, 225°, and 135° angles than UAS.
While the differences may not be great between intruders for most angles
(approx. 500-1000’), the biggest difference was in the 315° and 45° angles which
varied almost 2000’ each. The patterns of these results are a bit scattered, but
also show the importance of the pilots’ perception of the forward 45° left and right

80
of their nose. This difference is perhaps due to a mix in opinions of trust about
manned versus unmanned intruders, which the subjective metrics also revealed.
The main effects for the dOWN metric were found to be most significant
with intruder approach angle. This is not surprising considering how much the
WCB varies in value depending on direction surrounding ownship. The main
effect of ownship speed closely followed, and this trend is evident in Figures 10
and 11 even before statistical analysis was applied, showing how deeply ownship
speed impacts the dOWN WCB from all angles, with greater speeds increasing
WCB size. The background traffic level also was a dOWN main effect, not as
significantly as the others, but still an important finding. This IV had significance
of just under p=.05, visible in Figures 14 and 15 showing slightly smaller dOWN
WCB values in the medium background traffic than the low traffic level scenarios.
The tCPA Metric. The second method of calculating the WCB was by
time to closest point of approach (tCPA), which, unlike dOWN, is not an ownship
centric metric. It involved measuring the time until the intruder aircraft reaches its
closest point of approach (or in the case of this research, collide) with ownship.
In this experiment, the tCPA WCB was found to average 38 seconds directly in
front of ownship, while it was 149 seconds directly behind the aircraft. The two
angles 45° to the left and right of ownship nose both averaged 46 seconds, while
the two angles 45° to the left and right of the rear of ownship both averaged 67
seconds. The 90° angles right and left of ownship measured 52 and 51 seconds
respectively. The differences found in the tCPA metrics when collapsed across

81
independent variables correlate precisely with the dOWN metric findings, but with
one fundamental difference. All tCPA results essentially assumed a mirrored
shape of the dOWN WCB shape across the horizontal axis. In other words,
greater tCPA values were found behind the ownship with much smaller values
located towards the front of ownship. Again, this is due to differences in closure
rates. Since intruding aircraft approaching from the front of ownship had such
high closure rates, their time until collision was very short. Conversely, the
intruders approaching the rear of ownship had an extremely slow closure rate
with extremely high time values until collision.
One interaction unique to the tCPA metric is the four-way interaction
observed among intruder type, traffic level, ownship speed, and intruder
approach angle. When interacting with manned intruders, this interaction shoes
both pilot types averaging a significantly larger tCPA when traveling at the lower
speed of 150 knots for all intruder approach angles, except the head-on angle. In
the head-on angle we can see a lower tCPA value compared to all other angles.
This head-on value difference is even more drastic in the GA pilot data than
ATPs. We can also see that ownship speed had less of an effect on tCPA for GA
pilots in this interaction. Interestingly, when interacting with UAS intruders, this
interaction shows the head-on value difference being more drastic in the ATPs’
when compared to the GA pilots. Additionally, we can see that ownship speed
had less of an effect on tCPA for GA pilots than for ATPs with UAS intruders.
Aside from the differences in intruder type tCPA values across pilot types in this

82
four-way interaction, we can see that the effect of ownship speed had greater
differences in tCPA values with ATPs with manned intruders compared to ATPs
with UAS intruders. This is true for all angles except for the head-on condition
where the opposite is true.
The results regarding this head-on angle obscurity may be due to the fact
that when traveling at 150 knots, there is much more time to react before a
collision in the head-on scenarios than when traveling 250 knots. Thus, pilots
may have allowed for a much lower tCPA value in the 150 knot conditions
without feeling less safe. The results regarding ownship speed affecting ATPs
more with manned versus unmanned intruders may have to do with ATPs
expectation of UAS reaction time and abilities. They may perceive these
automated machines as being able to potentially react more quickly and
maneuver in a more agile manner than manned aircraft can.
The main effects observed with the tCPA metric were found with intruder
approach angle, and ownship speed just as was seen with the dOWN metric.
However, the tCPA metric showed no main effect with background traffic level as
the dOWN metric did. This is not surprising, since the dOWN metric was
measured more precisely due to less rounding and finer incremental units (tens-
of-thousands of feet versus rounded whole-seconds) and because it just made
the cutoff for dOWN significance (p= .045 out of .05).

83
Although the differences in the tCPA metrics for all independent variables
are consistent with differences observed with the dOWN metric, they do shine
light on an important factor. Opposite of the dOWN metric, the tCPA metric
showed the highest degree of variability in the intruder angles approaching from
the rear of ownship. Inversely, intruders approaching from angles in front of
ownship displayed a low degree of variability (as in the difference from angle to
angle in tCPA values). Again, this pattern of variability may be vital in
comprehending how the WCB is perceived. Pilots may consider metrics they can
easily interpret on a traffic display as their primary indicators for determining the
WCB, even if that means using different metrics given different intruder approach
angles surrounding ownship.
Subjective Questionnaire Responses. Responses about WCB
perception unveiled that pilot’s think of the WCB as a factor of distance, time, or
both overall. This is logical since closure rate is a result of time and distance
relationship. However, more than double the percentage of GA pilots primarily
thought of the WCB as a measurement of distance compared to ATPs, while
almost double the percentage of ATPs thought of the WCB in terms of time, or
combination of time and distance than GA pilots did. This sharp contrast could
again be due to differences in flight environments each pilot type is used to. GA
pilots move slower and have more time to deal with potential conflicts, more often
using distance as a mental model for separation since their speed and distance
84
values are relatively smaller. ATPs move faster and therefore quantify aircraft
separation more easily by time since distance and speed values are so great.
In terms of what affected the WCB opinion the most, closure rate was the
biggest subjective factor, considerably more so than intruder angle or aircraft
maneuverability. This was the case for both pilot types. Across the board, pilots
believed the WCB to be different from other similar terms (mentioned above in
section entitled “Similar Terms and Concepts”) primarily because it subjectively
varies as other definitions do not. Surprisingly, over half of overall pilot and
between pilot type responses showed they were comfortable with the current
definition of Well Clear. This may be because pilots like self-separating under
their own jurisdiction to take into account the variability of the current Well Clear
interpretation. Since the current study only considered lateral WCB, when asked
what the vertical component of WCB should be over 70% of overall pilots thought
it should be 1000 feet vertical separation, with ATPs split in their want for 1000
feet and being greater than 1000 feet. The majority of GA pilots agreed upon
1000 feet. 1000 feet is the standard vertical separation margin for most
instances in controlled airspace, so no surprise here since it has been an
effective margin for years. All pilots strongly agreed that ownship speed affected
WCB dimensions, which aligns with the statistically significant effect of ownship
speed effect on WCB. Pilots moderately agreed that background traffic density
affected the WCB, which also parallels with the statistical findings of traffic level
effect on WCB.
85
The next set of questions was asked to study intruder type differences.
When asked if UAS should abide by the same WCB as manned aircraft, there
was almost a 50/50 split in responses. Overall almost half of the pilots said yes,
while just under half said no. Interestingly, GA pilots provided slightly more yes
answers while ATPs answered more no’s. This could possibly be because GA
pilots averaged a younger age, and have spent more of their adolescence
surrounded by more intelligent and reliable computer systems then their ATP
counterparts, allotting more trust in UAS while ATPs have seen many upgrade
iterations in their cockpits and witnessed the success and failures of them all first
hand. Also, ATPs typically have more lives at stake when they fly perhaps giving
reason to their decreased UAS trust.
When asked about arousal (i.e. stress level) differences between intruder
types, over 70% of all pilots answered they experienced no difference, while 30%
or less experienced more stress with UAS intruders. This is an important finding
because it indicates a fairly large portion of pilots may feel uncomfortable or more
stressed with UAS traffic encounters, which is something the FAA must take into
account during integration. The most threatening overall intruder angle was
mostly felt to be from head-on approaches. This was followed by right/left
directions, and trailed by overtake (rear) directions. This is logical and follows suit
with the hierarchy of closure rates across intruder angles.
When asked about perceived safety levels between intruder types, overall
pilots felt much safer with manned intruders than UAS. However, GA pilots

86
appeared to feel slightly safer with UAS than ATPs did. Conversely, , when
asked to rate perceived trust levels between intruder types, although overall
pilots trusted both manned and UAS evenly, GA pilots had generally higher trust
and showed slightly higher ratings for manned intruder trust than UAS. These
findings not only show how spread out the opinion of manned versus UAS traffic
can be, but also shows GA pilots vary more in their opinion than the ATPs. This
must be taken into account when integrating UAS into the NAS, as different
classifications of airspace may have different WCBs depending on which pilots
consist of the majority in that given airspace.
UAS specific questions were asked to uncover more information on UAS
interaction. When asked if UAS could autonomously abide by the current WCB
definition, over half of all pilots and pilot types said no. But, there was a higher
yes answer percentage for GA pilots over ATPs, again displaying the overall
trend of GA pilots having more faith in UAS than ATPs did. Since all trials
involved at most only one UAS intruder, when asked if their WCB would change
if two or more UASs were involved overall half of the pilots said no. However
when broken down by pilot type over 80% of GA pilots said no, while almost 60%
of ATPs said yes. This is trend seems opposite of previous mentioned higher GA
trust in UAS, and yields the need for further exploration of how multiple UAS
interactions would affect the WCB. Finally, when asked how they felt about UAS
integration, most pilots answered safe if proven. This answer was closely
followed by unsafe feelings, believing UAS integration complicates things. More
87
ATPs answered the latter response in this question than GA pilots, representing
the common trend of higher GA trust with UAS again.
The next set of questions were asked to find opinion of how our lab’s
version of a CDTI, our CSD, and other CDTIs would affect WCB perception.
Although nearly 90% of the GA pilots did not have any experience with a CDTI,
most ATPs did and they mainly had experience with the Traffic Collision
Avoidance System II (TCAS II) that is largely used in airlines. For ATPs, when
asked if their current display was adequate for WCB perception, more than half
said yes, but just over 40% said no. Pilots were also asked if they envisioned
themselves primarily utilizing a CDTI or out-the-window view to maintain WCB,
and across the board most answered they would use a CDTI. As most ATPs use
a CDTI today anyway, this is not surprising. Overall, all pilots agreed that our
lab’s CSD had a positive impact on WCB perception compared to their current
CDTI or other detection method.
The final set of subjective questions asked ATPs if they believed pilots
with less experience, and GA pilots if they believed pilots with more experience
would have different opinions of the WCB. All ATPs but one agreed yes to the
question, while GA pilot opinion varied with most responses saying yes and an
equally split response rate between no and maybe. This again displays the
uniformity of ATP opinions while GA pilots tend to have a more diverse thinking
process perhaps due to their lesser flight experience and perhaps less uniform
training.

88
After all other data collection was complete, subjective WCB drawings
were completed. Half of all pilots depicted a greater distance in front of ownship
with less distance in their drawings. Slightly more GA pilots drew g this shape
than ATPs. This general shape was closely followed by circular WCB drawings
with ownship equidistant from all WCB points regardless of the angle. However,
ATPs showed a nearly 50/50 split between the greater in front, less in rear and
the circular depictions. The other category consisted of very few WCB drawings
and displayed some peculiar shapes which prove difficult to classify.
Future Research Recommendations
Future research should be conducted to properly determine how pilots
perceive the WCB, and should include additional metrics to uncover increased
breadth and depth in the definition of this construct. Vertical WCB should be
included since it is a highly dynamic factor requiring careful research. It can
change everything about potentially altering the WCB dramatically if intruding
aircraft ascend or descend at rapid rates from different approach angles.
Investigating the effects of multiple instead of just single UAS intruders would be
crucial to UAS integration into the NAS, as UAV usage will only continue to
increase and imminently yield high density UAS environments. This research
only considered 8 intruder approach angles, and increasing this number of
angles to 16, 32, or more could provide a picture of higher WCB fidelity and
would be extremely valuable. Also, examining how the WCB is affected by more
dynamic flight environments (as this research only took place in optimal

89
conditions) such as crosswinds and weather phenomena, as well as more
complex airspace such as class B, C, or D airspace (as this research took place
in class E, or uncontrolled airspace) would be of great worth since pilots often
deal with non-optimal and busy conditions. Finally, it would be important to
measure UAS pilot perspective of the WCB, as they are more removed from the
situation than the manned aircraft pilots in this research. Their WCB opinion
would help contrast differences in manned versus UAS perception and could
uncover issues before they arise in a real world setting.
Conclusion
The purpose of this thesis research was to determine how different pilot
types perceived the Well Clear Boundary, and to observe if the WCB changed
when dealing with manned versus unmanned aircraft. This research was
successful in addressing the research questions, finding several significant main
effects and interactions. It is vital to realize that the findings in this research were
all for pilots in a part task environment, without them preforming the primary task
of flying as they normally would. While flying, utilizing a CDTI as they did in this
study would be a secondary task in real-world scenarios, therefore potentially
changing WCB results. This fact does not degrade the current research, as
these findings lay the framework for human perception of the WCB in a simple
experimental setting despite lacking the complexity that real flying involves.

90
The first research question attempted to uncover what the WCB is for
civilian pilots. We now have objective metrics for the subjective concept of Well
Clear. The next question revolved around determining the perception of the WCB
and if it differs between General Aviation pilots and Commercial ATPs. The
answer is yes; the effect of intruder type depends on ownship speed, and that
differs across pilot type when measured by dOWN. It was also asked if the WCB
differs when pilots interact with manned versus unmanned aircraft. It was found
that the effect of intruder type depends on traffic level and ownship speed, and
that effect differs across intruder approach angles when measured by tCPA. This
research also revealed that the effect of intruder type depends on traffic level
which differs across ownship speeds when measured in tCPA. In terms of what
other parameters affected the perception of WCB, it was found that the effect of
ownship speed depended on intruder approach angle when measured in dOWN.
There were also several main effects evident. dOWN measurements displayed
main effects with ownship speed, intruder angle, and background traffic level,
while tCPA main effects were observed with ownship speed and intruder angle.
Subjective findings uncovered an important trend, that even though GA
pilots indicated a larger average WCB, they tended to rate UAS aircraft with
higher trust and safety ratings than ATPs did. GA pilots also appeared to have
more diverse responses than ATPs did, where ATPs had more similar and
uniform language in their answers. These subjective findings indicate
fundamental differences in pilot experience levels, showing how their perceptions
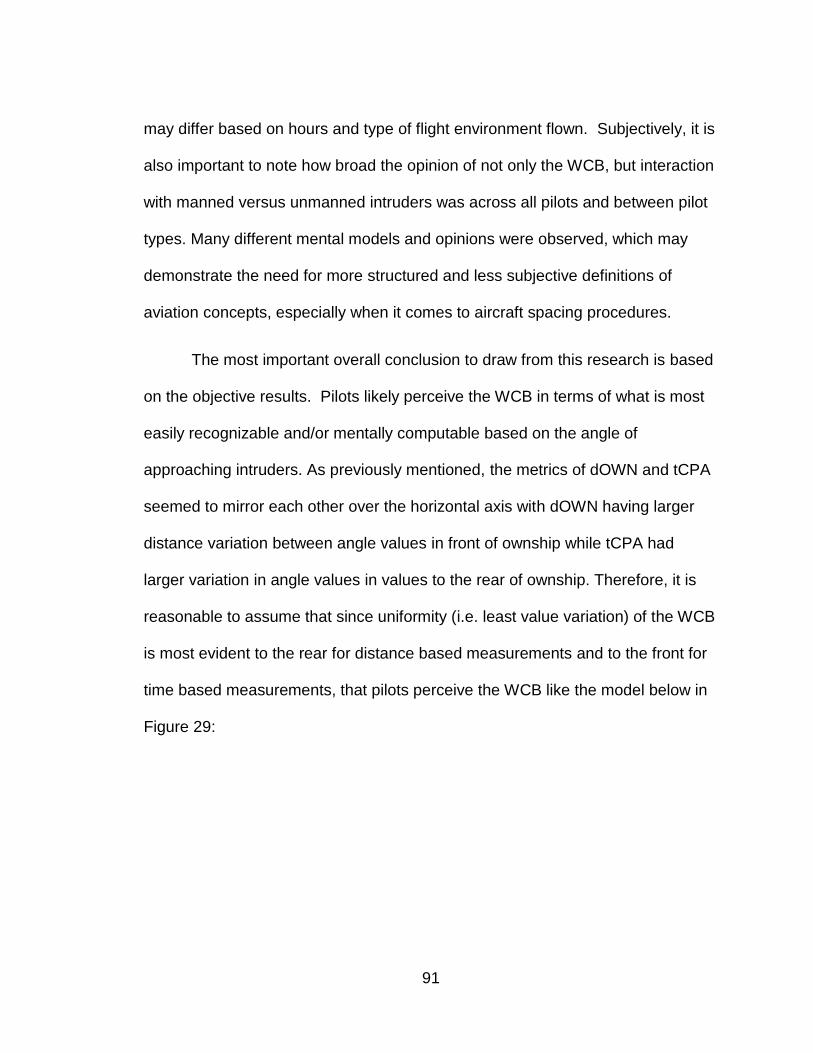
91
may differ based on hours and type of flight environment flown. Subjectively, it is
also important to note how broad the opinion of not only the WCB, but interaction
with manned versus unmanned intruders was across all pilots and between pilot
types. Many different mental models and opinions were observed, which may
demonstrate the need for more structured and less subjective definitions of
aviation concepts, especially when it comes to aircraft spacing procedures.
The most important overall conclusion to draw from this research is based
on the objective results. Pilots likely perceive the WCB in terms of what is most
easily recognizable and/or mentally computable based on the angle of
approaching intruders. As previously mentioned, the metrics of dOWN and tCPA
seemed to mirror each other over the horizontal axis with dOWN having larger
distance variation between angle values in front of ownship while tCPA had
larger variation in angle values in values to the rear of ownship. Therefore, it is
reasonable to assume that since uniformity (i.e. least value variation) of the WCB
is most evident to the rear for distance based measurements and to the front for
time based measurements, that pilots perceive the WCB like the model below in
Figure 29:

92
Since the rear of ownship experiences a low closure rate with low distance
and high time to collision values, distance may be easier and quicker to mentally
calculate for pilots. Conversely, to the front of ownship where a high closure rate
with large distances and low times are evident, time may be easier and quicker to
mentally calculate for both pilot types. This finding is supported objectively and
subjectively in the data and is instrumental in the future integration of UAS into
the NAS. It would mean that in defining the WCB for manned aircraft, pilots are
more comfortable knowing time separation in front and distance separation to the
rear. Therefore pilots may better perform separation procedures knowing specific
types of intruder information depending on relative angle surrounding their
aircraft, as opposed to a static and finite WCB metric encircling them. Beyond the
concerns of the WCB, this data can also be used to help ATC better understand
pilots’ perception of intruders encroaching their airspace, improving their aircraft
Time
Distance
Figure 24. Pilot WCB Perception – Time in Front and by Distance to Rear

93
spacing tactics by advising pilots using angle and metric combinations that they
can most efficiently comprehend.
To compare the current findings to other proposed WCB definitions
mentioned in the introduction, it is important to consider that the current research
was only concerned with measuring the WCB in the lateral plane of three-
dimensional space. Other proposed definitions were generated without ignoring
the vertical plane dimensionality, therefore potentially allowing for smaller WCB’s
since an additional dimension of space is available for pilots to maneuver in (i.e.
diving or climbing around an intruder). With that in mind, Figure 1 depicts a tCPA
WCB having a larger area in the front of ownship, and a smaller distance-based
WCB encircling ownship. This definition incorporates distance and time, giving
different shapes for each metric. Similar concepts to the present research are
evident, and it can be observed that the Figure 1 definition recognizes the need
to have different WCB based on using time or distance. Figure 2 depicts two Tau
values (range and vertical tau) that when combined amount to a positive
numerical value when intruders converge with a UAS, and a negative value upon
their divergence, representing an approximation of time to CPA or tCPA. These
tau values incorporate elements of distance and time, but blend the two metrics
together mathematically. The current findings indicate that combining metrics is
useful for human pilots depending on directionality, however this Figure 2
definition was developed for UAS aircraft only which is why combining metrics
mathematically is acceptable for the UAS on-board computers and sense and
94
avoid capabilities. Also, the Figure 2 equations only work in the case of a direct
collision course with a straight line of intersection. While this research procured
WCB measurements that were only tested with straight line intruder
intersections, these measurements are applicable to curved intersection paths as
well.
Comparing the present research’s WCB to the proposed definition in
Figure 3 known as “Ellipsoid defined by Tau with tapered vertical separation,” it
uses a tapered vertical separation to avoid “nuisance” alerts resulting from
intercepting aircraft that may have enough vertical separation to properly evade
each other, but still cause alerts. This model is difficult to compare to the present
research due to the heavy influence of vertical tapered separation, however in
Figure 3 the attempt to incorporate elements of distance and time are present by
the arrows indicating adjustment for closure rate (which is a time based metric)
as well as the horizontal protection (a distance based metric). Finally, to
compare this research to the MIT model in Figure 4, their model was entirely
distance based. However, the model is similar to this research since it uses real
data generated from actual pilots, and is concerned with manned-ownships only.
What sets it apart (aside from having a distance metric only) is it does not take
into account any encounters involving manned and UAS together. Having said
that, the tear-drop shape it depicts (lager distance in front of ownship, smaller in
the rear) mirror very closely to what this research measured when considering
the overall WCB shape. Also, the size of the MIT WCB shown in Figure 4 is

95
much smaller than what this research measured, with theirs extending out in
excess of only 8,000 feet compared to the 35,000 seen here in front of ownship.
The current thesis research has provided scientific data on the perception
of Well Clear, as well as how that differs across pilot types and manned versus
unmanned intruders. This could be considered by comities, research initiatives,
and regulatory bodies that are currently contributing to the NextGen airspace
infrastructure. This is because current resources that provide guidance and make
decisions on the issue of Well Clear such as SC 228, various FAA resources
including the Airman’s Information Manual, Advisory Circulars, FAA library
articles, as well as research entities like MIT and other universities have rarely
considered the human pilot opinion in the matter. They have tended to base
separation standards off of ATC preferences, FAA traffic data, and subject matter
expertise (FAA, 1983; FAA, n.d.; FAA, 2014; Weibel, Edwards, & Fernandes,
June, 2011). These are all vital and well established sources, yet they often lack
the principles and findings of Human Factors science, as well as the perceptional
preferences among different pilots interacting with varying technologies.
With present UAS regulations, incidents of UASs technologies crashing
and colliding with manned aircraft (Reed, 2011; The Washington Post, 2014;
Drone Wars UK, 2013) have been witnessed. UAS integration into the NAS will
also be an even bigger issue for GA pilots, as they deal with less aviation
technology, less experience levels, rely more heavily on visual avoidance
procedures, and are allowed more flight path freedom than ATP pilots operating

96
in commercial airlines (Goyer, 2012). Therefore, this thesis data can assist in
making future decisions about Well Clear definitions regarding multiple pilot
types, and can help decisions about UAS operational parameters when flying in
close proximity to other manned aircraft by providing quantitative human pilot
perception and qualitative insight on the matter.
If pilots’ mental models truly follow the rationale suggested by this
research, future sense and avoid systems aboard UAS as well as traffic collision
avoidance systems need to consider these human factors findings. Perhaps
UAS could gain higher acceptance and trust ratings if they are able to provide
this approach-angle-relevant information, as well as intruder intent information
such as upcoming route changes, to manned pilots sharing their airspace.
Through this, we can best design technology around the needs of human
operators in order to prevent confusion, mistrust, and accidents in our airspace
given the increase of air traffic that is projected. This research can contribute to
creating a more efficient, intelligent, and most of all safer environment for
tomorrow’s airspace.

97
References
Aircraft Owners and Pilots Association. (2011, March 25). FAA Certificated Pilots
by State and Certificate Type. Retrieved from Aircraft Owners and Pilots
Association: http://www.aopa.org/About-AOPA/Statistical-Reference-
Guide/FAA-Certificated-Pilots-by-State-and-Certificate-Type.aspx
Comerford, D. (2004). Recommendations for a Cockpit Display that Integrates
Weather Information with Traffic Information.
Cook, S., & Davis, D. (2013, December 3). SARP Well Clear Kickoff Summary.
Cooke, N. J. (2006). Human Factors of Remotely Operated Vehicles. Human
Factors and Ergonomics Society Annual Meeting (pp. 166-169). Mesa,
Arizona: Human Factors and Ergonomics Society.
Drone Wars UK. (2013, December 31). Drone Crash Database. Retrieved from
Drone Wars UK: http://dronewars.net/drone-crash-database/
FAA. (2013, July 26). Unmanned Aircraft (UAS) Questions and Answers.
Retrieved from faa.gov:
http://www.faa.gov/about/initiatives/uas/uas_faq/#Qn1
FAA. (2013, May 13). What is NextGen? Retrieved from faa.gov:
http://www.faa.gov/nextgen/why_nextgen_matters/what/
FAA. (2014, January 6). Fact Sheet – Unmanned Aircraft Systems (UAS).
Retrieved from Federal Aviation Administration:
http://www.faa.gov/news/fact_sheets/news_story.cfm?newsId=14153
FAA. (2014, January 30). Unmanned Aircraft Systems (UAS). Retrieved from
faa.gov: http://www.faa.gov/about/initiatives/uas/
Federal Aviation Administration . (2014, April 3). Order JO 7110.65V. Retrieved
from faa.gov: https://www.faa.gov/documentLibrary/media/Order/ATC.pdf
Federal Aviation Administration . (n.d.). How to Avoid a Mid Air Collision - P-
8740-51. Retrieved from faasafety.gov:
http://www.faasafety.gov/gslac/ALC/libview_normal.aspx?id=6851
Federal Aviation Administration. (1983, March 18). AC 90-48C - Pilots' Role in
Collision Avoidance. Retrieved from faa.gov:
http://www.faa.gov/documentLibrary/media/Advisory_Circular/AC90-
48c.pdf

98
Federal Aviation Administration. (2005). Pilot-Based Spacing and Separation on
Approach to Landing: The Effect on Air Traffic Controller Workload and
Performance. Atlantic City,NJ: Federal Aviation Administration, William J.
Hughes Technical Center . Retrieved from Pilot-Based Spacing and
Separation on Approach to Landing: The Effect on Air Traffic Controller
Workload and Performance.
Goyer, R. (2012, February 7). Drones A Coming Crisis for GA. Retrieved from
Flying Magazine: http://www.flyingmag.com/blogs/going-direct/drones-
coming-crisis-ga
Howell, D. (2008). Fundamental statistics for the behavioral sciences. Belmont,
CA: Thomson/Wadsworth.
Johnson, W., Jordan, K., Liao, M., & Granada, S. (2003). Sensitivity and bias in
searches of cockpit display of traffic information utilizing
highlighting/lowlighting. Proceedings of the 12th International Symposium
on Aviation Psychology. Dayton, OH.
Lee, S. M., Park, C., Johnson, M. A., & Mueller, E. R. (2013). Investigating
Effects of “Well Clear” Definitions on UAS Sense-And-Avoid Operations.
Aviation Technology, Integration, and Operations Conference (pp. 1-15).
Los Angeles, CA: American Institute of Aeronautics and Astronautics.
Major Yochim, J. A. (2010). The Vulnerabilities of Unmanned Aircraft System
Common Data Links. Fort Leavenworth, Kansas: U.S. Army Command
and General Staff College.
Public Intelligence. (2012, April 18). Lost-Links and Mid-Air Collisions: The
Problems With Domestic Drones. Retrieved from publicinteligence.net:
http://publicintelligence.net/the-problems-with-domestic-drones/
Reed, J. (2011, August 17). Midair Collision Between a C-130 and a UAV.
Retrieved from Defense Tech: http://defensetech.org/2011/08/17/midair-
collision-between-a-c-130-and-a-uav/
The Washington Post. (2014, June 20). When Drones Fall from the Sky.
Retrieved from washingtonpost.com:
http://www.washingtonpost.com/sf/investigative/2014/06/20/when-drones-
fall-from-the-sky/
U.S. House of Representatives. (2012). FAA Modernization and Reform Act of
2012. Washington, DC: 112th Congress 2d Session.

99
Vu, K.-P., Strybel, T., Battiste, V., & Johnson, W. (2011). Factors Influencing the
Decisions and Actions of Pilots and Air Traffic Controllers in Three
Plausible NextGen Environments. Cultural Factors in Decision Making and
Action.
Weibel, R. E., Edwards, M. W., & Fernandes, C. S. (June, 2011). Establishing a
Risk-Based Separation Standard for Unmanned Aircraft Self Separation.
Ninth USA/Europe Air Traffic Management Research & Development
Seminar.

100
Appendix A: San Jose State University IRB Approval

101
Appendix B: NASA Ames Informed Consent
ARC - 475 - Category II Participant Consent Form To the research Participants: Please read this consent form and the attached protocol and/or subject instructions carefully. A. I agree to participate in the Well Clear: General Aviation and Commercial Pilots’ Perception of Unmanned Aerial Systems (UAS) VS. Manned Aircraft in the National Airspace System (NAS) research experiment as described in the attached protocol or subject instructions. I understand that I am employed by _________________________ who can be contacted at ______________________________________. B. I understand that my participation could cause me minimal risk*, inconvenience, or discomfort. The purpose and procedures have been explained to me and I understand the risks and discomforts as described in the attached research protocol. C. To my knowledge, I have no medical conditions, including pregnancy that will prevent my participation in this study. I understand that if my medical status should change while I am a participant in the research experiment there may be unforeseeable risks to me (or the embryo or fetus if applicable). I agree to notify the Principal Investigator (PI) or medical monitor of any known changes in my condition for safety purposes. D. My consent to participate has been freely given. I may withdraw my consent, and thereby withdraw from the study at any time without penalty or loss of benefits to which I am entitled. I understand that the PI may request my withdrawal or the study may be terminated for any reason. I agree to follow the procedures for orderly and safe termination. E. I am not releasing NASA or any other organization or person from liability for any injury arising as a result of my participant in this study. F. I hereby agree that all records collected by NASA in the course of this study are available to the research study investigators, support staff, and any duly authorized research review committee. I grant NASA permission to reproduce and publish all records, notes, or data collected from my participation, provided there will be no association of my name with the collected data and that confidentiality is maintained, unless specifically waived by me. While all stated precautions will be taken to protect anonymity, there is a small risk that some or all of the participants’ data could become identifiable. Participant Signature: ____________________________ Date: _________________

102
Appendix C: Subjective WCB Map Drawings
Note – top drawing is for manned intruders, while the bottom is for unmanned intruders.
Pilot 01 - GA
Pilot 02 - GA
Pilot 03 - ATP
Pilot 04 - ATP

103
Pilot 05 - ATP
Pilot 06 - GA
Pilot 07 - GA
Pilot 08 - GA

104
Pilot 09 - GA
Pilot 10 - ATP
Pilot 11 - GA
Pilot 12 - GA

105
Pilot 13 - ATP
Pilot 14 - GA
Pilot 15 - GA
Pilot 16 - ATP

106
Pilot 17 - GA
Pilot 18 - GA
Pilot 19 - ATP
Pilot 20 - ATP

107
Pilot 21 - ATP
Pilot 22 - GA
Pilot 23 - GA
Pilot 24 - ATP
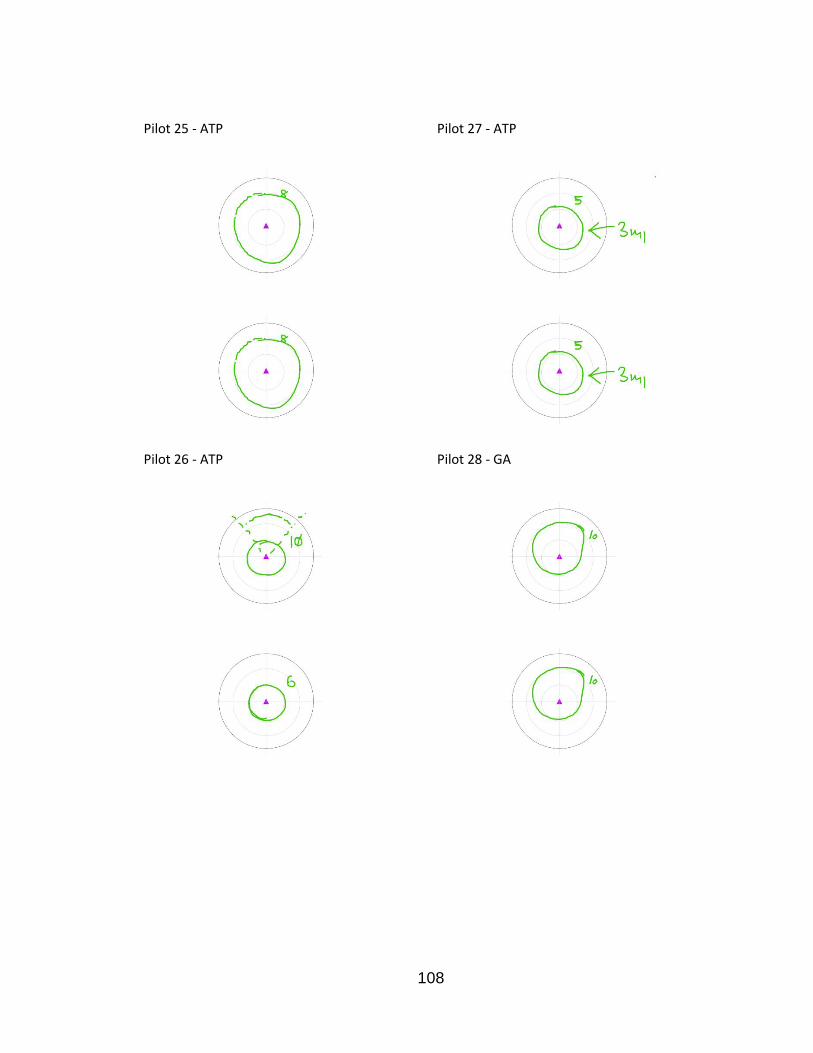
108
Pilot 25 - ATP
Pilot 26 - ATP
Pilot 27 - ATP
Pilot 28 - GA

109
Pilot 29 - GA
Pilot 30 - ATP
Pilot 31 - ATP
Pilot 32 - GA

110
Pilot 33 - ATP
Pilot 34 - ATP

111
Appendix D: Post-Simulation Pilot Questionnaire
1. What unit of measurement do you first think of when measuring the well clear
boundary (WCB) from ownship position? (I.e. Do you think of it as a measure of time
before collision? Or distance before collision? Another unit of measurement?)
2. Do you believe that unmanned vehicles should abide to the exact same WCB as manned
vehicles if you were flying a manned aircraft in the skies? Why or why not?
112
3. What affects your opinion of the WCB the most? Please explain why you feel this way.
4. What strategies did you use in determining the WCB?
113
5. How do you believe WCB to be different from Legal Separation? From other similarly
defined terms?
6. Did you experience any difference in arousal (i.e. stress levels) when interacting with the
Manned Vs Unmanned intruders?

114
7. Do you feel comfortable with the current definition of WC?
a. Do you feel confident that the UAS can abide by this definition autonomously?
8. All scenarios with UAS intruding aircraft only involved one UAS vehicle per each trial.
Would your opinion of the WCB change if there were 2 or more UASs involved instead
of just one?
115
9. All scenarios involved two-dimensional interaction with intruders (in the horizontal
plane). What would your opinion of the WCB in the vertical plane be? (Feel free to draw
a depiction or describe it as best you can)
10. How do you feel about in terms of the safe integration of UAS’s into our national
airspace system? Please thoroughly explain your response.

116
11. For this experiment, you used our Cockpit Situational Display (CSD) as a Cockpit Display
of Traffic Information (CDTI). What system (if any) do you primarily use as a CDTI?
a. Do you feel that your current CDTI system display is adequate enough to allow
you to safely perceive the WCB around ownship? Why or why not?
12. What, if any, changes would you make to your display technology to better assist you in
determining the WCB?

117
13. What direction did the intruder feel most threatening from (made you feel most
vulnerable to collision)? Please explain why you felt this way.
a. Note – please refer to intruder directions in terms of cardinal directions
(N,W,E,S) from ownship, as if ownship were always facing North (0 or 360).
Response for
interactions with
Manned intruder
Aircraft:
Response for
interactions with
Unmanned intruder
Aircraft:
14. Would you envision yourself more often relying on a CDTI to maintain the WCB
boundary, or out-the-window view? (Note – only referring to horizontal separation, not
vertical)
Response for
interactions with
Manned intruder
Aircraft:
Response for
interactions with
Unmanned intruder
Aircraft:

118
15. What was your perceived level of safety during interaction with intruding aircraft?
Response for
interactions with
Manned intruder
Aircraft:
Response for
interactions with
Unmanned intruder
Aircraft:
16. Did you feel speed of ownship changed your perceived dimensions of the WCB? (circle
one)
Strongly Disagree Disagree Neutral Agree Strongly
Agree
17. Do you believe that traffic density in your immediate surrounding airspace affected your
perception of WCB?
Strongly Disagree Disagree Neutral Agree Strongly
Agree
18. Do you feel that the CSD had a positive impact on your WCB perception in comparison
to your current CDTI?
Strongly Disagree Disagree Neutral Agree Strongly
Agree

119
19. Please rate the overall trust level you felt towards the intruding aircraft (circle one)
Response for
interactions
with Manned
intruder
Aircraft:
Very Low Trust Low Trust Neutral Trust High Trust Very High
Trust
Response for
interactions
with
Unmanned
intruder
Aircraft:
Very Low Trust Low Trust Neutral Trust High Trust Very High
Trust

120
20. FOR GA PILOTS ONLY - Do you believe pilots with more experience than you would have
a different opinion of the WCB? If so, why?
21. FOR COMM PILOTS ONLY – Do you believe pilots with less experience than you would
have a different opinion of the WCB? If so, why?

121
22. Please draw your interpretation of what the WCB should be between your ownship and
other Manned aircraft. Be sure to indicate a range scale as you see fit.

122
23. Please draw your interpretation of what the WCB should be between your ownship and
other Unmanned aircraft. Be sure to indicate a range scale as you see fit.