well-to-wheel evaluation for production of ethanol from … ethanol_wtw_final_report.pdf ·...
TRANSCRIPT

FWG-P-04-024_WTW wheat to EtOH.doc Page 1
Well-to-Wheel Evaluation for Production of Ethanol fromWheat
A Report by the LowCVP Fuels Working Group, WTW Sub-Group
FWG-P-04-024
Report prepared by:
Gary Punter British SugarDavid Rickeard ExxonMobil/CONCAWEJean-François Larivé CONCAWERobert Edwards JRC IspraNigel Mortimer North Energy Associates LtdRalph Horne Sheffield Hallam UniversityAusilio Bauen ICEPTJeremy Woods ICEPT
October 2004

FWG-P-04-024_WTW wheat to EtOH.doc Page 2
CONTENTS
EXECUTIVE SUMMARY ................................................................................................................. 31. Background............................................................................................................................... 62. Basic wheat-to-ethanol pathway............................................................................................... 63. Scenarios .................................................................................................................................. 8
3.1. Ethanol plant utility generation models.............................................................................. 83.2. By-Products ....................................................................................................................... 9
4. Methodology for by-product credits ........................................................................................ 104.1. DDGS .............................................................................................................................. 104.2. Straw................................................................................................................................ 114.3. Natural gas and electricity ............................................................................................... 114.4. Attribution of credits to the ethanol.................................................................................. 11
5. Evaluation of the Production Chain ........................................................................................ 125.1. Agriculture........................................................................................................................ 125.2. Ethanol production........................................................................................................... 13
6. Reference Systems ................................................................................................................ 146.1. Agriculture........................................................................................................................ 146.2. Reference Petrol and Diesel............................................................................................ 15
7. Consensus Input Data ............................................................................................................ 167.1. Basic Data ....................................................................................................................... 167.2. Grain production and delivery to the processing plant .................................................... 167.3. Ethanol Production & Distribution.................................................................................... 187.4. By-product credits............................................................................................................ 197.5. Revenues and costs ........................................................................................................ 20
8. WTT Results ........................................................................................................................... 219. Conclusions ............................................................................................................................ 2610. References.......................................................................................................................... 2711. Abbreviations ...................................................................................................................... 29APPENDIX 1 .................................................................................................................................. 30APPENDIX 2 .................................................................................................................................. 38

FWG-P-04-024_WTW wheat to EtOH.doc Page 3
EXECUTIVE SUMMARY
1. This Report records the findings of the ‘Well to Wheel sub-group’ for the ‘Fuels WorkingGroup’ of the ‘Low Carbon Vehicle Partnership’. The brief of the group was to reachconsensus on the energy and greenhouse gas balances for conventional UK biofuels. Thebackground to this study is set in the context of concerns over fuel security and global climatechange posed by the demands of a growing road transport sector. Because of differencesbetween the existing studies, the Low Carbon Vehicle Partnership asked for a sound andtransparent scientific basis for their recommendations to policy makers. This is the aim of thisstudy.
2. Rather than reconcile differences between existing reports, the working group has pooled itsextensive knowledge and experience to prepare a new well-to-wheel evaluation, based onthe elements within the existing studies, but adding new insights where needed. This studydescribes the energy and greenhouse gas emissions associated with producing bioethanolfrom wheat, using technology currently feasible for the UK. Bioethanol from wheat waschosen to simplify the extensive workload and because previous work has shown largevariations for this particular biofuel.
3. The basic pathway describes standard processes including wheat farming and ethanolproduction via hydrolysis and fermentation. There are three main factors that can have aprofound impact on the outcome of the pathway:• The heat & power generation scheme used in the ethanol plant.• The fate of straw: ploughed back into the field or use as fuel for the ethanol plant.• The fate of DDGS1: used as an animal feed or energy source.
4. For the ethanol plant heat & power scheme, three basic Models are examined together withvarious sub-options. All of these Models are technically realistic but with no bioethanolproduction existing within the UK the question of commercial viability remains unanswered.- Model a utilises a natural gas-fired boiler and "imported" grid electricity (no Combined
Heat & Power –CHP).- Models b explores adding CHP capability to this basic configuration. Model b1 adds a
steam turbine, while Model b21 replaces the boiler with a gas turbine and steamrecovery from the exhaust gases. Model b22 further extends the efficiency by addingsupplementary natural gas firing to the steam generator.
- Finally Models c1 and c2 utilise a straw-fired CHP plant with a steam turbine with/withoutcondensing turbine respectively.
All these scenarios except Model a, generate surplus electricity for export to the grid. Ineach case it is assumed that the bioethanol is blended with gasoline at <5% volume, andthat the wheat is grown on rotational set-aside land.
Straw Heat & Power GenerationPloughed in a Conventional NG boiler .. b1 Conventional NG boiler + CHP (steam turbine) .. b21 NG gas turbine + steam generator + CHP (steam turbine) .. b22 NG gas turbine + fired steam generator + CHPUsed as fuel c1 Straw boiler + CHP (steam turbine) .. c2 Straw boiler + CHP (steam turbine + condensing turbine)
5. The group reached consensus on the input data for all of the Models. To achievetransparency, the data have been fully explained in the tables of this report. Farming inputsare well established with the exception of field N2O emissions, where new data from JRC
1 Distillers' Dark Grains with Solubles: the residue of grain fermentation after separation of the alcohol

FWG-P-04-024_WTW wheat to EtOH.doc Page 4
have been used. New data were also included on the ethanol production process, both toclarify the basic energy needs of the process, and determine realistic efficiencies forproducing the energy. The group also agreed on a consensus approach to by-product credits.
6. Most of the scenarios considered here have two by-products: electricity exported to theUnited Kingdom (UK) grid and Distillers’ Dark Grains and Solubles (DDGS). These by-products are a significant feature of modern integrated manufacturing (bio-refineries) andfundamentally affect the outcome of the assessment, so need to be given credits to completethe assessment. All of the Working Group agreed that ‘substitution’ is the preferredmethodology where data on the product to be substituted exist, and this method has beenused here. For electricity, it was assumed that the electricity export substitutes electricity fromthe UK mix, thereby achieving a credit for avoiding power generation elsewhere in the UK.DDGS can also be used as energy in heat & power generation (biomass co-firing in coal firedpower stations), however its most usual application at present is as animal feed. Here, thecalculation of credits is more complex. It is generally assumed that DDGS will substitutemaize or soya products, perhaps from the USA. The complexity of the substitution chain andits sensitivity to economic factors mean that there is some uncertainty in the estimates.DDGS credits for use both as animal feed and as an energy source have been calculated.
7. To show the potential savings, the energy use and GHG emissions for each model havebeen compared with the Well-to-Tank (WTT) energy and GHG emissions for gasoline.
8. The results show that all the bioethanol Models give lower WTT greenhouse gas emissionswhen compared with gasoline, but that the process models and how the by-products are usedstrongly affect the results. We have divided the total greenhouse benefit only by the GJethanol produced, although it can be argued that the benefit should be apportioned betweenall 3 products: ethanol, DDGS and electricity. The main results and indicators are summarisedin the table below.
Model aNG boiler +
grid
b1NG boiler +
steam turbine
b21NG GT+
steam gen+steam turbine
b22NG GT+co-fired
steam gen+steam turbine
c1Straw boiler
+ steam turbine
c2Straw boiler
+ steam turbine +
condensing turbine
Gasoline
Fossil energy balance GJf/GJ road fuelGross 1.02 0.95 1.46 1.11 0.45 0.45 1.14Net of credits DDGS as animal feed 0.90 0.67 0.30 0.41 0.10 0.03 DDGS as energy 0.24 0.01 -0.36 -0.25 -0.56 -0.63GHG emissions kg CO2eq/GJ road fuelGross 94.7 91.9 121.2 100.6 75.7 75.7 85.8Net of credits DDGS as animal feed 79.5 68.1 51.4 55.4 48.0 44.7 DDGS as energy 54.3 43.0 26.3 30.3 22.9 19.6GHG avoided kg CO2eq/GJ road fuel DDGS as animal feed 6.4 17.7 34.4 30.4 37.8 41.1 DDGS as energy 31.5 42.9 59.5 55.5 63.0 66.3Cost parameters (DDGS as animal feed)Cost relative to b1 1.03 1.00 0.91 1.00 1.32 1.36Relative cost of GHG avoided 2.87 1.00 0.47 0.58 0.61 0.58
Not surprisingly the worst performance is displayed by Model a which, without a CHPconfiguration can now be considered as outdated industrial practice, and is unlikely to beselected for new plants. The other models give better energy/GHG results principally becausethey export electricity efficiently produced by CHP, replacing grid electricity. The bestperformance is demonstrated by Model c2 which shows the combined benefits of CHP andfuelling the bioethanol production with straw. Displacing additional UK electricity withrenewable electricity from DDGS offers a large additional benefit. The most likely commercialoption in the short term is Model b21 or b22 which employs a natural gas fired gas turbinecombined with CHP, and DDGS as animal feed. Which option may be the most financiallyattractive will depend on the values of marginal electricity and fuel.

FWG-P-04-024_WTW wheat to EtOH.doc Page 5
9. All of the Models considered generate net fossil energy savings. The worst performingscenario (Model a) uses 0.9GJ of fossil fuel to produce 1 GJ of bioethanol. Some Modelsactually save more fossil energy than is contained in the produced ethanol as a result of thelarge energy saving attached to electricity production. The GHG savings follow a similarpattern, but are reduced because of the GHG emissions in farming, principally the N2Oemissions.
10. In reaching the above conclusions the study has highlighted the significance of several keyfactors: Firstly, by-product use and the associated credits are essential to the environmentalperformance of the bioethanol facility. This is not surprising for an integrated bio-refinery,which produces both electricity and liquid biofuel. The CHP scheme selected and the use towhich the DDGS is put are very important. Finally, because the production of bioethanol isenergy-intensive, the use of renewable fuel (straw) to power the ethanol facility would be avery positive step if economically feasible.
11. An analysis was conducted on cost to assess the relative ranking of the scenario’s with regardto ‘cost of reducing GHG emissions’. The data presented follow a simplified economic model,and are not meant to be used for financial decisions. The cost of CO2 avoided appears to belowest for Model b21. Use of DDGS as fuel generates higher energy and GHG savings, butdelivers less economic return than use as animal feed. It may not be commercially viable toinvest in the enhanced carbon savings unless more value can be gained from the additionalenvironmental benefit. This aspect, including the cost of GHG reduction relative to othermeasures in the transport sector or other sectors, requires further study and is beyond theremit of this report.
12. This study highlights that the way in which fuels are produced has a significant impact onenergy balance, GHG emissions and costs. Regulators should consider fuel productionprocesses as well as final fuel properties when deciding policy for future fuels. In particular− Incorporation of CHP into the ethanol plant significantly improves energy and GHG
balances− Use of straw as an energy source further improves energy and GHG savings− Use of DDGS as energy for power generation rather than as animal feed gives much
greater energy and GHG savings (although it is unlikely to be the most economic option)
13. The calculations are very sensitive to certain input numbers that cannot be quantified withgreat certainty and need further study− N2O emissions from agriculture have a large impact on the GHG balance (20-30% of
emissions). The level of emission varies greatly according to the type of land, agriculturalpractices and weather factors.
− The large credit for burning DDGS is perhaps surprising, but is consistent with the overalleffectiveness of biomass use for electricity generation. To better quantify this, improveddata on the heating value of DDGS are needed.
FWG-P-04-024_WTW wheat to EtOH.doc Page 6
1. BackgroundWTW/Life Cycle Analysis is important as a means to understanding the energy and GreenhouseGas (GHG) impact of new fuel/vehicle technologies. Conventional biofuels (ethanol and FAME)are generally used as blends with petrol or diesel in existing vehicles, so comparison of the fuelproduction cycles is the most important aspect of the analysis. Biofuels discussions in the UKhave been guided by recent studies from
1. N Mortimer et al at Sheffield Hallam University (SHU) [1,2]2. J Woods et al at Imperial College (ICCEPT) [3]3. The EUCAR/JRC/CONCAWE WTW study (notably R. Edwards at JRC and
J-F. Larivé at CONCAWE) [4]However, there are differences in the approaches taken in the different studies which merit furtherevaluation.
At the LOWCVP Fuels Working Group meeting on 29 April 2004, a sub-group was formed,headed by David Rickeard of ExxonMobil and Gary Punter of British Sugar, with the task offacilitating discussion between the experts to reach a consensus on the energy/GHG balances forconventional biofuels. An initial meeting of the group identified the following factors as leading todifferent results from the existing studies:
• Scenario differences• Calculation methodologies• Input data, particularly for the ethanol production process• Data presentation; overall output or per MJ of biofuel• Reference systems: gasoline/diesel, agriculture
In order to produce results in a reasonable timeframe, efforts were concentrated on theproduction of ethanol from wheat, since this pathway showed the greatest variation between theexisting studies. Appropriate scenarios for the UK were agreed, and actions assigned to fill datagaps and calculate the results using an agreed methodology. This report represents newresearch and explains in a transparent way the consensus input data and methodologies, andhow different options for ethanol production from wheat affect the energy and GHG balances.
2. Basic wheat-to-ethanol pathwayIn this study we assumed that ethanol is produced from wheat grain via the conventionalhydrolysis and fermentation process. Although cellulosic fermentation processes offer promisefor the future, they are not yet ready for large scale production and are beyond the scope of thisreport.
The basic process for production of ethanol from wheat grain is shown in Figure 1. Just over oneacre of good arable land (0.44 ha) can produce 3.5 tonnes of wheat grain at 16% moisture(8 t/ha) which, after drying, gives 3.03 tonnes of dried wheat grain (dwg, 3% moisture). About1.4tonnes of straw is also produced which, depending on the circumstances can be left in thefield and ploughed back or used either for various agricultural purposes or as a source of energy.The stored grain is transported by road to the ethanol plant where, after milling, hydrolysis,fermentation, distillation and dehydration, 1 tonne of ethanol is produced, giving a yoeld of2.3tEtOH/ha. In addition, the residue, after drying, yields 1.14 tonnes of DDGS (Distillers' DarkGrain’S, the residue from the fermentation process). This protein-rich product is conventionallyused as animal feed, where it commands a high value, but can also be used as a source ofenergy. Ethanol is distributed by road.

FWG-P-04-024_WTW wheat to EtOH.doc Page 7
Various inputs are required for the farming and ethanol production processes. Presentation anddiscussion of the different ways of achieving this in practice in the UK context are the subject ofthis report.
Wheat production and supply
J
Ethanol production
1.424 tstraw
0.081 t Seed
3.499 t wheat(16% moisture content)
CULTIVATION AND HARVESTING0.437 ha
9.942 twaste water
DISTILLATION
10 t alcohol (10% ethanol)+ 1.14 t solids
1 t bioethanol
DEHYDRATION
1.058 t distillate(94.5% ethanol)
0.913 tCO2
DRYING 1.14 tDDGS
10 twater
HYDROLYSIS AND FERMENTATION
MILLING
TRANSPORT (road)
3.03 t dry wheat grain(3% moisture content)
DRYING AND STORAGE
Figure 1. The Production Pathway for Ethanol from Wheat Grain
In this study, analysis has concentrated on a case where additional wheat is grown on set-asideland in the UK. As a result, the straw by-product has only two alternative uses i.e. ploughing backin the field (thereby saving some fertilizers and improving the soil quality) or use as a source ofenergy for the ethanol production process itself.
It is assumed that the ethanol produced is blended into gasoline to produce a fuel meetingEN228, and is used in standard gasoline vehicles. Under this scenario, it is justified to assume,as in the JEC WTW study, that the efficiency of the engine remains unchanged on switching tothe ethanol blend. Although some studies have suggested a small efficiency improvement for

FWG-P-04-024_WTW wheat to EtOH.doc Page 8
ethanol-containing fuels, the data remain unconvincing. Further work is needed to resolve thisquestion. Here it has therefore been assumed that ethanol substitutes for gasoline on the basis ofits energy content. This report concentrates on the WTT energy and GHG balances which areprimarily governed by the fuel production process. Subsequent calculations show the energy useand GHG emissions associated with producing 1GJ of ethanol (together with the associatedDDGS and electricity) and compare this with the figures for 1GJ of conventional petrol. Theconfigurations that give the best energy and GHG savings may not be the most economical, andso indicative figures for investment and operating cost have been included.
3. ScenariosWithin the framework of the generic pathway described in section 2, a number of scenarios havebeen considered, exploring various options in three areas
o Heat & power generation scheme used in the ethanol plant.o Fate of straw: ploughed back into the field or used as fuel for the ethanol plant.o Fate of DDGS: used as animal feed or energy source.
As will be seen, every one of these options has a significant impact on the final energy and GHGbalance of the whole pathway.
3.1. Ethanol plant utility generation modelsThree configurations were identified that cover the range of realistic options for a new ethanolplant, and can be used as a basis for evaluating the impact on energy use and GHG emissions.
a) Basic configuration: conventional natural gas-fired boiler and imported electricityModel a is the simplest and also least capital-intensive configuration. Heat is provided to theprocess in the form of steam generated by an on-site boiler. Electricity is simply purchasedfrom the grid.
b) Optimised fossil fuelled plant: combined heat and powerModel b encompasses three configurations that take advantage of the fact that both low-temperature heat and electricity are required. This is a favourable situation for application ofcombined heat and power generation.
In Model b1, the natural gas boiler of Model a is supplemented by a backpressure steamturbo-generator. This produces electricity, while the exhaust steam still contains enoughenergy to meet the ethanol plant needs.
With more investment, a more sophisticated plant is possible (Model b21) consisting of− a natural gas-fired gas turbine producing electricity,− a heat recovery steam generator (HRSG) using the exhaust from the gas turbine to
produce high pressure steam,− a back-pressure steam turbine producing more electricity and low pressure steam
suitable to drive the ethanol production process.In an HRSG, additional heat can be produced with a very high efficiency through additionalnatural gas firing. The additional investment required is relatively modest, and this option(Model b22) may be attractive for such schemes (depending on the electricity price).
Most of the energy required by the process is in the form of heat so that it is reasonable toassume that the heat requirement will determine the size of the equipment.
In all of these configurations, it is assumed that the surplus electricity can be exported to thegrid.

FWG-P-04-024_WTW wheat to EtOH.doc Page 9
Models: Unfired HRSG Fired HRSGNG boiler + steam turbine b1 -NG gas turbine + steam turbine b21 b22
c) CHP fuelled by straw:In some cases the straw associated with the processed grain will be available to fuel theprocess plant. The configuration then includes a straw-fired boiler producing high pressuresteam which feeds an extraction steam turbine producing electricity and low pressure steamfor the process. Here again the surplus electricity will be exported to the grid.
In view of the additional complexity brought about by the handling and burning of straw, it islikely that the plant size would be maximised and all available straw would be processed.Besides the electricity surplus, this will produce excess steam. Given additional capitalavailability the excess steam can be used to generate additional electricity through acondensing turbine.
Models:Straw boiler + steam turbine c1Straw boiler + steam turbine + condensing turbine c2
This configuration could be applied in cases where a contract is passed between a wheatproducer and an ethanol producer to take the whole crop from the land. Because all the strawis removed from the land, additional fertiliser must be added to replenish the soil.
The Models need to be compared with care, taking into account the type and amount of inputenergy, the different amounts of electricity produced in addition to the ethanol and DDGS, andthe capital and operating costs.
3.2. By-ProductsThe two by-products associated with ethanol from wheat are straw and DDGS. In Models b and cabove, electricity is also a by-product.
a) StrawThe impact of use of straw in the ethanol processing plant is covered by Models c1 and c2above. In Models a and b, the straw is considered to be left in the field and ploughed back in,which leads to a reduction in the amount of chemical fertiliser needed.
b) DDGSDDGS is a protein-rich product that has a high value as animal feed. If its use for this purposereplaces other animal feed material, the energy used and GHG emitted for growing andprocessing these crops will be saved. Calculation of a realistic credit is challenging, and isdiscussed further in section 4.1. If the market for animal feed becomes saturated, DDGS stillhas a value as fuel. Some DDGS is already exported to electricity generators in which casesubstitution of conventional electricity provides a further GHG saving.
c) ElectricityWhere electricity is produced by the plant, we have calculated credits for energy and GHGemissions based on substitution of UK-mix electricity.

FWG-P-04-024_WTW wheat to EtOH.doc Page 10
4. Methodology for by-product creditsCalculation of the basic crop production and ethanol processing is fairly straightforward, and anyvariations between the studies are likely to come from assumptions on heat generation efficiencyor input data differences. However, the way in which by-product credits are handled cansignificantly affect the conclusions and needs careful evaluation.
All the participants were agreed that the best way of calculating by-product credits is the'substitution' method. For the cases studied, this means that the energy and GHG emissionsavoided by use of straw and DDGS are calculated by studying the materials they replace. Forexample, if DDGS is used as animal feed it could replace feed produced from maize gluten feedand/or soya beans imported from the USA - the energy and GHG associated with producing soyameal/maize gluten is therefore 'avoided' and provides a credit. Similarly, the savings from use ofstraw as a fuel to replace electricity and natural gas can be calculated. The difficulties of thisapproach are twofold: firstly the calculation rapidly expands both technically and geographicallybeyond the area of immediate study, and the ripple effects can result in a very complexcalculation: there is a danger that an incomplete evaluation may underestimate the credit.Secondly, which products will actually be substituted will depend on market conditions, whichmay vary with time and production volumes. These challenges have led some researchers toapply other 'allocation' techniques, where the input energy to the ethanol process is partitionedamong the by-products in some other way. All participants agreed that allocation by mass wasunsatisfactory because different dispositions of the by-products can produce very different GHGimpacts, which would not be reflected in the calculation. Direct allocation by price is alsointellectually unsatisfactory because, in the short term, price changes can change the calculation,whereas in reality the use and GHG impact of the products may not change.
There was agreement, however, that economic factors are important in determining how by-products are used and that these choices could change over time as prices vary to reflectsaturation of markets or other external economic factors. Hence, if we assume that DDGS is usedfor animal feed and there is a GHG saving because less animal feed is produced from othersources as a consequence, it has been implicitly assumed that a perfectly functioning market isoperating. If the DDGS has a low market value due to a subsequent surplus of animal feed, it canstill be used as a fuel either by export to power generators or in the ethanol plant if this includesits own power and heat generation.
In this study, the substitution method has been adopted, with the two options below foruse of DDGS (animal feed and energy) covering the range of economic scenarios that canbe envisaged, and export of surplus electricity to the grid.
4.1. DDGS(a) DDGS as animal feedDDGS, the dried residue after the fermentation and distillation process, is valuable as a proteinanimal feed. If used for this purpose it will displace maize gluten feed from the US wet millingethanol industry or the DDGS from the dry milling ethanol industry or soya protein feed from soyaoil production.
The displacement of maize protein products for feeding to ruminant animals (cows & sheep) islikely to occur first because it has a close match to the protein levels and amino acid profile of thewheat DDGS [15]. Soya protein has a higher protein level and is used for mono-gastric animals(such as pigs). Some secondary substitution of soya protein could occur.
This study has used soya protein as the substitution product as data were available from the JECstudy. If maize gluten was to be used the credits are likely to be larger, so soya proteinrepresents the lower end of the range. The uncertainty is quantified through comparison withresults from other studies in section 7.

FWG-P-04-024_WTW wheat to EtOH.doc Page 11
The alternative use of DDGS as a fuel for power generation, described below, generates muchhigher energy and GHG credits.
(b) DDGS as energyDDGS can potentially be used in power generation. The basis for this scenario is the increasingpractice in UK power stations of co-firing biomass in thermal power plants, as well as in dedicatedbiomass power plants. This growth has been enabled by the current Renewables Obligation (UKlegislation Utilities Act 2000), which sets in place an annual 1% increase (to 2015) in renewableelectricity. Currently, Office of Gas and Electricity Market reports show that 28 power stations(including Drax, Ferrybridge, Ratcliffe, etc.) have registered for co-firing, with a combinedrenewable output of 454 MW, and that 1.2 million MWh of co-fired electricity have been producedsince 2002 (about half the current level of wind power).
Where the ethanol plant includes a straw boiler plus sufficient steam turbine capacity, the DDGSmay also be used for power generation within the ethanol plant, although this scenario has notbeen considered in this study. In either case, there are primary energy and GHG emissionscredits from UK grid electricity displaced by the extra electricity generated from the DDGS.Similar credits accrue to surplus electricity generated in Natural Gas-fired ethanol plants.
4.2. StrawIn the scenarios considered here, straw is either ploughed back or used as fuel in the ethanolproduction plant. The main credit for using the straw accrues from saving fossil fuel (natural gas)and also producing additional electricity. A debit is also factored in to take into account theincrease of fertiliser input required when the straw is removed. The effect of removing straw fromthe land on wheat yield is an area for further discussion beyond the scope of this report.
4.3. Natural gas and electricityAny natural gas and electricity used or saved need to attract a debit/credit (energy and GHGemissions) corresponding to a realistic production scenario and compiled on a “well-to-tank”basis. For natural gas, the EU-mix factor computed in the Joint European study has been used (itis believed that UK-mix figures would be similar). For electricity a UK-mix figure has beenadopted.
It must be noted that, in view of the large amounts of electricity produced by some of the models,and fairly large variations amongst electricity generation figures, the choice of the latter is nottrivial and can significantly affect the final numbers.
4.4. Attribution of credits to the ethanolWhere the ethanol is the main product from the pathway, credits arising from the by-products canbe simply factored into the overall energy/GHG balances for the ethanol. This is the approachtaken in most studies, with the figures being expressed per MJ or tonne of ethanol produced.Unfortunately, real scenarios often have large by-product components, which in the case ofelectricity and DDGS can have their own environmental benefit. In these cases (Models b and c),the effect of by-product credits will have a significant impact on how the bioethanol production isperceived.
This study attempts to consider ‘real scenarios’, which are being driven by the need to producebioethanol. By-product credits are significant so the study gives a transparent presentation of theeffect of these credits. When considering the final results (including by-product credits) the readerneeds to be aware that it is the ‘whole plant’ and all the products that are being measured – notjust the bioethanol. Thus, we have quoted the fossil fuel and GHG savings on the basis of a unit

FWG-P-04-024_WTW wheat to EtOH.doc Page 12
production of ethanol, but the reader should bear in mind that the production of ethanol alwaysimplies the production also of DDGS and (usually) electricity.
5. Evaluation of the Production ChainA study prepared for the US Department of Agriculture in 2002 [5] provides a historical analysis ofethanol production and notes that, since the 1980s, there have been improvements in grainyields, lower energy use in fertiliser production, as well as in the ethanol plant improvementsdiscussed in more detail below.
5.1. AgricultureThe differences in agricultural data assumed by the different European studies were fairly small,and did not greatly affect the calculations. Crop yields, agricultural energy inputs and fertiliser useare well established, and do not seem to need further discussion. The amount of fertiliser neededwill be less where straw is ploughed back into the land and this is reflected in the different modelsanalysed. Estimation of emissions of N2O from agriculture remains an issue, especially as itsimpact on the overall GHG emissions is significant. Work by JRC has reduced uncertainty inprevious studies (see discussion in section 7.2), and concluded that large variations can occur,even over small distances, depending on soil types, agricultural practices, and weather. This isillustrated by the following map, taken from [7, citing 6], , which shows large variations across theUK. The figures used in this study are explained in Section 7.2.
0 - 1
1 - 2
2 - 3
3 - 4
4 - 5
> 5
Source: Freibauer, A., Kaltschmitt, Institut für rationelle Energieanwendungen (IER), Stuttgart: Biogenic Greenhouse Gas Emissions from Agriculture in Europe, European Summary Report of the EU Concerted Action FAIR3-CT96-1877, financed by EU DG VI, February 2001
Direct N2O-N emissions from arable land[kg N2O-N ha-1 yr-1]
LBST calculation (IPCC default values, crop residue ploughed in):• Rape seed: 1.7 - 1.9 kg N2O-N ha-1 yr-1
(2.6 - 3.0 kg N2O ha-1 yr-1)• Sugar beet: 2.7 kg N2O-N ha-1 yr-1
(4.3 kg N2O ha-1 yr-1)
Figure 2. Direct N2O emissions from arable land in Europe
Drying of the grain is assumed to be part of the agricultural process, with dried wheat grain (dwg,around 3% moisture) being delivered to the ethanol plant. Since harvested wheat grain cancontain 16% or more of moisture, care must be taken to specify exactly which product is beingreferred to. As part of the agricultural process a small amount of energy (diesel fuel andelectricity) is therefore taken into account for drying and also for storage and transport of thegrain.

FWG-P-04-024_WTW wheat to EtOH.doc Page 13
5.2. Ethanol productionBasic energy needsThe amount of energy needed in the ethanol production plant proved to be the greatest source ofvariation between the different studies, and was reviewed in some detail. Comparisons arehampered by the fact that many published studies are influenced by different fossil fuel choices,and are not always clear whether the quoted figures relate to steam/electricity energy, to fossilfuel use at the plant, or to a full WTT evaluation of primary energy needs.
To resolve this, the team went back to basics and studied how much steam and electricity energyis needed to power the basic ethanol production process of milling, fermentation, distillation anddehydration of the ethanol and drying of the DDGS. Valuable data were found in thecomprehensive study prepared for the US Department of Agriculture in 2002 [5] which surveyedthe actual US ethanol industry and also the literature. Although ethanol in the USA is producedfrom corn (maize) rather than wheat, the dry-milling process used is analogous to that use forwheat, so numbers can be compared with some confidence.
Basic Energy Requirement for Bioethanol Production
0 5 10 15 20 25
SHU ETSU R1 (reworked)
SHU Model 1 (reworked)
Marland (1991) (corn to ethanol)
Woods 2000 (cane, 1980's plant)
Wang 2002 - 1980s USA
Wang 2002 - 2000s USA actual
Wang 2002 - 2000s dry mill plant
GJ/t EtOH
Steam Elec
Figure 3. Energy Needs (Steam plus Electricity) for Bioethanol Plants
Selected values for the basic energy requirements of bioethanol production are shown inFigure 3. All figures have been converted to represent the energy content of steam pluselectricity at the plant. Starting at the top with the USDA figures, the improvements in processefficiency since the 1980's are clear. Better heat integration in modern ethanol plants probablyaccounts for a large amount of the improvement. In addition, the use of vapour-phase molecularsieves for final dehydration of the ethanol in place of azeotropic distillation since the early 1990shas led to a drop in energy consumption [8]. The actual values for dry mill plants represent theresults of a US survey in September 2001, so can be considered typical of current production.The difference between this figure and that for the 1980s technology goes a long way towardsexplaining the wide variations reported in literature studies.
Proposal forour study

FWG-P-04-024_WTW wheat to EtOH.doc Page 14
The two centre bars represent two studies of older plants (Marland for corn ethanol in 1990 [9],Woods for a plant in Zimbabwe using 1980s technology [10]). These confirm the higher energyconsumption of older plants.
ETSU's 1996 study [11] has been widely quoted, but has also been criticised for the high primaryenergy value calculated for ethanol production. The authors of this report agree that the value of0.78GJ of primary energy per GJ primary, or 20.8 GJ/t EtOH, calculated in the ETSU study is toohigh. However, the basic requirements for steam and electricity used by ETSU (and as input tothe JEC report) look reasonable and close to those for the current US dry-mill average.
The bottom bar shown on Figure 3 is SHU's 'Model 1'. It represents a plant fuelled by natural gasand electricity, so is representative of Model a. The values in [2] have been used to back-calculate the basic steam and electricity needs for the plant using the information provided in thenotes. The energy needed to dry the DDGS has also been added back into the figures (this washandled separately and not included in the tables of the original SHU study due to allocation byprice rather than substitution). These values are slightly lower than the US dry-mill average forthe 2000s, and are considered typical of a new plant using existing best practices.
There is, therefore, a consensus among these different studies that for a new plant, energy ofaround 0.4 GJ/GJ EtOH, or 10.7 GJ/t EtOH, expressed as steam plus electricity, is needed to powerthe ethanol plant, including dehydration/drying of the alcohol and the DDGS. SHU's Model 1 [2]has been chosen as the baseline for this study.
Efficient use of primary energy in ethanol productionClearly, the efficiency with which the above basic energy needs can be produced from primaryenergy will impact the overall energy and GHG figures. The process flow schemes of thedifferent models have been carefully considered to arrive at realistic numbers also representativeof best practice and latest technology.
6. Reference Systems6.1. Agriculture
In considering energy/GHG impacts of the agricultural crop, it is necessary to consider how theland would have been used if wheat for ethanol were not grown - the impact of producing ethanolis then calculated by difference. Attention has been restricted to land already in agriculture, sinceploughing up grassland or removing forest cover releases significant amounts of soil carbon andshould be discouraged. In terms of land use, it has been assumed that the wheat is grown on set-aside land, or land otherwise not used for cultivation. While the amount of set-aside land is limitedin the long term, it remains a realistic short term option.A credit has been applied for the avoided maintenance of set-aside land. It has been assumedthat straw can be removed from the field without detriment to the soil. In practice, there is apotential for subsequent crops to suffer water stress, except in well-watered areas. This is due toa reduction in the organic carbon content of the soil, which is released as carbon dioxide. A reportfrom the Netherlands [19] calculates that taking straw every year leads to a cumulative loss ofabout 1/3 of the soil carbon, equivalent to a total CO2 release of 92 kgCO2/ha. That would beenough to negate the benefit of taking straw for more than 60 years. However, other experts thinkthe effect is much smaller, or could be drastically reduced by changes in crop rotations.
The wheat yield from set-aside land may in practice be less than the assumption of 8t/ha - thisfigure is relevant to the best arable land (Eurostat figures for 1997 to 2003 show a UK average of7.68t/ha). Where a wheat crop replaces a break crop or fallow on land intensively used for cerealproduction, there is likely to be some reduction in wheat yields in this and future years. Themagnitude of the reduction will depend on the specific rotation pattern, and no correction has
FWG-P-04-024_WTW wheat to EtOH.doc Page 15
been applied here. However, although the agricultural inputs would remain the same at loweryields, the overall energy and GHG balances per tonne of ethanol produced are only slightlyaffected by changing this parameter.
6.2. Reference Petrol and DieselThe energy/GHG associated with production of petrol is needed to calculate the impact of itssubstitution by ethanol. The WTT (crude production/transport, refining, product distribution)process for petrol and diesel is efficient, using only about 15% of delivered fuel energy.
However, partitioning the refining energy/GHG emissions between petrol and diesel (and otherrefinery products) presents some problems. Historically, efforts have been made to estimate theamount of processing needed for the two fuels, awarding less energy/GHG to diesel than togasoline, which undergoes more extensive processing in the refinery. A recent example of thisapproach for Europe is the 2002 study by GM [7].
More recently, the JEC joint WTW study [4] used CONCAWE's refinery model to calculate themarginal impact of reducing petrol or diesel production, for example in response to substitution bybiofuels. This calculation indicated that in Europe more energy/GHG emission is associated withproducing marginal barrels of diesel than for petrol. This arises because diesel demand in Europeis high, with refineries producing maximum quantities. By comparison, changing petrol output isless energy intensive.
WTT balance Petrol DieselEnergyGJex/GJf
GHGkgCO2eq/GJf
energyGJex/GJf
GHGkgCO2eq/GJf
GM Euro Study 2002 0.16 13.1 0.12 10.2JEC 2003 0.14 12.5 0.16 14.2
Table 1. WTT balance for conventional fuelsNote (i) Suffix ex indicates the energy expended in producing the fuel; suffix f denotes fuel delivered to thevehicle; CO2eq includes GHG effects of CO2, CH4 and N2O:Note (ii): CO2 emitted on fuel combustion is 73.3gCO2eq/MJ for 2000 gasoline, 73.2gCO2eq/MJ for diesel.
The marginal calculation using the CONCAWE model is believed to provide the best estimate forEurope today. However, as shown in Table 1 the differences are relatively small and will notimpact on the calculations as much as the assumptions for ethanol production.

FWG-P-04-024_WTW wheat to EtOH.doc Page 16
7. Consensus Input DataBased on the above considerations, input data have been agreed that are representative of futureoptions for the UK.
7.1. Basic DataFarming data Fuel and energy data
Yield t/ha LHV GJ/t DieselHarvested wheat grain (16% water) 8.0 17.0 Primary energy factor GJp/GJ 1.16Dried wheat grain (3% water) 6.9 19.6 Direct CO2 emissions from diesel burning kg CO2/GJ 73.2Straw 3.3 14.6 CO2 emissions factor kg CO2/GJ 87.4Ethanol 2.3 26.7 Gasoline
t/t EtOH Primary energy factor GJp/GJ 1.14DDGS (10% moisture) 1.14 18.2 Direct CO2 emissions from diesel burning kg CO2/GJ 73.3
CO2 emissions factor kg CO2/GJ 85.8Greenhouse gas factors NG (EU-mix)
kg CO2eq/kg Primary energy factor GJp/GJ 1.06N2O 296 Emission factor kg CO2/GJ 61CH4 21 Electricity (UK-mix)
Energy factor GJp/GJe 3.08 Emission factor kg CO2/GJe 160
Table 2. Basic input data
After drying the yield is 6.9 t/ha of dwg supplied to the processing plant. Overall, 2.3 t/ha ofethanol can be produced, corresponding to a figure of 3.03 tonnes dwg per tonne ethanol. Thislatter figure is taken from the SHU and ETSU studies [2,11]. In addition, 3.3 tonnes of straw areproduced per hectare.
The energy used in the production of diesel (used as fuel in agriculture and transport), natural gas(used as fuel in the production plant) and gasoline (the reference fuel) is reflected in the PrimaryEnergy Factors of 1.16, 1.06 and 1.14 respectively [4], and are based on the EU average. TheCO2 emissions associated with the WTT energy are added to the CO2 released upon combustionto give a WTT CO2 emission figure.
Similar figures are shown for electricity. As mentioned in section 4.3 these figures represent aUK-average. Finding sufficiently detailed and reliable data which would include all impacts of theproduction process (well-to-tank), proved surprisingly difficult - the figures used [12], which wereagreed as satisfactory by the team, are representative for the UK, and somewhat higher than theEuropean average.
7.2. Grain production and delivery to the processing plantTable 3 shows the figures used for wheat production. There seems to be good agreement on theenergy needs for agriculture and the differences seen between studies were not large. Thefigures for fertiliser are all expressed per kg of elemental N, P or K. Production energy and GHGfigures follow the study of Kaltschmitt and Reinhardt [13].
Field N2O emissions remain a difficult area. As shown in Figure 2, Freibauer and Kaltschmitt [6]give figures from 1-5 kg of nitrogen emitted as N2O per hectare of land for different regions of theUK (1.6-7.8 kg N2O/ha). Extensive work has been carried out in this area by the Soils and WasteUnit, Institute of Environment and Sustainability, JRC, Ispra. We used their database-model,GReenhouse Emissions from Agricultural Soils in Europe (GREASE) [14], to calculate averageUK emissions. The calculation is based on detailed data for the UK, including soil types, weatherand which croplands are used for wheat. The result of this calculation, a UK average of 4.36kgN2O per hectare has been used.
Strictly, we should correct for the N2O emissions associated with fallow land. However in theabsence of reliable figures and in view of the very high variability of the estimates, no correctionhas been applied. Similarly, as explained above, no correction to wheat yield has been made for
FWG-P-04-024_WTW wheat to EtOH.doc Page 17
the loss of the break crop. Information on the calculation method and data sources is given inappendix 2, but this remains an area where further research is needed.
The inputs of N P and K fertilisers are significantly more when the straw is removed, eventuallyresulting in a 30% increase in GHG emissions from agriculture. The agricultural inputs wereadjusted according to figures provided by SHU.
Case Basic Energy Inputs
Straw ploughed
back
All straw removed
B1. Wheat farmingDiesel for cultivationConsumption GJ/ha 5.02Credit for use of set-aside GJ/ha -0.92Total primary energy GJp/ha 4.8Total GHG emissions kg CO2/ha 358Agrochemicals and fertilizersUsage kg/ha K fertilizer (as K) 46 164 P fertilizer (as P) 41 53 N fertilizer (as N) 185 253 Pesticides 2 2 Seed material 185 185Production primary energy MJ/kg K fertilizer 9.3 P fertilizer 15.8 N fertilizer 40.6 Pesticides 274.1 Seed material 13.5Production GHG emissions kg CO2/kg K fertilizer 0.46 P fertilizer 0.71 N fertilizer 6.69 Pesticides 5.41 Seed material 0.87Total primary energy required GJp/ha 11.63 15.68Total GHG emissions kg CO2/ha 1459 1977N2O emissions kg N2O/ha 4.36 5.96Total for farmingPrimary energy GJp/ha 16.38 20.43GHG emissions kg CO2eq/ha 3108 4100B2. Grain handling and storageDiesel for drying GJ/ t dwg 0.66Primary energy GJp/ t dwg 0.77GHG emissions kg CO2/ t dwg 58Storage(electricity) GJe / t dwg 0.042Primary energy (EU-mix) GJp/ t dwg 0.13GHG emissions kg CO2/ t dwg 7B3. Dried grain and straw transportationMode Road/diesel fuelDistance (one-way) km 50Diesel consumption for road transp MJ/t.km 0.97Requirement per tonne transportedPrimary energy GJp/t 0.056GHG emissions kg CO2eq/t 4.2Total for dwg at ethanol plant gatePrimary energy GJp/ t dwg 3.32 3.90GHG emissions kg CO2/ t dwg 517 661
Table 3. Energy and GHG figures for grain production and supply

FWG-P-04-024_WTW wheat to EtOH.doc Page 18
Heat for drying of the grain is assumed to be produced from diesel fuel. A small allowance ofelectricity is made for storage. Average transport distance for the grain and straw is assumed tobe 50 km.
The total energy and GHG emissions associated with the production and transport of the driedwheat grain to the ethanol plant are shown at the bottom of Table 3. The higher figures for the 'allstraw removed' case reflect the higher fertiliser inputs and also transport of the wheat straw to theplant.
7.3. Ethanol Production & DistributionThe basic energy requirements for the ethanol production process, excluding by-product creditsare shown in Table 4. Note that these are expressed as heat or electricity - the primary energyneeds are calculated later.
Energy requirementMilling (electricity) GJe / t dwg 0.20Hydrolysis/fermentation/distillation As heat GJ / t dwg 1.80 As electricity GJe / t dwg 0.28Dehydration (electricity) GJe / t dwg 0.01DDGS drying (heat) GJ / t dwg 1.41Total energy requirement As heat GJ heat / t dwg 3.22
GJ heat / t EtOH 9.75 As electricity GJe / t dwg 0.48
GJe / t EtOH 1.45Ethanol yield t dwg / t EtOH 3.03
Table 4: Energy requirement for ethanol production
Electricity is required for milling of the grain as well as for the other steps to power rotatingequipment, provide lighting etc. However, steam heat provides the bulk of the energy needs forhydrolysis, fermentation, distillation and dehydration of the ethanol, and drying of the DDGS. Notethat the latter represents a significant portion of the total energy input (credits for DDGS arecalculated later).
The amount of primary energy needed to supply these basic requirements depends on thedifferent scenarios represented by the various models. The potential efficiencies for steam andelectricity generation and heat extraction have been studied in some depth, taking account oflatest industry experience [18]. Details of the data used, including efficiencies, are given inAppendix 1. A summary of the results is given in Table 5 below.

FWG-P-04-024_WTW wheat to EtOH.doc Page 19
Model Basic Energy Inputs
aNG boiler +
grid
b1NG boiler +
BPSTG
b21NG GT+unfired HRSG+BPSTG
b22NG GT+
fired HRSG+BPSTG
c1Straw boiler +
BPSTG
c2Straw boiler + BP/cond STG
Energy supplyRecoverable enthalpy of steam at 3MJ/t 2194Required steam for process t/t EtOH 4.4Steam heat content at boiler outlet MJ/t 3116 3366 3366 3366 3366 3366Required HP steam production t/t EtOH 4.0 4.4 4.4 4.4 4.4 4.4Heat from condensate recovery (50MJ/t steam 292Net heat required at boiler outlet GJ/t EtOH 11.19 13.66 13.66 13.66 13.66 13.66GT elec / heat ratio GJe/GJ 0.56 0.26GT electricity production GJe/t EtOH 7.66 3.57Straw intake t/t EtOH 0.00 0.00 0.00 0.00 1.42 1.42
GJ/t EtOH 20.79 20.79Boiler efficiency 95% 95% 88% 88%Heat produced at boiler outlet GJ/t EtOH 18.30 18.30
t/t EtOH 5.4 5.4Electricity from backpressure turbinGJe/t EtOH 0.65 2.88 2.88 2.88 3.52 2.88Electricity from condensing turbine GJe/t EtOH 1.20 1.19Overall requirement for manufactureNG consumption GJ/t EtOH 11.78 14.38 27.21 18.20Electricity import GJe / t EtOH 1.45Primary energy GJp / t EtOH 16.96 15.24 28.85 19.29 20.79 20.79GHG emissions kg CO2 / t EtOH 948 874 1655 1107 0 0Heat surplus GJ / t EtOH 4.64 0.00Electricity surplus GJe / t EtOH 0.00 1.43 9.09 5.00 2.07 2.62
GJe/GJEtOH 0.08 0.34 0.19 0.08 0.10Overall efficiency on primary energy 66.1% 82.9% 70.3% 84.0% 63.8% 60.8%
Table 5. Energy consumption and GHG emissions in the ethanol plant.
Model a is relatively inefficient as it uses electricity from the grid. Taking advantage of thecombined heat and power opportunity boosts the efficiency of fossil fuel usage & powergeneration, even when using a conventional boiler scheme (Model b1).
The introduction of a gas turbine appears to have the paradoxical effect of increasing fossil fuelusage (Model b21). This is because this model produces a lot more electricity. Introducing co-firing in the HRSG (Model b22) decreases again the electricity to heat ratio and the efficiencyincreases.
Straw burning is somewhat less efficient partly because of a less efficient boiler but also becauseof the assumption that all straw is burned. In Model c1 some heat is wasted whereas in Model c2it is used to generate electricity without the benefit of CHP for this marginal production.
The above considerations show how the final efficiency figures result from an array ofassumptions, and how direct and simplistic comparisons can be misleading. It should also benoted that, in practice, schemes are likely to be selected more on the basis of economicprofitability than maximum energy or GHG savings.
7.4. By-product creditsWhen surplus electricity for export is produced, it is assumed that it will replace the same amountotherwise produced according to the UK-mix (see Table 2). The credit for DDGS has beenevaluated as explained in section 4.1.
If DDGS is used as animal feed it could substitute soya meal imported into the EU from the USA.The credit associated to this has been calculated in the JEC study. From the same data and aftercorrection for the use of a slightly different DDGS yield, figures of 0.12 GJ and 15.3 kg CO2 perGJ ethanol have been adopted for illustrative purposes in this study.
A similar calculation for substituting maize gluten from US maize ethanol is reported in [5], wherethe DDGS credit is given as 13115 BTU/USgal, which is equivalent to 3.66 GJp/tEtOH, or 0.14GJp/GJEtOH. Calculations by Reinhardt [17] for rape seed meal are estimated by us to give a figureequivalent to 4.70 GJp/tEtOH or 0.18 GJp/GJEtOH. Hence the figures based on soya protein andcould be regarded as conservative. More research would be welcomed in this area.

FWG-P-04-024_WTW wheat to EtOH.doc Page 20
If DDGS is used as energy source it will substitute UK-mix electricity and the primary energyavailable is assumed to be equal to the lower heating value of DDGS. Existing studies of energycontent of DDGS [eg 16] have concentrated on its food energy value, and we could only findlimited data on the thermal energy content [16]. Because the elemental composition is broadlysimilar, we have assumed that the LHV of DDGS is the same as for wheat grain, and have usedthis figure with a correction for water content (see Table 2). More research would be welcomed inthis area.
7.5. Revenues and costsWithin the scope of this study, a detailed cost evaluation was not possible; however indicativefigures have been produced.
An attempt has been made to evaluate the economics of ethanol production from the point ofview of a 100 kt/a ethanol plant. This evaluation assumes that the prices of all materials(feedstocks, process materials and products) behave like commodities i.e. are determined by aninternational market. No tax or subsidy schemes are taken into account.
The overall cost of ethanol production is dependant upon: costs of the feedstocks and otherprocess materials, the value of the products, plant operating costs and the capital costsassociated with building the plant. These have been assessed in order to give a ranking of thescenario’s in terms of cost effectiveness for carbon reduction.
Dwg GBP/t 75Straw GBP/t 25DDGS GBP/t 75
NG p/th 32GBP/GJ 3.03
Electricity GBP/MWh 29.5GBP/GJ 8.2
Gasoline GBP/GJ 5.1Table 6. Commodity prices
The commodity price for DDGS reflects its value as animal feed. Its value as fuel should normallybe lower, however the market created by the Renewable Fuels Obligations will influence this. Noattempt has been made to predict the eventual value for this application.
The capital and operating costs for the ethanol plant have been estimated as follows:Model a
NG boiler + grid
b1NG boiler +
steam turbine
b21NG GT+
steam gen+steam turbine
b22NG GT+
fired steam gen+steam turbine
c1Straw boiler
+ steam turbine
c2Straw boiler
+ steam turbine +
condensing turbine
Capex MGBP 40 43 50 52 70 75Capital charge MGBP/a 15% 6.0 6.5 7.5 7.8 10.5 11.3Opex % of capex /a 2.5% 4.0% 4.0% 4.0% 4.0% 4.0%
MGBP/a 1.0 1.7 2.0 2.1 2.8 3.0Annual cost MGBP/a 7.0 8.2 9.5 9.9 13.3 14.3
Table 7. Ethanol plant capital and operating costs
The increasing capital cost reflects the increasing complexity of the plant, particularly when itcomes to handling and burning straw. The 15% capital charge corresponds, under typical

FWG-P-04-024_WTW wheat to EtOH.doc Page 21
European economic circumstances, to an Internal Rate of Return of 8%, but may not reflect thereal risks to the investor in this emerging industry.
For operating costs, the figure of 2.5% of CAPEX is fairly standard for usual process plants. Thishas been increased to 4% for all b and c models to reflect the relative complexity of these plants.
Results of the calculation are shown in Section 8.
8. WTT ResultsWith the assumptions described above and the data given in section 7, all calculations can nowbe completed. The gross energy and GHG balances, before credits, are shown in Table 8. Thispicture without credits is incomplete, but shows the starting point in a transparent manner.
For Model a, the basic plant fuelled by natural gas and grid electricity, the total energy input isslightly higher than the energy contained in the produced ethanol. This decreases to 95% of theethanol energy in the more efficient model b1 where CHP is used.
Model b2, using a gas turbine, at first looks less efficient, requiring more input energy. Thereason for that is the much larger surplus of electricity that is exported to the grid.
Model c1 and c2 clearly show the reduction in fossil energy inputs due to the use of straw in theproduction plant. Total energy used is again higher than for scenario a, but again the exportedelectricity needs to be considered to see the whole picture.
Model aNG boiler +
grid
b1NG boiler +
steam turbine
b21NG GT+
steam gen+steam turbine
b22NG GT+
fired steam gen+steam turbine
c1Straw boiler
+ steam turbine
c2Straw boiler
+ steam turbine +
condensing turbine
Overall gross balanceTotal fossil energy input GJf/GJ EtOH 1.02 0.95 1.46 1.11 0.45 0.45Primary Total Energy Input GJp/GJ EtOH 1.02 0.95 1.46 1.11 1.23 1.23
GJp/t Et OH 27.2 25.5 39.1 29.5 32.9 32.9Farming 7.2 7.2 7.2 7.2 8.9 8.9Transport + drying 2.9 2.9 2.9 2.9 3.0 3.0Manufacture 17.0 15.2 28.8 19.3 20.8 20.8Distribution 0.2 0.2 0.2 0.2 0.2 0.2GHG emissions kg CO2eq / GJ EtOH 94.7 91.9 121.2 100.6 75.7 75.7
kg CO2eq / t EtOH 2529 2455 3235 2687 2020 2020Farming (CO2) 795 795 795 795 1021 1021Farming (N2O) 564 564 564 564 772 772Transport + drying 208 208 208 208 214 214Manufacture 948 874 1655 1107 0 0Distribution 13 13 13 13 13 13
Table 8. Gross energy and GHG balances (without by-products credits)
N2O emissions play a major role in the total representing 40% of the agricultural GHG emissionsand about 20 to 30% of the total depending on the Model. The results are therefore sensitive to achange in assumptions regarding these emissions.
Table 9 shows the net balance including credits for surplus electricity and DDGS use as animalfeed.

FWG-P-04-024_WTW wheat to EtOH.doc Page 22
Model Basic Energy inputs
aNG boiler +
grid
b1NG boiler +
steam turbine
b21NG GT+
steam gen+steam turbine
b22NG GT+
fired steam gen+steam turbine
c1Straw boiler
+ steam turbine
c2Straw boiler
+ steam turbine +
condensing turbine
Overall net balanceCredit for surplus electricityPrimary energy credit GJp/ GJ EtOH 0.00 -0.16 -1.05 -0.58 -0.24 -0.30
GJp/ t EtOH 0.0 -4.4 -28.0 -15.4 -6.4 -8.1GHG credit kg CO2 / GJ EtOH 0.00 -8.55 -54.47 -29.95 -12.41 -15.69
kg CO2 / t EtOH 0 -228 -1454 -800 -331 -419Net balance: DDGS as animal feedDDGS creditPrimary energy credit GJp/ GJ EtOH -0.12
GJp/ t EtOH -3.13GHG credit kg CO2eq / GJ EtOH -15.3
kg CO2eq / t EtOH -407Total fossil energy input GJf/GJ EtOH 0.90 0.67 0.30 0.41 0.10 0.03Fossil energy saved 21% 41% 74% 64% 92% 97%Primary Total Energy Input GJp/GJ EtOH 0.90 0.67 0.30 0.41 0.87 0.81
GJp/t EtOH 24.0 17.9 7.9 11.0 23.4 21.7Farming 7.2 7.2 7.2 7.2 8.9 8.9Transport + drying 2.9 2.9 2.9 2.9 3.0 3.0Manufacture 13.8 7.7 -2.3 0.8 11.3 9.6Distribution 0.2 0.2 0.2 0.2 0.2 0.2GHG emissions kg CO2eq / GJ EtOH 79.5 68.1 51.4 55.4 48.0 44.7GHG avoided 7% 21% 40% 35% 44% 48%
kg CO2eq / t EtOH 2122 1819 1374 1480 1282 1194Farming 1359 1359 1359 1359 1793 1793Transport 208 208 208 208 214 214Manufacture 541 238 -207 -101 -739 -826Distribution 13 13 13 13 13 13
Table 9. Net balance, DDGS as animal feed
Model a attracts no electricity credit, since it is a net consumer of electricity (the debit due to theelectricity import is already factored into the gross balance calculation). Note that the electricitycredit can be extremely large, particularly in Model b21 where it accounts for more than 2/3 of thegross energy and around 2/5 of the GHG emissions.
The DDGS credit further reduces the net energy requirement and GHG emissions. Its effect ismore important on GHG because of the impact of N2O emissions in the soya meal cycle.
In terms of fossil energy usage the 6 models now range from 90% of the ethanol energy tovirtually none for Model c2. The ranking is the same for GHG emissions although the savings arelower because of the contribution of N2O from agriculture.Comparing with the reference gasoline case, it is possible to calculate the fossil energy savedand the CO2 eq (or GHG) avoided as a percentage of what would have been used and emittedwhen using a GJ of gasoline instead of ethanol. These figures are also shown in Table 9.
The alternative use of DDGS considered is as a source of energy for co-firing in power stationsfor instance as part of the UK renewable electricity obligation. This would mirror a real scenariowhere a growing volume of bioethanol derived DDGS reduces the value of the animal feed andenhances the attractiveness of biomass (hence DDGS) co-firing. Although this may be lesseconomic, it can produce significant energy and GHG credits. The corresponding net balance isshown in Table 10. It is assumed that DDGS used for power generation substitutes UK gridelectricity.

FWG-P-04-024_WTW wheat to EtOH.doc Page 23
Model Basic Energy inputs
aNG boiler +
grid
b1NG boiler +
steam turbine
b21NG GT+
steam gen+steam turbine
b22NG GT+
fired steam gen+steam turbine
c1Straw boiler
+ steam turbine
c2Straw boiler
+ steam turbine +
condensing turbine
Overall net balanceCredit for surplus electricityPrimary energy credit GJp/ GJ EtOH 0.00 -0.16 -1.05 -0.58 -0.24 -0.30
GJp/ t EtOH 0.0 -4.4 -28.0 -15.4 -6.4 -8.1GHG credit kg CO2 / GJ EtOH 0.00 -8.55 -54.47 -29.95 -12.41 -15.69
kg CO2 / t EtOH 0 -228 -1454 -800 -331 -419Net balance: DDGS as co-fuel for power plantDDGS creditPrimary energy credit GJp/ GJ EtOH -0.78Primary energy credit GJp/ t EtOH -20.8Electricity generation GJe/t EtOH 6.74GHG credit kg CO2eq / GJ EtOH -40.4
kg CO2 / t EtOH -1079Total fossil energy input GJf/GJ EtOH 0.24 0.01 -0.36 -0.25 -0.56 -0.63Fossil energy saved 79% 99% 132% 122% 150% 155%Primary Total Energy Input GJp/GJ EtOH 0.24 0.01 -0.36 -0.25 0.21 0.15
GJp/t EtOH 6.4 0.3 -9.7 -6.6 5.7 4.0Farming 7.2 7.2 7.2 7.2 8.9 8.9Transport + drying 2.9 2.9 2.9 2.9 3.0 3.0Manufacture -3.8 -9.9 -19.9 -16.9 -6.3 -8.0Distribution 0.2 0.2 0.2 0.2 0.2 0.2GHG emissions kg CO2eq / GJ EtOH 54.3 43.0 26.3 30.3 22.9 19.6GHG avoided 37% 50% 69% 65% 73% 77%
kg CO2eq / t EtOH 1450 1148 702 809 610 523Farming 1359 1359 1359 1359 1793 1793Transport + drying 208 208 208 208 214 214Manufacture -130 -433 -878 -772 -1410 -1498Distribution 13 13 13 13 13 13
Table 10. Net balance, DDGS as energy source for power generation
Use of DDGS as an energy source generates larger credits. In fact in Models b21/2 and c morethan 100% of the ethanol energy can be saved. This simply means that, through the use of by-products as energy sources, large amounts of additional fossil energy can be saved. Whether thebenefit of this saving should be solely attributed to the ethanol is an issue, since ethanol is not theonly output, but the total fossil energy saved is not in question. The CO2/GHG reductions arelarge but less impressive, again because of the emissions from agriculture.
An analysis was conducted on cost to assess the relative ranking of the scenario’s with regards‘cost of avoiding GHG emissions’. The data presented follow a simplified economic model, andare not meant to be used for financial decisions. In order to look into cost it is convenient to fix atypical installation size. The example of a 100 kt/a ethanol plant has been used, which is a typicalcapacity envisaged in current studies and projects. The calculations are based on the figurespresented in section 7.
Table 11 shows the plant margin calculation as well as the cost of CO2/GHG avoided for the casewhere DDGS is used as animal feed. The cost calculation for the case where DDGS is used asenergy is not presented here, since predicting the economic value of DDGS as a fuel is difficult.Costs for adapting power plants to burn this type of feedstock would also need to be considered.
The calculation credits the ethanol with the value of an equivalent amount of gasoline, on anenergy basis. In reality, of course, ethanol is more costly than gasoline, so the calculationgenerates a net loss for the process: the size of the deficit is an indicator of the relative costs forthe different models.
In none of the configurations does the plant produce a positive net or gross margin. In otherwords, with the price scenario envisaged which represents today’s commercial reality, andwithout subsidies, ethanol production for road fuel is not profitable.

FWG-P-04-024_WTW wheat to EtOH.doc Page 24
Model Basic Energy inputs
aNG boiler +
grid
b1NG boiler +
steam turbine
b21NG GT+
steam gen+steam turbine
b22NG GT+
fired steam gen+steam turbine
c1Straw boiler
+ steam turbine
c2Straw boiler
+ steam turbine +
condensing turbine
Ethanol plant marginDDGS as animal feed (Soya meal substitution)Total in MGBP/aDW grain -22.7 -22.7 -22.7 -22.7 -22.7 -22.7NG -3.6 -4.4 -8.3 -5.5 0.0 0.0Grid electricity -1.2 0.0 0.0 0.0 0.0 0.0Straw 0.0 0.0 0.0 0.0 -3.6 -3.6Total outEtOH 13.6 13.6 13.6 13.6 13.6 13.6DDGS 8.6 8.6 8.6 8.6 8.6 8.6Electricity 0.0 1.2 7.4 4.1 1.7 2.1Gross margin -5.4 -3.8 -1.4 -2.0 -2.5 -2.0Capex MGBP 40 43 50 52 70 75Capital charge MGBP/a 15% 6.0 6.5 7.5 7.8 10.5 11.3Opex % of capex /a 2.5% 4.0% 4.0% 4.0% 4.0% 4.0%
MGBP/a 1.0 1.7 2.0 2.1 2.8 3.0Annual cost MGBP/a -7.0 -8.2 -9.5 -9.9 -13.3 -14.3Net margin MGBP/a -12.4 -12.0 -10.9 -11.9 -15.8 -16.3
p/l -9.8 -9.4 -8.6 -9.4 -12.4 -12.8EUR/l -14.6 -14.2 -12.9 -14.1 -18.7 -19.3
Cost relative to b1 1.03 1.00 0.91 1.00 1.32 1.36GHG avoided kt/a CO2eq 17 47 92 81 102 110Cost of GHG avoided GBP/tCeq 2662 927 435 537 569 540
EUR/t CO2eq 1089 379 178 220 233 221Relative cost of GHG avoided 2.87 1.00 0.47 0.58 0.61 0.58
Table 11. Economic margin and cost of GHG avoided (DDGS as animal feed)
Too much should not be read into the absolute cost figures - a more detailed economicassessment is needed before commercial decisions are taken. However, they do show relativerankings.
In terms of cost per tonne carbon, model b21 has the best profile, indicating that even though thestraw burning models (c1 and c2) have higher emission reductions, the additional costs may notbe justifiable. Model a has very poor cost effectiveness due to its low level of carbon savings.
Table 12 and Figures 4, 5 and 6 summarise the main figures.
Model Basic Energy inputs
aNG boiler +
grid
b1NG boiler +
steam turbine
b21NG GT+
steam gen+steam turbine
b22NG GT+
fired steam gen+steam turbine
c1Straw boiler
+ steam turbine
c2Straw boiler
+ condensing
turbine
Gasoline
Fossil energy balance GJf/GJ road fuelGross 1.02 0.95 1.46 1.11 0.45 0.45 1.14Net of credits DDGS as animal feed 0.90 0.67 0.30 0.41 0.10 0.03 DDGS as energy 0.24 0.01 -0.36 -0.25 -0.56 -0.63GHG emissions kg CO2eq/GJ road fuelGross 94.7 91.9 121.2 100.6 75.7 75.7 85.8Net of credits DDGS as animal feed 79.5 68.1 51.4 55.4 48.0 44.7 DDGS as energy 54.3 43.0 26.3 30.3 22.9 19.6GHG avoided kg CO2eq/GJ road fuel DDGS as animal feed 6.4 17.7 34.4 30.4 37.8 41.1 DDGS as energy 31.5 42.9 59.5 55.5 63.0 66.3Cost parameters (DDGS as animal feed)Economic margin deficit p/l -9.8 -9.4 -8.6 -9.4 -12.4 -12.8Cost relative to b1 1.03 1.00 0.91 1.00 1.32 1.36Cost of GHG avoided GBP/t Ceq 2662 927 435 537 569 540Relative cost of GHG avoided 2.87 1.00 0.47 0.58 0.61 0.58
Table 12. Summary of main results and indicators

FWG-P-04-024_WTW wheat to EtOH.doc Page 25
Fossil Energy Input GJ/GJ
0.0
0.2
0.4
0.6
0.8
1.0
1.2
1.4
1.6
Gasolin
e a b1b21 b22 c1 c2
Gross
DDGS as animal feed +electricity export
Figure 4. Fossil energy Inputs
GHG emissionskgCO2eq/GJ
0.0
20.0
40.0
60.0
80.0
100.0
120.0
140.0
Gasolin
e a b1b21 b22 c1 c2
Gross
DDGS as animal feed +electricity export DDGS as energy +electricity export
Figure 5. GHG Emissions
Relative Costs
0.0
0.2
0.4
0.6
0.8
1.0
1.2
1.4
b1 b21 b22 c1 c2
Relative cost per litreRelative cost per tonne C
Figure 6. Relative costs

FWG-P-04-024_WTW wheat to EtOH.doc Page 26
9. Conclusions
1. This study has reached consensus on almost all aspects of the methodology forproducing ethanol from wheat. Improved understanding is still needed on N2O emissions,DDGS credits.
2. All models analysed show lower WTT energy/emissions than gasoline, but how the fuel ismade has a big impact.
3. Policy makers should look for these factors to maximise GHG and energy benefitsa. Incorporation of CHP improves efficiency.b. Use of straw as an energy source.c. Use of DDGS as energy for power generation.
4. The most efficient models are more costly. Costs should be considered in relation to theenvironmental savings.
FWG-P-04-024_WTW wheat to EtOH.doc Page 27
10. References1. Carbon and Energy Balances for a Range of Biofuels Options: M A Elsayed, R Matthews
and N D Mortimer, Resources Research Unit, Sheffield Hallam University. Project numberB/B6/00784/REP for the DTI, March 2003.
2. Energy and Greenhouse Gas Emissions for Bioethanol Production from Wheat Grain andSugar Beet: N D Mortimer, M A Elsayed and R E Horne, Resources Research Unit, SheffieldHallam University. Final Report for British Sugar, Report No 23/1, January 2004.
3. Technology Status Review and Carbon Abatement Potential of Renewable Transport Fuels inthe UK: J Woods and A Bauen, Centre for Energy Policy and Technology, Imperial CollegeLondon. B/U2/00785/REP, URN 03/982 for the DTI, 2003
4. Well-to-Wheels Analysis of Future Automotive Fuels and Powertrains in the EuropeanContext (the JEC Study): CONCAWE, EUCAR and the Joint Research Centre of the EUCommission, Ispra, November 2003.Available for download at http://ies.jrc.cec.eu.int/Download/eh
5. The Energy Balance of Corn Ethanol: An Update: Hosein Shapouri, James A Duffield andMichael Wang. Report no 813, US Department of Agriculture, Office of Energy Policy andNew Uses, July 2002
6. Biogenic Greenhouse Gas Emissions from Agriculture in Europe, European Summary Reportof the EU Concerted Action FAIR-CT96-1977: Freibauer & Kaltschmitt, Institut für rationelleEnergieanwendungen (IER), Stuttgart, February 2001
7. GM Well-to-Wheel Analysis of Energy Use and Greenhouse Gas Emissions of AdvancedFuel/Vehicle Systems: L-B-Systemtechnik GmbH, September 2002.Available for download at http://www/lbst.de/gm-wtw
8. Private communication to CONCAWE: A Groves, Shell Global Solutions, 8 July 2003.
9. CO2 Emissions from the Production and Combustion of Fuel Ethanol from Corn: G Marlandand A F Turhollow, Oak Ridge National Laboratory. Energy Vol 16, No 11/12, pp 1307-1316,1991
10. Integrating Sweet Sorghum and Sugarcane for Bioenergy: Modelling the Potential forElectricity and Ethanol Production in SE Zimbabwe. J Woods, PhD Thesis, King's CollegeLondon, 2000
11. Alternative Road Transport Fuels - A Preliminary Study for the UK: M P Gover, S A Collings,G S Hitchcock, D P Moon and G T Wilkins. ETSU Report R92 for DTI and DfT, March 1996.
12. 'WTT' UK Electricity Generation figures: N Mortimer, private communication based on"Methodology for Environmental Profiles of Construction Materials, Components andBuildings" Centre for Sustainable Construction at the Building Research Establishment Ltd.,CRC Ltd., London, United Kingdom, 2000.
13. "Nachwachsende Energieträger – Grundlagen, Verfaben, Ökologische Bilanzierung"(Renewable Energy Sources, Basis, Processes and Ecological Balance) by M. Kaltschmittand G. A. Reinhardt (eds), Vieweg, Braunschweig/Weisbaden, Germany,1997
14. GReenhouse Emissions from Agricultural Soils in Europe (GREASE). Database modeldeveloped by the Soils and Waste Unit, Institute of Environment and Sustainability, JRC,Ispra.
15. James Charteris Hough, Trident Feeds: Personal communication to British Sugar
16. Metabolizability to Ruminants of Distillers Dark Grains', Rowett Research Institute, Sep 1991(study commissioned by United Distillers).

FWG-P-04-024_WTW wheat to EtOH.doc Page 28
17. Pros and Cons of RME Compared to Conventional Diesel Fuel; G A Reinhardt & N Jungk. InProceedings of 3rd International Colloquium on Fuels, Technische Akademie Esslingen, edW J Bartz, January 2001
18. Private communications on heat/electricity generating efficiencies for boiler and turbinesystems: N S Keesecker, ExxonMobil Research & Engineering & G Punter, British Sugar
19. P. Kruikman et. al, Stocks of C in soils and emissions of CO2 from agricultural soils in theNetherlands: ALTERRA report 561, ISSN 1566-7197.

FWG-P-04-024_WTW wheat to EtOH.doc Page 29
11. Abbreviations
BPSTG Back Pressure Steam Turbine Generator - a steam turbine used to generateelectricity, but leaving sufficient pressure/heat in the exhaust steam to provideprocess heat needs
cond STG Condensing Steam Turbine Generator - a steam turbine used to generateelectricity using all the available heat in the steam: the exhaust is effectively hotwater.
CHP Combined Heat and Power - an efficient way of using primary energy, whereboth electricity and heat are produced and used.
co-firing Simultaneous combustion of two fuels in the same unit, eg partial substitution ofcoal by biomass in power generation.
CONCAWE The Oil Companies' European Organisation for Environment, Health and Safety.
DDGS Distiller's Dark Grains and Solubles - the residue from the fermentation anddistillation process
dwg Dried Wheat Grain
EUCAR European Council for Automotive R&D (an organisation of the European carmanufacturers)
FAME Fatty Acid Methyl Ester (biodiesel)
GHG Greenhouse Gas
LowCVP Low Carbon Vehicle Partnership
HRSG Heat Recovery Steam Generator - in this context used to recover heat from theexhaust of a gas turbine, producing steam for process needs.
hwg Harvested Wheat Grain
ICEPT Centre for Energy Policy and Technology, Imperial College London
JEC The JEC Study - abbreviates reference to the joint WTW study of JRC, EUCARand CONCAWE, 2003.
JRC Joint Research Centre of the European Commission. JRC Ispra, Institute forEnergy Studies contributed to this report
SHU Sheffield Hallam University
TTW Tank-to-Wheel, i.e. use of the fuel in a vehicle
WTW Well-to-Wheels - generic name for the fuel path from primary enrgy to use in thevehicle
WTT Well-to-Tank - generic name for the fuel production process from primary energyto the vehicle tank.

FWG-P-04-024_WTW wheat to EtOH.doc Page 30
APPENDIX 1Ethanol manufacturing plant: Energy generation optionsThe ethanol manufacturing process requires energy principally in the form of low temperatureheat and a relatively small amount of electricity. In the process industry, the common medium totransfer low temperature heat is low pressure steam. Electricity can be either purchased from thegrid or generated on site.
Steam can be efficiently produced at high pressure and temperature in a conventional boiler.Various fuels can be used, natural gas being the most popular because of its wide availability,relative cleanliness and a relatively simple hardware requirement. In the case of ethanolproduction, straw can, in certain cases be available and can also be used as boiler fuel albeit witha rather more complex system (for handling as well as burning the straw).
Steam is also the normal medium to produce electricity in a thermal cycle. Without electricityproduction the steam is “let-down” to a lower pressure and also “desuperheated” i.e. cooled downby the addition of extra liquid water. The outlet conditions are then suitable for use in the process.Electricity is produced via a steam turbine coupled to an electricity generator (Steam TurboGenerator of STG). A “condensing” STG operates at lower than atmospheric outlet pressure andincludes a water-cooled condenser thereby maximising electricity production.
The requirement for low grade heat gives a very good case for “combined heat and power”(CHP). Indeed a so-called “backpressure” or “extraction” STG can be installed with an outletpressure corresponding to the process steam requirements. The overall efficiency of such ascheme is much better than the combined efficiency of separate heat and power production.
When natural gas is the available fuel, a further refinement of the scheme is to replace theconventional boiler by a gas turbine (GT) coupled to a heat recovery steam generator (HRSG). Agas turbine is in its principle similar to a jet engine. The compressed fuel/air mixture is burned in achamber and the hot flue gases drive a turbo-generator and an air compressor mounted on acommon shaft. The exhausting flue gases are still very hot and are used to generate steam in theHRSG. Additional firing can also be applied in the HRSG to produce additional steam at a veryhigh marginal efficiency. When combined with an STG as described above, the complete schemeis known as “combined cycle” and is the most efficient way of producing electricity today (typically55% efficiency on natural gas).
We have considered 6 models covering the range of possibilities described above. They aredescribed below including consumption and production figures expressed for 1 tonne of ethanolproduced.
In models a and b, the size of the equipment if determined by the heat requirement of the plant. Inmodels c the determining factor is the amount of straw available.
Only part of the enthalpy of the steam supplied at 3.5 bara and 160°C can be passed on to theprocess. The recoverable steam enthalpy is assumed to be the difference between the totalsteam enthalpy and that of liquid water at the same conditions. The actual steam requirement intonnes is estimated based on the recoverable steam enthalpy. As part of the calculation of theboiler duty it is further assumed that 50% of the hot water heat is recovered when condensate isrecycled.

FWG-P-04-024_WTW wheat to EtOH.doc Page 31
Model aConventional natural gas-fired steam boiler + imported electricity
Model a Ethanol plant energy generation scheme
Dwg: 3.03 t Ethanol: 1 t
Straw: 0 t DDGS: 1.14 t
NG: 11.8 GJ
Elec: 1.5 GJe Elec: 0 GJe
BFW
NGLP steam to process
Boiler HP steam
This is the simplest (and cheapest) scheme but also the least efficient. No advantage is taken ofthe opportunity for co-generation and the electricity is produced at the relatively low averageefficiency of the national grid.
The duty of the boiler is adjusted to produce exactly the amount of steam required by theprocess.
Main process data:BoilerSteam outlet conditions bara 68
°C 520Steam production t/t ETOH 4.0Duty GJ/t EtOH 11.19Thermal efficiency 95%NG consumption 11.78Steam to process bara 3.5
°C 160t/t ETOH 4.4
Imported electricity GJe/t EtOH 1.45Overall performanceTotal primary energy GJp/t EtOH 16.96(including NG and imported electricity production)Overall efficiency 66%

FWG-P-04-024_WTW wheat to EtOH.doc Page 32
Model b1Conventional natural gas-fired steam boiler+ Backpressure steam turbo-generator
Model b1 Ethanol plant energy generation scheme
Dwg: 3.03 t Ethanol: 1 t
Straw: 0 t DDGS: 1.14 t
NG: 14.4 GJ
Elec: 0 GJe Elec: 1.43 GJeBFW
NG
LP steam to process
Boiler
Backpressuresteam turbine
HP steam
~
This scheme takes advantage of the CHP opportunity and has a much higher overall efficiencythan model a.
Main process data:BoilerSteam outlet conditions bara 68
°C 520Steam production t/t ETOH 4.4Duty GJ/t EtOH 13.66Thermal efficiency 95%NG consumption 14.38Steam to process bara 3.5
°C 160t/t ETOH 4.4
Backpressure STGEfficiency MWe/t steam 0.18Electricity generation GJe/t EtOH 2.88Surplus electricity GJe/t EtOH 1.43Overall performanceTotal primary energy GJp/t EtOH 15.24(including NG and imported electricity production)Overall efficiency 83%

FWG-P-04-024_WTW wheat to EtOH.doc Page 33
Model b21Natural gas-fired gas turbine + unfired HRSG+ Backpressure Steam turbo-generator
Model b21 Ethanol plant energy generation scheme
Dwg: 3.03 t Ethanol: 1 t
Straw: 0 t DDGS: 1.14 t
NG: 27.2 GJ
Elec: 0 GJe Elec: 9.09 GJeBFW
NG
LP steamto process
HRSG
GTBackpressuresteam turbine
HP steam
~
The gas turbine produces a much larger electricity surplus but also consumes more natural gas(for a 100 kt/a ethanol plant the GT rated electrical output would be in the order of 27 MW).
Main process data:Gas turbine Steam to process bara 3.5Electricity production GJe/t EtOH 7.66 °C 160NG consumption GJ/t EtOH 27.21 t/t ETOH 4.4Efficiency 28% Backpressure STGHRSG Efficiency MWe/t steam 0.18Steam outlet conditions bara 68 Electricity generation GJe/t EtOH 10.54
°C 520 Surplus electricity GJe/t EtOH 9.09Steam production t/t ETOH 4.4 Overall performanceThermal duty GJ/t EtOH 13.66 Total primary energy GJp/t EtOH 28.85Co-firing NG consumption GJ/t EtOH 0.00 (including NG and imported electricity production)Gas turbine + HRSG Overall efficiency 70%Thermal efficiency 80%NG consumption 27.21
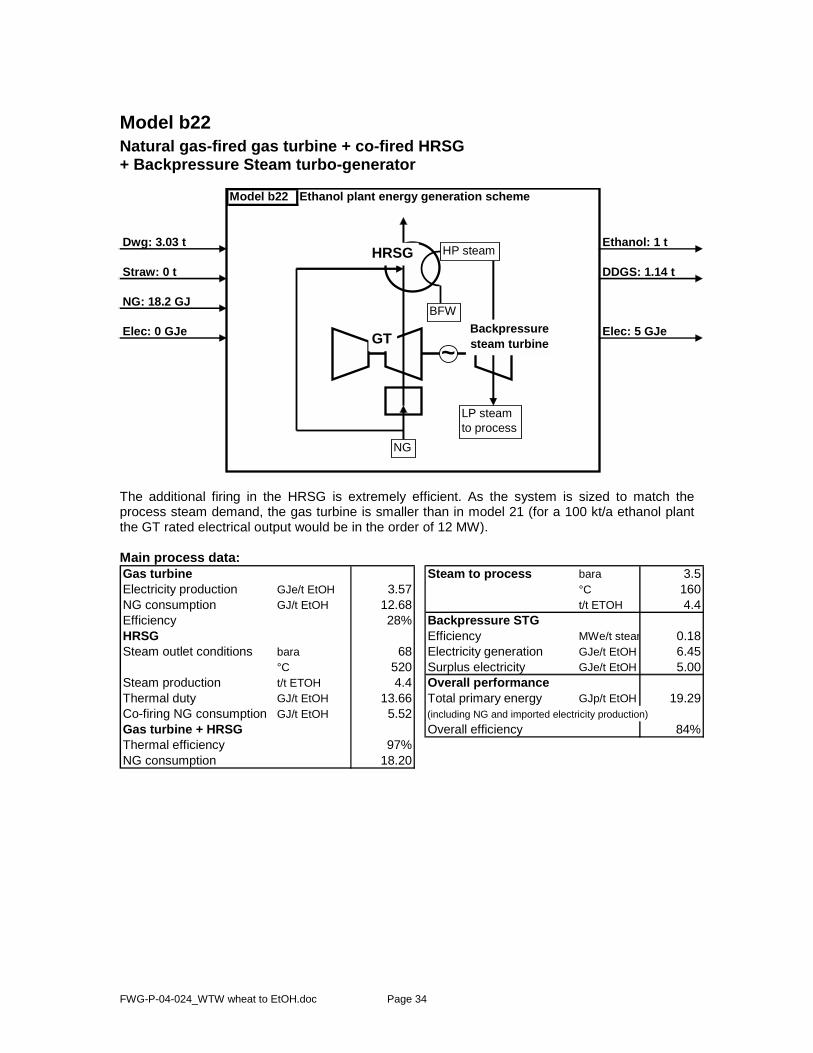
FWG-P-04-024_WTW wheat to EtOH.doc Page 34
Model b22Natural gas-fired gas turbine + co-fired HRSG+ Backpressure Steam turbo-generator
Model b22 Ethanol plant energy generation scheme
Dwg: 3.03 t Ethanol: 1 t
Straw: 0 t DDGS: 1.14 t
NG: 18.2 GJ
Elec: 0 GJe Elec: 5 GJeBFW
NG
LP steamto process
HRSG
GTBackpressuresteam turbine
HP steam
~
The additional firing in the HRSG is extremely efficient. As the system is sized to match theprocess steam demand, the gas turbine is smaller than in model 21 (for a 100 kt/a ethanol plantthe GT rated electrical output would be in the order of 12 MW).
Main process data:Gas turbine Steam to process bara 3.5Electricity production GJe/t EtOH 3.57 °C 160NG consumption GJ/t EtOH 12.68 t/t ETOH 4.4Efficiency 28% Backpressure STGHRSG Efficiency MWe/t steam 0.18Steam outlet conditions bara 68 Electricity generation GJe/t EtOH 6.45
°C 520 Surplus electricity GJe/t EtOH 5.00Steam production t/t ETOH 4.4 Overall performanceThermal duty GJ/t EtOH 13.66 Total primary energy GJp/t EtOH 19.29Co-firing NG consumption GJ/t EtOH 5.52 (including NG and imported electricity production)Gas turbine + HRSG Overall efficiency 84%Thermal efficiency 97%NG consumption 18.20

FWG-P-04-024_WTW wheat to EtOH.doc Page 35
Model c1Straw-fired steam boiler+ Backpressure steam turbo-generator
Model c1 Ethanol plant energy generation scheme
Dwg: 3.03 t Ethanol: 1 t
Straw: 1.42 t DDGS: 1.14 t
NG: 0 GJ
Elec: 0 GJe Elec: 2.07 GJeBFW
Straw
LP steamto process
Boiler
Backpressuresteam turbine
HP steam
~
The system is sized to process all the available straw (i.e. in production ratio with the grain used).This is because this would maximise electricity production. As a result the heat generation doesnot exactly match the requirement. There is a surplus of steam that is not used and assumed tobe vented.
Main process data:BoilerSteam outlet conditions bara 68
°C 520Steam production t/t ETOH 4.4Duty GJ/t EtOH 13.66Thermal efficiency 88%Straw consumption 1.42Steam to process bara 3.5
°C 160t/t ETOH 4.4
Excess steam t/t ETOH 1.0Backpressure STGEfficiency MWe/t steam 0.18Electricity generation GJe/t EtOH 3.52Surplus electricity GJe/t EtOH 2.07Overall performanceTotal primary energy GJp/t EtOH 20.79(including NG and imported electricity production)Overall efficiency 64%

FWG-P-04-024_WTW wheat to EtOH.doc Page 36
Model c2Straw-fired steam boiler+ Backpressure and condensing steam turbo-generator
Model c2 Ethanol plant energy generation scheme
Dwg: 3.03 t Ethanol: 1 t
Straw: 1.42 t DDGS: 1.14 t
NG: 0 GJ
Elec: 0 GJe Elec: 2.62 GJeBFW
Straw
Condensate
LP steamto process
Boiler
Condensingsteam turbinewith extraction
HP steam
~
This model represents an extra sophistication of model c1 whereby the excess steam is used forproducing additional electricity through a condensing turbine. Although this could be achievedusing two separate STG’s, they would in practice be combined,since this would be significantlycheaper. This model, of course, avoids wasting part of the available heat, but requires moreinvestment.
Main process data:

FWG-P-04-024_WTW wheat to EtOH.doc Page 37
BoilerSteam outlet conditions bara 68
°C 520Steam production t/t ETOH 4.4Duty GJ/t EtOH 13.66Thermal efficiency 88%Straw consumption 1.42Steam to process bara 3.5
°C 160t/t ETOH 4.4
Backpressure STGEfficiency MWe/t steam 0.18Electricity generation GJe/t EtOH 2.88Condensing STGEfficiency MWe/t steam 0.33Electricity generation GJe/t EtOH 1.19Surplus electricity GJe/t EtOH 2.62Overall performanceTotal primary energy GJp/t EtOH 20.79(including NG and imported electricity production)Overall efficiency 61%

FWG-P-04-024_WTW wheat to EtOH.doc Page 38
APPENDIX 2N2O Emissions from AgricultureMost of the GHG emissions associated with biofuels production come from farming. The farmingemissions are dominated by two sources: nitrogen fertilizer production and emissions of nitrousoxide from the field. Until now, LCA or WTT studies of biofuels have been forced to estimate N2Oemissions either from measurements on individual fields, or from calculations based on IPCCguidelines.
There are enormous variations in N2O emissions from one field to another, depending on soiltype, climate, crop, and fertilizer and manure rates. The revised 1996 IPCC guidelines[IPCC2/1996] only give the possibility to consider nitrogen fertilizer and manure use, and whetheror not the crop is nitrogen-fixing. To account for other variables, IPCC specifies a wide errorrange: the max/min ratio varies from 9 (for direct emissions) to 60 (for leaching effects). But eventhis range is by far not sufficient to cover the range of values measured on individual fields. Forexample, a field with wet, peaty, soil may show measured emissions ten times the maximumvalue from IPCC guidelines.
The soils and waste unit of the Institute of Environment and Sustainability of DG-Joint ResearchCentre (Ispra) has developed a database-model which we have christened GReenhouseEmissions from Agricultural Soils in Europe (GREASE), which can be used to make a moreaccurate estimate of greenhouse gas emissions from energy crops, arising from all knownsources (direct and indirect). At the heart of GREASE is the DNDC soils model. This is a publiclyavailable program created by the EOS Institute at University of New Hampshire. It simulatescarbon and nitrogen soils chemistry in agricultural land. It is universally recognized as the mostrefined simulation available, and has been extensively validated with field measurements.
GREASE estimates the average emissions per crop for UK by totalling emissions per cropcalculated separately for 127 UK regions. To calculate the N2O emissions from one region on oneday, GREASE provides DNDC with 26 items of input data. Calculations are run per day per cropper region for two years. Daily weather data and farming calendar from the JRC-MARS websiteare combined with soils parameters per region from European Soils Bureau at JRC. EUROSTATprovide crop areas, yields and manure use per region. Average fertilizer use per crop in UK wastaken from national averages published by International Fertilizer Association (the averagefertiliser rate for UK wheat is 192 kg N per ha).
GREASE ran DNDC for each NUTS3 region of UK (UK contains about 127 NUTS 3 regions,defined by GISCO, part of EUROSTAT). DNDC calculates N2O emissions each day for a year(1999), using real local weather data provided by the MARS database, (Monitoring Agriculturewith Remote Sensing). To establish the starting soil condition, the model is run for a year beforethe real calculation starts. MARS also provides the calendar of planting and fertilizer application.The nitrogen content of precipitation is interpolated from meteorological station measurementstabulated by EMEP (http://www.emep.int/).
The parameters describing soil type for each NUT are derived from the European Soil Databasemaintained by the European Soils Bureau at JRC Ispra. This also provides data on %irrigation.The dominant soil of each NUTS3 is characterized by clay fraction, pH, bulk density and soilorganic content. The latter has a min. and max. value to account for variations inside the NUT.This range gives minimum and maximum emissions for each NUTS3, but in the UK average thestochastic variation is from this source is negligible. New Cronos database of EUROSTATprovides the land cover data; the area of each crop in each NUTS3 region. Because there is a

FWG-P-04-024_WTW wheat to EtOH.doc Page 39
lack of data on crop rotations, at the moment the model assumes repeated crop years.Furthermore, provisionally, GREASE sets the inputs on plant physiology (which depend on thevariety and farming practices) to the DNDC default values. Both give rise to systematic errors,which contribute to the error range of our UK averages.
Uncertainty arises from the coarseness of the available data on N-fertilizer and manure rates.New Chronos provides fertilizer rate data only on a coarse scale (averaged for each of 95 regionsin EU instead of the 1700 NUTs in GREASE), and there is no differentiation by crop or soil type.The JRC soils unit used fertilizer-per-crop-per country from the International FertilizerAssociation. There are significant discrepancies in the total fertilizers per country reported byIFA/FAO, New Chronos and IPCC.
However, the main problem is the lack of fertilizer rate differentiation by soils type. High-organicsoils give high N2O emissions in general, but require little or no nitrogen fertilizer. If they areassumed to receive the same fertilizer and manure rate as surrounding regions with other soils,N2O emissions from that NUT are enormously exaggerated: in extreme cases most of thenitrogen applied is predicted to be released as N2O. The figures from these high-organic soilregions significantly affect the EU average.
CAPPINGThe only previous WTW study we know to have discussed the problem of high-organic soils is[GM 2002, ref 7 in main report]. They simply assume that energy crops are not grown on suchsoil. We think one should consider it, or we are effectively banning energy crops in many parts ofUK. In order to avoid the effect of exaggerated N2O emissions from these regions, we cap thecalculated annual N2O emissions. We made the capping level (for each NUT and crop)proportional to the nitrogen fertilizer rate for as given crop.
We made an upper and lower limit of the proportionality constant, according to the followingassumptions:
− Lower limit: corresponding to the “max emission factor” for direct N2O emissions in therevised IPCC guidelines. We can be 95% confident that this assumption underestimatesthe UK emissions average, because IPCC do not consider high-organic soils: their upperlimit is lower than any field measurements on high-organic soils. It is almost like saying“let’s pretend high-organic soils are like normal ones”.
− Upper limit: We found three sources that report N2O emissions from intensive arablecultivation of various crops on high-organic fields in different parts of Finland andGermany. Using our fertilizer data for those crops in those regions, we found theproportionality factors which gave caps at the measured values. Then we averaged thethree constants (they differed by less than 25%).
We can be 95% confident that this method overestimates the UK emissions average: it works wellwith NUTs with very highly organic soils, but does nothing in many marginal cases, where theemissions are already exaggerated but not high enough to reach the cap. In the future GREASEwill be refined so that fertilizer rate is also adjusted for soil type: then capping should no longer benecessary.
The best-estimate N2O emissions from UK wheat (not corrected for reference crop) is 4.36 kg/haN2O. Our average N2O emissions data are likely to be somewhat higher than those of otherstudies, because:
- We take into account manure use as well as N fertilizer, ([GM 2002], for example, doesnot)
- We consider both direct and indirect N2O emissions- Mostly, because we do not exclude the use of high-organic soil for growing energy crops.
OVERALL ERROR MARGINApart from the uncertainty related to capping, GREASE does not at present consider rotations orthe details of crop varieties and farming practice outside those specifically mentioned above.

FWG-P-04-024_WTW wheat to EtOH.doc Page 40
Using default values set in the USA could give significant systematic errors in the UK averageemissions. By experimenting with changing the default values we judge that an error of +/- 25% ispossible for a particular crop. If we compound the errors from this source with the errors fromcapping, we find overall 80% confidence limits of +/-30%.
Despite the difficulties, GREASE has a smaller error margin because it is a sophisticated modelaveraging 170 regions of UK, whereas most studies use the approximate IPCC guidelines oreven extrapolate from measurements on single fields.
Strictly, a correction should be applied for emissions from set-aside land. Results are availablefrom a detailed study of The Wash region, which gives emissions from setaside as 24% of thosefor wheat, but this is averaged for whatever the farmers were doing with their set-aside (theconditions in The Wash give higher than average N2O emissions). A UK study, [Brown 2002]confirms modelling at JRC, that the N2O release during fallow setaside amounts to about 30% ofthe release from wheat farming. However, their N2O release figures for wheat in UK amount toabout 2.9 kgN2O/ha/y when direct and indirect emissions are considered, compared with 4.36from the rather similar JRC model. For fallow land the equivalent figure is about 0.95kg/ha/y
There is also a "background" emission determined by the history of the land use, but not by thecurrent use. This cancels between wheat-growing and set-aside. Note that both studies givehigher emissions from fertilizer than IPCC default values (although the UK study has loweremissions from other sectors). An earlier UK study [Salway et.al. 1999] also estimated higheremissions than [Brown 2002].Investigation of why the JRC N2O model gives different results than [Brown 2002] proved difficult,because the main author of the IGER-UK study is no longer available. Both studies give a normaldistribution of log(N2O/ha) with about the same median value, but the JRC data has longer tails toboth high and low values. For example, at the high end, IGER-UK has no results above 11.6kgN2O/ha. The high-end tail in the JRC results has a much larger effect in the linear average ofN2O emissions than does the low-end tail.
All these values are higher than in the German studies. Germany has less organic soil, fertilizeruse on wheat is lower, and the climate is drier: all of these give less N2O. Furthermore theKaltscmitt nitrogen inputs do not, we believe, include manure and rotting crop residues from theprevious year (both IGER-UK and JRC include these)
In view of the uncertainties, no correction has been applied for either fallow land N2O emissions,or for yield reduction from the loss of break crop. For reference, a 30% reduction in N2Oemissions, coupled with a 12% yield reduction would exactly cancel out.
REFERENCES[Regina 1996] Regina, K, H. Nykänen, J. Silvola, and P. Martikainen. 1996. Fluxes of nitrous
oxide from boreal peatlands as affected by peatland type, water table level andnitrification capacity. Biogeochem. 35:401-418. .
[Regina 1996] Regina, K., J. Silvola, and P. Martikainen. 1998. Mechanisms of N2O and NOproduction in the soil profile of a drained and forested peatland, as studied withacetylene, nitrapyrine, and dimethyl ether. Biol. Fertil. Soils 27:205-210.
[Dörsch 1998] Dörsch, P., J. Linder, A. Zaglauer, and H. Flessa. 1998. Nitrous oxide, methaneand carbon dioxide fluxes in a minerotrophic mire under long-term cultivation.Final report of the EC project: Greenhouse gas monitroing from farmed organicsoils. [Brown 2002] A UK study [Development and application of amechanistic model to estimate emission of nitrous oxide from UK agriculture:IGER-UK; L. Brown et. al. Atmospheric Environment 36 (2002) 917-928]