welsh index of multiple deprivation child index 2011 · the welsh index of multiple deprivation –...
TRANSCRIPT
Welsh Index of Multiple DeprivationChild Index 2011
Summary Report

Contact points
WalesFor statistical enquiries contact the Statistical Directorate:Tel: 029 2082 5050E-mail: [email protected]: 029 2082 3280Fax: 029 2082 5350Address: Statistical Publication Unit,
Statistical Directorate, Welsh Government, Cathays Park,CARDIFF, CF10 3NQ
You can also find Statistics for Wales on the internet: www.wales.gov.uk/statistics
www.twitter.com/statisticswales
United KingdomFor statistical enquiries, contact the Office for National Statistics: Tel: 0845 601 3034Enquiries in Welsh: 01633 813381Minicom: 01633 812399E-mail: [email protected] Fax: 01633 652747Address: Customer Contact Centre,
Room 1.015, Office for National Statistics,Cardiff Road,Newport, NP10 8XG
You can also find National Statistics on the internet:www.statistics.gov.uk
A National Statistics publication Official statistics bearing the National Statistics logo are produced to high professional standards set out in the National Statistics Code of Practice. They undergo regular quality assurance reviews to ensure that they meet customer needs. They are produced free from any political interference.
© Crown copyright 2011First published 2011
ISBN 978 0 7504 6350 8
Welsh Government
WG-13265
Brief extracts from this publication, with the exception of maps, may be reproduced providing the source is fully acknowledged. Proposals for reproductions of maps and larger extracts should be addressed to
The Copyright Unit, Her Majesty’s Stationery Office, St Clements House, 2-16 Colegate, Norwich, NR3 1BQ
The maps are based upon the Ordnance Survey map by the National Assembly for Wales with the permission of Ordnance Survey on behalf of The Controller of Her Majesty's Stationery Office, © Crown copyright. All rights reserved. Unauthorised reproduction infringes Crown copyright and may lead to prosecution or civil proceedings. Licence Number GD272221.
For enquiries about this publication, contactTel: 029 2082 5061E-mail: [email protected]
To order additional copies of thispublication, call Statistical Publication Unit on 029 2082 5054.
Welsh Index of Multiple Deprivation: Child Index 2011
Summary Report
Welsh Index of Multiple DeprivationChild Index
W I M D
2 0 1 1
2
lcontentsl
pageThe Welsh Index of Multiple Deprivation: Child Index 3How the Child Index is constructed 4How to use the Child Index 6
1. Read the first two sections 62. Using the deprivation scores 63. Identifying areas of need 64. Understanding local areas using the domain ranks 85. Aggregating to larger geographies 96. Monitoring change over time 97. Adding contextual information 10
How to download the Index from StatsWales 10
Introduction
Further guidance and information 12WIMD: Child Index 2011 13Income 19Education 25Health 31Community safety 37Geographical access to services 43Housing 47
WIMD: ChildIndex 2011methodology,results andanalysis,local authorityanalysis,maps Physical Environment 51
Annex A: the indicators 57Annex B: a summary of methodological changes in the ChildIndex 2011
61
Annex C: uses and users 62Annex D: local authority analysis 64
Annexes
Annex E: glossary 65
3
lintroductionl
The Welsh Index of Multiple Deprivation – Child Index
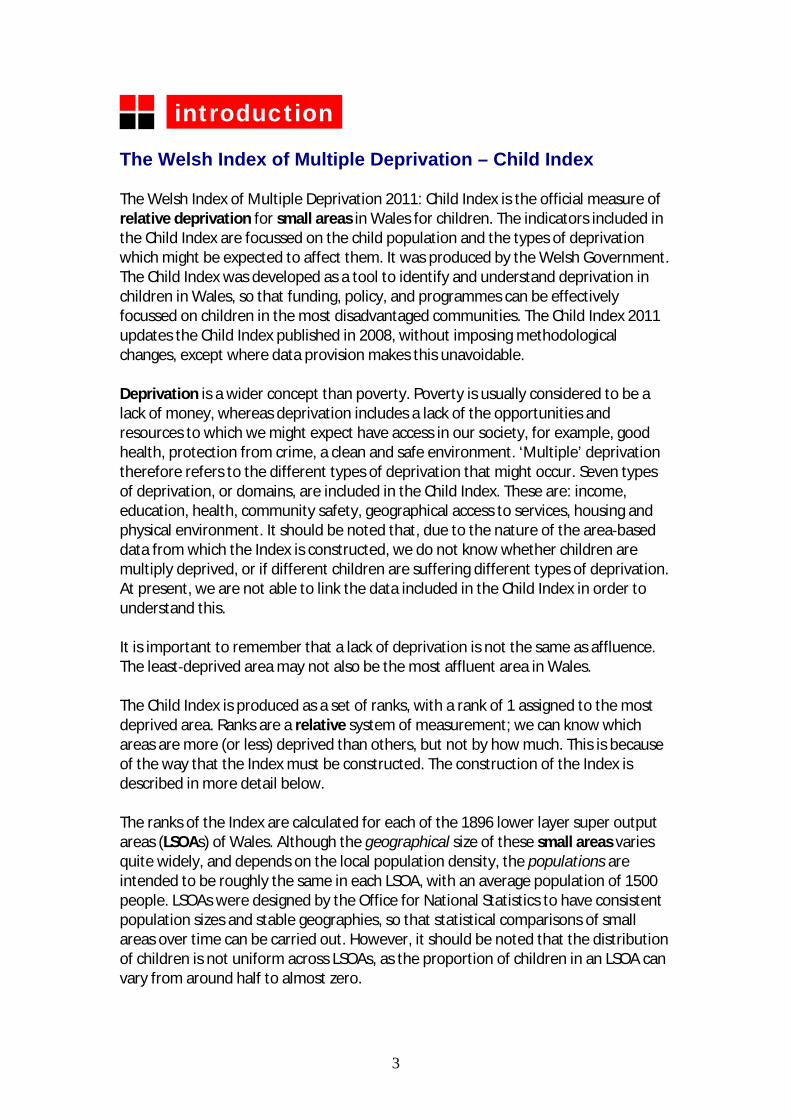
The Welsh Index of Multiple Deprivation 2011: Child Index is the official measure ofrelative deprivation for small areas in Wales for children. The indicators included inthe Child Index are focussed on the child population and the types of deprivationwhich might be expected to affect them. It was produced by the Welsh Government.The Child Index was developed as a tool to identify and understand deprivation inchildren in Wales, so that funding, policy, and programmes can be effectivelyfocussed on children in the most disadvantaged communities. The Child Index 2011updates the Child Index published in 2008, without imposing methodologicalchanges, except where data provision makes this unavoidable.
Deprivation is a wider concept than poverty. Poverty is usually considered to be alack of money, whereas deprivation includes a lack of the opportunities andresources to which we might expect have access in our society, for example, goodhealth, protection from crime, a clean and safe environment. ‘Multiple’ deprivationtherefore refers to the different types of deprivation that might occur. Seven typesof deprivation, or domains, are included in the Child Index. These are: income,education, health, community safety, geographical access to services, housing andphysical environment. It should be noted that, due to the nature of the area baseddata from which the Index is constructed, we do not know whether children aremultiply deprived, or if different children are suffering different types of deprivation.At present, we are not able to link the data included in the Child Index in order tounderstand this.
It is important to remember that a lack of deprivation is not the same as affluence.The least deprived area may not also be the most affluent area in Wales.
The Child Index is produced as a set of ranks, with a rank of 1 assigned to the mostdeprived area. Ranks are a relative system of measurement; we can know whichareas are more (or less) deprived than others, but not by how much. This is becauseof the way that the Index must be constructed. The construction of the Index isdescribed in more detail below.
The ranks of the Index are calculated for each of the 1896 lower layer super outputareas (LSOAs) of Wales. Although the geographical size of these small areas variesquite widely, and depends on the local population density, the populations areintended to be roughly the same in each LSOA, with an average population of 1500people. LSOAs were designed by the Office for National Statistics to have consistentpopulation sizes and stable geographies, so that statistical comparisons of smallareas over time can be carried out. However, it should be noted that the distributionof children is not uniform across LSOAs, as the proportion of children in an LSOA canvary from around half to almost zero.
4
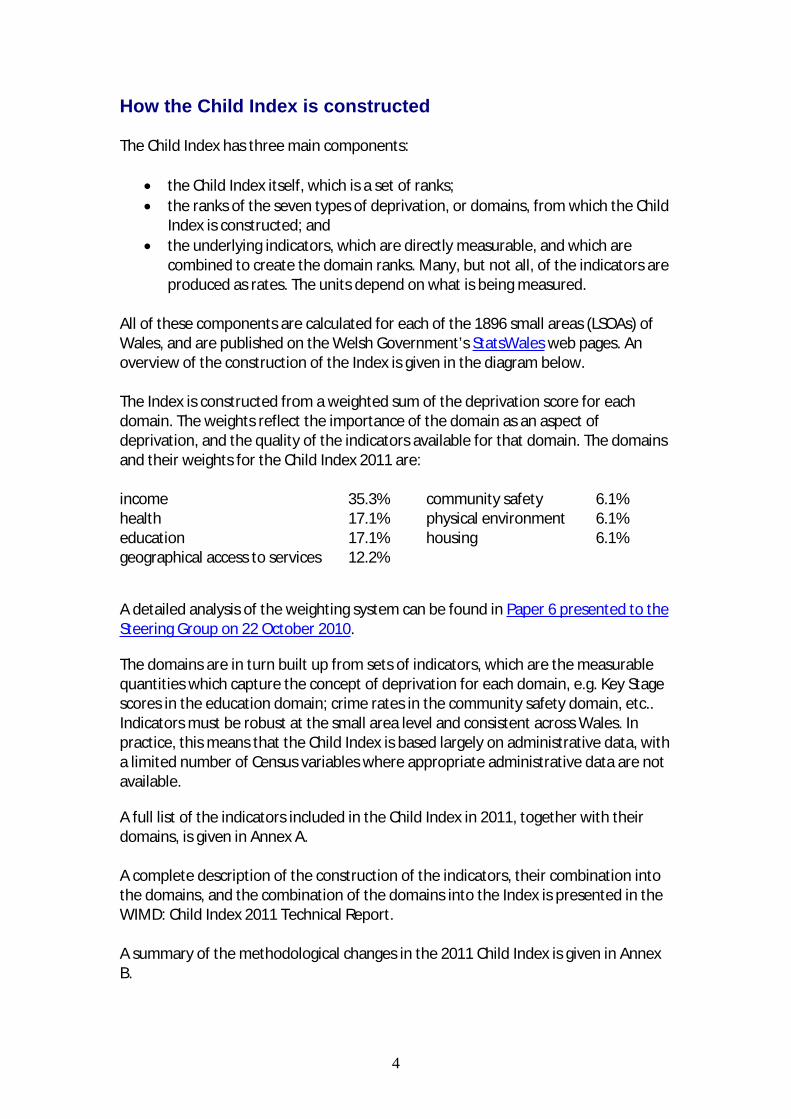
How the Child Index is constructed
The Child Index has three main components:
the Child Index itself, which is a set of ranks;the ranks of the seven types of deprivation, or domains, from which the ChildIndex is constructed; andthe underlying indicators, which are directly measurable, and which arecombined to create the domain ranks. Many, but not all, of the indicators areproduced as rates. The units depend on what is being measured.
All of these components are calculated for each of the 1896 small areas (LSOAs) ofWales, and are published on the Welsh Government’s StatsWales web pages. Anoverview of the construction of the Index is given in the diagram below.
The Index is constructed from a weighted sum of the deprivation score for eachdomain. The weights reflect the importance of the domain as an aspect ofdeprivation, and the quality of the indicators available for that domain. The domainsand their weights for the Child Index 2011 are:
income 35.3% community safety 6.1%health 17.1% physical environment 6.1%education 17.1% housing 6.1%geographical access to services 12.2%
A detailed analysis of the weighting system can be found in Paper 6 presented to theSteering Group on 22 October 2010.
The domains are in turn built up from sets of indicators, which are the measurablequantities which capture the concept of deprivation for each domain, e.g. Key Stagescores in the education domain; crime rates in the community safety domain, etc..Indicators must be robust at the small area level and consistent across Wales. Inpractice, this means that the Child Index is based largely on administrative data, witha limited number of Census variables where appropriate administrative data are notavailable.
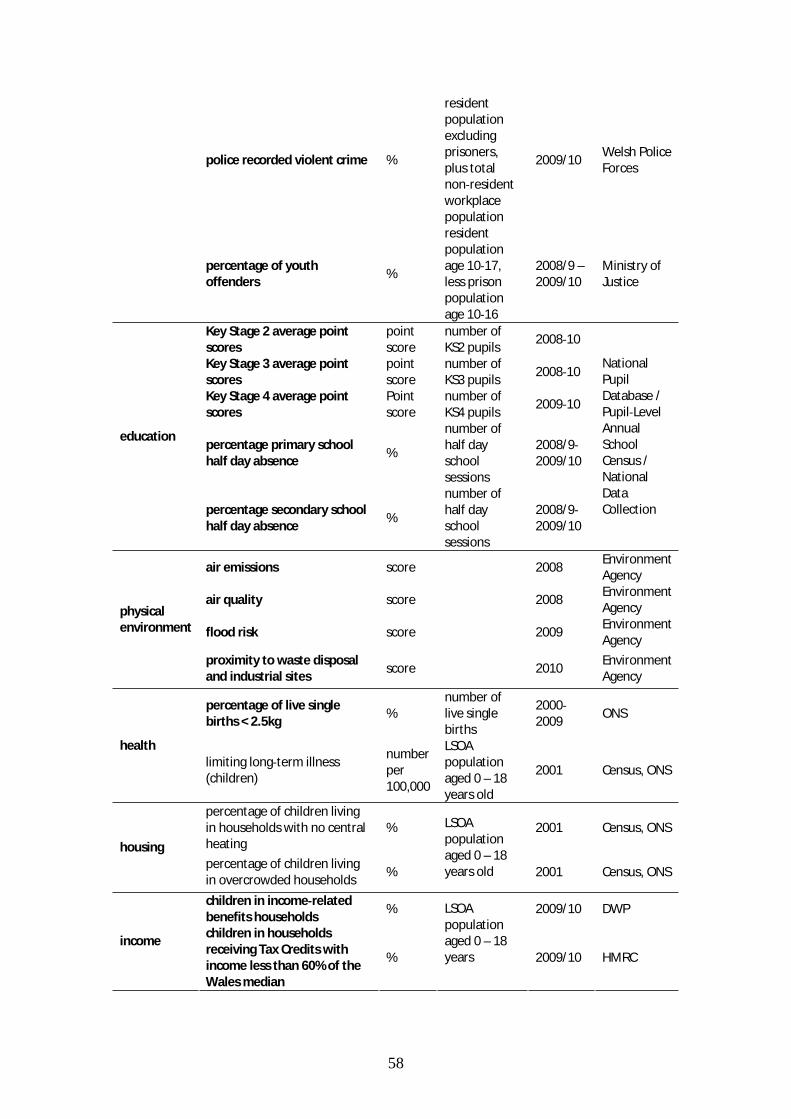
A full list of the indicators included in the Child Index in 2011, together with theirdomains, is given in Annex A.
A complete description of the construction of the indicators, their combination intothe domains, and the combination of the domains into the Index is presented in theWIMD: Child Index 2011 Technical Report.
A summary of the methodological changes in the 2011 Child Index is given in AnnexB.
5
An overview of the construction of the Child Index and its domains. For a full description of theindicators see Annex A, and for the methodology, please see the Child Index 2011 Technical Report.
Child Index rank for each small area (LSOA)
The domain ranks are exponentially transformed, and added together, weighted by the weights given below, to produce the Child Index score
The indicators are prepared from the raw data.
12.2 6.1 6.1 6.135.3 17.1
housing physical environment
community safety
The Child Index scores are ranked
over-crowding,
central heating
air quality, air emissions, flood risk,
proximity to waste and
industrial sites
adult offenders, youth offenders, police recorded crime rates for violent crime,
criminal damage,
burglary and theft
17.1
Each indicator is transformed to a normal distribution, and the normal scores are weighted and added to give the domain score. Weights are generated by factor analysis where there are more than three indicators. Where there are three or fewer
indicators, factor analysis is not possible, and equal weights have been assigned. Note that the physical environment domain has three indicators, as the air quality and air emissions indicators form a single sub-domain.
The domain scores are ranked to give the domain rank for each small area (LSOA)
income health educationgeographical
access to services
percentage of child
population in income-related
benefits households
limiting long-term illness,
low birth weight rate
Key Stage 2, 3 and 4 point
score averages, secondary and primary school absence rates,
journey time to: library, leisure centre, primary
school, secondary
school
6
How to use the Index
This section describes how to use the Index, its domains and indicators to carry outsome typical analyses.
1. Read the first two sections in this Summary Report
The first two sections of this report (The Welsh Index of Multiple Deprivation: ChildIndex, and How the Child Index is constructed) give an overview of the Child Index,and how it is constructed. It is also recommended that users look at the list ofindicators and domains given in Annex A, to understand what data are used tocreate the Index, and are available for downloading.
2. Using the deprivation scores
The Child Index and domain scores are provided in an annex to the WIMD: ChildIndex 2011 Technical Report, and are published for only two purposes, i) fortransparency, so that users have access to all the stages of the construction of theChild Index, and ii) so that users can experiment with different weighting systems forthe Index if they so wish. The scores should generally be seen as a stage in theconstruction of the Index rather than a product in themselves. For all purposes otherthan the two outlined above, the ranks should be used.
Because of the way in which the Child Index must be constructed, the scores do notrepresent a level of multiple deprivation. If, for example, area A has twice the scoreof area B, it does not necessarily mean that area A is twice as deprived as area B.This means that the scores do not in fact contain any more information on levels ofmultiple deprivation than the ranks do. The constraints on constructing an indexmean that we can only produce a relative measure of deprivation. For levels ofdeprivation, the underlying indicator data must be used.
3. Identifying areas of need
Understanding how disadvantaged children are distributed through Wales bycarrying out the following kind of analysis is important when developing area basedpolicies, programmes and funding.
The simplest use of the Child Index is to identify the areas of greatest deprivationusing the Child Index ranks. For example, the most deprived 10% of areas in Walesare those ranked 1 – 190 (inclusive). However, it should be understood that not alldeprived children live in the most deprived areas. More than one in four of thechildren living in income benefits households live in the most deprived 10% of areasin Wales. This means that, although it is true to say that deprivation is much moreconcentrated in some areas than others, three out of four children in incomebenefits households live outside these areas, and this should be borne in mind whendeveloping policy.
7
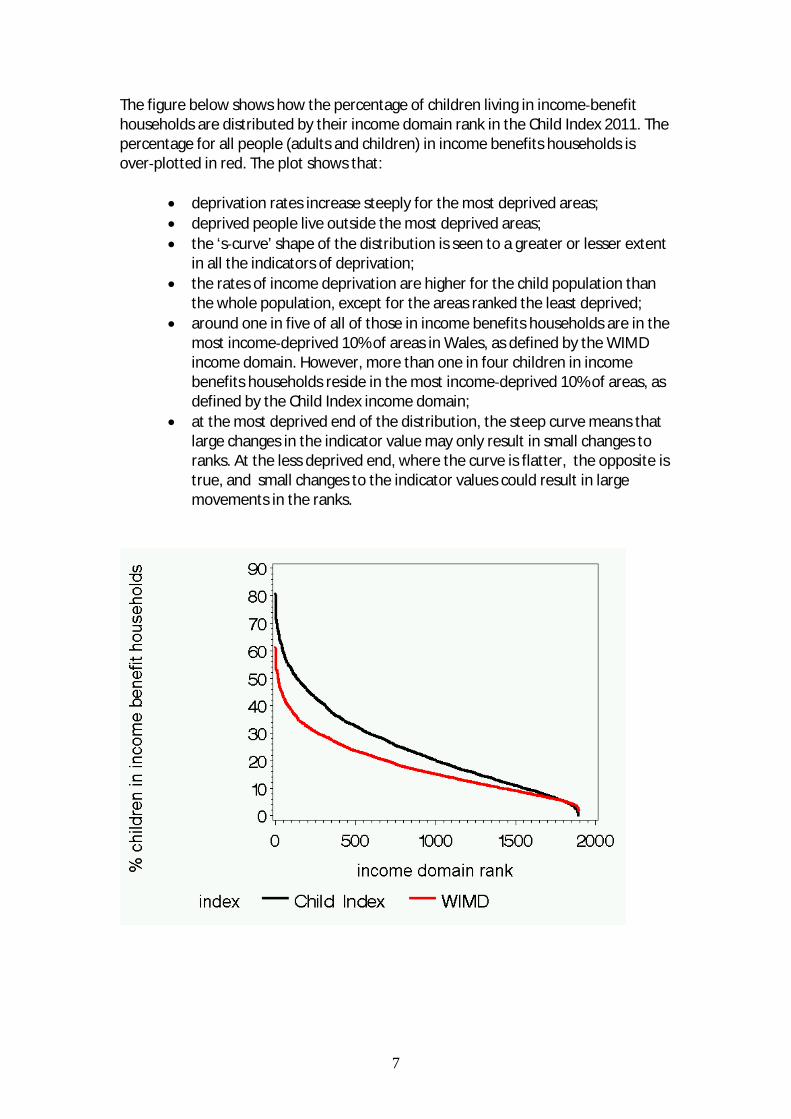
The figure below shows how the percentage of children living in income benefithouseholds are distributed by their income domain rank in the Child Index 2011. Thepercentage for all people (adults and children) in income benefits households isover plotted in red. The plot shows that:
deprivation rates increase steeply for the most deprived areas;deprived people live outside the most deprived areas;the ‘s curve’ shape of the distribution is seen to a greater or lesser extentin all the indicators of deprivation;the rates of income deprivation are higher for the child population thanthe whole population, except for the areas ranked the least deprived;around one in five of all of those in income benefits households are in themost income deprived 10% of areas in Wales, as defined by the WIMDincome domain. However, more than one in four children in incomebenefits households reside in the most income deprived 10% of areas, asdefined by the Child Index income domain;at the most deprived end of the distribution, the steep curve means thatlarge changes in the indicator value may only result in small changes toranks. At the less deprived end, where the curve is flatter, the opposite istrue, and small changes to the indicator values could result in largemovements in the ranks.
8
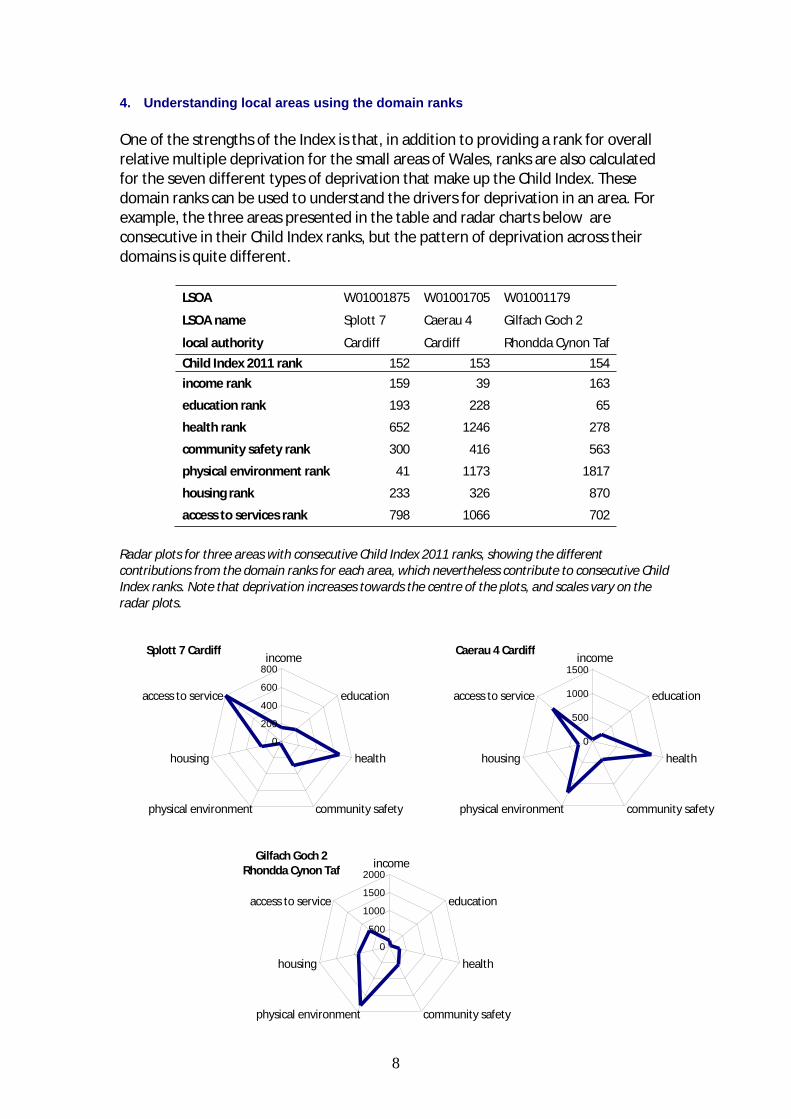
4. Understanding local areas using the domain ranks
One of the strengths of the Index is that, in addition to providing a rank for overallrelative multiple deprivation for the small areas of Wales, ranks are also calculatedfor the seven different types of deprivation that make up the Child Index. Thesedomain ranks can be used to understand the drivers for deprivation in an area. Forexample, the three areas presented in the table and radar charts below areconsecutive in their Child Index ranks, but the pattern of deprivation across theirdomains is quite different.
LSOA W01001875 W01001705 W01001179
LSOA name Splott 7 Caerau 4 Gilfach Goch 2
local authority Cardiff Cardiff Rhondda Cynon Taf
Child Index 2011 rank 152 153 154
income rank 159 39 163
education rank 193 228 65
health rank 652 1246 278
community safety rank 300 416 563
physical environment rank 41 1173 1817
housing rank 233 326 870
access to services rank 798 1066 702
Radar plots for three areas with consecutive Child Index 2011 ranks, showing the differentcontributions from the domain ranks for each area, which nevertheless contribute to consecutive ChildIndex ranks. Note that deprivation increases towards the centre of the plots, and scales vary on theradar plots.
Splott 7 Cardiff
0
200
400
600
800income
education
health
community safetyphysical environment
housing
access to service
Gilfach Goch 2Rhondda Cynon Taf
0
500
1000
1500
2000income
education
health
community safetyphysical environment
housing
access to service
Caerau 4 Cardiff
0
500
1000
1500income
education
health
community safetyphysical environment
housing
access to service
9
5. Aggregating to larger geographies
It is not possible to aggregate the ranks of either the Child Index or the domains tolarger geographies or non geographic groups by taking an average of the ranks (orscores) of the small areas which make up the larger area. This is because of the wayin which the Index is constructed. We can know if one area is more or less deprived,but not by how much, so taking an average does not make sense. However, if largergeographies (or non geographic groups) are to be compared, there are two methodsfor doing this.
The first method is to calculate the percentage of the small areas in the largergeography which are in the most deprived 10 (ranks 1 190) or 20 (ranks 1 380) percent of areas in Wales. This has been done for the local authorities, and the resultsare presented in the Child Index and domain chapters of this report, with a summaryin Appendix D. The data are also available from the StatsWales web pages (LocalAuthority Analysis).
In general, the method for calculating the percentage for larger geographies is:
count the number of LSOAs in the area of interest – n_LSOA;count the number of LSOAs ranked 1 190 (for the most deprived 10%) in thearea of interest – n_10%calculate the percentage of LSOAs in the most deprived 10% p_10%:
p_10% = 100 x (n_10% / n_LSOA)
If an area has more than 10% (20%) of its small areas in the most deprived 10%(20%) it can be considered relatively deprived. If it has fewer than 10% (20%), then itcan be considered relatively undeprived.
The second method is to use the individual indicators, which can be aggregated.Since March 2011, the indicators have been published not just at the small arealevel, but also for a range of other useful groups, including local authorities andCommunity First areas. These can simply be downloaded from the WIMD: indicatoranalysis folder on StatsWales . A full list of the available aggregations can be found inAnnex A.
6. Monitoring change over time
A ranking system cannot be used to monitor change over time. This is because it isnot known whether a change in rank for an area is due to changes in that area itself,or to other areas moving up or down the ranks, changing its position without actualchange in the area.
However, the indicator data offer a solution. The WIMD: indicator analysis will beupdated annually, or as frequently as data are available. As the indicators representabsolute levels of the various measures of deprivation, they can be used to monitorchange over time. The natural variability of small area statistics has been mitigated
10
by the use of mean values over several years where appropriate, but care should stillbe taken with the interpretation of small number statistics. Annual updates to theindicator analysis will be carried out for all the available aggregations which werefirst published in March 2011, starting with eth WIMD 2011 indicators in theautumn, 2011.
7. Adding contextual information
The Child Index is most useful if it is used in conjunction with other information,either from the Child Index indicators, other published data, or local information.Contextual information could include: the location of existing programmes orservices; the number of people affected by a particular aspect of deprivation, forexample, the number in receipt of benefits, or the number affected by a particularhealth issue; the Defra rural urban class; broadband access, and so on. Exploring theindicators and using additional information ensures that a complete understandingof the challenges in individual areas are adequately understood.
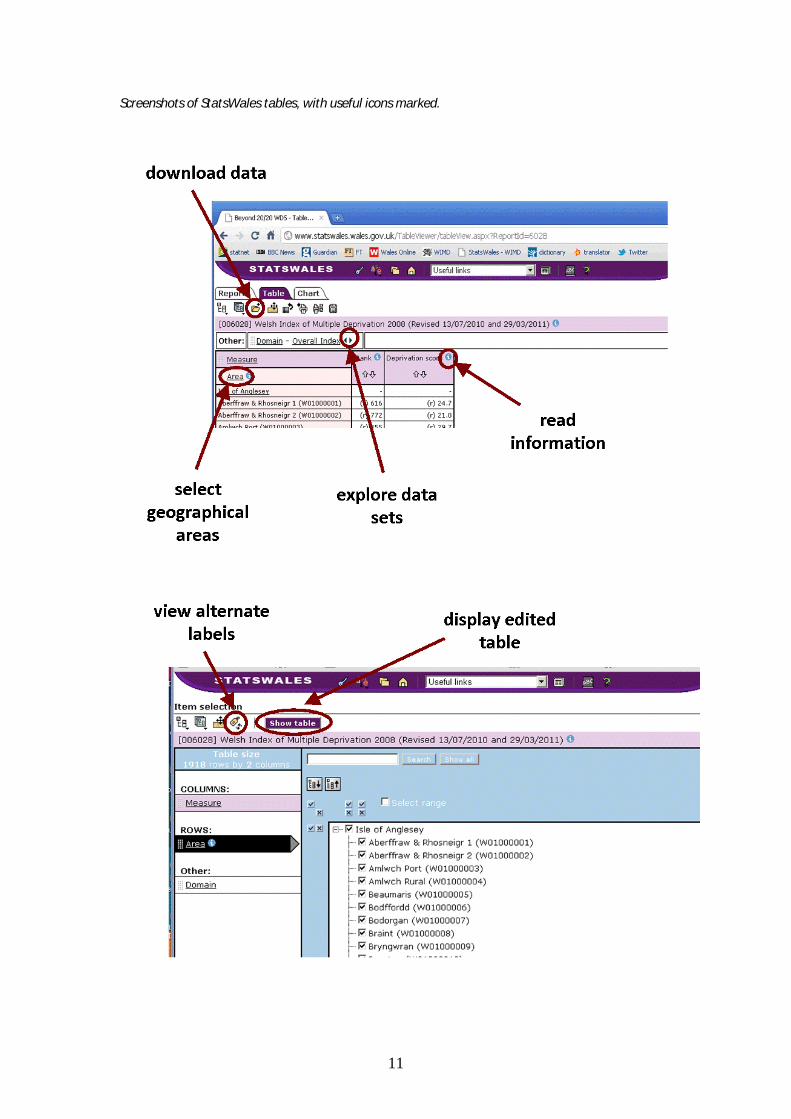
How to download the Child Index, its domains and indicators
This section presents a step by step introduction to downloading Child Index datafrom the Welsh Government’s StatsWales web site.
go to the StatsWales web pages;Child Index data can be found under Social Inclusion > Welsh Index ofMultiple Deprivation;select required data set, e.g. WIMD: Child Index 2011 for the 2011publication of the Index, WIMD: indicator analysis, for indicator data. SeeAnnex A for a list of available data;click on the data set of interest, and view the table of data;to explore the table:
o click on ‘Area’ to select areas of interest, and then ‘Show table’ toreturn to the edited table;
o use the arrows at the top of the table, next to ‘other’, to viewdifferent data sets;
o click on the ‘i’ icons for more information;o to download data, click on the open folder symbol, at the top left of
the page, and download as an Excel or csv spreadsheet;o to change the LSOA labels, from names (e.g. Braint) to codes (e.g.
W01000008 or 008A) , click on ‘Area’, and then the label icon, fourthfrom the left, top left of the table. ‘View alternate labels’ will appearas you hover over the correct icon. Then click on ‘Show table’.
The figure below shows the location of the icons listed above.
11
Screenshots of StatsWales tables, with useful icons marked.
12
Further guidance and information
The Welsh Index of Multiple Deprivation web pages host further information on theIndex, including:
WIMD: Child Index 2011 Technical ReportWIMD: Child Index 2011 Quality ReportA summary of methodological changes in the WIMD: Child Index 2011Papers and minutes from the Index governance groups
13
LThe Child Indexl
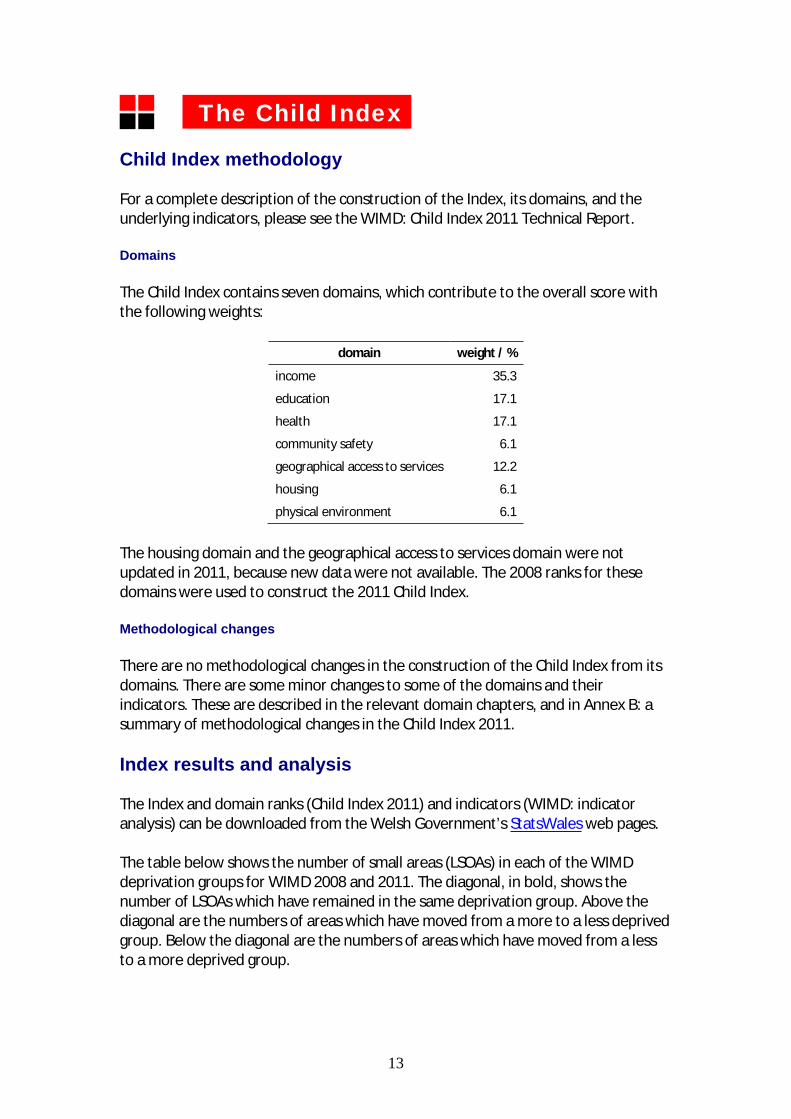
Child Index methodology
For a complete description of the construction of the Index, its domains, and theunderlying indicators, please see the WIMD: Child Index 2011 Technical Report.
Domains
The Child Index contains seven domains, which contribute to the overall score withthe following weights:
domain weight / %
income 35.3
education 17.1
health 17.1
community safety 6.1
geographical access to services 12.2
housing 6.1
physical environment 6.1
The housing domain and the geographical access to services domain were notupdated in 2011, because new data were not available. The 2008 ranks for thesedomains were used to construct the 2011 Child Index.
Methodological changes
There are no methodological changes in the construction of the Child Index from itsdomains. There are some minor changes to some of the domains and theirindicators. These are described in the relevant domain chapters, and in Annex B: asummary of methodological changes in the Child Index 2011.
Index results and analysis
The Index and domain ranks (Child Index 2011) and indicators (WIMD: indicatoranalysis) can be downloaded from the Welsh Government’s StatsWales web pages.
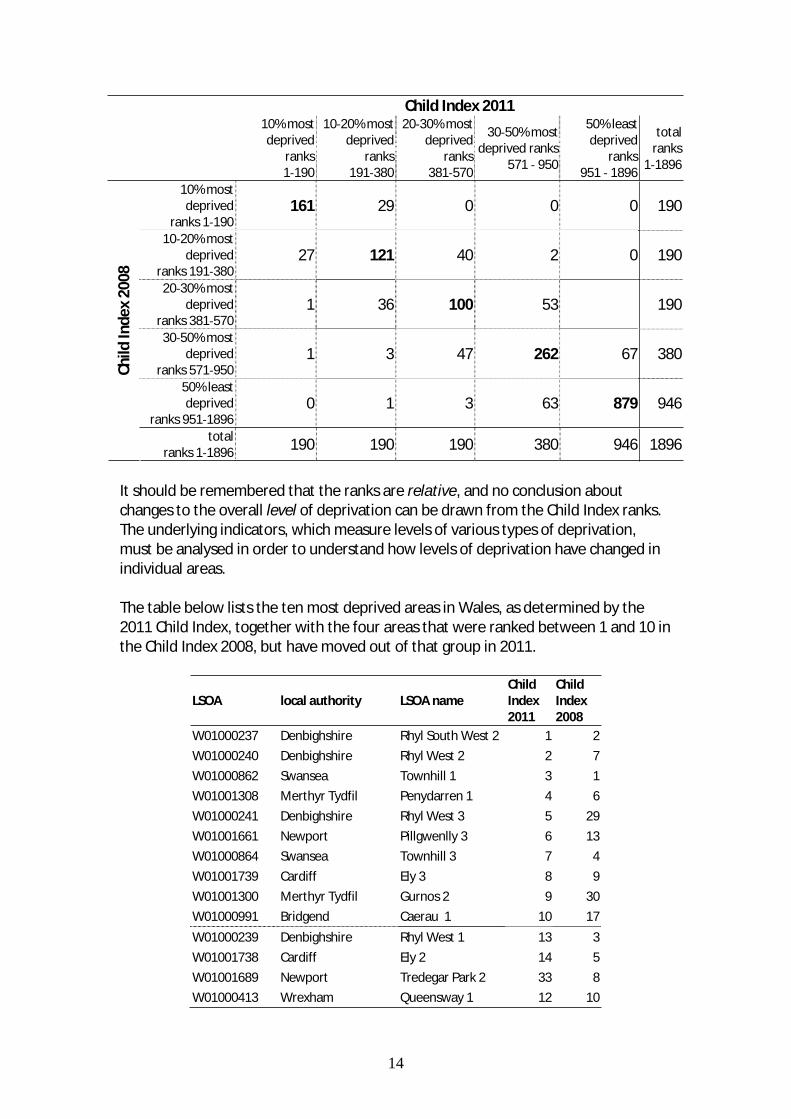
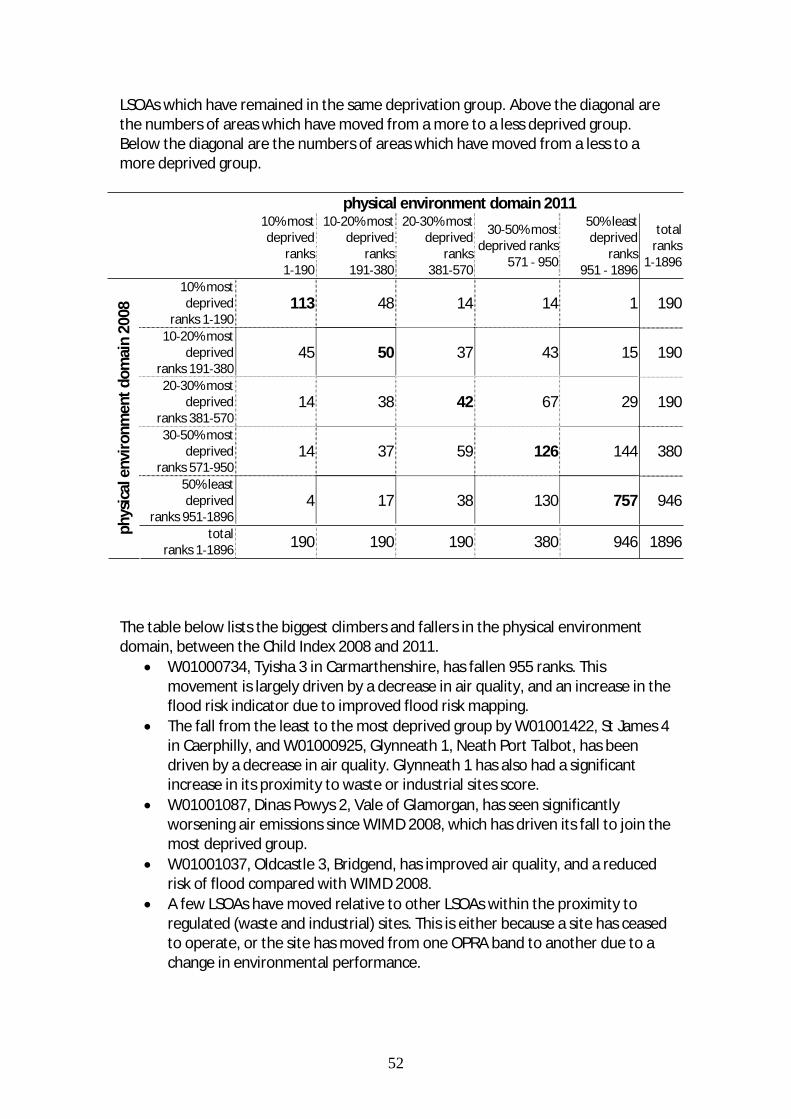
The table below shows the number of small areas (LSOAs) in each of the WIMDdeprivation groups for WIMD 2008 and 2011. The diagonal, in bold, shows thenumber of LSOAs which have remained in the same deprivation group. Above thediagonal are the numbers of areas which have moved from a more to a less deprivedgroup. Below the diagonal are the numbers of areas which have moved from a lessto a more deprived group.
14
Child Index 201110% mostdeprived
ranks1 190
10 20% mostdeprived
ranks191 380
20 30% mostdeprived
ranks381 570
30 50% mostdeprived ranks
571 950
50% leastdeprived
ranks951 1896
totalranks
1 1896
10% mostdeprived
ranks 1 190161 29 0 0 0 190
10 20% mostdeprived
ranks 191 38027 121 40 2 0 190
20 30% mostdeprived
ranks 381 5701 36 100 53 190
30 50% mostdeprived
ranks 571 9501 3 47 262 67 380
50% leastdeprived
ranks 951 18960 1 3 63 879 946
Child
Inde
x20
08
totalranks 1 1896 190 190 190 380 946 1896
It should be remembered that the ranks are relative, and no conclusion aboutchanges to the overall level of deprivation can be drawn from the Child Index ranks.The underlying indicators, which measure levels of various types of deprivation,must be analysed in order to understand how levels of deprivation have changed inindividual areas.
The table below lists the ten most deprived areas in Wales, as determined by the2011 Child Index, together with the four areas that were ranked between 1 and 10 inthe Child Index 2008, but have moved out of that group in 2011.
LSOA local authority LSOA nameChildIndex2011
ChildIndex2008
W01000237 Denbighshire Rhyl South West 2 1 2
W01000240 Denbighshire Rhyl West 2 2 7
W01000862 Swansea Townhill 1 3 1
W01001308 Merthyr Tydfil Penydarren 1 4 6
W01000241 Denbighshire Rhyl West 3 5 29
W01001661 Newport Pillgwenlly 3 6 13
W01000864 Swansea Townhill 3 7 4
W01001739 Cardiff Ely 3 8 9
W01001300 Merthyr Tydfil Gurnos 2 9 30
W01000991 Bridgend Caerau 1 10 17
W01000239 Denbighshire Rhyl West 1 13 3
W01001738 Cardiff Ely 2 14 5
W01001689 Newport Tredegar Park 2 33 8
W01000413 Wrexham Queensway 1 12 10
15
Parts of Rhyl in Denbighshire remain amongst the most deprived areas inWales.The drivers for the change in Child Index ranks are different in differentareas. For example, Tredegar Park 2 has improved from Child Index rank =8 in 2008 to 33 in 2011 driven by improved ranking in the health andcommunity safety domains. Rhyl West 1 has a strong rise in its educationranking.It should however be remembered that an analysis of the underlyingindicators is required in order to understand whether changes in ranksfor an area are due to real changes in the level of the underlyingindicators, and what the scale of that change is. For example, althoughTownhill 1 has risen by only two places in the Child Index ranks, from themost deprived area in Wales to the third most deprived area, it has seen asizeable change in the income indicator. The percentage of children livingin income benefit households has fallen by 15.7 percentage points from79.3% in the Child Index 2008 to 63.6% in 2011.
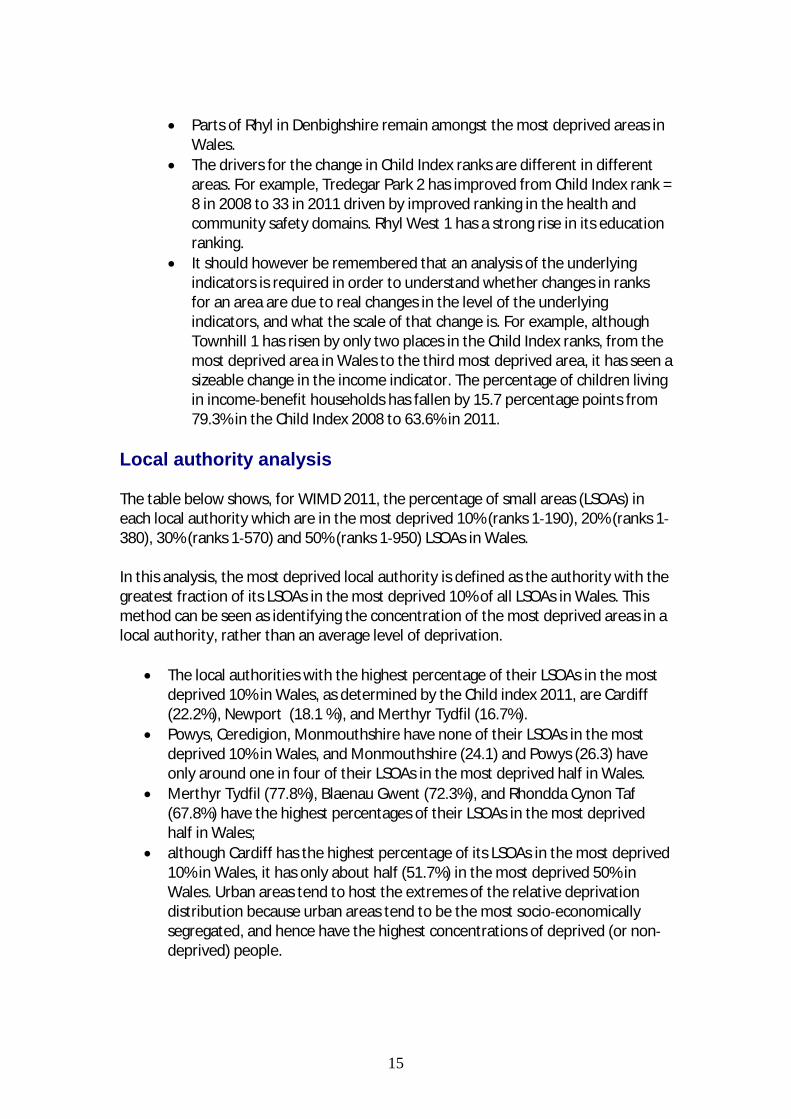
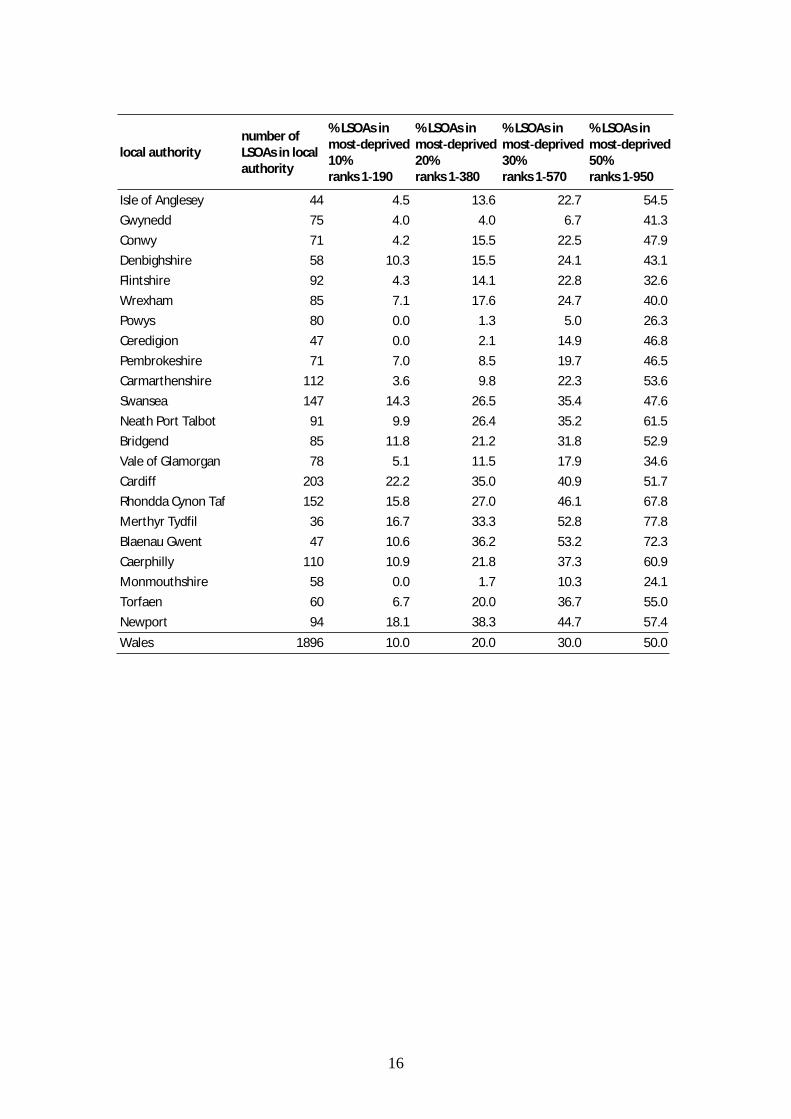
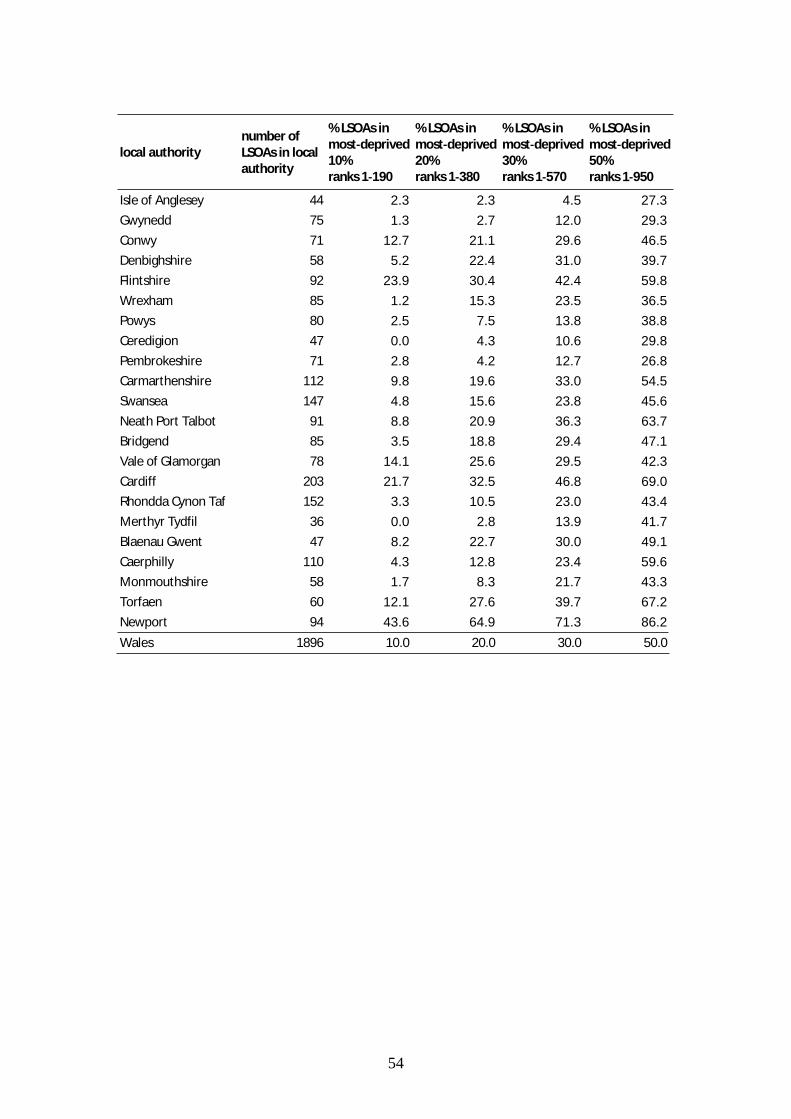
Local authority analysis
The table below shows, for WIMD 2011, the percentage of small areas (LSOAs) ineach local authority which are in the most deprived 10% (ranks 1 190), 20% (ranks 1380), 30% (ranks 1 570) and 50% (ranks 1 950) LSOAs in Wales.
In this analysis, the most deprived local authority is defined as the authority with thegreatest fraction of its LSOAs in the most deprived 10% of all LSOAs in Wales. Thismethod can be seen as identifying the concentration of the most deprived areas in alocal authority, rather than an average level of deprivation.
The local authorities with the highest percentage of their LSOAs in the mostdeprived 10% in Wales, as determined by the Child index 2011, are Cardiff(22.2%), Newport (18.1 %), and Merthyr Tydfil (16.7%).Powys, Ceredigion, Monmouthshire have none of their LSOAs in the mostdeprived 10% in Wales, and Monmouthshire (24.1) and Powys (26.3) haveonly around one in four of their LSOAs in the most deprived half in Wales.Merthyr Tydfil (77.8%), Blaenau Gwent (72.3%), and Rhondda Cynon Taf(67.8%) have the highest percentages of their LSOAs in the most deprivedhalf in Wales;although Cardiff has the highest percentage of its LSOAs in the most deprived10% in Wales, it has only about half (51.7%) in the most deprived 50% inWales. Urban areas tend to host the extremes of the relative deprivationdistribution because urban areas tend to be the most socio economicallysegregated, and hence have the highest concentrations of deprived (or nondeprived) people.
16
local authoritynumber ofLSOAs in localauthority
% LSOAs inmost deprived10%ranks 1 190
% LSOAs inmost deprived20%ranks 1 380
% LSOAs inmost deprived30%ranks 1 570
% LSOAs inmost deprived50%ranks 1 950
Isle of Anglesey 44 4.5 13.6 22.7 54.5
Gwynedd 75 4.0 4.0 6.7 41.3
Conwy 71 4.2 15.5 22.5 47.9
Denbighshire 58 10.3 15.5 24.1 43.1
Flintshire 92 4.3 14.1 22.8 32.6
Wrexham 85 7.1 17.6 24.7 40.0
Powys 80 0.0 1.3 5.0 26.3
Ceredigion 47 0.0 2.1 14.9 46.8
Pembrokeshire 71 7.0 8.5 19.7 46.5
Carmarthenshire 112 3.6 9.8 22.3 53.6
Swansea 147 14.3 26.5 35.4 47.6
Neath Port Talbot 91 9.9 26.4 35.2 61.5
Bridgend 85 11.8 21.2 31.8 52.9
Vale of Glamorgan 78 5.1 11.5 17.9 34.6
Cardiff 203 22.2 35.0 40.9 51.7
Rhondda Cynon Taf 152 15.8 27.0 46.1 67.8
Merthyr Tydfil 36 16.7 33.3 52.8 77.8
Blaenau Gwent 47 10.6 36.2 53.2 72.3
Caerphilly 110 10.9 21.8 37.3 60.9
Monmouthshire 58 0.0 1.7 10.3 24.1
Torfaen 60 6.7 20.0 36.7 55.0
Newport 94 18.1 38.3 44.7 57.4
Wales 1896 10.0 20.0 30.0 50.0
17
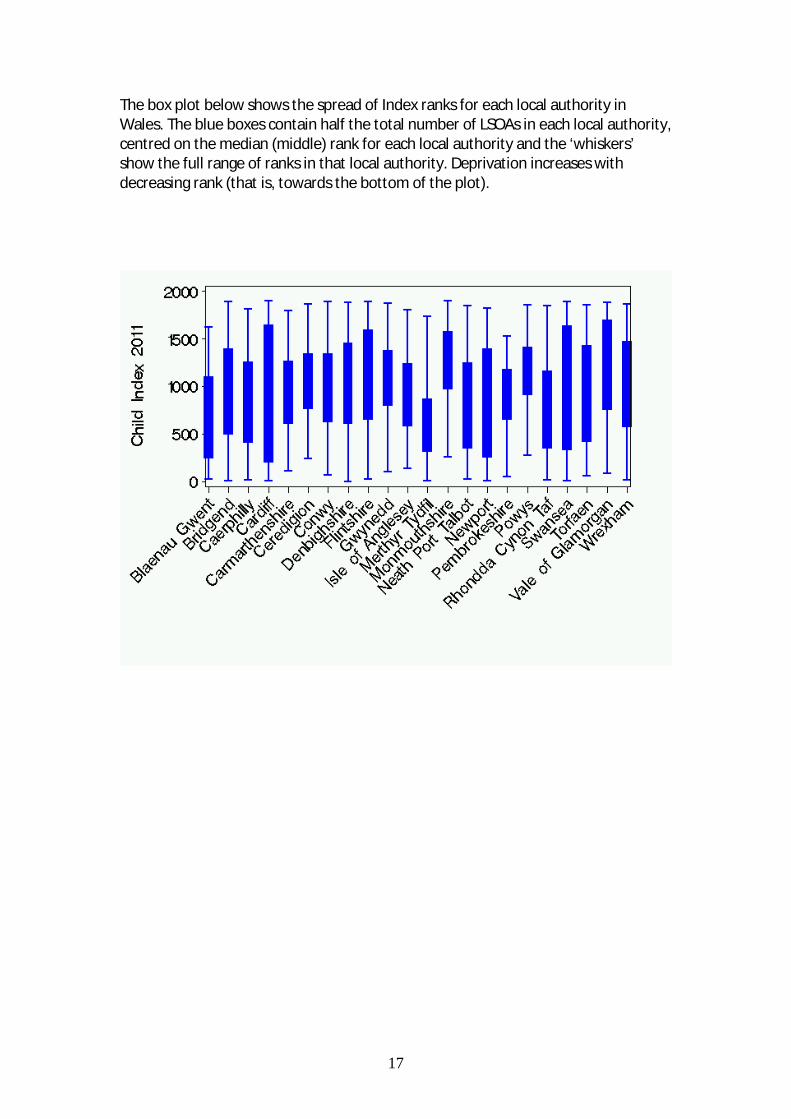
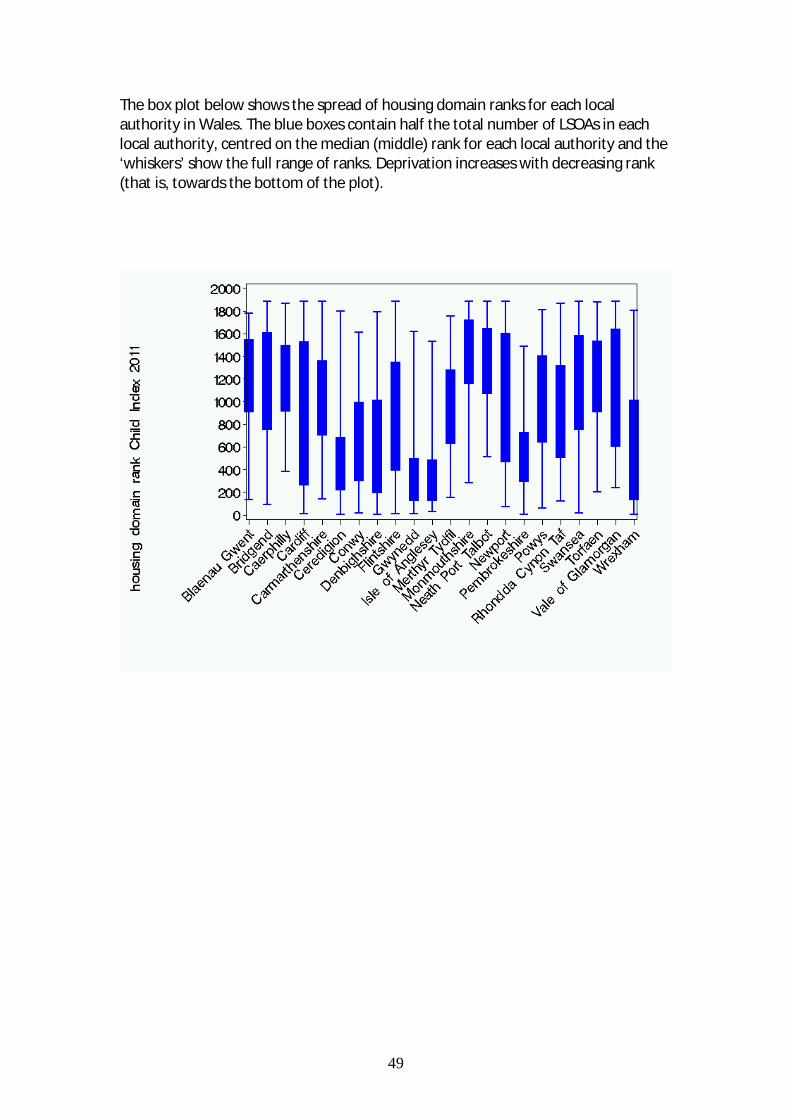
The box plot below shows the spread of Index ranks for each local authority inWales. The blue boxes contain half the total number of LSOAs in each local authority,centred on the median (middle) rank for each local authority and the ‘whiskers’show the full range of ranks in that local authority. Deprivation increases withdecreasing rank (that is, towards the bottom of the plot).
Welsh Index of Multiple Deprivation
191 to 380
381 to 570
951 to 1896
Most Deprived
Least DeprivedLocal Authority Boundary
By Lower Level Super Output Areas
CartographicsGeography & Technology, Welsh Government
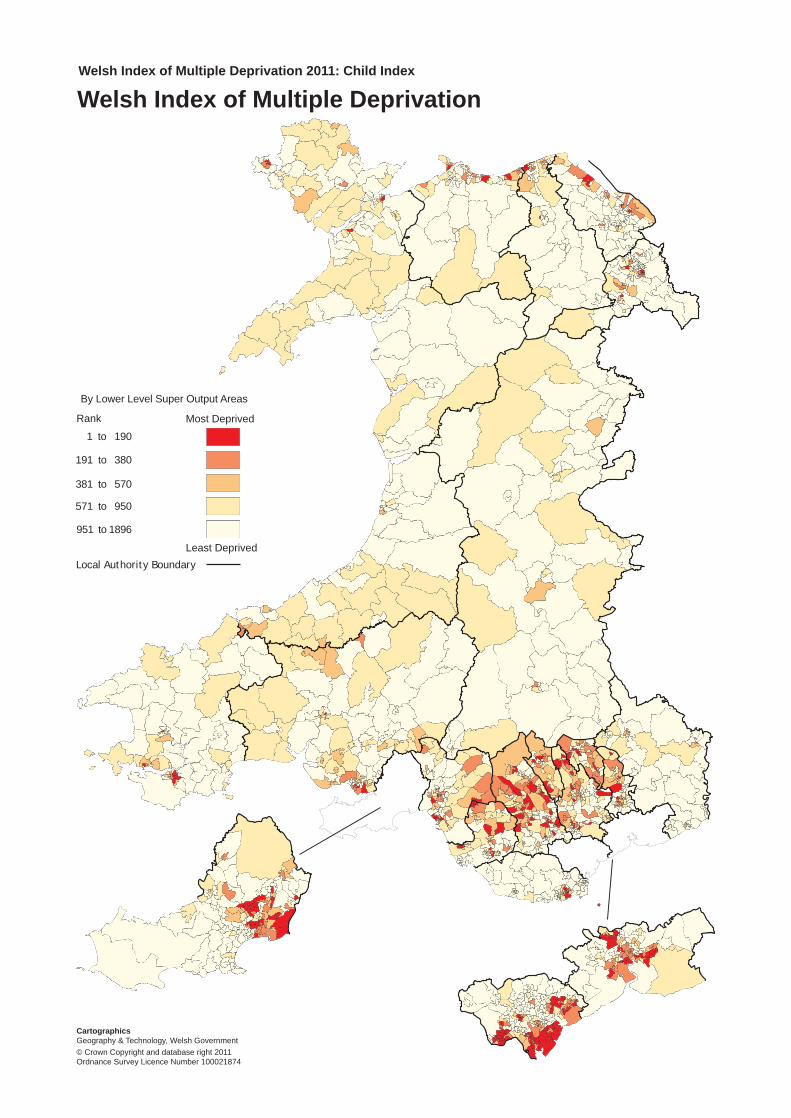
Welsh Index of Multiple Deprivation 2011: Child Index
1 to 190
571 to 950
Rank
© Crown Copyright and database right 2011Ordnance Survey Licence Number 100021874
19
lIncomel
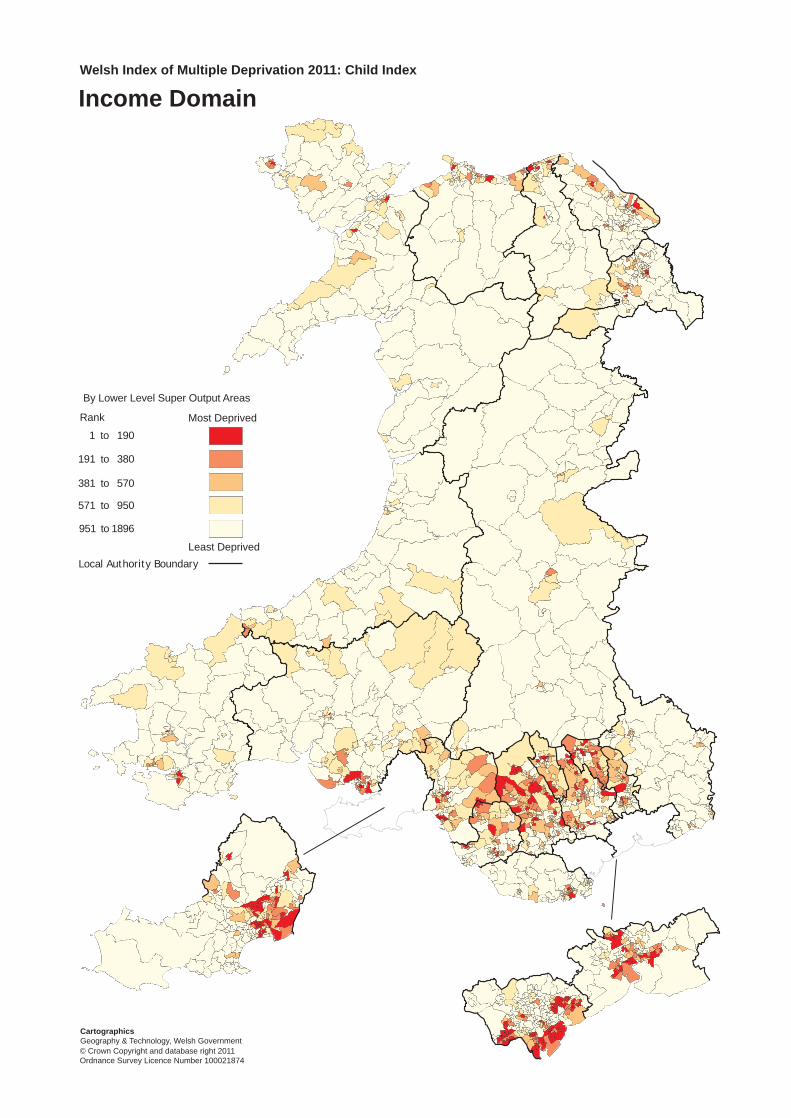
Income domain methodology
The income domain has a weight of 35.3% in the Child Index. This domain is thehighest weighted component of the Child Index, as it is a key driver of deprivation.For a complete description of the construction of the income domain, please see theWIMD: Child Index 2011 Technical Report.
Indicators
The income domain contains one indicator:
indicator units denominatorindicatoryear(s)
datasource
children in income related benefitshouseholds
2009/10 DWP
children in households receiving TaxCredits with income less than 60% ofthe Wales median
%LSOA populationaged 0 – 18years 2009/10 HMRC
The income related benefits included in the indicator are the de duplicated total ofchildren in households in receipt of: Income Support, Jobseekers Allowance, PensionCredit, Income Based Employment and Support Allowance.
Methodological changes
The Employment and Support Allowance (ESA) has replaced Incapacity Benefit fornew claimants since October 2008. The Income Support element of IncapacityBenefit is replaced with the income based element of ESA.
Income domain results and analysis
The full set of domain ranks (WIMD: Child Index 2011) and indicators (WIMD:indicator analysis) can be downloaded from the Welsh Government’s StatsWalesweb pages. The following sub section describes some of the changes occurring toLSOAs in the income domain since the Child Index 2008.
The table below shows the number of small areas (LSOAs) in each of the WIMDdeprivation groups for WIMD 2008 and 2011. The diagonal, in bold, shows thenumber of LSOAs which have remained in the same deprivation group. Above thediagonal are the numbers of areas which have moved from a more to a less deprivedgroup. Below the diagonal are the numbers of areas which have moved from a lessto a more deprived group.
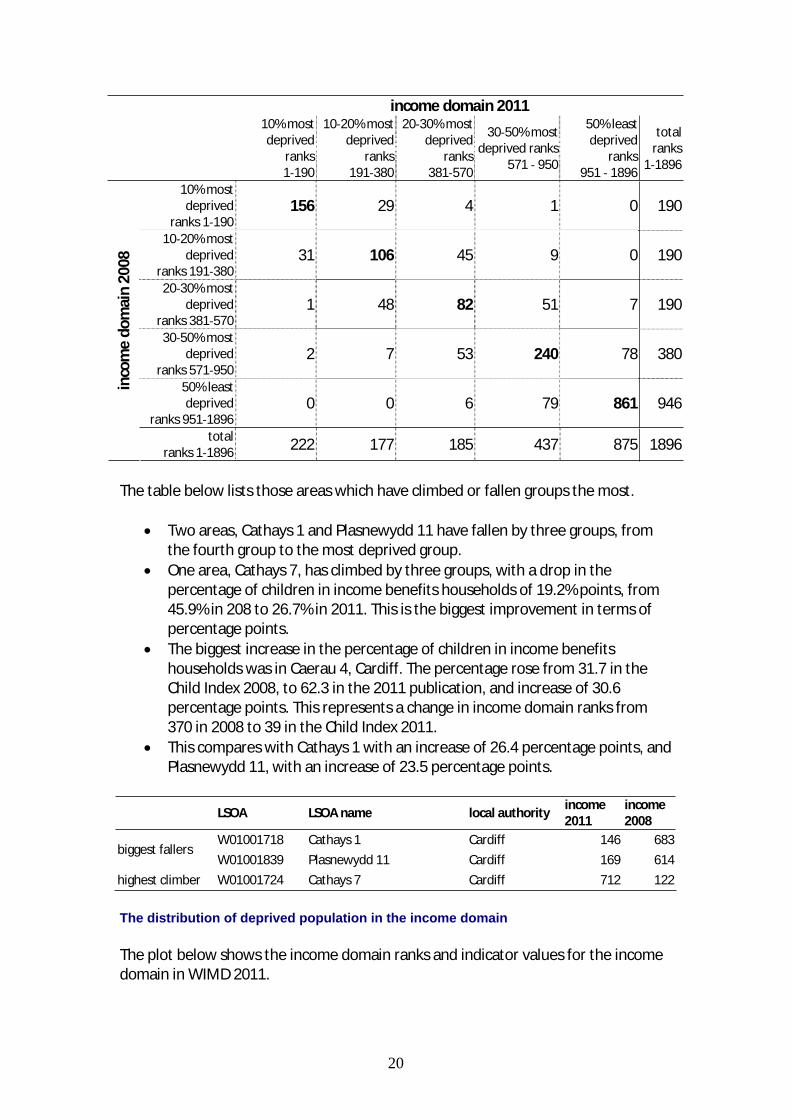
20
income domain 201110% mostdeprived
ranks1 190
10 20% mostdeprived
ranks191 380
20 30% mostdeprived
ranks381 570
30 50% mostdeprived ranks
571 950
50% leastdeprived
ranks951 1896
totalranks
1 1896
10% mostdeprived
ranks 1 190156 29 4 1 0 190
10 20% mostdeprived
ranks 191 38031 106 45 9 0 190
20 30% mostdeprived
ranks 381 5701 48 82 51 7 190
30 50% mostdeprived
ranks 571 9502 7 53 240 78 380
50% leastdeprived
ranks 951 18960 0 6 79 861 946
inco
me
dom
ain
2008
totalranks 1 1896 222 177 185 437 875 1896
The table below lists those areas which have climbed or fallen groups the most.
Two areas, Cathays 1 and Plasnewydd 11 have fallen by three groups, fromthe fourth group to the most deprived group.One area, Cathays 7, has climbed by three groups, with a drop in thepercentage of children in income benefits households of 19.2% points, from45.9% in 208 to 26.7% in 2011. This is the biggest improvement in terms ofpercentage points.The biggest increase in the percentage of children in income benefitshouseholds was in Caerau 4, Cardiff. The percentage rose from 31.7 in theChild Index 2008, to 62.3 in the 2011 publication, and increase of 30.6percentage points. This represents a change in income domain ranks from370 in 2008 to 39 in the Child Index 2011.This compares with Cathays 1 with an increase of 26.4 percentage points, andPlasnewydd 11, with an increase of 23.5 percentage points.
LSOA LSOA name local authorityincome2011
income2008
W01001718 Cathays 1 Cardiff 146 683biggest fallers
W01001839 Plasnewydd 11 Cardiff 169 614
highest climber W01001724 Cathays 7 Cardiff 712 122
The distribution of deprived population in the income domain
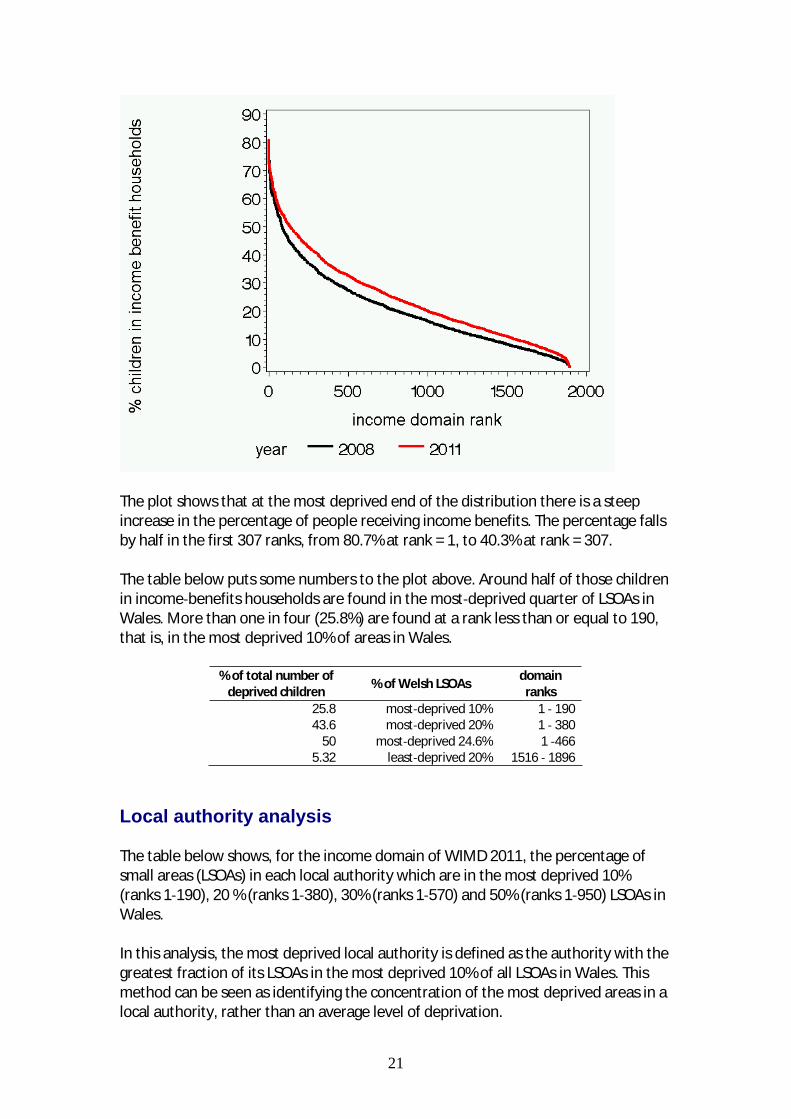
The plot below shows the income domain ranks and indicator values for the incomedomain in WIMD 2011.
21
The plot shows that at the most deprived end of the distribution there is a steepincrease in the percentage of people receiving income benefits. The percentage fallsby half in the first 307 ranks, from 80.7% at rank = 1, to 40.3% at rank = 307.
The table below puts some numbers to the plot above. Around half of those childrenin income benefits households are found in the most deprived quarter of LSOAs inWales. More than one in four (25.8%) are found at a rank less than or equal to 190,that is, in the most deprived 10% of areas in Wales.
% of total number ofdeprived children
% of Welsh LSOAsdomainranks
25.8 most deprived 10% 1 19043.6 most deprived 20% 1 380
50 most deprived 24.6% 1 4665.32 least deprived 20% 1516 1896
Local authority analysis
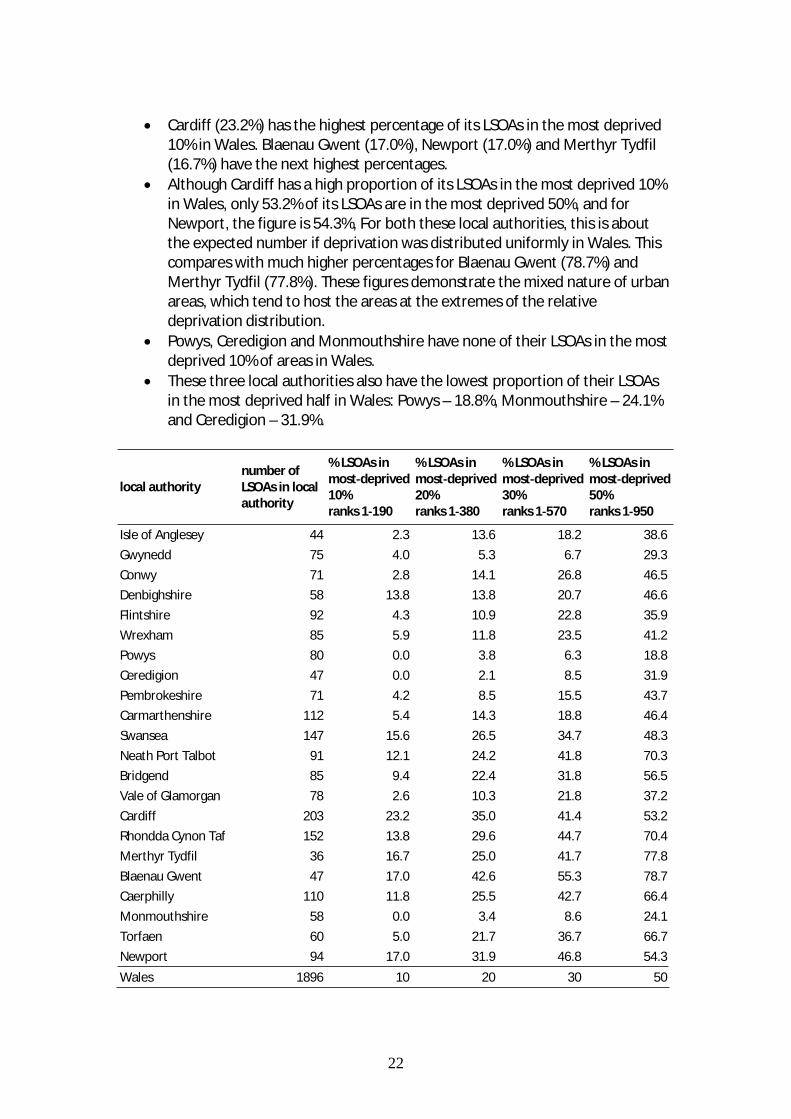
The table below shows, for the income domain of WIMD 2011, the percentage ofsmall areas (LSOAs) in each local authority which are in the most deprived 10%(ranks 1 190), 20 % (ranks 1 380), 30% (ranks 1 570) and 50% (ranks 1 950) LSOAs inWales.
In this analysis, the most deprived local authority is defined as the authority with thegreatest fraction of its LSOAs in the most deprived 10% of all LSOAs in Wales. Thismethod can be seen as identifying the concentration of the most deprived areas in alocal authority, rather than an average level of deprivation.
22
Cardiff (23.2%) has the highest percentage of its LSOAs in the most deprived10% in Wales. Blaenau Gwent (17.0%), Newport (17.0%) and Merthyr Tydfil(16.7%) have the next highest percentages.Although Cardiff has a high proportion of its LSOAs in the most deprived 10%in Wales, only 53.2% of its LSOAs are in the most deprived 50%, and forNewport, the figure is 54.3%, For both these local authorities, this is aboutthe expected number if deprivation was distributed uniformly in Wales. Thiscompares with much higher percentages for Blaenau Gwent (78.7%) andMerthyr Tydfil (77.8%). These figures demonstrate the mixed nature of urbanareas, which tend to host the areas at the extremes of the relativedeprivation distribution.Powys, Ceredigion and Monmouthshire have none of their LSOAs in the mostdeprived 10% of areas in Wales.These three local authorities also have the lowest proportion of their LSOAsin the most deprived half in Wales: Powys – 18.8%, Monmouthshire – 24.1%and Ceredigion – 31.9%.
local authoritynumber ofLSOAs in localauthority
% LSOAs inmost deprived10%ranks 1 190
% LSOAs inmost deprived20%ranks 1 380
% LSOAs inmost deprived30%ranks 1 570
% LSOAs inmost deprived50%ranks 1 950
Isle of Anglesey 44 2.3 13.6 18.2 38.6
Gwynedd 75 4.0 5.3 6.7 29.3
Conwy 71 2.8 14.1 26.8 46.5
Denbighshire 58 13.8 13.8 20.7 46.6
Flintshire 92 4.3 10.9 22.8 35.9
Wrexham 85 5.9 11.8 23.5 41.2
Powys 80 0.0 3.8 6.3 18.8
Ceredigion 47 0.0 2.1 8.5 31.9
Pembrokeshire 71 4.2 8.5 15.5 43.7
Carmarthenshire 112 5.4 14.3 18.8 46.4
Swansea 147 15.6 26.5 34.7 48.3
Neath Port Talbot 91 12.1 24.2 41.8 70.3
Bridgend 85 9.4 22.4 31.8 56.5
Vale of Glamorgan 78 2.6 10.3 21.8 37.2
Cardiff 203 23.2 35.0 41.4 53.2
Rhondda Cynon Taf 152 13.8 29.6 44.7 70.4
Merthyr Tydfil 36 16.7 25.0 41.7 77.8
Blaenau Gwent 47 17.0 42.6 55.3 78.7
Caerphilly 110 11.8 25.5 42.7 66.4
Monmouthshire 58 0.0 3.4 8.6 24.1
Torfaen 60 5.0 21.7 36.7 66.7
Newport 94 17.0 31.9 46.8 54.3
Wales 1896 10 20 30 50
23
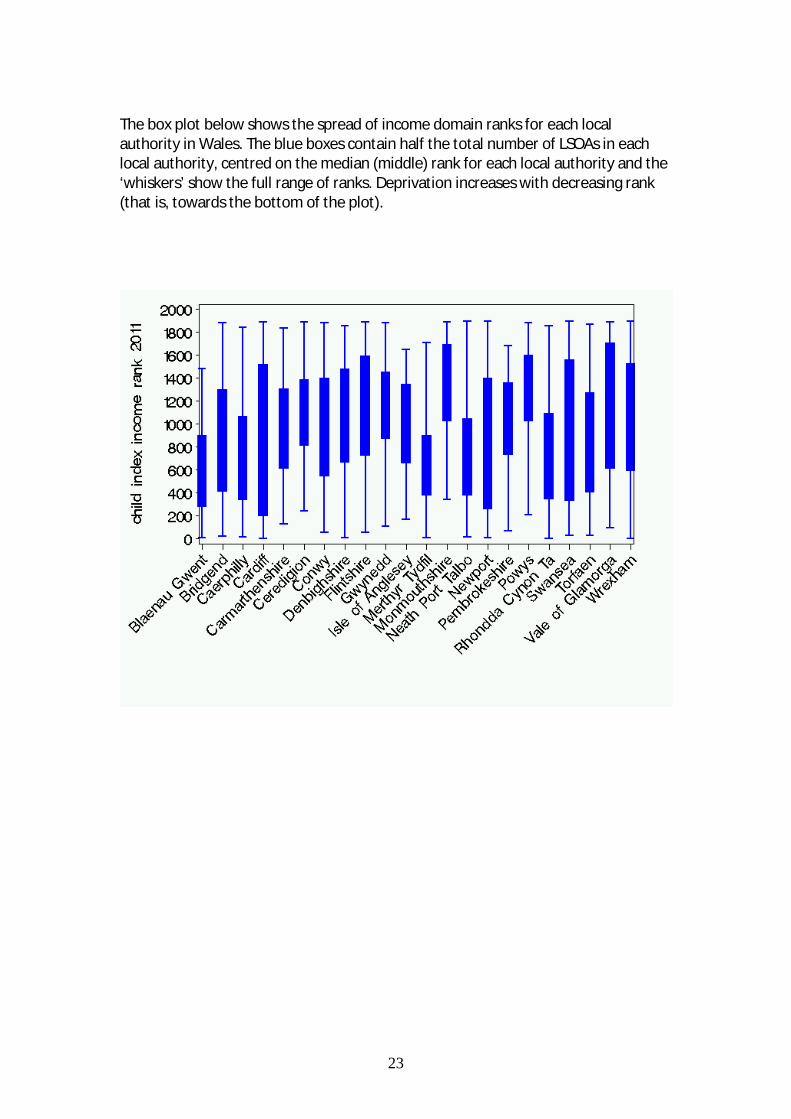
The box plot below shows the spread of income domain ranks for each localauthority in Wales. The blue boxes contain half the total number of LSOAs in eachlocal authority, centred on the median (middle) rank for each local authority and the‘whiskers’ show the full range of ranks. Deprivation increases with decreasing rank(that is, towards the bottom of the plot).
191 to 380
381 to 570
951 to 1896
Most Deprived
Least DeprivedLocal Authority Boundary
By Lower Level Super Output Areas
CartographicsGeography & Technology, Welsh Government
Welsh Index of Multiple Deprivation 2011: Child Index
1 to 190
571 to 950
Income Domain
Rank
© Crown Copyright and database right 2011Ordnance Survey Licence Number 100021874
25
lEducationl
Education domain methodology
The education domain has a relative weight of 14% in the Index. For a completedescription of the construction of the education domain, please see the WIMD 2011Technical Report.
Indicators
The education domain contains five indicators. These indicators are the same as inWIMD 2011, but the Child Index does not include the indicators for the percentageof adults with no qualifications or the proportion of 18 – 19 years olds not enteringhigher education. This means that the weights determined by the factor analysis aredifferent, and that the resulting set of domain ranks are different from WIMD 2011.
indicator units denominatorindicatoryear(s)
data source weight
Key Stage 2average pointscores
pointsscore
number of KS2 pupils 2008 10 0.11
Key Stage 3average pointscores
pointsscore
number of KS3 pupils 2008 10 0.33
Key Stage 4average pointscores
pointsscore
number of KS4 pupils 2009 10 0.17
percentageprimary schoolhalf day absence
%number of half dayschool sessions
2008/92009/10
0.17
percentagesecondary schoolhalf day absence
%number of half dayschool sessions
2008/92009/10
National PupilDatabase / Pupil LevelAnnual School Census/ National DataCollection
0.22
All the education indicators in the education domain were updated for the ChildIndex 2011.
Methodological changes
Pupil postcodes are now available for both primary and secondary absences. This isan improvement over WIMD 2008, where the school level data had to beapportioned to postcodes. The Key Stage 4 (GCSE level) points scoring systemchanged in 2008, and it also now includes qualifications other than GCSEs. Data areno longer available for the old points system. The inclusion of qualifications otherthan GCSE improves this indicator, but both the level and the ratio between
26
successive grades are changed, which may lead to differences in the ranking.
Education domain results and analysis
The full set of domain ranks (Child Index 2011) and indicators (WIMD: indicatoranalysis) can be downloaded from the Welsh Government’s StatsWales web pages.The following sub section describes some of the changes occurring to LSOAs in theeducation domain since the Child index 2008.
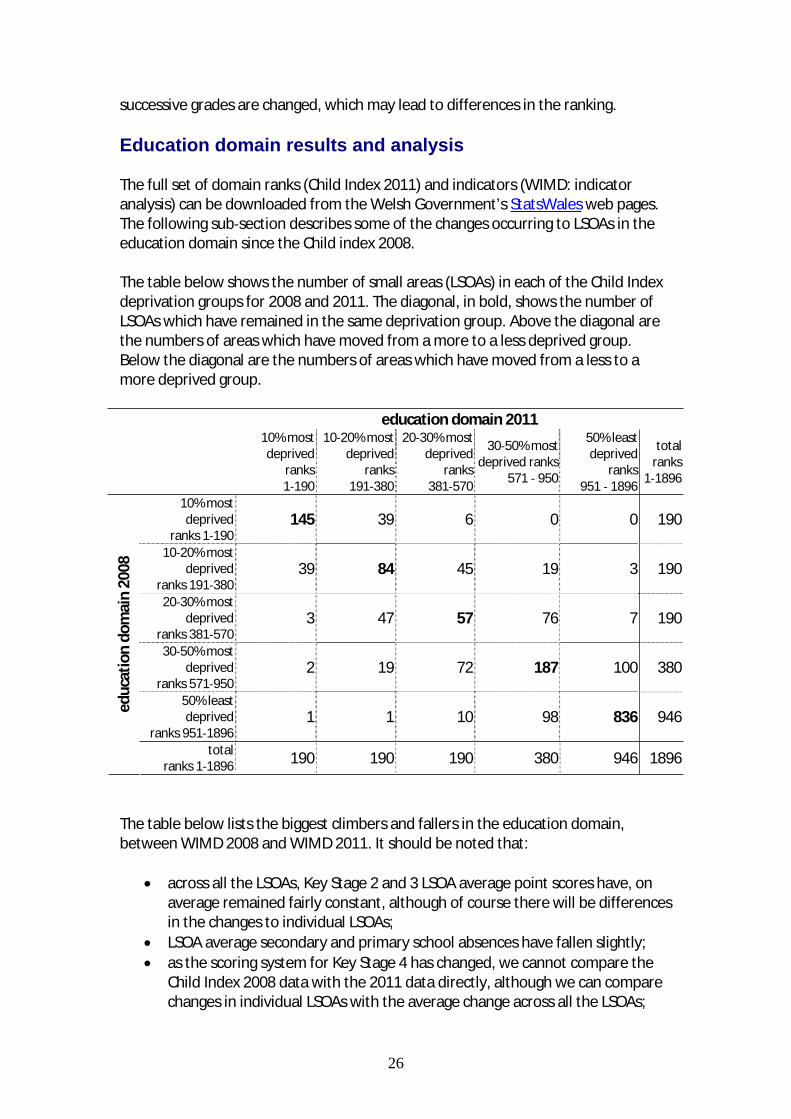
The table below shows the number of small areas (LSOAs) in each of the Child Indexdeprivation groups for 2008 and 2011. The diagonal, in bold, shows the number ofLSOAs which have remained in the same deprivation group. Above the diagonal arethe numbers of areas which have moved from a more to a less deprived group.Below the diagonal are the numbers of areas which have moved from a less to amore deprived group.
education domain 201110% mostdeprived
ranks1 190
10 20% mostdeprived
ranks191 380
20 30% mostdeprived
ranks381 570
30 50% mostdeprived ranks
571 950
50% leastdeprived
ranks951 1896
totalranks
1 1896
10% mostdeprived
ranks 1 190145 39 6 0 0 190
10 20% mostdeprived
ranks 191 38039 84 45 19 3 190
20 30% mostdeprived
ranks 381 5703 47 57 76 7 190
30 50% mostdeprived
ranks 571 9502 19 72 187 100 380
50% leastdeprived
ranks 951 18961 1 10 98 836 946
educ
atio
ndo
mai
n20
08
totalranks 1 1896 190 190 190 380 946 1896
The table below lists the biggest climbers and fallers in the education domain,between WIMD 2008 and WIMD 2011. It should be noted that:
across all the LSOAs, Key Stage 2 and 3 LSOA average point scores have, onaverage remained fairly constant, although of course there will be differencesin the changes to individual LSOAs;LSOA average secondary and primary school absences have fallen slightly;as the scoring system for Key Stage 4 has changed, we cannot compare theChild Index 2008 data with the 2011 data directly, although we can comparechanges in individual LSOAs with the average change across all the LSOAs;
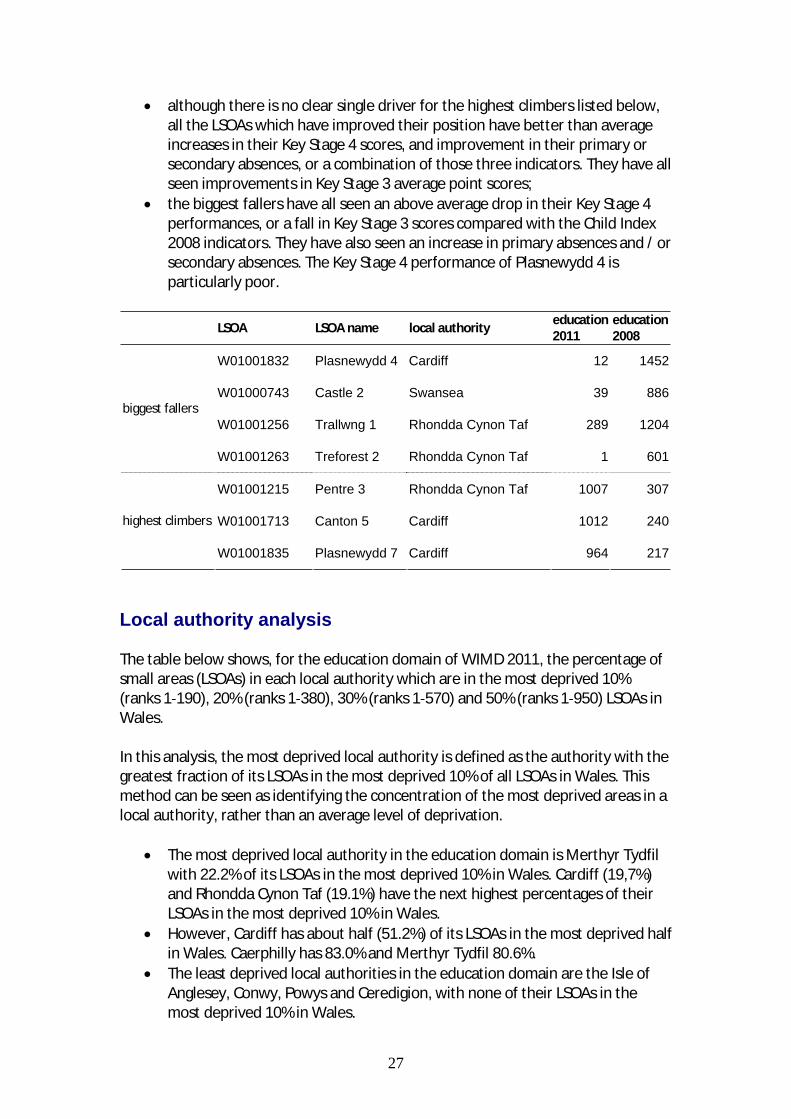
27
although there is no clear single driver for the highest climbers listed below,all the LSOAs which have improved their position have better than averageincreases in their Key Stage 4 scores, and improvement in their primary orsecondary absences, or a combination of those three indicators. They have allseen improvements in Key Stage 3 average point scores;the biggest fallers have all seen an above average drop in their Key Stage 4performances, or a fall in Key Stage 3 scores compared with the Child Index2008 indicators. They have also seen an increase in primary absences and / orsecondary absences. The Key Stage 4 performance of Plasnewydd 4 isparticularly poor.
LSOA LSOA name local authorityeducation2011
education2008
W01001832 Plasnewydd 4 Cardiff 12 1452
W01000743 Castle 2 Swansea 39 886
W01001256 Trallwng 1 Rhondda Cynon Taf 289 1204biggest fallers
W01001263 Treforest 2 Rhondda Cynon Taf 1 601
W01001215 Pentre 3 Rhondda Cynon Taf 1007 307
W01001713 Canton 5 Cardiff 1012 240highest climbers
W01001835 Plasnewydd 7 Cardiff 964 217
Local authority analysis
The table below shows, for the education domain of WIMD 2011, the percentage ofsmall areas (LSOAs) in each local authority which are in the most deprived 10%(ranks 1 190), 20% (ranks 1 380), 30% (ranks 1 570) and 50% (ranks 1 950) LSOAs inWales.
In this analysis, the most deprived local authority is defined as the authority with thegreatest fraction of its LSOAs in the most deprived 10% of all LSOAs in Wales. Thismethod can be seen as identifying the concentration of the most deprived areas in alocal authority, rather than an average level of deprivation.
The most deprived local authority in the education domain is Merthyr Tydfilwith 22.2% of its LSOAs in the most deprived 10% in Wales. Cardiff (19,7%)and Rhondda Cynon Taf (19.1%) have the next highest percentages of theirLSOAs in the most deprived 10% in Wales.However, Cardiff has about half (51.2%) of its LSOAs in the most deprived halfin Wales. Caerphilly has 83.0% and Merthyr Tydfil 80.6%.The least deprived local authorities in the education domain are the Isle ofAnglesey, Conwy, Powys and Ceredigion, with none of their LSOAs in themost deprived 10% in Wales.
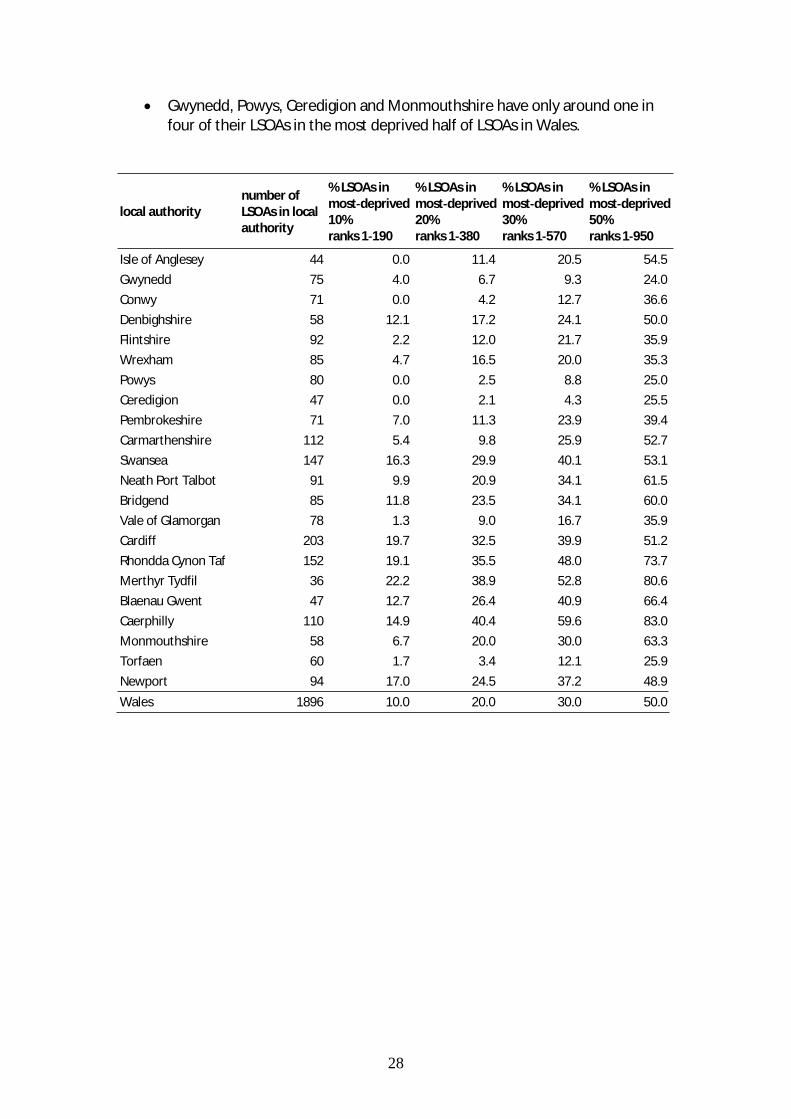
28
Gwynedd, Powys, Ceredigion and Monmouthshire have only around one infour of their LSOAs in the most deprived half of LSOAs in Wales.
local authoritynumber ofLSOAs in localauthority
% LSOAs inmost deprived10%ranks 1 190
% LSOAs inmost deprived20%ranks 1 380
% LSOAs inmost deprived30%ranks 1 570
% LSOAs inmost deprived50%ranks 1 950
Isle of Anglesey 44 0.0 11.4 20.5 54.5
Gwynedd 75 4.0 6.7 9.3 24.0
Conwy 71 0.0 4.2 12.7 36.6
Denbighshire 58 12.1 17.2 24.1 50.0
Flintshire 92 2.2 12.0 21.7 35.9
Wrexham 85 4.7 16.5 20.0 35.3
Powys 80 0.0 2.5 8.8 25.0
Ceredigion 47 0.0 2.1 4.3 25.5
Pembrokeshire 71 7.0 11.3 23.9 39.4
Carmarthenshire 112 5.4 9.8 25.9 52.7
Swansea 147 16.3 29.9 40.1 53.1
Neath Port Talbot 91 9.9 20.9 34.1 61.5
Bridgend 85 11.8 23.5 34.1 60.0
Vale of Glamorgan 78 1.3 9.0 16.7 35.9
Cardiff 203 19.7 32.5 39.9 51.2
Rhondda Cynon Taf 152 19.1 35.5 48.0 73.7
Merthyr Tydfil 36 22.2 38.9 52.8 80.6
Blaenau Gwent 47 12.7 26.4 40.9 66.4
Caerphilly 110 14.9 40.4 59.6 83.0
Monmouthshire 58 6.7 20.0 30.0 63.3
Torfaen 60 1.7 3.4 12.1 25.9
Newport 94 17.0 24.5 37.2 48.9
Wales 1896 10.0 20.0 30.0 50.0
29
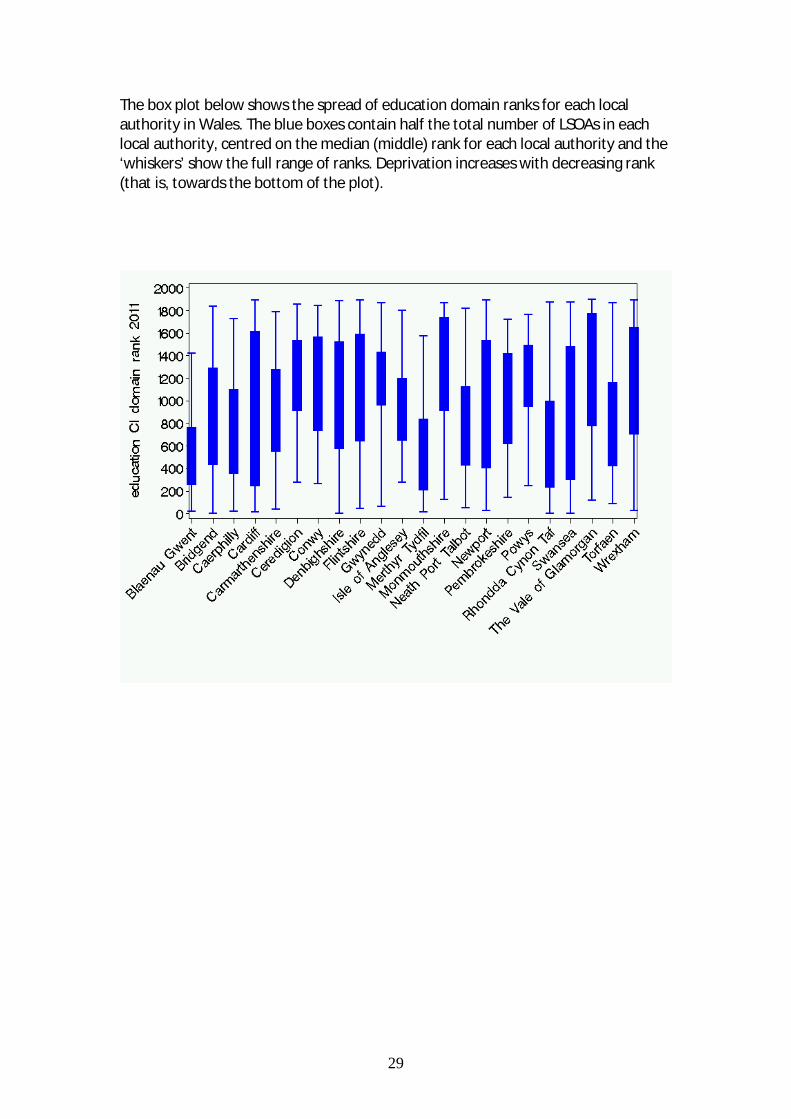
The box plot below shows the spread of education domain ranks for each localauthority in Wales. The blue boxes contain half the total number of LSOAs in eachlocal authority, centred on the median (middle) rank for each local authority and the‘whiskers’ show the full range of ranks. Deprivation increases with decreasing rank(that is, towards the bottom of the plot).
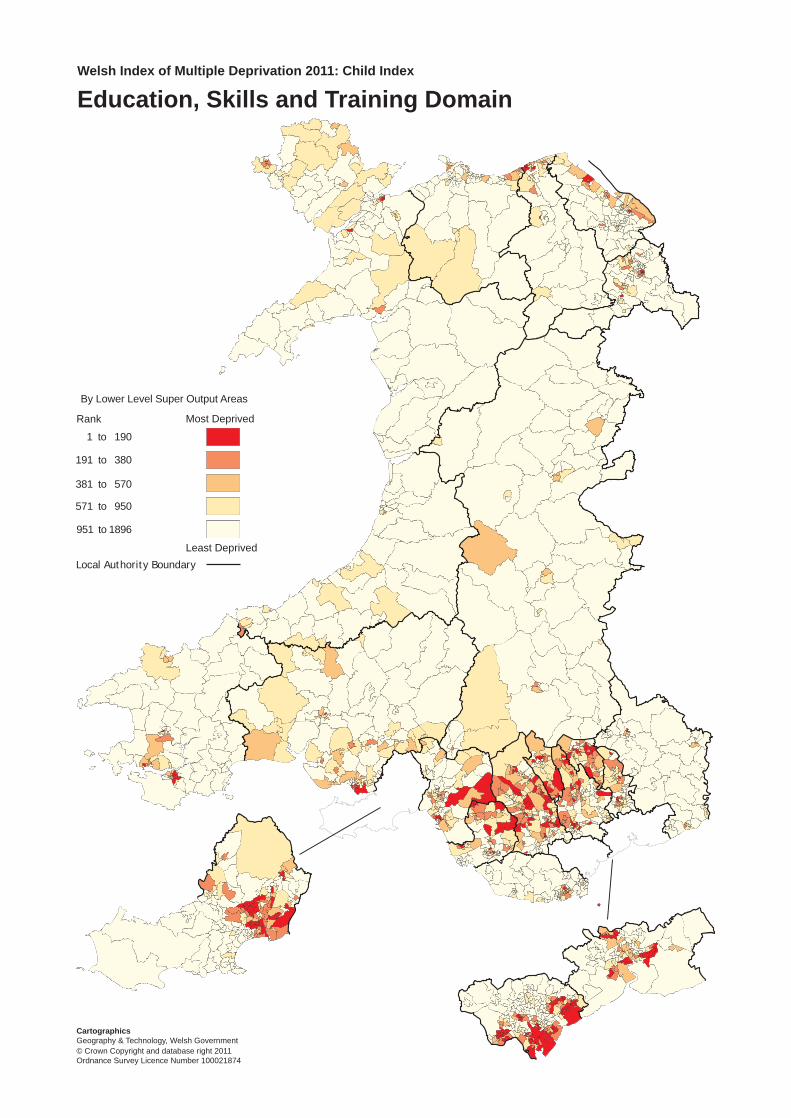
Education, Skills and Training Domain
191 to 380
381 to 570
951 to 1896
Most Deprived
Least DeprivedLocal Authority Boundary
By Lower Level Super Output Areas
CartographicsGeography & Technology, Welsh Government
Welsh Index of Multiple Deprivation 2011: Child Index
1 to 190
571 to 950
Rank
© Crown Copyright and database right 2011Ordnance Survey Licence Number 100021874
31
lHealthl
Health domain methodology
The health domain has a relative weight of 17.1% in the Child Index. For a completedescription of the construction of the health domain, please see the WIMD: Childindex 2011 Technical Report.
Indicators
The health domain contains two indicators:
domain indicator denominatorindicatoryear(s)
datasource
weight
percentage of live singlebirths < 2.5kg
%number of livesingle births
2000 2009 ONS 0.50
limiting long term illness(children)
numberper100,000
LSOApopulationaged 0 – 18years old
2001Census,ONS
0.50
The limiting long term illness indicator was not updated for the Child Index 2011,because Census 2011 data were not yet available.
Methodological changes
There are no methodological changes in this domain.
Health domain results and analysis
The full set of domain ranks (Child index 2011) and indicators (WIMD: indicatoranalysis) can be downloaded from the Welsh Government’s StatsWales web pages.The following sub section describes some of the changes occurring to LSOAs in thehealth domain since the Child Index 2008.
The table below shows the number of small areas (LSOAs) in each of the Child Indexdeprivation groups for WIMD 2008 and 2011. The diagonal, in bold, shows thenumber of LSOAs which have remained in the same deprivation group. Above thediagonal are the numbers of areas which have moved from a more to a less deprivedgroup. Below the diagonal are the numbers of areas which have moved from a lessto a more deprived group.
32
health domain 201110% mostdeprived
ranks1 190
10 20% mostdeprived
ranks191 380
20 30% mostdeprived
ranks381 570
30 50% mostdeprived
ranks571 950
50% leastdeprived
ranks951 1896
totalranks
1 1896
10% mostdeprived
ranks 1 190138 37 12 3 190
10 20% mostdeprived
ranks 191 38038 84 44 22 2 190
20 30% mostdeprived
ranks 381 57012 48 62 63 5 190
30 50% mostdeprived
ranks 571 9502 18 65 196 99 380
50% leastdeprived
ranks 951 18963 7 96 840 946
heal
thdo
mai
n20
08
totalranks 1 1896 190 190 190 380 946 1896
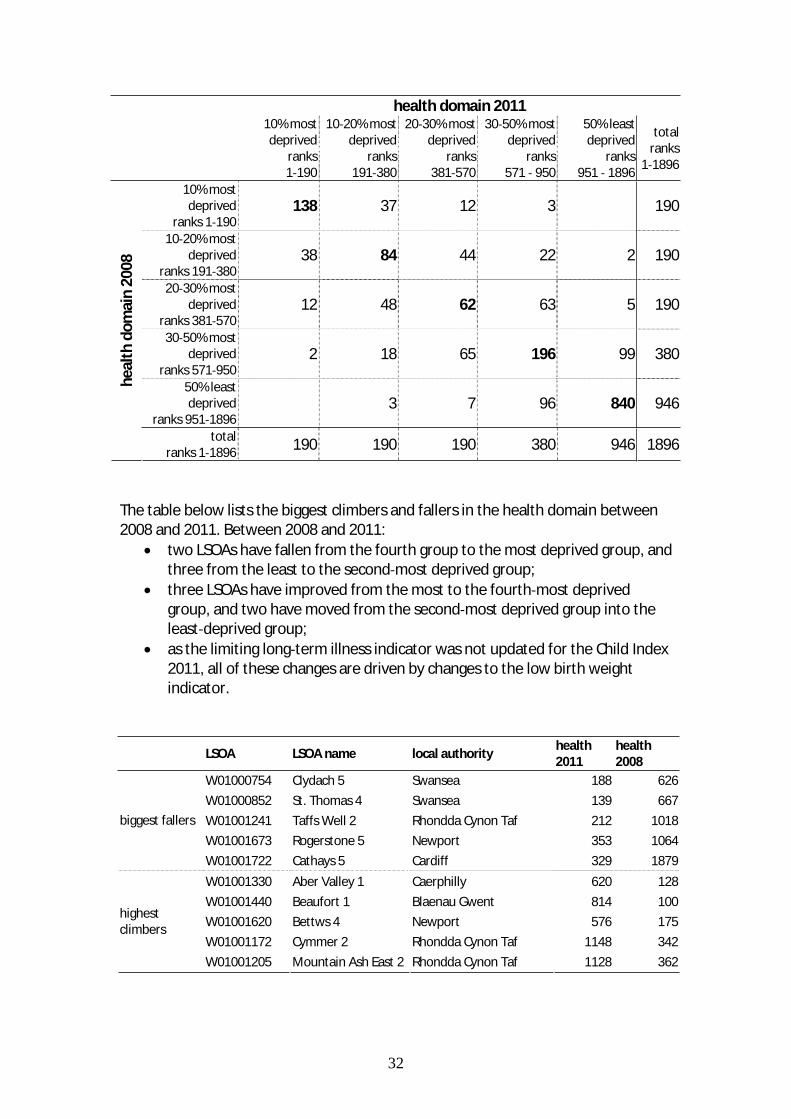
The table below lists the biggest climbers and fallers in the health domain between2008 and 2011. Between 2008 and 2011:
two LSOAs have fallen from the fourth group to the most deprived group, andthree from the least to the second most deprived group;three LSOAs have improved from the most to the fourth most deprivedgroup, and two have moved from the second most deprived group into theleast deprived group;as the limiting long term illness indicator was not updated for the Child Index2011, all of these changes are driven by changes to the low birth weightindicator.
LSOA LSOA name local authorityhealth2011
health2008
W01000754 Clydach 5 Swansea 188 626
W01000852 St. Thomas 4 Swansea 139 667
W01001241 Taffs Well 2 Rhondda Cynon Taf 212 1018
W01001673 Rogerstone 5 Newport 353 1064
biggest fallers
W01001722 Cathays 5 Cardiff 329 1879
W01001330 Aber Valley 1 Caerphilly 620 128
W01001440 Beaufort 1 Blaenau Gwent 814 100
W01001620 Bettws 4 Newport 576 175
W01001172 Cymmer 2 Rhondda Cynon Taf 1148 342
highestclimbers
W01001205 Mountain Ash East 2 Rhondda Cynon Taf 1128 362
33
Local authority analysis
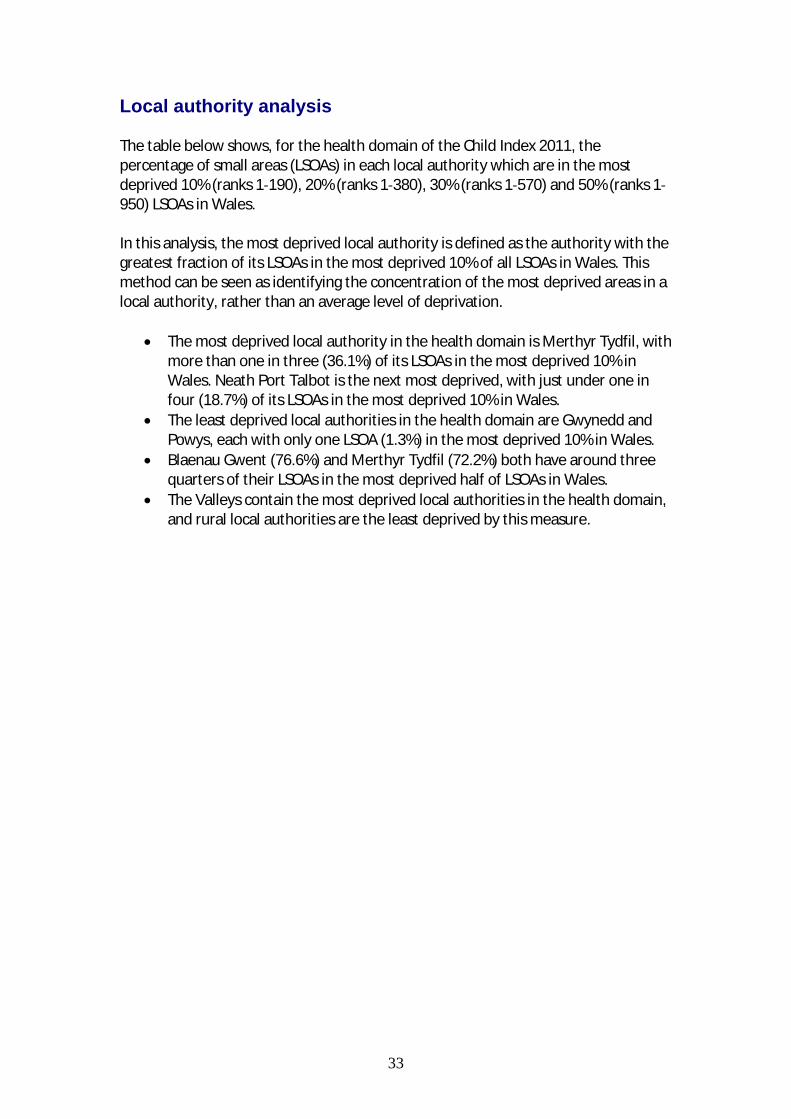
The table below shows, for the health domain of the Child Index 2011, thepercentage of small areas (LSOAs) in each local authority which are in the mostdeprived 10% (ranks 1 190), 20% (ranks 1 380), 30% (ranks 1 570) and 50% (ranks 1950) LSOAs in Wales.
In this analysis, the most deprived local authority is defined as the authority with thegreatest fraction of its LSOAs in the most deprived 10% of all LSOAs in Wales. Thismethod can be seen as identifying the concentration of the most deprived areas in alocal authority, rather than an average level of deprivation.
The most deprived local authority in the health domain is Merthyr Tydfil, withmore than one in three (36.1%) of its LSOAs in the most deprived 10% inWales. Neath Port Talbot is the next most deprived, with just under one infour (18.7%) of its LSOAs in the most deprived 10% in Wales.The least deprived local authorities in the health domain are Gwynedd andPowys, each with only one LSOA (1.3%) in the most deprived 10% in Wales.Blaenau Gwent (76.6%) and Merthyr Tydfil (72.2%) both have around threequarters of their LSOAs in the most deprived half of LSOAs in Wales.The Valleys contain the most deprived local authorities in the health domain,and rural local authorities are the least deprived by this measure.

34
local authoritynumber ofLSOAs in localauthority
% LSOAs inmost deprived10%ranks 1 190
% LSOAs inmost deprived20%ranks 1 380
% LSOAs inmost deprived30%ranks 1 570
% LSOAs inmost deprived50%ranks 1 950
Isle of Anglesey 44 4.5 13.6 18.2 47.7
Gwynedd 75 1.3 5.3 6.7 21.3
Conwy 71 11.3 21.1 25.4 46.5
Denbighshire 58 12.1 13.8 22.4 41.4
Flintshire 92 4.3 12 22.8 41.3
Wrexham 85 8.2 14.1 22.4 44.7
Powys 80 1.3 2.5 8.8 28.8
Ceredigion 47 6.4 12.8 14.9 29.8
Pembrokeshire 71 8.5 12.7 23.9 52.1
Carmarthenshire 112 5.4 14.3 25.9 50.9
Swansea 147 9.5 23.1 32 46.3
Neath Port Talbot 91 18.7 26.4 42.9 61.5
Bridgend 85 15.3 22.4 31.8 56.5
Vale of Glamorgan 78 6.4 11.5 19.2 39.7
Cardiff 203 7.4 24.1 36 51.2
Rhondda Cynon Taf 152 17.1 34.2 47.4 65.8
Merthyr Tydfil 36 36.1 52.8 63.9 72.2
Blaenau Gwent 47 14.9 36.2 38.3 76.6
Caerphilly 110 10 20.9 42.7 65.5
Monmouthshire 58 1.7 5.2 15.5 31
Torfaen 60 11.7 31.7 40 65
Newport 94 17 24.5 34 54.3
Wales 1896 10.0 20.0 30.0 50.0
35
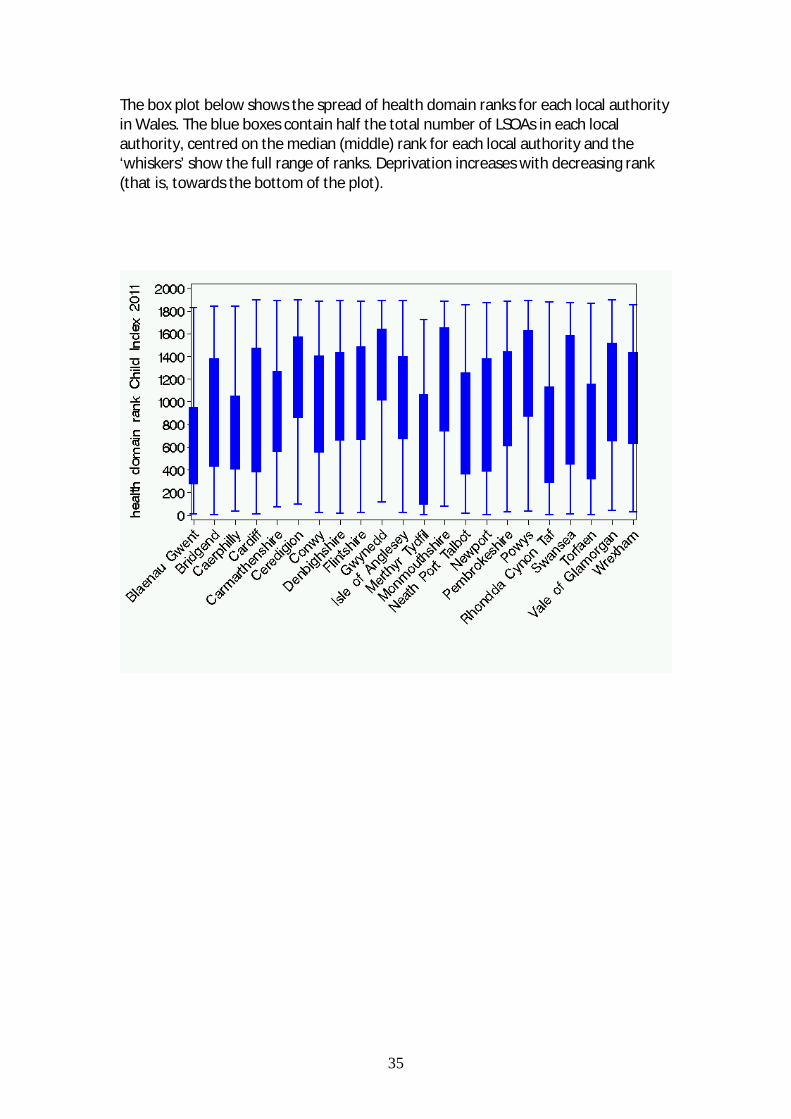
The box plot below shows the spread of health domain ranks for each local authorityin Wales. The blue boxes contain half the total number of LSOAs in each localauthority, centred on the median (middle) rank for each local authority and the‘whiskers’ show the full range of ranks. Deprivation increases with decreasing rank(that is, towards the bottom of the plot).
Health Domain
191 to 380
381 to 570
951 to 1896
Most Deprived
Least DeprivedLocal Authority Boundary
By Lower Level Super Output Areas
CartographicsGeography & Technology, Welsh Government
Welsh Index of Multiple Deprivation 2011: Child Index
1 to 190
571 to 950
Rank
© Crown Copyright and database right 2011Ordnance Survey Licence Number 100021874
37
lCommunity safetyl
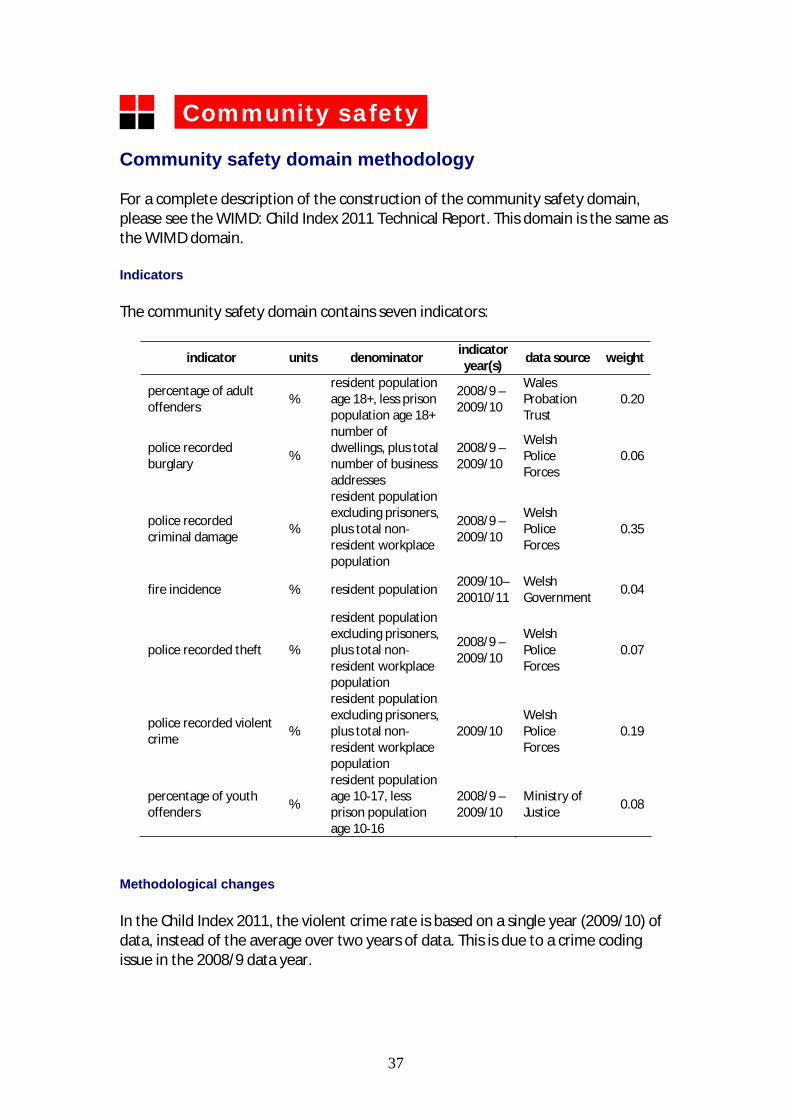
Community safety domain methodology
For a complete description of the construction of the community safety domain,please see the WIMD: Child Index 2011 Technical Report. This domain is the same asthe WIMD domain.
Indicators
The community safety domain contains seven indicators:
indicator units denominatorindicatoryear(s)
data source weight
percentage of adultoffenders
%resident populationage 18+, less prisonpopulation age 18+
2008/9 –2009/10
WalesProbationTrust
0.20
police recordedburglary
%
number ofdwellings, plus totalnumber of businessaddresses
2008/9 –2009/10
WelshPoliceForces
0.06
police recordedcriminal damage
%
resident populationexcluding prisoners,plus total nonresident workplacepopulation
2008/9 –2009/10
WelshPoliceForces
0.35
fire incidence % resident population2009/10–20010/11
WelshGovernment
0.04
police recorded theft %
resident populationexcluding prisoners,plus total nonresident workplacepopulation
2008/9 –2009/10
WelshPoliceForces
0.07
police recorded violentcrime
%
resident populationexcluding prisoners,plus total nonresident workplacepopulation
2009/10WelshPoliceForces
0.19
percentage of youthoffenders
%
resident populationage 10 17, lessprison populationage 10 16
2008/9 –2009/10
Ministry ofJustice
0.08
Methodological changes
In the Child Index 2011, the violent crime rate is based on a single year (2009/10) ofdata, instead of the average over two years of data. This is due to a crime codingissue in the 2008/9 data year.
38
Community safety domain results and analysis
The full set of domain ranks (Child Index 2011) and indicators (WIMD: indicatoranalysis) can be downloaded from the Welsh Government’s StatsWales web pages.The following sub section describes some of the changes occurring to LSOAs in thecommunity safety domain since the Child Index 2008.
The table below shows the number of small areas (LSOAs) in each of the Child Indexdeprivation groups for the Child Index 2008 and 2011. The diagonal, in bold, showsthe number of LSOAs which have remained in the same deprivation group. Abovethe diagonal are the numbers of areas which have moved from a more to a lessdeprived group. Below the diagonal are the numbers of areas which have movedfrom a less to a more deprived group.
community safety domain 201110% mostdeprived
ranks1 190
10 20% mostdeprived
ranks191 380
20 30% mostdeprived
ranks381 570
30 50% mostdeprived ranks
571 950
50% leastdeprived
ranks951 1896
totalranks
1 1896
10% mostdeprived
ranks 1 190141 41 8 0 0 190
10 20% mostdeprived
ranks 191 38033 85 48 24 0 190
20 30% mostdeprived
ranks 381 57013 36 73 65 3 190
30 50% mostdeprived
ranks 571 9503 27 55 201 94 380
50% leastdeprived
ranks 951 18960 1 6 90 849 946
com
mun
ity
safe
tydo
mai
n20
08
totalranks 1 1896 190 190 190 380 946 1896
The table below lists the biggest fallers in the community safety domain, betweenthe Child Index 2008 and 2011. It should be noted that:
no area climbed by more than two deprivation groups;four areas fell by three groups;Abercynon2 (Rhondda Cynon Taf), Cwm 2 and Cwmtillery 1 (both in BlaenauGwent) all fell from the fourth deprivation group (ranks 571 – 950) to themost deprived group (ranks 1 – 190);Grangetown 2, Cardiff, fell from the least deprived group (ranks 951 – 1896)to the second most deprived group (ranks 191 – 380).
39
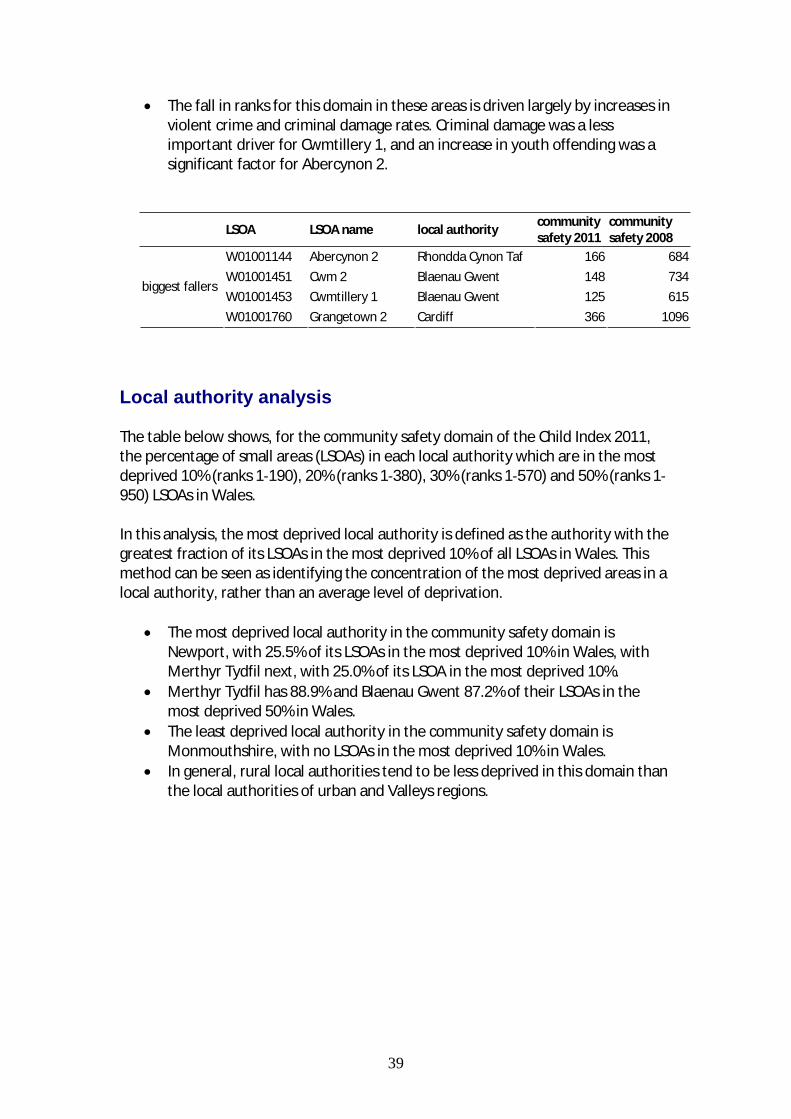
The fall in ranks for this domain in these areas is driven largely by increases inviolent crime and criminal damage rates. Criminal damage was a lessimportant driver for Cwmtillery 1, and an increase in youth offending was asignificant factor for Abercynon 2.
LSOA LSOA name local authoritycommunitysafety 2011
communitysafety 2008
W01001144 Abercynon 2 Rhondda Cynon Taf 166 684
W01001451 Cwm 2 Blaenau Gwent 148 734
W01001453 Cwmtillery 1 Blaenau Gwent 125 615biggest fallers
W01001760 Grangetown 2 Cardiff 366 1096
Local authority analysis
The table below shows, for the community safety domain of the Child Index 2011,the percentage of small areas (LSOAs) in each local authority which are in the mostdeprived 10% (ranks 1 190), 20% (ranks 1 380), 30% (ranks 1 570) and 50% (ranks 1950) LSOAs in Wales.
In this analysis, the most deprived local authority is defined as the authority with thegreatest fraction of its LSOAs in the most deprived 10% of all LSOAs in Wales. Thismethod can be seen as identifying the concentration of the most deprived areas in alocal authority, rather than an average level of deprivation.
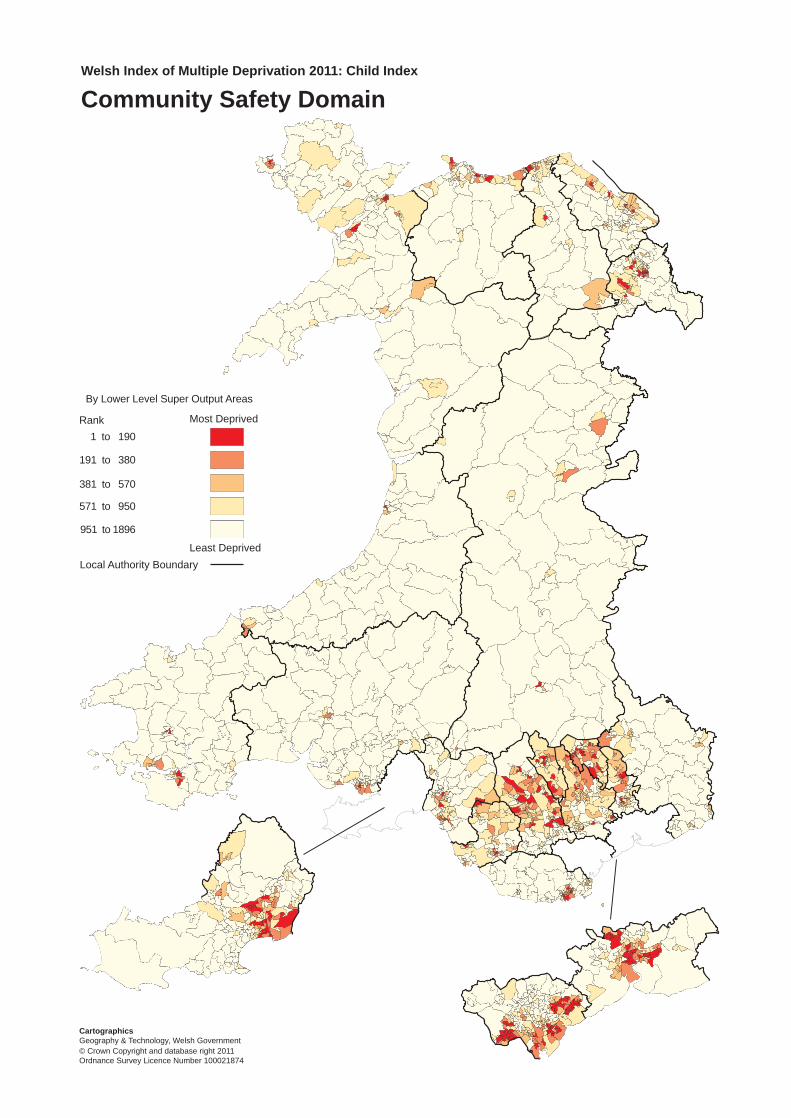
The most deprived local authority in the community safety domain isNewport, with 25.5% of its LSOAs in the most deprived 10% in Wales, withMerthyr Tydfil next, with 25.0% of its LSOA in the most deprived 10%.Merthyr Tydfil has 88.9% and Blaenau Gwent 87.2% of their LSOAs in themost deprived 50% in Wales.The least deprived local authority in the community safety domain isMonmouthshire, with no LSOAs in the most deprived 10% in Wales.In general, rural local authorities tend to be less deprived in this domain thanthe local authorities of urban and Valleys regions.
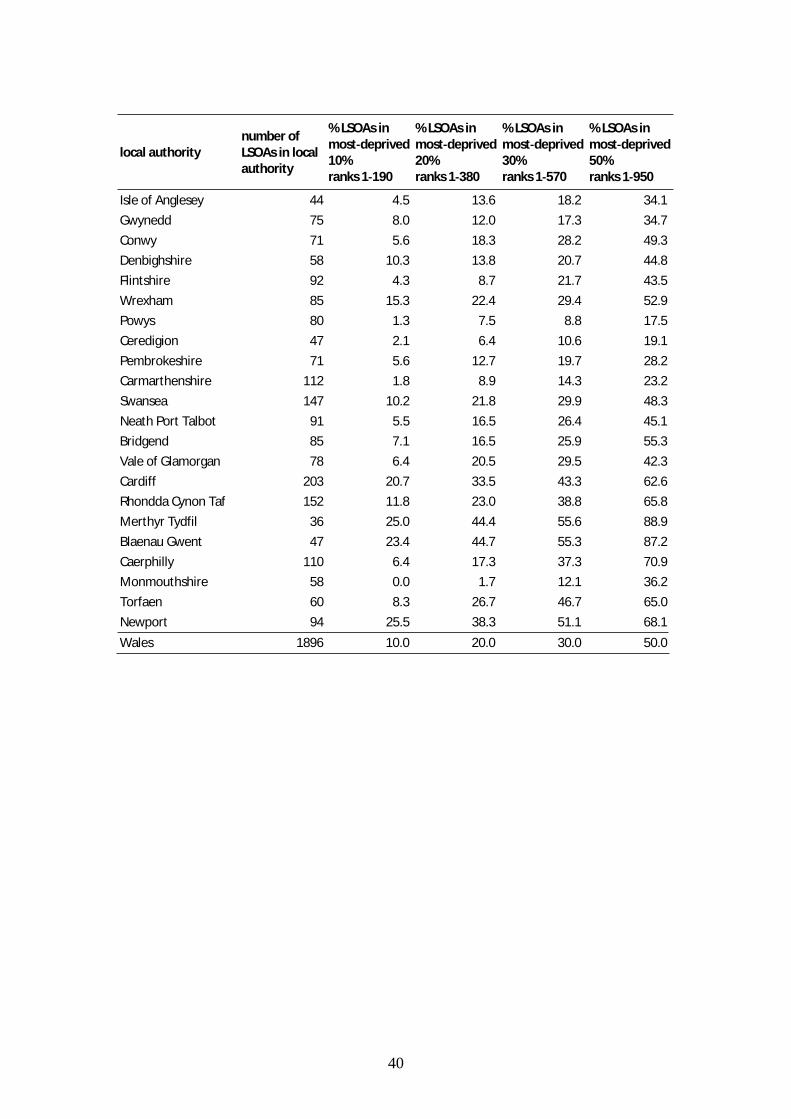
40
local authoritynumber ofLSOAs in localauthority
% LSOAs inmost deprived10%ranks 1 190
% LSOAs inmost deprived20%ranks 1 380
% LSOAs inmost deprived30%ranks 1 570
% LSOAs inmost deprived50%ranks 1 950
Isle of Anglesey 44 4.5 13.6 18.2 34.1
Gwynedd 75 8.0 12.0 17.3 34.7
Conwy 71 5.6 18.3 28.2 49.3
Denbighshire 58 10.3 13.8 20.7 44.8
Flintshire 92 4.3 8.7 21.7 43.5
Wrexham 85 15.3 22.4 29.4 52.9
Powys 80 1.3 7.5 8.8 17.5
Ceredigion 47 2.1 6.4 10.6 19.1
Pembrokeshire 71 5.6 12.7 19.7 28.2
Carmarthenshire 112 1.8 8.9 14.3 23.2
Swansea 147 10.2 21.8 29.9 48.3
Neath Port Talbot 91 5.5 16.5 26.4 45.1
Bridgend 85 7.1 16.5 25.9 55.3
Vale of Glamorgan 78 6.4 20.5 29.5 42.3
Cardiff 203 20.7 33.5 43.3 62.6
Rhondda Cynon Taf 152 11.8 23.0 38.8 65.8
Merthyr Tydfil 36 25.0 44.4 55.6 88.9
Blaenau Gwent 47 23.4 44.7 55.3 87.2
Caerphilly 110 6.4 17.3 37.3 70.9
Monmouthshire 58 0.0 1.7 12.1 36.2
Torfaen 60 8.3 26.7 46.7 65.0
Newport 94 25.5 38.3 51.1 68.1
Wales 1896 10.0 20.0 30.0 50.0
41
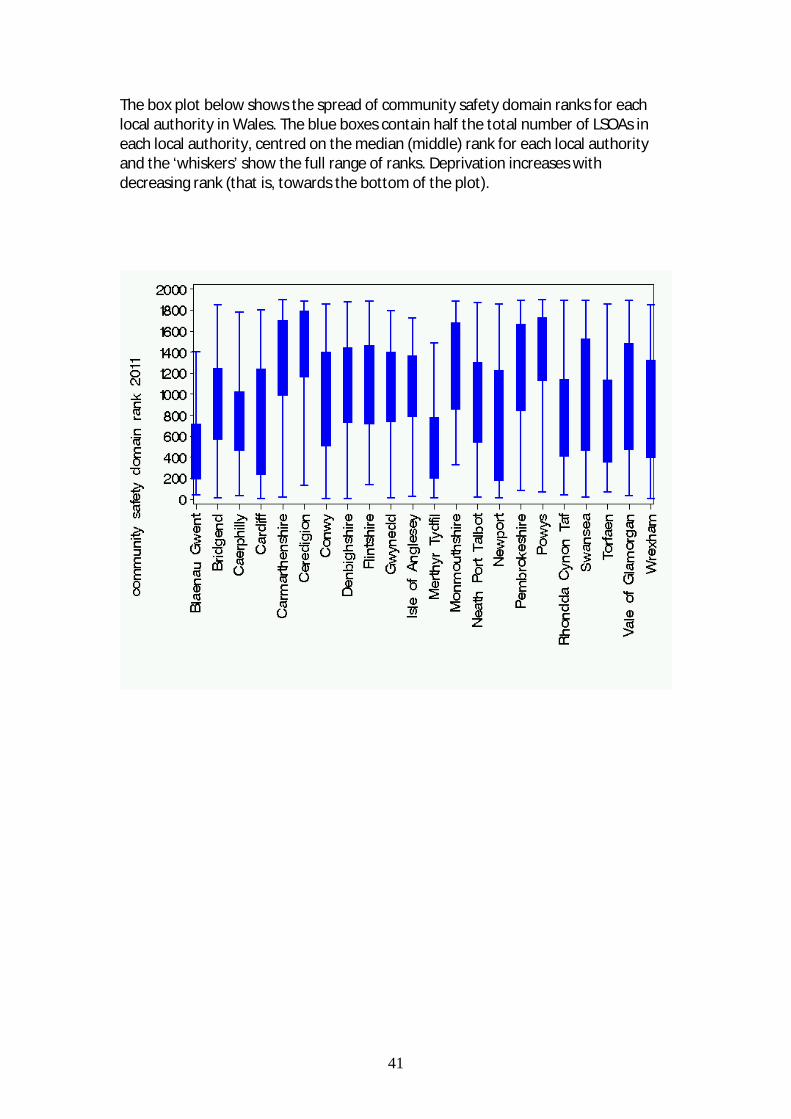
The box plot below shows the spread of community safety domain ranks for eachlocal authority in Wales. The blue boxes contain half the total number of LSOAs ineach local authority, centred on the median (middle) rank for each local authorityand the ‘whiskers’ show the full range of ranks. Deprivation increases withdecreasing rank (that is, towards the bottom of the plot).
Community Safety Domain
191 to 380
381 to 570
951 to 1896
Most Deprived
Least DeprivedLocal Authority Boundary
By Lower Level Super Output Areas
CartographicsGeography & Technology, Welsh Government
Welsh Index of Multiple Deprivation 2011: Child Index
1 to 190
571 to 950
Rank
© Crown Copyright and database right 2011Ordnance Survey Licence Number 100021874
43
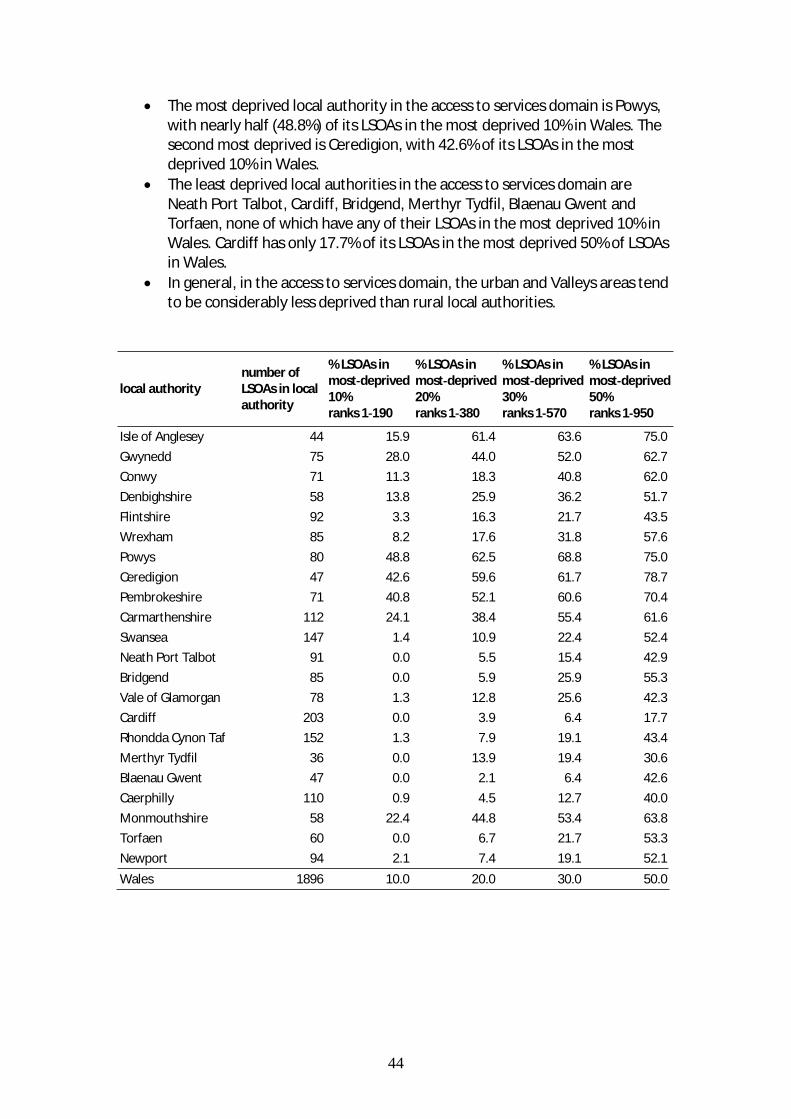
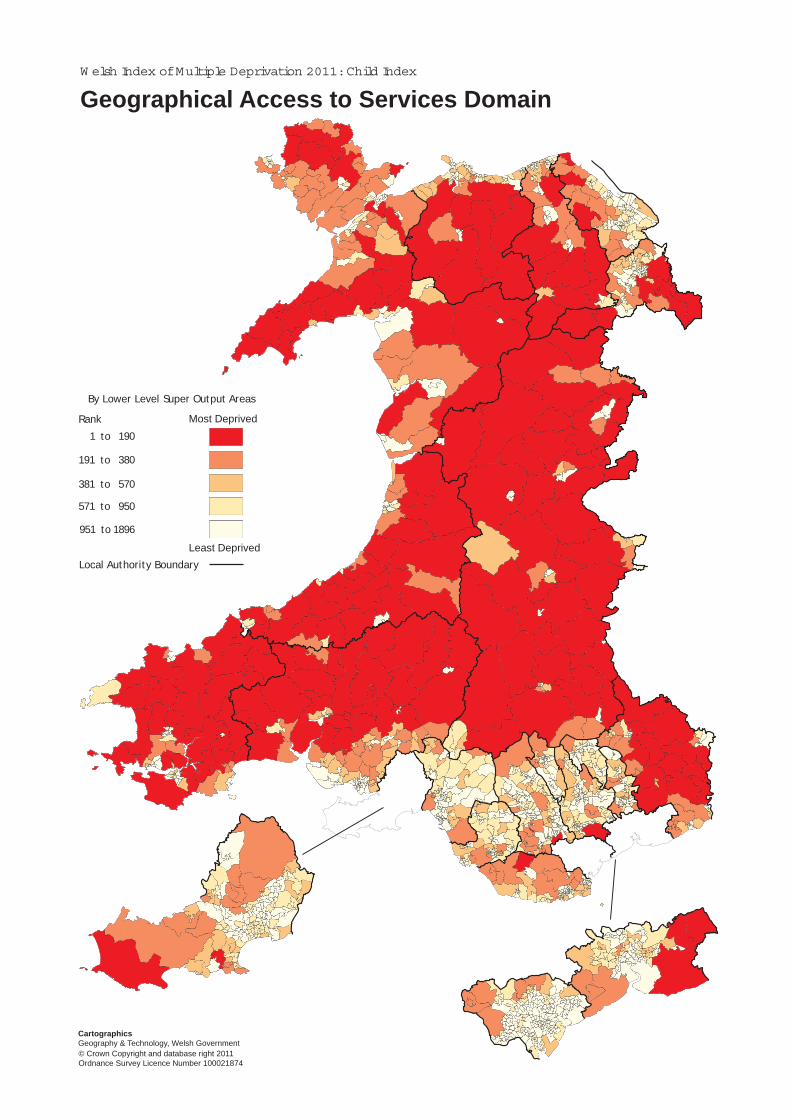
lGeographical access to servicesl
Access to services domain methodology The geographical access to services domain was not updated for the Child Index2011. Therefore, it is exactly the same as the domain in 2008. It has a weight of12.2% in the Child Index.
For a complete description of the construction of the access to services domain,please see the WIMD: Child Index 2011 Technical Report.
Indicators
The access to services domain contains four indicators:
indicator units denominatorindicatoryear(s)
datasource
weight
mean bus + walking journeytime to leisure centre
0.40
mean bus + walking journeytime to library
0.17
mean bus + walking journeytime to primary school
0.17
mean bus + walking journeytime to secondary school
minutesnumber ofjourneys
2008
PublicTransport& RoadNetworkPostalAddressFile,OrdnanceSurvey 0.26
Access to services domain results and analysis
The full set of domain ranks (Child index 2011) and indicators (WIMD: indicatoranalysis) can be downloaded from the Welsh Government’s StatsWales web pages.
Local authority analysis
The table below shows, for the access to services domain of the Child index 2011,the percentage of small areas (LSOAs) in each local authority which are in the mostdeprived 10% (ranks 1 190), 20% (ranks 1 380), 30% (ranks 1 570) and 50% (ranks 1950) LSOAs in Wales.
In this analysis, the most deprived local authority is defined as the authority with thegreatest fraction of its LSOAs in the most deprived 10% of all LSOAs in Wales. Thismethod can be seen as identifying the concentration of the most deprived areas in alocal authority, rather than an average level of deprivation.
44
The most deprived local authority in the access to services domain is Powys,with nearly half (48.8%) of its LSOAs in the most deprived 10% in Wales. Thesecond most deprived is Ceredigion, with 42.6% of its LSOAs in the mostdeprived 10% in Wales.The least deprived local authorities in the access to services domain areNeath Port Talbot, Cardiff, Bridgend, Merthyr Tydfil, Blaenau Gwent andTorfaen, none of which have any of their LSOAs in the most deprived 10% inWales. Cardiff has only 17.7% of its LSOAs in the most deprived 50% of LSOAsin Wales.In general, in the access to services domain, the urban and Valleys areas tendto be considerably less deprived than rural local authorities.
local authoritynumber ofLSOAs in localauthority
% LSOAs inmost deprived10%ranks 1 190
% LSOAs inmost deprived20%ranks 1 380
% LSOAs inmost deprived30%ranks 1 570
% LSOAs inmost deprived50%ranks 1 950
Isle of Anglesey 44 15.9 61.4 63.6 75.0
Gwynedd 75 28.0 44.0 52.0 62.7
Conwy 71 11.3 18.3 40.8 62.0
Denbighshire 58 13.8 25.9 36.2 51.7
Flintshire 92 3.3 16.3 21.7 43.5
Wrexham 85 8.2 17.6 31.8 57.6
Powys 80 48.8 62.5 68.8 75.0
Ceredigion 47 42.6 59.6 61.7 78.7
Pembrokeshire 71 40.8 52.1 60.6 70.4
Carmarthenshire 112 24.1 38.4 55.4 61.6
Swansea 147 1.4 10.9 22.4 52.4
Neath Port Talbot 91 0.0 5.5 15.4 42.9
Bridgend 85 0.0 5.9 25.9 55.3
Vale of Glamorgan 78 1.3 12.8 25.6 42.3
Cardiff 203 0.0 3.9 6.4 17.7
Rhondda Cynon Taf 152 1.3 7.9 19.1 43.4
Merthyr Tydfil 36 0.0 13.9 19.4 30.6
Blaenau Gwent 47 0.0 2.1 6.4 42.6
Caerphilly 110 0.9 4.5 12.7 40.0
Monmouthshire 58 22.4 44.8 53.4 63.8
Torfaen 60 0.0 6.7 21.7 53.3
Newport 94 2.1 7.4 19.1 52.1
Wales 1896 10.0 20.0 30.0 50.0
45
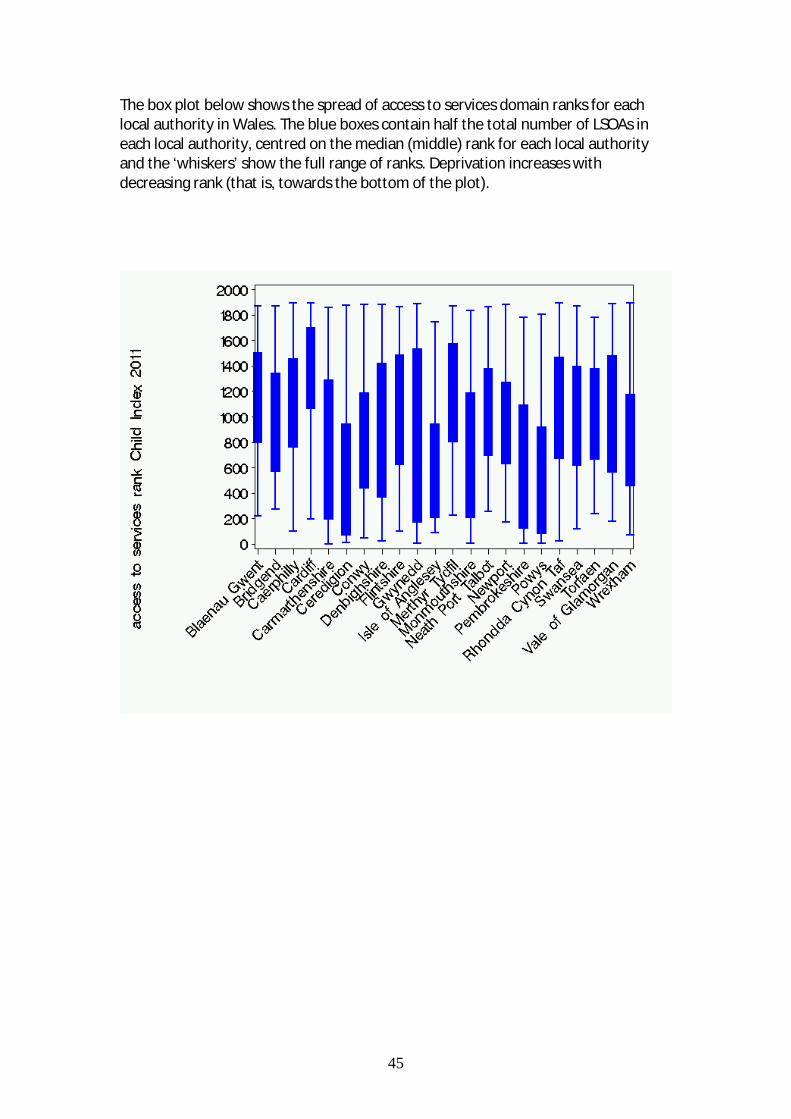
The box plot below shows the spread of access to services domain ranks for eachlocal authority in Wales. The blue boxes contain half the total number of LSOAs ineach local authority, centred on the median (middle) rank for each local authorityand the ‘whiskers’ show the full range of ranks. Deprivation increases withdecreasing rank (that is, towards the bottom of the plot).
Geographical Access to Services Domain
191 to 380
381 to 570
951 to 1896
Most Deprived
Least DeprivedLocal Authority Boundary
By Lower Level Super Output Areas
CartographicsGeography & Technology, Welsh Government
W elsh Index of Multiple Deprivation 2011: Child Index
1 to 190
571 to 950
Rank
© Crown Copyright and database right 2011Ordnance Survey Licence Number 100021874
47
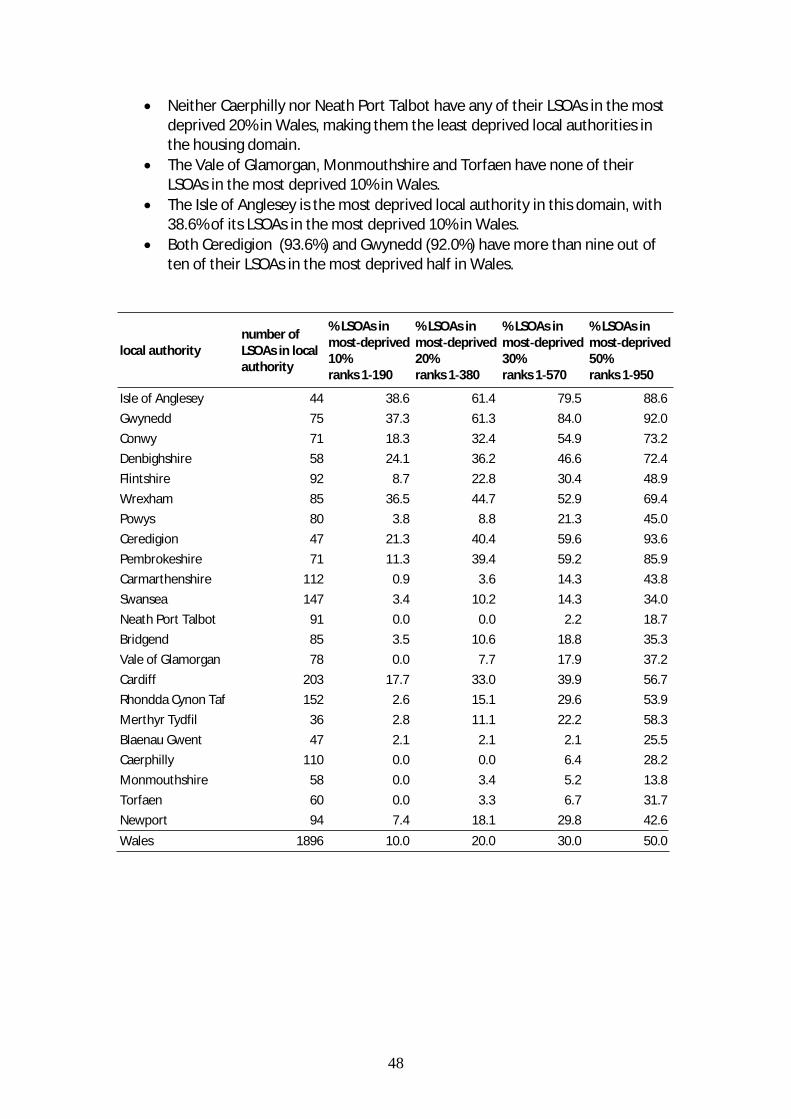
lHousingl
Housing domain methodology
The housing domain has a weight of 6.1% in the Child Index. The housing domainwas not updated for the Child Index 2011. The domain is based on Census data, andnew data were not yet available from Census 2011. The domain remains exactly thesame as in the Child Index 2008 and 2005. Caution is therefore advised, as changesto the housing stock are likely to have taken place over the last ten years, and theimpact of this on the housing domain will not be established until the Census 2011data are released.
For a complete description of the construction of the housing domain, please see theWIMD: Child Index 2011 Technical Report.
Indicators
The housing domain contains two indicators:
indicator units denominatorindicatoryear(s)
data source weight
percentage of children livingin households with no centralheating
% 0.5
percentage of children livingin overcrowded households
%
LSOA populationaged 0 – 18 years old
2001 Census, ONS
0.5
Housing domain results and analysis
The full set of domain ranks (Child Index 2011) and indicators (WIMD: indicatoranalysis) can be downloaded from the Welsh Government’s StatsWales web pages.
Local authority analysis
The table below shows, for the housing domain of the Child Index 2011, thepercentage of small areas (LSOAs) in each local authority which are in the mostdeprived 10% (ranks 1 190), 20% (ranks 1 380), 30% (ranks 1 570) and 50% (ranks 1950) LSOAs in Wales.
In this analysis, the most deprived local authority is defined as the authority with thegreatest fraction of its LSOAs in the most deprived 10% of all LSOAs in Wales. Thismethod can be seen as identifying the concentration of the most deprived areas in alocal authority, rather than an average level of deprivation.
48
Neither Caerphilly nor Neath Port Talbot have any of their LSOAs in the mostdeprived 20% in Wales, making them the least deprived local authorities inthe housing domain.The Vale of Glamorgan, Monmouthshire and Torfaen have none of theirLSOAs in the most deprived 10% in Wales.The Isle of Anglesey is the most deprived local authority in this domain, with38.6% of its LSOAs in the most deprived 10% in Wales.Both Ceredigion (93.6%) and Gwynedd (92.0%) have more than nine out often of their LSOAs in the most deprived half in Wales.
local authoritynumber ofLSOAs in localauthority
% LSOAs inmost deprived10%ranks 1 190
% LSOAs inmost deprived20%ranks 1 380
% LSOAs inmost deprived30%ranks 1 570
% LSOAs inmost deprived50%ranks 1 950
Isle of Anglesey 44 38.6 61.4 79.5 88.6
Gwynedd 75 37.3 61.3 84.0 92.0
Conwy 71 18.3 32.4 54.9 73.2
Denbighshire 58 24.1 36.2 46.6 72.4
Flintshire 92 8.7 22.8 30.4 48.9
Wrexham 85 36.5 44.7 52.9 69.4
Powys 80 3.8 8.8 21.3 45.0
Ceredigion 47 21.3 40.4 59.6 93.6
Pembrokeshire 71 11.3 39.4 59.2 85.9
Carmarthenshire 112 0.9 3.6 14.3 43.8
Swansea 147 3.4 10.2 14.3 34.0
Neath Port Talbot 91 0.0 0.0 2.2 18.7
Bridgend 85 3.5 10.6 18.8 35.3
Vale of Glamorgan 78 0.0 7.7 17.9 37.2
Cardiff 203 17.7 33.0 39.9 56.7
Rhondda Cynon Taf 152 2.6 15.1 29.6 53.9
Merthyr Tydfil 36 2.8 11.1 22.2 58.3
Blaenau Gwent 47 2.1 2.1 2.1 25.5
Caerphilly 110 0.0 0.0 6.4 28.2
Monmouthshire 58 0.0 3.4 5.2 13.8
Torfaen 60 0.0 3.3 6.7 31.7
Newport 94 7.4 18.1 29.8 42.6
Wales 1896 10.0 20.0 30.0 50.0
49
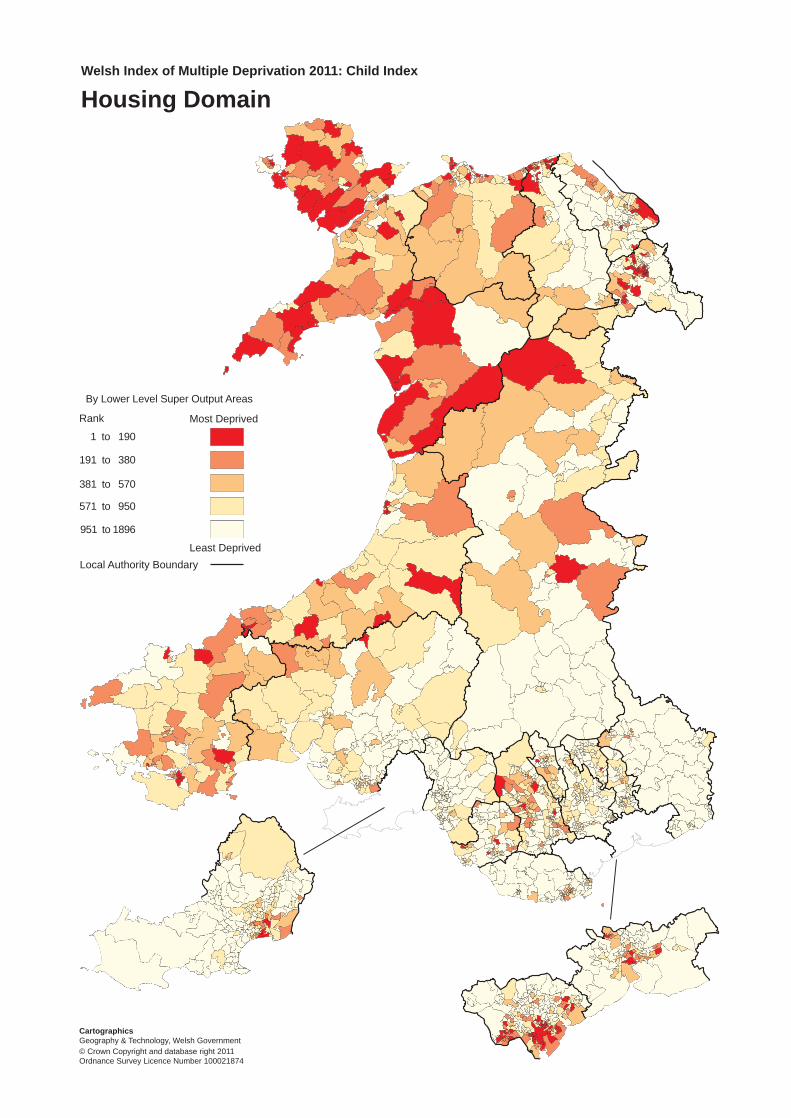
The box plot below shows the spread of housing domain ranks for each localauthority in Wales. The blue boxes contain half the total number of LSOAs in eachlocal authority, centred on the median (middle) rank for each local authority and the‘whiskers’ show the full range of ranks. Deprivation increases with decreasing rank(that is, towards the bottom of the plot).
Housing Domain
191 to 380
381 to 570
951 to 1896
Most Deprived
Least DeprivedLocal Authority Boundary
By Lower Level Super Output Areas
CartographicsGeography & Technology, Welsh Government
Welsh Index of Multiple Deprivation 2011: Child Index
1 to 190
571 to 950
Rank
© Crown Copyright and database right 2011Ordnance Survey Licence Number 100021874
51
lPhysical environmentl
Physical environment domain methodology
The physical environment domain has a weight of 6.1% in the Child Index. For acomplete description of the construction of the physical environment domain,please see the WIMD: Child index 2011 Technical Report. This domain is the same asthe WIMD domain.
Indicators
The physical environment domain contains four indicators:
indicator unitsindicator
yeardata source weight
air emissions score 2008 Environment Agency 0.17
air quality score 2008 Environment Agency 0.17
flood risk score 2009 Environment Agency 0.33proximity to wastedisposal andindustrial sites
score 2010 Environment Agency 0.33
All the indicators were updated for the Child Index 2011.
Methodological changes
The methodology used to create the indicators of the physical environment domainis the same for the Child Index 2011 as it was in 2008. However, there have beensome improvements to the air emissions mapping, and the flood risk mapping.
Changes in flood risk between the Child Index 2008 and 2011 are largely due to theimproved flood risk mapping. Although over 4,500 properties in Wales havebenefited from reduced flood risk due to capital improvement and maintenanceschemes since April 2005, half of these were in the last three years, and so not all ofthem will be included in the 2009 flood risk data used in the Child Index 2011.
Physical environment domain results and analysis
The full set of domain ranks (Child Index 2011) and indicators (WIMD: indicatoranalysis) can be downloaded from the Welsh Government’s StatsWales web pages.The following sub section describes some of the changes occurring to LSOAs in thephysical environment domain since the Child Index 2008.
The table below shows the number of small areas (LSOAs) in each of the Child Indexdeprivation groups for 2008 and 2011. The diagonal, in bold, shows the number of
52
LSOAs which have remained in the same deprivation group. Above the diagonal arethe numbers of areas which have moved from a more to a less deprived group.Below the diagonal are the numbers of areas which have moved from a less to amore deprived group.
physical environment domain 201110% mostdeprived
ranks1 190
10 20% mostdeprived
ranks191 380
20 30% mostdeprived
ranks381 570
30 50% mostdeprived ranks
571 950
50% leastdeprived
ranks951 1896
totalranks
1 1896
10% mostdeprived
ranks 1 190113 48 14 14 1 190
10 20% mostdeprived
ranks 191 38045 50 37 43 15 190
20 30% mostdeprived
ranks 381 57014 38 42 67 29 190
30 50% mostdeprived
ranks 571 95014 37 59 126 144 380
50% leastdeprived
ranks 951 18964 17 38 130 757 946
phys
ical
envi
ronm
entd
omai
n20
08
totalranks 1 1896 190 190 190 380 946 1896
The table below lists the biggest climbers and fallers in the physical environmentdomain, between the Child Index 2008 and 2011.
W01000734, Tyisha 3 in Carmarthenshire, has fallen 955 ranks. Thismovement is largely driven by a decrease in air quality, and an increase in theflood risk indicator due to improved flood risk mapping.The fall from the least to the most deprived group by W01001422, St James 4in Caerphilly, and W01000925, Glynneath 1, Neath Port Talbot, has beendriven by a decrease in air quality. Glynneath 1 has also had a significantincrease in its proximity to waste or industrial sites score.W01001087, Dinas Powys 2, Vale of Glamorgan, has seen significantlyworsening air emissions since WIMD 2008, which has driven its fall to join themost deprived group.W01001037, Oldcastle 3, Bridgend, has improved air quality, and a reducedrisk of flood compared with WIMD 2008.A few LSOAs have moved relative to other LSOAs within the proximity toregulated (waste and industrial) sites. This is either because a site has ceasedto operate, or the site has moved from one OPRA band to another due to achange in environmental performance.

53
LSOA LSOA name local authorityphysical
environment2011
physicalenvironment
2008W01000734 Tyisha 3 Carmarthenshire 40 995
W01000925 Glynneath 1 Neath Port Talbot 106 1193
W01001087 Dinas Powys 2Vale ofGlamorgan
85 1099biggestfallers
W01001422 St James 4 Caerphilly 185 1223highestclimbers
W01001037 Oldcastle 3 Bridgend 1066 166
Local authority analysis
The table below shows, for the physical environment domain of the Child Index2011, the percentage of small areas (LSOAs) in each local authority which are in themost deprived 10% (ranks 1 190), 20% (ranks 1 380), 30% (ranks 1 570) and 50%(ranks 1 950) LSOAs in Wales.
In this analysis, the most deprived local authority is defined as the authority with thegreatest fraction of its LSOAs in the most deprived 10% of all LSOAs in Wales. Thismethod can be seen as identifying the concentration of the most deprived areas in alocal authority, rather than an average level of deprivation.
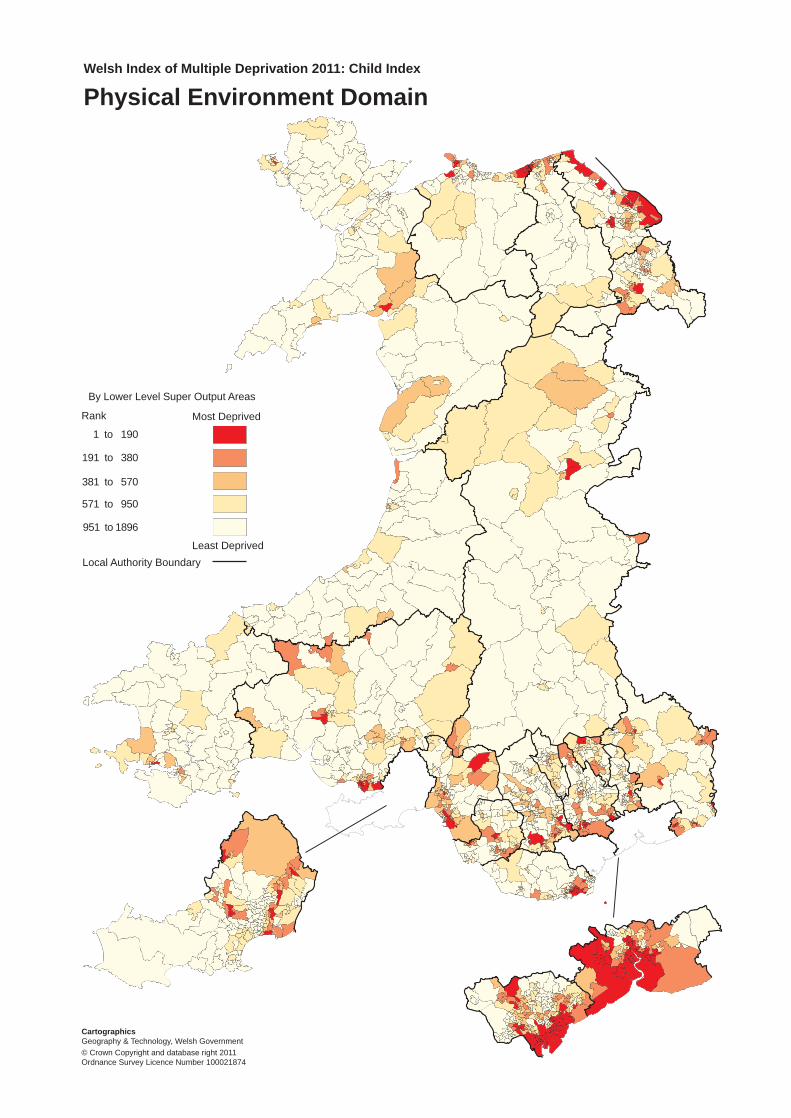
The most deprived local authority in the physical environment domain isNewport, with 43.6% of its LSOAs in the most deprived 10% in Wales. This isdriven by Newport’s poor air quality, and proximity to waste and industrialsites.This is almost twice as high as the next most deprived local authority,Flintshire, with 23.9% of its LSOAs in the most deprived 10% in Wales. ManyFlintshire residents live in proximity to waste or industrial sites.The least deprived local authorities in the physical environment domain areCeredigion and Merthyr Tydfil, with none of their LSOAs in the most deprived10% in Wales.Newport also has the highest percentage of its LSOAs in the most deprived50% of LSOAs in Wales (86.2%), followed by Cardiff (69.0%).The Isle of Anglesey has only 27.3% of its LSOAs in the most deprived half ofWelsh LSOAs, and Ceredigion only 29.8%.
54
local authoritynumber ofLSOAs in localauthority
% LSOAs inmost deprived10%ranks 1 190
% LSOAs inmost deprived20%ranks 1 380
% LSOAs inmost deprived30%ranks 1 570
% LSOAs inmost deprived50%ranks 1 950
Isle of Anglesey 44 2.3 2.3 4.5 27.3Gwynedd 75 1.3 2.7 12.0 29.3Conwy 71 12.7 21.1 29.6 46.5Denbighshire 58 5.2 22.4 31.0 39.7Flintshire 92 23.9 30.4 42.4 59.8Wrexham 85 1.2 15.3 23.5 36.5Powys 80 2.5 7.5 13.8 38.8Ceredigion 47 0.0 4.3 10.6 29.8Pembrokeshire 71 2.8 4.2 12.7 26.8Carmarthenshire 112 9.8 19.6 33.0 54.5Swansea 147 4.8 15.6 23.8 45.6Neath Port Talbot 91 8.8 20.9 36.3 63.7Bridgend 85 3.5 18.8 29.4 47.1Vale of Glamorgan 78 14.1 25.6 29.5 42.3Cardiff 203 21.7 32.5 46.8 69.0Rhondda Cynon Taf 152 3.3 10.5 23.0 43.4Merthyr Tydfil 36 0.0 2.8 13.9 41.7Blaenau Gwent 47 8.2 22.7 30.0 49.1Caerphilly 110 4.3 12.8 23.4 59.6Monmouthshire 58 1.7 8.3 21.7 43.3Torfaen 60 12.1 27.6 39.7 67.2Newport 94 43.6 64.9 71.3 86.2Wales 1896 10.0 20.0 30.0 50.0
55
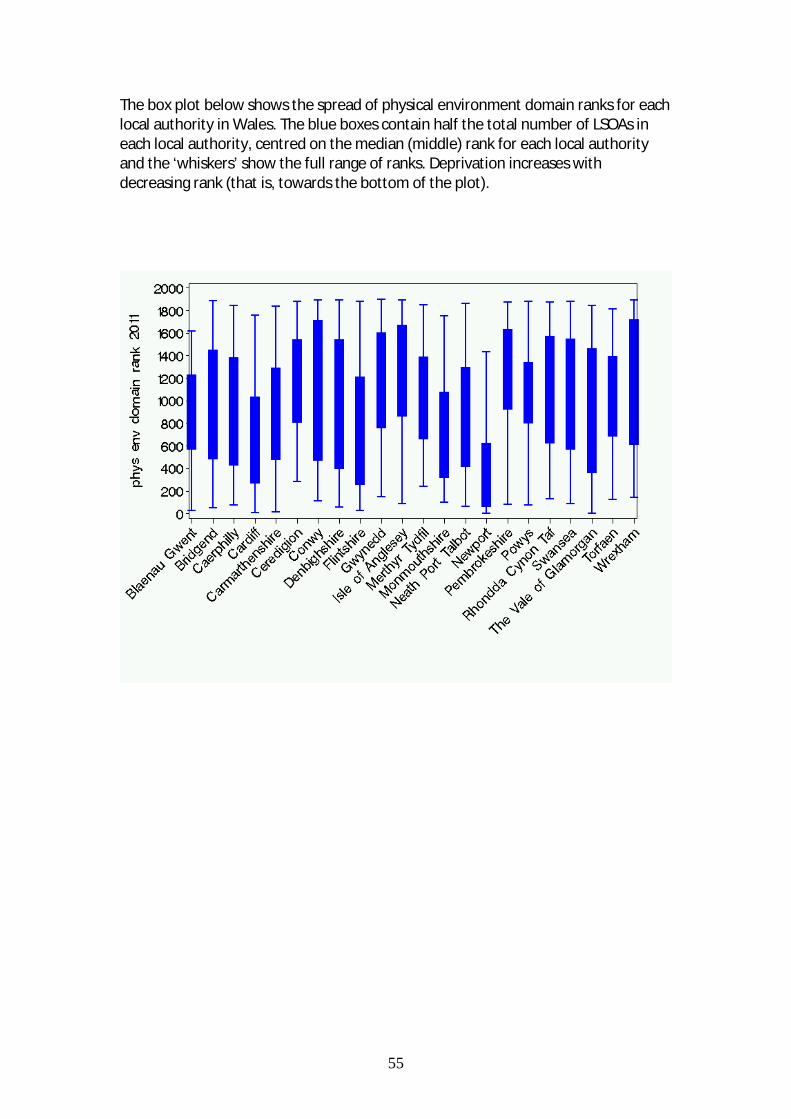
The box plot below shows the spread of physical environment domain ranks for eachlocal authority in Wales. The blue boxes contain half the total number of LSOAs ineach local authority, centred on the median (middle) rank for each local authorityand the ‘whiskers’ show the full range of ranks. Deprivation increases withdecreasing rank (that is, towards the bottom of the plot).
Physical Environment Domain
191 to 380
381 to 570
951 to 1896
Most Deprived
Least DeprivedLocal Authority Boundary
By Lower Level Super Output Areas
CartographicsGeography & Technology, Welsh Government
Welsh Index of Multiple Deprivation 2011: Child Index
1 to 190
571 to 950
Rank
© Crown Copyright and database right 2011Ordnance Survey Licence Number 100021874
57
lAnnex A: the indicatorsl
This section contains:
table A1, a description of the indicators of the Welsh Index of MultipleDeprivation: Child Index 2011; andtable A2, a list of the geographical and non geographical aggregations of theindicator data available on the Welsh Government’s StatsWales web pages.
Table A1: the indicators for the Welsh index of Multiple Deprivation: Child Index 2011. Indicatorswhich have been updated in this publication are in bold.
domain indicator units denominatorindicatoryear(s)
data source
mean bus + walking journeytime to leisure centre
minutesnumber ofjourneys
2008
mean bus + walking journeytime to library
minutesnumber ofjourneys
2008
mean bus + walking journeytime to primary school
minutesnumber ofjourneys
2008
geographicalaccess toservices
mean bus + walking journeytime to secondary school
minutesnumber ofjourneys
2008
PublicTransport &RoadNetworkPostalAddress File,OrdnanceSurvey
percentage of adult offenders %
residentpopulationage 18+, lessprisonpopulationage 18+
2008/9 –2009/10
WalesProbationTrust
police recorded burglary %
number ofdwellings,plus totalnumber ofbusinessaddresses
2008/9 –2009/10
Welsh PoliceForces
police recorded criminaldamage
%
residentpopulationexcludingprisoners,plus totalnon residentworkplacepopulation
2008/9 –2009/10
Welsh PoliceForces
fire incidence %residentpopulation
2009/10–20010/11
WelshGovernment
communitysafety
police recorded theft %
residentpopulationexcludingprisoners,plus totalnon residentworkplacepopulation
2008/9 –2009/10
Welsh PoliceForces
58
police recorded violent crime %
residentpopulationexcludingprisoners,plus totalnon residentworkplacepopulation
2009/10Welsh PoliceForces
percentage of youthoffenders
%
residentpopulationage 10 17,less prisonpopulationage 10 16
2008/9 –2009/10
Ministry ofJustice
Key Stage 2 average pointscores
pointscore
number ofKS2 pupils
2008 10
Key Stage 3 average pointscores
pointscore
number ofKS3 pupils
2008 10
Key Stage 4 average pointscores
Pointscore
number ofKS4 pupils
2009 10
percentage primary schoolhalf day absence
%
number ofhalf dayschoolsessions
2008/92009/10
education
percentage secondary schoolhalf day absence
%
number ofhalf dayschoolsessions
2008/92009/10
NationalPupilDatabase /Pupil LevelAnnualSchoolCensus /NationalDataCollection
air emissions score 2008EnvironmentAgency
air quality score 2008EnvironmentAgency
flood risk score 2009EnvironmentAgency
physicalenvironment
proximity to waste disposaland industrial sites
score 2010EnvironmentAgency
percentage of live singlebirths < 2.5kg
%number oflive singlebirths
20002009
ONS
healthlimiting long term illness(children)
numberper100,000
LSOApopulationaged 0 – 18years old
2001 Census, ONS
percentage of children livingin households with no centralheating
% 2001 Census, ONS
housingpercentage of children livingin overcrowded households
%
LSOApopulationaged 0 – 18years old 2001 Census, ONS
children in income relatedbenefits households
% 2009/10 DWP
incomechildren in householdsreceiving Tax Credits withincome less than 60% of theWales median
%
LSOApopulationaged 0 – 18years 2009/10 HMRC
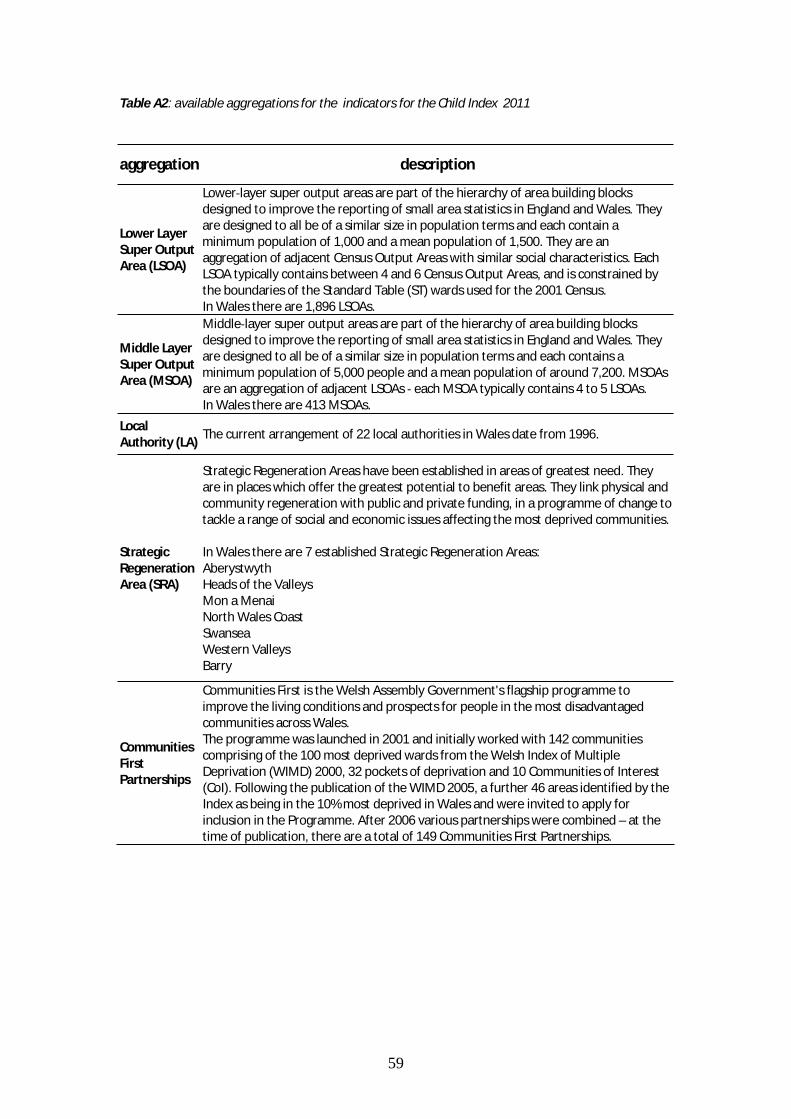
59
Table A2: available aggregations for the indicators for the Child Index 2011
aggregation description
Lower LayerSuper OutputArea (LSOA)
Lower layer super output areas are part of the hierarchy of area building blocksdesigned to improve the reporting of small area statistics in England and Wales. Theyare designed to all be of a similar size in population terms and each contain aminimum population of 1,000 and a mean population of 1,500. They are anaggregation of adjacent Census Output Areas with similar social characteristics. EachLSOA typically contains between 4 and 6 Census Output Areas, and is constrained bythe boundaries of the Standard Table (ST) wards used for the 2001 Census.In Wales there are 1,896 LSOAs.
Middle LayerSuper OutputArea (MSOA)
Middle layer super output areas are part of the hierarchy of area building blocksdesigned to improve the reporting of small area statistics in England and Wales. Theyare designed to all be of a similar size in population terms and each contains aminimum population of 5,000 people and a mean population of around 7,200. MSOAsare an aggregation of adjacent LSOAs each MSOA typically contains 4 to 5 LSOAs.In Wales there are 413 MSOAs.
LocalAuthority (LA)
The current arrangement of 22 local authorities in Wales date from 1996.
StrategicRegenerationArea (SRA)
Strategic Regeneration Areas have been established in areas of greatest need. Theyare in places which offer the greatest potential to benefit areas. They link physical andcommunity regeneration with public and private funding, in a programme of change totackle a range of social and economic issues affecting the most deprived communities.
In Wales there are 7 established Strategic Regeneration Areas:AberystwythHeads of the ValleysMon a MenaiNorth Wales CoastSwanseaWestern ValleysBarry
CommunitiesFirstPartnerships
Communities First is the Welsh Assembly Government's flagship programme toimprove the living conditions and prospects for people in the most disadvantagedcommunities across Wales.The programme was launched in 2001 and initially worked with 142 communitiescomprising of the 100 most deprived wards from the Welsh Index of MultipleDeprivation (WIMD) 2000, 32 pockets of deprivation and 10 Communities of Interest(CoI). Following the publication of the WIMD 2005, a further 46 areas identified by theIndex as being in the 10% most deprived in Wales and were invited to apply forinclusion in the Programme. After 2006 various partnerships were combined – at thetime of publication, there are a total of 149 Communities First Partnerships.
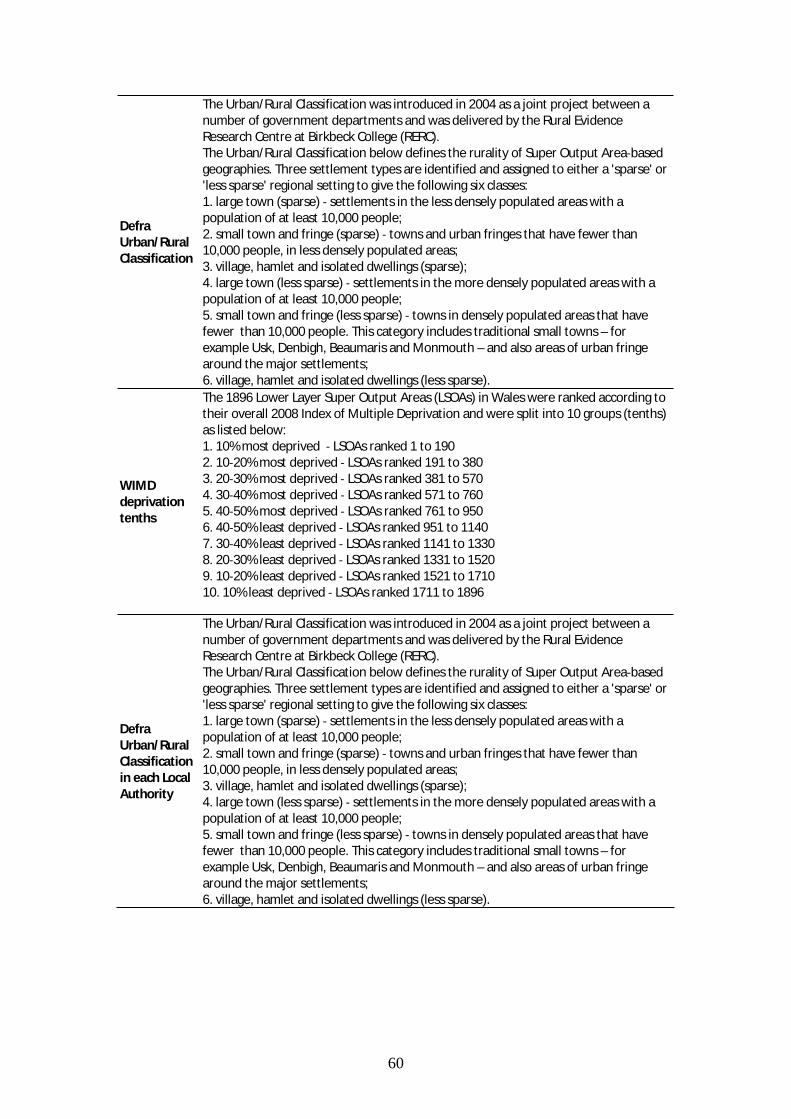
60
DefraUrban/RuralClassification
The Urban/Rural Classification was introduced in 2004 as a joint project between anumber of government departments and was delivered by the Rural EvidenceResearch Centre at Birkbeck College (RERC).The Urban/Rural Classification below defines the rurality of Super Output Area basedgeographies. Three settlement types are identified and assigned to either a 'sparse' or'less sparse' regional setting to give the following six classes:1. large town (sparse) settlements in the less densely populated areas with apopulation of at least 10,000 people;2. small town and fringe (sparse) towns and urban fringes that have fewer than10,000 people, in less densely populated areas;3. village, hamlet and isolated dwellings (sparse);4. large town (less sparse) settlements in the more densely populated areas with apopulation of at least 10,000 people;5. small town and fringe (less sparse) towns in densely populated areas that havefewer than 10,000 people. This category includes traditional small towns – forexample Usk, Denbigh, Beaumaris and Monmouth – and also areas of urban fringearound the major settlements;6. village, hamlet and isolated dwellings (less sparse).
WIMDdeprivationtenths
The 1896 Lower Layer Super Output Areas (LSOAs) in Wales were ranked according totheir overall 2008 Index of Multiple Deprivation and were split into 10 groups (tenths)as listed below:1. 10% most deprived LSOAs ranked 1 to 1902. 10 20% most deprived LSOAs ranked 191 to 3803. 20 30% most deprived LSOAs ranked 381 to 5704. 30 40% most deprived LSOAs ranked 571 to 7605. 40 50% most deprived LSOAs ranked 761 to 9506. 40 50% least deprived LSOAs ranked 951 to 11407. 30 40% least deprived LSOAs ranked 1141 to 13308. 20 30% least deprived LSOAs ranked 1331 to 15209. 10 20% least deprived LSOAs ranked 1521 to 171010. 10% least deprived LSOAs ranked 1711 to 1896
DefraUrban/RuralClassificationin each LocalAuthority
The Urban/Rural Classification was introduced in 2004 as a joint project between anumber of government departments and was delivered by the Rural EvidenceResearch Centre at Birkbeck College (RERC).The Urban/Rural Classification below defines the rurality of Super Output Area basedgeographies. Three settlement types are identified and assigned to either a 'sparse' or'less sparse' regional setting to give the following six classes:1. large town (sparse) settlements in the less densely populated areas with apopulation of at least 10,000 people;2. small town and fringe (sparse) towns and urban fringes that have fewer than10,000 people, in less densely populated areas;3. village, hamlet and isolated dwellings (sparse);4. large town (less sparse) settlements in the more densely populated areas with apopulation of at least 10,000 people;5. small town and fringe (less sparse) towns in densely populated areas that havefewer than 10,000 people. This category includes traditional small towns – forexample Usk, Denbigh, Beaumaris and Monmouth – and also areas of urban fringearound the major settlements;6. village, hamlet and isolated dwellings (less sparse).
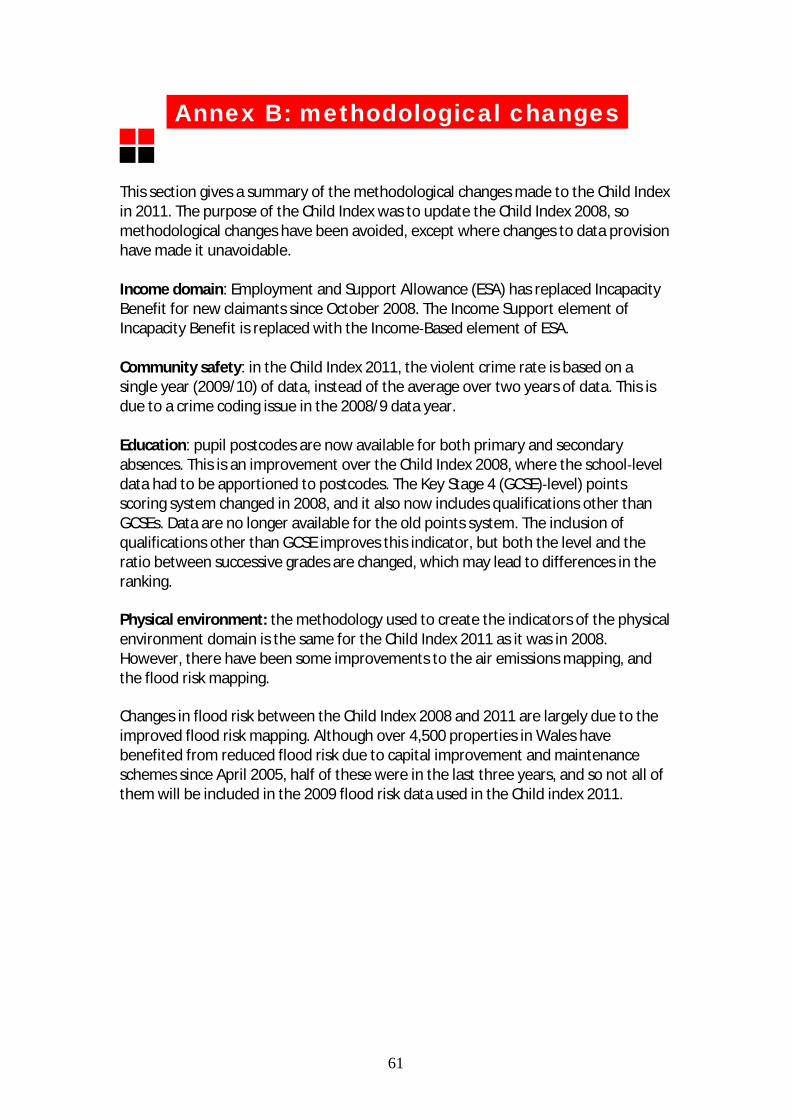
61
lAnnex B: methodological changesl
This section gives a summary of the methodological changes made to the Child Indexin 2011. The purpose of the Child Index was to update the Child Index 2008, somethodological changes have been avoided, except where changes to data provisionhave made it unavoidable.
Income domain: Employment and Support Allowance (ESA) has replaced IncapacityBenefit for new claimants since October 2008. The Income Support element ofIncapacity Benefit is replaced with the Income Based element of ESA.
Community safety: in the Child Index 2011, the violent crime rate is based on asingle year (2009/10) of data, instead of the average over two years of data. This isdue to a crime coding issue in the 2008/9 data year.
Education: pupil postcodes are now available for both primary and secondaryabsences. This is an improvement over the Child Index 2008, where the school leveldata had to be apportioned to postcodes. The Key Stage 4 (GCSE) level) pointsscoring system changed in 2008, and it also now includes qualifications other thanGCSEs. Data are no longer available for the old points system. The inclusion ofqualifications other than GCSE improves this indicator, but both the level and theratio between successive grades are changed, which may lead to differences in theranking.
Physical environment: the methodology used to create the indicators of the physicalenvironment domain is the same for the Child Index 2011 as it was in 2008.However, there have been some improvements to the air emissions mapping, andthe flood risk mapping.
Changes in flood risk between the Child Index 2008 and 2011 are largely due to theimproved flood risk mapping. Although over 4,500 properties in Wales havebenefited from reduced flood risk due to capital improvement and maintenanceschemes since April 2005, half of these were in the last three years, and so not all ofthem will be included in the 2009 flood risk data used in the Child index 2011.
62
lAnnex C: uses and usersl
The Index and the Child Index are used extensively across the Welsh Government toinform policy and programmes focussed on deprivation and poverty. They are usedwidely by local authorities, other public bodies, the voluntary sector, and also byacademics and students, in the private sector. Below are some examples of the usesof the Index and the Child Index. The list is not exhaustive.
Welsh Government
The Index was used to identify areas for Communities First Programme, theflagship deprivation programme of the Welsh Government. The Index, itsdomains and indicators are used in understanding deprivation in these areas.The education domain is used to provide a deprivation uplift for fundingallocations within the National Planning and Funding System. The fundingmodel applies the uplift to provision undertaken by learners residing in areasthat are in the most deprived 30% of areas in the educational domain of theIndex.The ‘Flying Start’ program focuses on 0 – 3 year olds, and aims to improveoutcomes for disadvantaged children. Both the Index and, more recently, theChild Index have been used in identifying areas in which to put Flying Startservices.The Index, with the health domain removed, has been used to assess healthgain targets across different levels of deprivation.The Index is used in the creation of indicators used to monitor inequalities aspart of the Welsh Government’s Child Poverty Strategy.The Index, its domains and indicators are used to identify and understanddeprivation in the Welsh Government’s Strategic Regeneration Areas.Prior to 2009/10, a small percentage of Standard Spending Assessments wasallocated on the basis of the Index.
Local Government
Local authorities and their partners find the Index a useful tool for targeting localresources and supporting funding bids. It is also useful in developing anunderstanding of their local areas and helping highlight issues and particular areaswhich need more study to fully identify local needs. The following is a list of some ofthe local government activities where the Index or Child Index has been used:
needs assessments for health, social care & wellbeing; Children & YoungPeople's Partnership and Community Safety Partnership (Cardiff CC);housing renewal initiatives;adult services commissioning;local profiles, funding bids (Ceredigion CC);

63
identifying priority areas, framing discussions on deprivation (Flintshire CC);research and information in all its forms (City & County of Swansea);producing a poverty profile of Swansea, providing detailed info on childpoverty to members / senior managers (City & County of Swansea);comparison of areas – used in deciding Flying Start areas etc.(Carmarthenshire CC);data requests and funding bids (Torfaen CBC);area profiles, deprivation analysis for children and young people (City &County of Swansea);ward profiles, illustration of small levels of deprivation, funding bids ( NeathPort Talbot CC);Welsh Local Government Association and health improvement work –concentrating policy efforts on areas of greatest deprivation; andfunding bids & needs assessments (Monmouthshire CC).
Other public bodies
The regulator OFWAT has used the index for looking at the relationshipbetween deprivation and levels of debt.The Lottery Fund has used the Index to allocate funds to deprived areas.The Index has been used to support bids for European funding, targeting localservices and in analysis of the links between localised deprivation and variousproblems including health issues.The Index has been used for public health research, assisting theunderstanding of wider social and environmental determinants of health andillness.Chief Medical Officer uses the Index in his Annual Reports on health in Wales.The Index is used by the Welsh Police Forces to plan neighbourhood policeresourcing.The National Public Health Service for Wales uses the Index for populationprofiles, used to look at the health and well being of defined populations.The Wales European Funding Office uses the Index when assessing projectapplications.Mid and West Wales Fire and Rescue Services use the Index for planning.
Voluntary sector
The End Child Poverty Network Cymru group uses the Child Index to highlightdeprivation in Wales, and intend to use it as an effective mechanism at a locallevel as guidance for Children and Young People’s Partnerships in thedevelopment of Single Plans.Catch 22, a charity focussed on young adults, uses the Index to supportfunding bids, choosing localities to focus work in, and much more.The National Day Nurseries Association uses the Index.
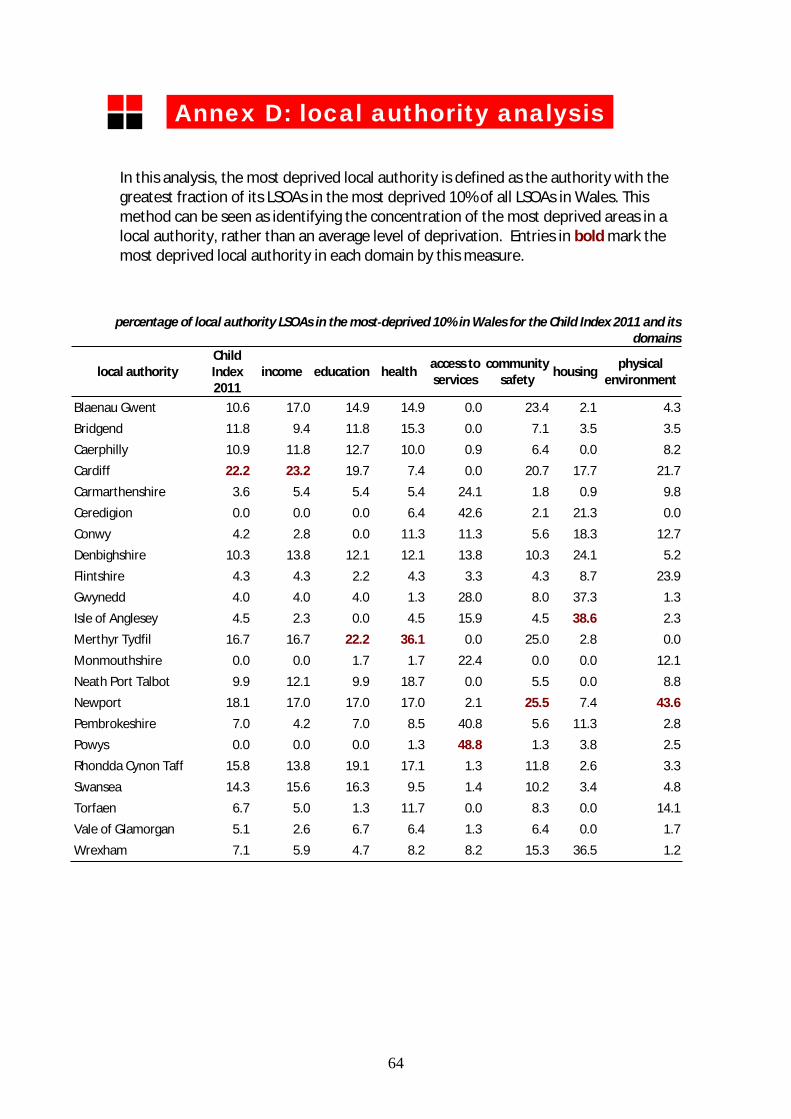
64
lAnnex D: local authority analysisl
In this analysis, the most deprived local authority is defined as the authority with thegreatest fraction of its LSOAs in the most deprived 10% of all LSOAs in Wales. Thismethod can be seen as identifying the concentration of the most deprived areas in alocal authority, rather than an average level of deprivation. Entries in bold mark themost deprived local authority in each domain by this measure.
percentage of local authority LSOAs in the most deprived 10% in Wales for the Child Index 2011 and itsdomains
local authorityChildIndex2011
income education healthaccess toservices
communitysafety
housingphysical
environment
Blaenau Gwent 10.6 17.0 14.9 14.9 0.0 23.4 2.1 4.3
Bridgend 11.8 9.4 11.8 15.3 0.0 7.1 3.5 3.5
Caerphilly 10.9 11.8 12.7 10.0 0.9 6.4 0.0 8.2
Cardiff 22.2 23.2 19.7 7.4 0.0 20.7 17.7 21.7
Carmarthenshire 3.6 5.4 5.4 5.4 24.1 1.8 0.9 9.8
Ceredigion 0.0 0.0 0.0 6.4 42.6 2.1 21.3 0.0
Conwy 4.2 2.8 0.0 11.3 11.3 5.6 18.3 12.7
Denbighshire 10.3 13.8 12.1 12.1 13.8 10.3 24.1 5.2
Flintshire 4.3 4.3 2.2 4.3 3.3 4.3 8.7 23.9
Gwynedd 4.0 4.0 4.0 1.3 28.0 8.0 37.3 1.3
Isle of Anglesey 4.5 2.3 0.0 4.5 15.9 4.5 38.6 2.3
Merthyr Tydfil 16.7 16.7 22.2 36.1 0.0 25.0 2.8 0.0
Monmouthshire 0.0 0.0 1.7 1.7 22.4 0.0 0.0 12.1
Neath Port Talbot 9.9 12.1 9.9 18.7 0.0 5.5 0.0 8.8
Newport 18.1 17.0 17.0 17.0 2.1 25.5 7.4 43.6
Pembrokeshire 7.0 4.2 7.0 8.5 40.8 5.6 11.3 2.8
Powys 0.0 0.0 0.0 1.3 48.8 1.3 3.8 2.5
Rhondda Cynon Taff 15.8 13.8 19.1 17.1 1.3 11.8 2.6 3.3
Swansea 14.3 15.6 16.3 9.5 1.4 10.2 3.4 4.8
Torfaen 6.7 5.0 1.3 11.7 0.0 8.3 0.0 14.1
Vale of Glamorgan 5.1 2.6 6.7 6.4 1.3 6.4 0.0 1.7
Wrexham 7.1 5.9 4.7 8.2 8.2 15.3 36.5 1.2
65
lAnnex E: glossaryl
Defra Department for Environment, Food and Rural AffairsDWP Department for Work and PensionsHEFCE Higher Education Funding Council for EnglandHMRC Her Majesty's Revenue and CustomsKS2, KS3, KS4 Key Stage 2, 3, 4
LSOAlower layer super output area the small areas on whichWIMD and the Child Index are based
NASS National Asylum Support ServiceONS Office for National StatisticsWIMD Welsh Index of Multiple Deprivation