welwyn hatfield community housing trust
TRANSCRIPT

1
WELWYN HATFIELD COMMUNITY HOUSING TRUST
CABINET HOUSING & PLANNING PANEL
9th FEBRUARY 2017
PERFORMANCE MANAGEMENT REPORTING – Quarter THREE
Section 1 Housing Stock
Housing Management Stock Profile
Properties sold through the RTB scheme
Property acquisitions
Section 2 Rent Collection & Arrears Management
Arrears percentage
Percentage of tenants owing more than 7 weeks rent
Rent collected as % of rent owed
Percentage of tenants evicted for arrears
Section 3 Managing Under Occupation
Number of council tenants under occupying– moved to smaller accommodation
Section 4 Decent Homes
Section 5 Homelessness & temporary accommodation
Number of household in temporary accommodation
Homelessness decisions
Homelessness acceptance levels
Section 6 Housing Needs Register
Applicants on HNR by band
Section 7 Complaints
Complaints and compliments received
Managing complaints
Complaints service feedback
Section 8 Repairs
Gas Safety compliance and heating service repairs
Responsive repair jobs completed
Direct calls received by the Repairs Service Centre Team
Section 9 Void Properties
Average Void time in days (cumulative)
Properties showing as vacant at the end of the reporting period
Percentage of rent lost from vacant dwellings

2
Section 1 - Housing Stock
General Needs Housing
Total 7271
Houses 5157
Flats 1864
One Bedroom 16
Bedsit 195
Two Bedroom 1077
One Bedroom 994
Three bedroom 3760
Two Bedroom 632
Four Bedroom 289
Three Bedroom 43
Five Bedroom 11
Six Bedroom 4
Bungalows 115
Maisonettes 135
One Bedroom 42
One Bedroom 4
Two Bedroom 72
Two Bedroom 61
Three Bedroom 1
Three Bedroom 70
Sheltered Housing
Total 1692
Bungalows 1038
Flats/Maisonettes 654
Bedsit 4
One Bed flat 503
One Bedroom 358
Two Bed flat 149
Two Bedroom 673
Three Bed flat 1
Three bedroom 3
Two bed maisonette 1
TOTALS by property type
TOTALS by bedroom size
Bungalows 1153
Bedsit 199
Flats 2517
One Bedroom 1917
Maisonettes 136
Two Bedroom 2665
Houses 5157
Three bedroom 3878
Total 8963
Four Bedroom 289
Five Bedroom 11
Six Bedroom 4
Total 8963

3
Properties sold through the Right to Buy Scheme
Properties sold within the reporting period:
ADDRESS PROP. TYPE ADDRESS PROP. TYPE
Drovers Way, Hatfield 2BED HSE Ingles, Welwyn Garden City 3BED HSE
Hawbush Close, Welwyn 1BED FLAT Lincoln Close, Welwyn
Garden City
1BED FLAT
Hare Lane, Hatfield 3BED HSE Fern Dells, Hatfield 3BED HSE
Millwards, Hatfield 2BED FLAT Northfield, Hatfield 2BED FLAT
Glebe House, Essendon 2BED FLAT Swanley Crescent, Little
Heath
3BED HSE
Raymonds Close, Welwyn Garden
City
3BED HSE Briars Lane, Hatfield 3BED HSE
Comet Road, Hatfield 1BED FLAT Garden Avenue, Hatfield 3BED HSE
Hollyfield, Hatfield 2BED FLAT Cattlegate Road, Northaw 3BED HSE
Queensway House, Queensway,
Hatfield
1BED FLAT Northaw Road West,
Northaw
3BED HSE
Downsfield, Hatfield 1BED FLAT Haldens, Welwyn Garden
City
2BED FLAT
The Crescent, Welwyn 3BED HSE Briars Wood, Hatfield 2BED FLAT
Howlands, Welwyn Garden City 3BED HSE
During this quarter, 23 properties were sold through the Right to Buy Scheme as listed above. A total of 62 for year to date period so far.
The above chart shows the total RTB sales per month since April 2015. The left-hand side chart shows a breakdown by property type for 2016-17
4
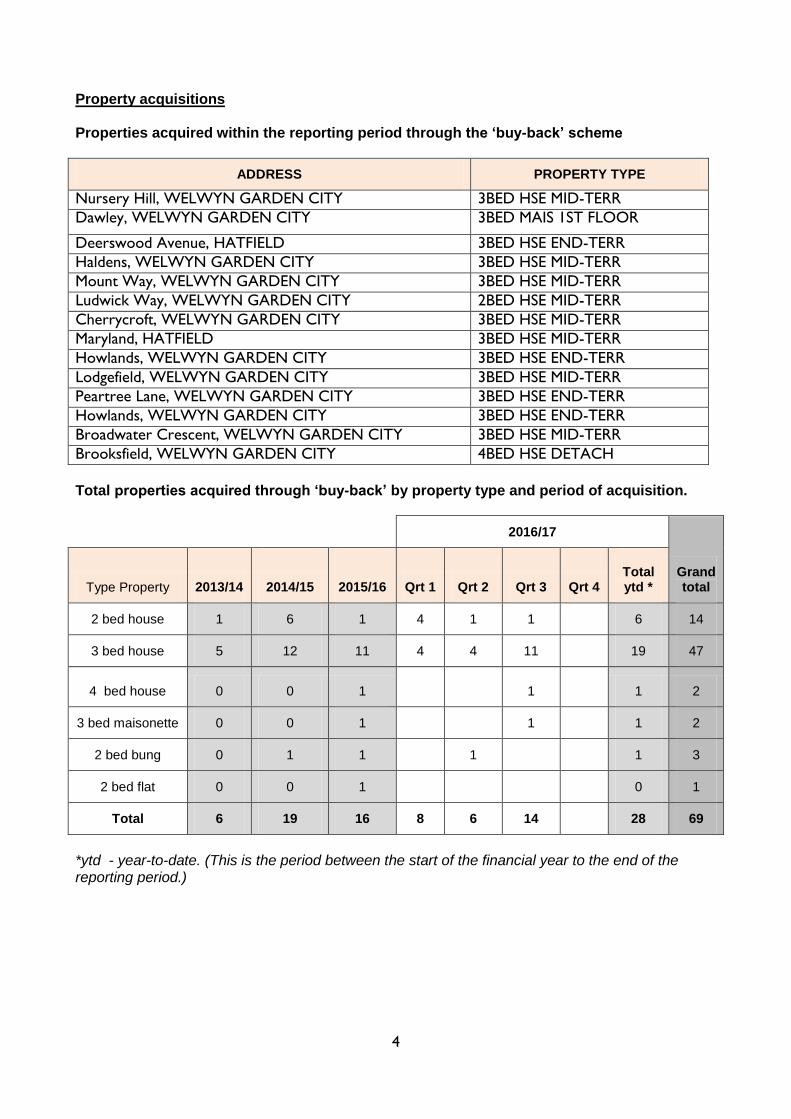
Property acquisitions Properties acquired within the reporting period through the ‘buy-back’ scheme
ADDRESS PROPERTY TYPE
Nursery Hill, WELWYN GARDEN CITY 3BED HSE MID-TERR
Dawley, WELWYN GARDEN CITY 3BED MAIS 1ST FLOOR
Deerswood Avenue, HATFIELD 3BED HSE END-TERR
Haldens, WELWYN GARDEN CITY 3BED HSE MID-TERR
Mount Way, WELWYN GARDEN CITY 3BED HSE MID-TERR
Ludwick Way, WELWYN GARDEN CITY 2BED HSE MID-TERR
Cherrycroft, WELWYN GARDEN CITY 3BED HSE MID-TERR
Maryland, HATFIELD 3BED HSE MID-TERR
Howlands, WELWYN GARDEN CITY 3BED HSE END-TERR
Lodgefield, WELWYN GARDEN CITY 3BED HSE MID-TERR
Peartree Lane, WELWYN GARDEN CITY 3BED HSE END-TERR
Howlands, WELWYN GARDEN CITY 3BED HSE END-TERR
Broadwater Crescent, WELWYN GARDEN CITY 3BED HSE MID-TERR
Brooksfield, WELWYN GARDEN CITY 4BED HSE DETACH
Total properties acquired through ‘buy-back’ by property type and period of acquisition.
2016/17
Grand total Type Property 2013/14 2014/15
2015/16 Qrt 1 Qrt 2 Qrt 3 Qrt 4 Total ytd *
2 bed house 1 6 1 4 1 1 6 14
3 bed house 5 12 11 4 4 11 19 47
4 bed house 0 0 1 1 1 2
3 bed maisonette 0 0 1 1 1 2
2 bed bung 0 1 1 1 1 3
2 bed flat 0 0 1 0 1
Total 6 19 16 8 6 14 28 69
*ytd - year-to-date. (This is the period between the start of the financial year to the end of the reporting period.)

5
Section 2 – Rent Collection & Arrears Management Current tenant rent arrears as a % of the Annual Rent Debit (ARD)
2015/ 16 2016/ 17 Change from last year. *
April 1.38% 1.33%. -0.05%
May 1.64% 1.44% -0.20%
June 1.64% 1.49% -0.15%
July 1.90% 1.72% -0.18%
August 1.94% 1.78% -0.16%
September 1.79% 2.13% +0.34%
October 2.24% 1.84% -0.41%
November 1.90% 1.84% -0.06%
December 2.64% 2.29% -0.35%
January 2.50%
February 2.04%
March 1.03%
Team arrears as a % of Team Area's ARD - This is used to monitor Team and patch performance Rent arrears as a % of total ARD
The trend for quarter three performance historically reports arrears at their highest percentage for each previous financial year and this is reflected again for the current year with performance at 2.29% for Dec ‘16. There has been a steady monthly increase from Apr ‘16 to date, with an anticipated gradual reduction over the final months in quarter four. A number of factors have influenced the current performance levels, mainly the monthly / fortnightly cycle for direct debit payments and the seasonal impact of the Christmas period. That said, members should be reassured that performance for the current period when compared to the previous year is positive with a 0.35% positive variance compared to Dec ‘15. Year on year trend analysis shows we expect to see a sharp reduction in the total arrears outstanding at the end of the current financial year, with strong performance at year end expected to achieve target. This will in part be a result of the rent free period (last two weeks) at the end of the financial year.

6
Percentage of tenants owing more than 7 weeks rent
n.b. rent is converted to a 52 week basis to make it compatible with other organisations
QTR1 QTR2 QTR3 QTR4
2014-15 3.06% 3.28% 4.05% 3.01%
2015-16 3.04% 2.76% 3.43% 3.04%
2016-17 2.76% 2.78% 3.07%
LI 254 No of tenants evicted for rent arrears
QTR1 QTR2 QTR3 QTR4 Total
2014-15 0.02% 0.06% 0.08% 0.02% 0.18%
No 2 5 7 2 16
2015-16 0.08% 0.03% 0.07% 0.00% 0.18%
No 7 3 6 0 16
2016-17 0.04% 0.07% 0.04% 0.16%
No 4 6 4 14
Rent collected as a percentage of rent owed (excluding arrears brought forward) for General Needs and Housing for Older People Note. The current arrears balance at the end of the last financial year is excluded from the ‘Rent available for collection’ figure. The ‘Rent collected’ figure includes payments received for current rent and any outstanding arrears. This can result in more than 100% of the rent being collected.
Target Apr–Jun Apr-Sept Apr-Dec Apr-Mar
2015-16 100% 101.8% 100.2% 97.9% 100.3%
2016-17 100% 102.2% 97.8% 99.0%
Performance Indicator Calculation
Total rent collected ytd divided by £39,281,064
X 100 = 99.0%
Total rent available for collection ytd £39,691,398
Eviction levels remain consistent with previous year trends, with actual number of tenants evicted being lower (14) than at the end of quarter three last year (16). Rent collection although just missing the target is expected to achieve 100% target at year end with the positive impact of the two rent free weeks.

7
Section 3 – Managing Under Occupation Number of council tenants who were under occupying and who moved to smaller accommodation
Target QTR1 QTR2 QTR3 QTR4 Total ytd
Total for 2014/15 80 24 29 14 15 82
Total for 2015/16 80 20 22 12 17 71
2015/16
Transfers 9 18 19 46
Mutual exchanges 6 2 4 12
Total for 2016/17 80 15 20 23 58
Qrt3 performance is broadly in line with target expectations and a good start has been made for Q4 performance (Jan ‘17) with a number of downsizing moves achieved. 58 moves have been achieved year to date and more potential moves in the pipeline. The Home Mover Officers have worked effectively with tenants, assisting with practical issues such as coordinating removals and arranging connections/reconnections, post redirection, and other such matters associated with a property move. This service has helped vulnerable tenants to downsize to more suitable accommodation.

8
Section 4 - Decent Homes.
This information is provided at the end of the financial year.

9
Section 5 - Homelessness & temporary accommodation Number of households living in Temporary Accommodation (TA) with an accepted duty as homeless by the LA including refuge
Quarter Target QTR1 QTR2 QTR3 QTR4
2014/15 <55 by year
end 65 66 54 69
2015/16 <55 by year
end 67 64 72 71
2016/17 <55 by year
end 63 74 63
In the last quarter period we have seen a decrease in the number of households approaching as homeless. This decline is fairly typical for this time of year, however we do expect to see an increase in the following quarter if seasonal trends continue. In December there were a total of 49 approaches to the Advice Team of which 12 were referred to the Options Officers for a homelessness decision. This was considerably lower than 111 to the Advice Team and 22 to the Options Officers in November. There have been several complex cases that required lengthier periods of investigation before a decision could be made. This impacts on the length of time that people stay in TA and as such numbers in TA remain high. Our priority in addressing this area of performance is to facilitate more move-on accommodation, both into the social and private rented sectors.

10
Homelessness decisions 2015/16 2015/16 2016/17 2016/17 2016/17
Decision Qtr 3 Qtr 4 Qtr 1 Qtr 2 Qtr 3
Full duty accepted to secure permanent accommodation
33 44 30 32 28
Eligible, but no priority need homeless 2 3 3 5 3
Eligible, but not homeless or threatened with it 2 5 4 8 8
Eligible, but intentionally homeless 6 9 6 5 6
Not eligible 1 0 0 1 0
Total decisions made 44 61 43 51 45
Homeless acceptance reasons 2015/16 2015/16 2016/17 2016/17 2016/17
Primary reason Qtr 3 Qtr 4 Qtr 1 Qtr 2 Qtr 3
Parents/relatives/friends eviction 13 5 9 8 15
Relationship breakdown (non-violent) 3 1 4 4 0
Relationship breakdown (violent) 8 10 1 1 4
Harassment/Violent associated persons 0 0 1 3 0
Mortgage arrears 0 0 0 0 0
Rent Arrears 1 2 1 1 0
Loss of private accommodation 3 15 2 9 6
Loss of other accommodation 4 9 9 6 0
Other reasons 1 2 3 0 3
Total 33 44 30 32 28

11
Section 6 Housing Needs Register
Applicants on HNR by band at period end
HOME SEEKER
Entitled to single/ couple accom.
Entitled to older person(s) accom
Entitled to 2 bed non-family accom
Entitled to 2 bed family accom
Entitled to 3 bed family accom
Entitled to 4+ bed family accom
Total:
Band A 1 1 0 0 0 0 2
Band B 6 2 2 22 7 0 39
Band C 23 8 1 101 37 9 179
Band D 667 14 2 68 95 5 851
Band E 44 158 8 8 7 1 226
Sum: 741 183 13 199 146 15 1297
TRANSFER
Entitled to single/ couple accom.
Entitled to older
person(s) accom
Entitled to 2 bed non-
family accom
Entitled to 2 bed family
accom
Entitled to 3 bed family
accom
Entitled to 4+ bed family accom
Total:
Band A 16 10 1 3 1 0 31
Band B 23 98 16 20 13 8 178
Band C 39 13 6 25 34 11 128
Band D 16 12 1 14 84 7 134
Band E 9 35 2 0 1 0 47
Sum: 103 168 26 62 133 26 518
In accordance with the council’s Housing Allocation Policy and to ensure that the Housing Needs Register includes households with a current housing need, applicants’ bidding activity is reviewed on a regular basis. Where an applicant has not bid for a property for six months or more at the point of the review, they are notified that their application will be cancelled. Where the applicant can demonstrate exceptional circumstances which explain the non-bidding, their application will remain. Applicants wishing to downsize are excluded from this exercise.

12
Section 7 Complaints & Compliments SUMMARY OF CUSTOMER COMPLAINTS, COMPLIMENTS AND MEMBER ENQUIRIES
KPI summary for service activity
ID KPI Qrtly
volume/ number
Qrtly KPI
result
KPI 12 mth
move.av
→trend
(12mths move.av)
KPI YTD
Target (YTD)
Toler-ance (YTD)
On Target
for YTD
COMPLAINTS - KPI for responding to complaints within target of 10 working days
% within target stage one
72 97.2% 93.5% ↑ 96.1% 90% 85%
% within target stage two and LGO
5 80.0% 84.2% ↓ 76.5% 90% 85%
MEMBER ENQUIRIES - KPI for responding to member enquiries within target of 10 working days
% within target 103 98.1% 93.9% ↓ 96.1% 90% 85%
% of stage two complaints responded to within target is showing as 80% for the quarter, below the target of 90%, due to one case out of the five being responded to four days after the expected date. The case involved complex housing need issues.
KPI supporting data for service activity
Number received and closed
2015/16
total
This quarter
period total
2016/17
YTD total
CUSTOMER COMPLAINTS
Number of cases received 307 81 183
Number of cases closed 343 77 191
Number of active cases at end of reporting period 26 43 -
MEMBER ENQUIRIES
Number of cases received 200 47 199
Number of cases closed 246 67 220
Number of active cases at end of reporting period 30 17 -
CUSTOMER COMPLIMENTS
Number of compliments received 156 61 191

13
Complaints and Member enquiries closed by service category
Complaints Member enquiries TOTAL closed
No. 2016/17
YTD
% of grand
total YTD
Number 2016/17
YTD
% of grand
total YTD
Number 2016/17
YTD
% of grand
total YTD
Responsive Maintenance 70 36.7% 53 24.1% 123 29.9%
Specialist Maintenance 48 25.1% 11 5.0% 59 14.4%
Planned Maintenance 21 11.0% 16 7.3% 37 9.0%
Maintenance sub-total 139 72.8% 80 36.4% 219 53.3%
Area Housing Management 16 8.4% 44 20.0% 60 14.6%
Housing Needs/HNR Application
25 13.1% 95 43.1% 120 29.2%
Community Development/ASB 1 0.5% 0 0.0% 1 0.2%
Rents, leasehold & RTB 5 2.6% 0 0.0% 5 1.2%
Welfare Services 5 2.6% 1 0.5% 6 1.5%
Operations sub-total 52 27.2% 140 63.6% 192 46.7%
Grand total 191 100.0% 220 100.0% 411 100.0%
Complaints closed by stage/level of complaint
2015/16
total
This quarter period total
2016/17
YTD total
Stage one 326 72 178
Stage two 17 5 13
Stage LGO 0 0 0
Total 343 77 191

14
Nature of complaints closed by summarised service category
2015/16
total
This quarter
period total
2016/17
YTD total
Lack of service/service failure 81
38 111
Staff rude/ unhelpful 20
3 11
Treated unfairly/banding issues 42
23 36
Poor workmanship / quality 200
13 33
Total 343
77 191
KPI summary for complaints feedback
ID KPI Qrtly volume/ number
Qrtly KPI
result
KPI 12 mth
move.av
→trend
(12mths move.av)
KPI YTD
Target (YTD)
Toler-ance (YTD)
On Target
for YTD
Customer complaints satisfaction survey results
% found it easy to complain
20 75% 77% ↓ 74% 80% 75%
% happy with how the problem was resolved
20 60% 57% ↓ 54% 80% 75%
% happy with the way complaint was handled
20 70% 64% ↓ 62% 80% 75%
% felt treated fairly
20 65% 67% ↓ 65% 80% 75%
KPI supporting data for complaints feedback Outcome of complaints
YTD
YTD
Fully upheld 37
% fully/partially upheld 40%
Partially upheld 39
Not upheld 115
Number fully/partially upheld 76
Total 191

15
Customer survey activity
2015/16
total
This quarter
period total
2016/17
YTD total
Number of customer satisfaction surveys received
85
20 50
Comments by exception Customer satisfaction results for all four KPIs are showing lower than expected. There is a decline in customer satisfaction with the way complaints are managed. 70% of complaints are in relation to property services. The feedback from customers’ suggests the main underlying concern affecting all areas of satisfaction is the time taken for complaint resolution and being kept informed throughout the process. To address this we need to understand what has changed within the year. The two main changes within the year to impact on complaints are;
Increased number of cases managed by teams. The average number of complaints and member enquiries closed per month has increased in the year from an average of 47 to 50 cases per month. Complaints have slightly declined in this period from 32 to 21 cases, but member enquiries have nearly doubled on average in the year from 15 to 29 cases.
Accountability for member enquiries increasing pressure on teams. The front-line service managers in January last year took direct responsibility for managing and responding to member enquiries. This was a positive change to increase accountability of member concerns directly with the services; feedback from members confirms that this has been a success.
Although Housing Services performance is high overall we acknowledge that this declining performance in relation to how our customers feel about the way we manage complaints is not acceptable and does not meet the high standard we set for the service.
What are we doing to address performance Following the imminent re-integration of the Housing Services back into the council we will now re-focus on ensuring that the services provided meet the highest possible standard and in particular we will review areas of weakness, such as the way complaints are managed. Areas we will be looking at include the allocation of resources into managing complaints, further staff training and the implementation of new approaches for gaining feedback from customers so that we can fully understand why they are unhappy. This includes a much greater use of telephone surveys.

16
Section 8 Repairs
Gas Safety Compliance and Repairs
TSG
Qtr 3
2015/16
Qtr 4
2015/16
Qtr 1
2016/17
Qtr 2
2016/17
Qtr 3
2016/17
Gas Safety checks – number completed %
99.91% 99.77% 99.94% 100% 99.98%
Gas Safety checks – number overdue
8 21 5 0 5
TSG Target Qtr 4
2015/16
Qtr 1
2016/17
Qtr 2
2016/17
Qtr 3
2016/17
Gas Servicing - % Customer Satisfaction
97% 90.33% 86.63% 88.71% 93.83%
Gas Servicing - % Appointments Made & Kept
95% 98.90% 99.66% 100% Not
available
Responsive Repairs - % Appointments Made & Kept
95% 98.20% 99.14% 99.20% Not
available
Responsive Repairs - % First Visit Fix 85% 83.44% 86.50% 86.63% Not
available
Gas compliancy fell by 0.02% at the close of quarter 3 leaving us with 99.98% of our housing stock which contains gas with a valid gas certificate. TSG continue to follow the processes for gas safety inspections as outlined in the gas servicing process yet the complexity of the four of the five cases which were referred back to Housing 30 days prior to expiry required Legal proceedings to be pursued. In three of the cases Housing were made aware that the properties were vacated due to differing tenancy matters. Four of the outstanding cases had a compliant gas certificate issued by 9th January 2017. One of the properties remains overdue as it is currently a potential abandonment case where an injunction shall be pursued if there is no response from Housing Management contact.
Gas Servicing Customer Satisfaction - of the 600 customer satisfaction surveys that were
returned in Qtr 3, 563 residents scored 7 or above when rating their overall experience of the
servicing appointment on a scale of 1-10.This resulted in an improvement on satisfaction levels
of over 5% compared to Qtr 2 which was a result of improved communication from TSG on
servicing appointments.

17
Job type Target Qtr 4
2015/16
Qtr 1
2016/17
Qtr 2
2016/17
Qtr 3
2016/17
Emergency 99% 100%
(1655)
100%
(1442)
100%
(1639)
100%
(1572)
Urgent 98% 99.63%
(538)
100%
(378)
100%
(338)
100%
(302)
Routine 98% 99.49%
(4942)
99.98%
(4565)
99.33%
(4548)
99.59%
(3908)
Percentage of "First Visit Fix" completions
Repairs Charter Target
Qtr 3
2015/16
Qtr 4
2015/16
Qtr 1
2016/17
Qtr2
2016/17
Qtr 3
2016/17
Overall 80% 90.78% 90.31% 94.02% 95.08% 95.52%
Percentage of appointments kept
Target Qtr 3
2015/16
Qtr 4
2015/16
Qtr 1
2016/17
Qtr2
2016/17
Qtr 3
2016/17
Overall 95% 95.92% 96.03% 96.61% 96.94% 97.12%
Performance continues to be above target for all job types.
The proportion of emergency repairs has increased slightly to 27% of all jobs raised and work will be undertaken to analyse these repairs to determine if we can reduce the number of jobs raised as an emergency. There has been a drop in the number of repairs completed from 6385 in Qtr 1, 6525 in Qtr 2 to 5782 in Qtr 3. We are looking into identifying any particular reasons for this change in volumes.
Continued accurate diagnosis along with improved efficient planning of repair jobs by the Trust and Mears has resulted in a slight increase of 0.44% for this indicator.
Quarter 3’s performance shows a slight improvement on the previous quarter with 6546 appointments being kept out of a total of 6740. A contributing factor to this above-target performance is the continued collaborative working between the Trust’s Repairs Team and Mears scheduling team.

18
4376 3918
4231 3872
4081 4364
4610
5270
3772
0
1000
2000
3000
4000
5000
6000
Apr-16 May-16 Jun-16 Jul-16 Aug-16 Sep-16 Oct-16 Nov-16 Dec-16 Jan-17 Feb-17 Mar-17
Total number of calls received into the Customer Repairs Line per month
99.86%
99.69%
99.98%
99.66%
99.85%
99.75%
99.84% 99.82%
99.54%
99.86%
99.78%
99.85%
99.80% 99.81%
99.80% 99.80%
99.91%
99.78%
99.30%
99.40%
99.50%
99.60%
99.70%
99.80%
99.90%
100.00%
100.10%
Apr-16 May-16 Jun-16 Jul-16 Aug-16 Sep-16 Oct-16 Nov-16 Dec-16 Jan-17 Feb-17 Mar-17
% Calls answered per month % Calls answered YTD
Direct calls received by the Repairs Centre Team
Qrt 4 15/16
Qrt 1 16/17
Qrt 2 16/17
Qtr 3
16/17
Total 2016/17
ytd
Direct calls received into the Customer Repairs line
16,791 12525 12317 13652 38494
Calls answered 16,761 12506 12287 13619 38412
Calls abandoned 30 19 30 33 82
% of calls answered 99.82% 99.85% 99.76% 99.76% 99.78%
19
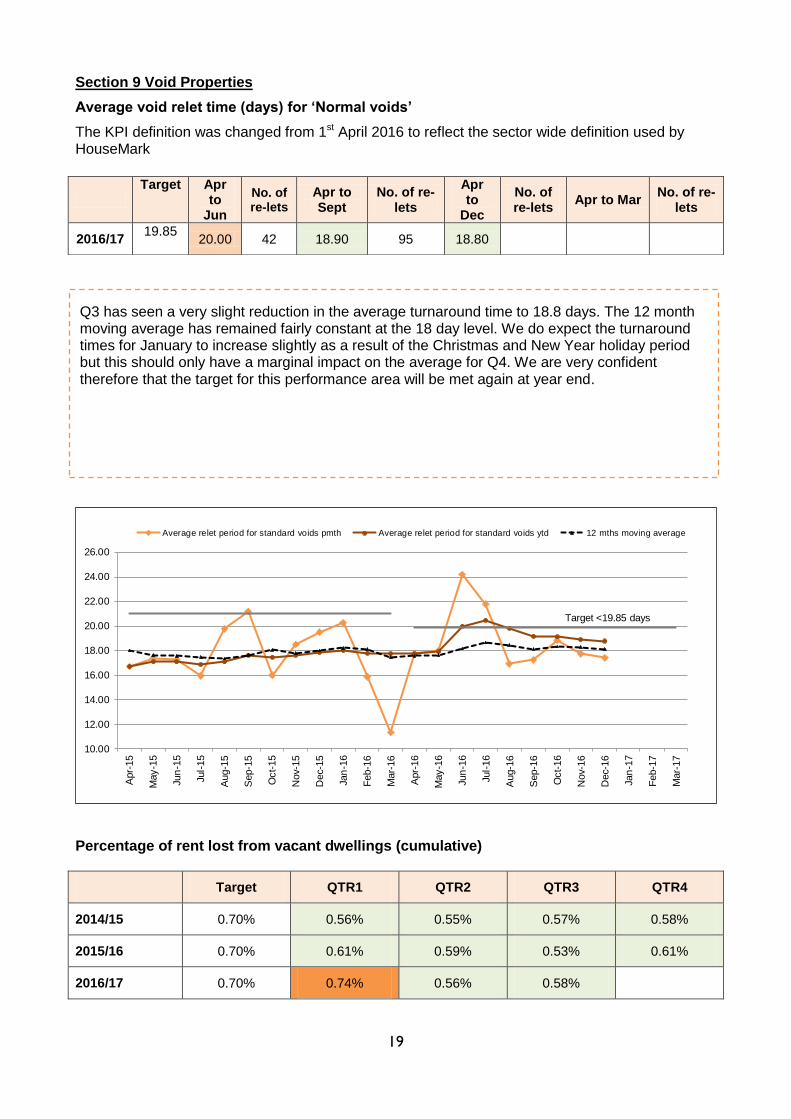
Section 9 Void Properties
Average void relet time (days) for ‘Normal voids’
The KPI definition was changed from 1st April 2016 to reflect the sector wide definition used by HouseMark
Percentage of rent lost from vacant dwellings (cumulative)
Target QTR1 QTR2 QTR3 QTR4
2014/15 0.70% 0.56% 0.55% 0.57% 0.58%
2015/16 0.70% 0.61% 0.59% 0.53% 0.61%
2016/17 0.70% 0.74% 0.56% 0.58%
Target <19.85 days
10.00
12.00
14.00
16.00
18.00
20.00
22.00
24.00
26.00
Apr-
15
May-1
5
Jun
-15
Jul-
15
Aug-1
5
Sep-1
5
Oct-
15
Nov-
15
Dec-
15
Jan
-16
Feb-1
6
Mar-
16
Apr-
16
May-1
6
Jun
-16
Jul-
16
Aug-1
6
Sep-1
6
Oct-
16
Nov-
16
Dec-
16
Jan
-17
Feb-1
7
Mar-
17
Average relet period for standard voids pmth Average relet period for standard voids ytd 12 mths moving average
Target Apr
to Jun
No. of re-lets
Apr to Sept
No. of re-lets
Apr to
Dec
No. of re-lets
Apr to Mar No. of re-
lets
2016/17 19.85
20.00 42 18.90 95 18.80
Q3 has seen a very slight reduction in the average turnaround time to 18.8 days. The 12 month moving average has remained fairly constant at the 18 day level. We do expect the turnaround times for January to increase slightly as a result of the Christmas and New Year holiday period but this should only have a marginal impact on the average for Q4. We are very confident therefore that the target for this performance area will be met again at year end.

20
Appendix A Explanation of the ‘12 month moving average’ data reported in the graphical charts A 12-month rolling average, also known as a ‘moving average’, provides you with the performance’s long-term perspective. As new month’s roll in, this indicator updates. Each shifting 12-month period generates a new average. This is a technical analysis tool used to create charts that show whether performance is trending up or down; this kind of tracking makes a difference between assumptions and analysis.