wes investor presentation -...
TRANSCRIPT

National Association of Publicly-Traded PartnershipsMay 25, 2011
WES Investor Presentation

22
Cautionary Language Re: Forward-Looking Statements
This presentation contains forward-looking statements. Western Gas Partners, LP believes that its expectations are based on reasonable assumptions. No assurance, however, can be given that such expectations will prove to have been correct. A number of factors could cause actual results to differ materially from the projections, anticipated results or other expectations expressed in this presentation. These factors include the ability to meet financial guidance or distribution-growth expectations; the ability to obtain new sources of natural gas supplies; the effect of fluctuations in commodity prices and the demand for natural gas and related products; and construction costs or capital expenditures exceeding estimated or budgeted costs or expenditures, as well as other factors described in the “Risk Factors” section of the Partnership’s 2010 Annual Report on Form 10-K filed with the Securities and Exchange Commission and other public filings and press releases by Western Gas Partners. Western Gas Partners undertakes no obligation to publicly update or revise any forward-looking statements. Please also see our earnings release, posted on our website at www.westerngas.com, and the information provided at the end of this presentation for reconciliations of the differences between any non-GAAP financial measures used in this presentation and the most directly comparable GAAP financial measures.

33
WES Overview
Owner and operator of gathering, processing, and transportation assets serving seven basins
Sponsor-based MLP
Designed to acquire, over time, midstream assets from both Anadarko and Third Parties
Wellhead Gatheringand
Compression
Gas Processing& Treating Plants
Mixed NGLPipelines
FractionationFacilities
NGL ProductsPipelines
NGLTerminals and
StorageFacilities
NGLTransportation
Lines/Railand Truck
NGL Retailers/End Users
GasEnd Users
NaturalGas
= Business Activity of WES

4
Western Gas Partners, LP (NYSE: WES)
Western Gas Partners, LP Western Gas Partners, LP (NYSE: WES)(NYSE: WES)
Public Ownership of WES
44.3% Limited Partner Interest
100% Interest
2% General Partner Interest
53.7% Limited Partner Interest
Public UnitholdersPublic UnitholdersPublic Unitholders
Anadarko Petroleum Corporation (NYSE: APC)
Anadarko Petroleum Anadarko Petroleum Corporation (NYSE: APC)Corporation (NYSE: APC)
Western Gas Holdings, LLCWestern Gas Holdings, LLCWestern Gas Holdings, LLC

5
WES History
5/2008IPO
5/2008IPO
12/2008 $210 MM PRB Drop
12/2008 $210 MM PRB Drop
7/2009 $107 MM Chipeta
Drop
7/2009 $107 MM Chipeta
Drop
10/2009 $350 MM Revolver
10/2009 $350 MM Revolver
12/2009 $123 MM
Equity Issuance
12/2009 $123 MM
Equity Issuance
1/2010 $254 MM Granger
Drop
1/2010 $254 MM Granger
Drop
8/2010 $498 MM
Wattenberg Drop
8/2010 $498 MM
Wattenberg Drop
8/2010 $100 MM Accordion$250 MM Term Loan
8/2010 $100 MM Accordion$250 MM Term Loan
5/2010$99 MM Equity
Issuance
5/2010$99 MM Equity
Issuance
20082008
11/2010$247 MM
Equity Issuance
11/2010$247 MM
Equity Issuance
2/2011 $304 MM
Platte Valley Acquisition
2/2011 $304 MM
Platte Valley Acquisition
9/2010 $38 MM
White Cliffs Acquisition
9/2010 $38 MM
White Cliffs Acquisition
3/2011$133 MM Equity Issuance
$800 MM Revolver
3/2011$133 MM Equity Issuance
$800 MM Revolver
20092009 20102010 20112011
5/2011$500 MM LT Debt
Issuance
5/2011$500 MM LT Debt
Issuance

6
YTD Highlights
Closed First Major Third Party Acquisition
$303MM Platte Valley Acquisition from Encana
Increased Quarterly Distribution to $0.39/Unit
Eighth consecutive quarterly increase
Generated Quarterly Distribution Coverage of 1.5x
Includes full effect of 3.9MM equity offering in March 2011
Upsized Existing Unsecured Credit Facility to $800MM
Extended maturity to 2016
Completed First Public Debt Offering
10-year tenure, 5.375% coupon
Rated BBB-/BB+ (Fitch/S&P)

77
The WES Asset PortfolioCurrent Assets / Investments
12 natural gas gathering systems
7 natural gas treating facilities
7 processing facilities
1 natural gas pipeline
1 NGL pipeline
1 crude oil pipeline1Q11 Throughput Attributable to WES
Average daily throughput of 1.5 Bcf/d
1Q11 Throughput by Region
East Texas
73%Rockies
17%
Mid-Continent6%
West Texas4%
8
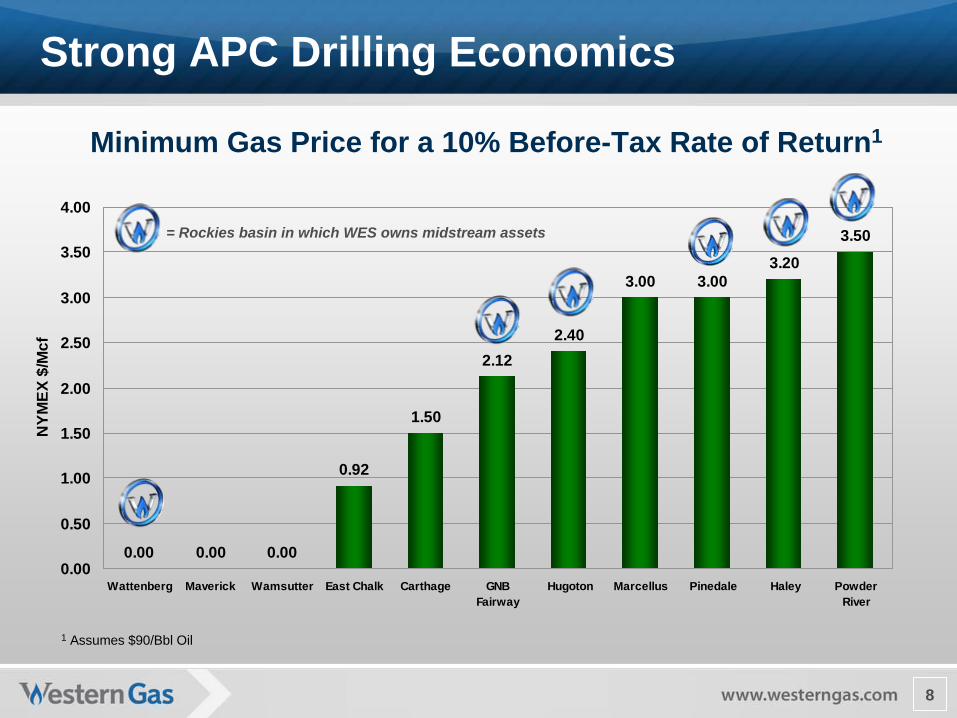
0.00 0.00 0.00
0.92
1.50
2.122.40
3.00 3.003.20
3.50
0.00
0.50
1.00
1.50
2.00
2.50
3.00
3.50
4.00
Wattenberg Maverick Wamsutter East Chalk Carthage GNBFairway
Hugoton Marcellus Pinedale Haley PowderRiver
NYM
EX $
/Mcf
Strong APC Drilling Economics
1 Assumes $90/Bbl Oil
= Rockies basin in which WES owns midstream assets
Minimum Gas Price for a 10% Before-Tax Rate of Return1

9
Liquids-Rich Basins
1Q11 Gross Margin
Liquids-Rich Basins
70%
Dry Gas Basins
30%
High gross margin assets; continued drilling as producers seek to capture high NGL prices, which are tied to crude oil
Lower gross margin assets; cash flow protection through rate resets

10
Wattenberg/Platte Valley/White Cliffs - DJ Basin
APC LAND GRANT
25 miles
DenverDenver
APC ACREAGECOLORADO
WATTENBERG FIELD
Extensive APC high-quality inventory
6,000+ Vertical New Drills
6,000+ Recompletions/Refracs2011 planned APC activity
Drill 470 - 500 Vertical Wells
Drill 20 - 30 Horizontal Wells
Recomplete/Refrac 500+ ZonesAPC net lower-risked captured resources = 3.5 Tcfe1
Description and Overview
Inventory and Activity
2,814 mile gathering system526 mile oil pipeline (10% interest)2,630 receipt points Delivers gas to five processing plants
Ft. Lupton and Platte Valley plants owned by WES
Largest customers: Anadarko, Encana, Noble Encana system purchased 2/11
No APC throughput
White cliffs PPL Added $12+ per Bbl
1 Source: Anadarko 2011 Investor Book. Figure represents entire Powder River Basin

11
Granger – Green River Basin (Moxa/Jonah/Pinedale)
APC ACREAGELAND GRANT
25 miles
WYOMING
APC ACREAGELAND GRANT
25 miles
WYOMINGWYOMING
PINEDALE
MOXAARCH WAMSUTTER
Inventory and ActivityLower-risk drilling
6,000+ Drill Sites (5,000+ at Pinedale)Pinedale – A world class asset
38.2 TCF Recoverable2011 planned Ultra activity
229 Pinedale and Jonah WellsAPC net lower-risked captured resources = 5.6 Tcfe1
815 mile gathering systemTwo cryogenic trains (200 MMcf/d capacity)Two refrigeration Trains (100 Mmcf/d capacity)9,500 Bopd fractionation facility663 receipt pointsDelivers gas to five major pipelines
Access to two additional gas pipelines via Rendezvous
MAPL transports NGLs to Mont BelvieuUltra & Shell largest operators
APC has 12% Working Interest
Description and Overview
1 Source: Anadarko 2011 Investor Book. Figure represents entire Powder River Basin

12
Hilight and Newcastle – Powder River Basin (East)
Inventory and Activity
Conventional oil-driven playsDiverse customer baseEOG and Resolute Resources operators – drilling in 2011; APC non-op interestsIncreasing volumes under favorable POP contractsAPC net lower-risked captured resources = 2.3 Tcfe1
Description and Overview
25 milesAPC ACREAGE
25 milesAPC ACREAGE
GILLETE
WYOMING
1,282 mile gathering systemTwo refrigeration processing plants in serviceHilight delivers gas to MIGC (owned by WES), Newcastle to MGTC (owned by APC)Liquids sold locallyLargest customers – Resolute, EOG, DevonConventional gas fields
Johnson, Campbell, Natrona and Converse counties
High margin contracts
1 Source: Anadarko 2011 Investor Book. Figure represents entire Powder River Basin

13
Chipeta/NGL Pipeline – Uintah Basin (Greater Natural Buttes)
Lower risk with deep zone potential
6,000+ Drill Sites 2011 planned APC activity
5 – 8 Drilling Rigs
Drill 250+ Wells Improving type curve
2008 initial production rate: 1.7 MMcf/d
2010 initial production rate: 2.2 MMcf/dAPC net lower-risked captured resources = 9+ Tcfe1
Inventory and Activity
Description and Overview51% Ownership of Chipeta Processing, LLC
24% owned by APC, 25% owned by Ute Energy
Chipeta Processing Plant
240 Mmcf/d Refrigeration train
250 Mmcf/d Cryogenic train
Natural Buttes Plant
180 Mmcf/d refrigeration
17 Mile NGL pipeline
Connects to MAPL and ultimately to Mont Belvieu
Third train sanctioned in FY 2011
APC commitment plus capacity to serve third parties
Total cost (net to WES) of $56MM split between 2011 and 2012. 3Q12 start-up.
Expected IRR 18-25%
APC ACREAGE
25 miles
UTAH
APC ACREAGE
25 miles
UTAH
APC ACREAGE
25 miles25 miles
UTAH
1 Source: Anadarko 2011 Investor Book. Figure represents entire Powder River Basin

14
WES Strategic Principles
Maximize Liquidity
Demonstrate Sponsor Support
Maintain Capital Maturity
Minimize Commodity Risk

15
0.0x
2.0x
4.0x
6.0x
8.0x
10.0x
12.0x
3Q09 4Q09 1Q10 2Q10 3Q10 4Q10 1Q110.0x
0.5x
1.0x
1.5x
2.0x
2.5x
3.0x
3.5x
4.0x
3Q09 4Q09 1Q10 2Q10 3Q10 4Q10 1Q11
Debt / EBITDA 1Debt / EBITDA 1 Reported EBITDA / Interest Expense
Reported EBITDA / Interest Expense
Significant Liquidity
$800MM of unused revolver capacity as of 5/25/11
1 Quarter-end Debt Divided by (Reported EBITDA * 4)
Average: 2.43x
Average: 9.53x

1616
Minimal Commodity Risk
Gross MarginLast Twelve Months 3/31/2011
Long-Term Fee-Based Contracts and Fixed-Price AgreementsSponsor has Retained Commodity Price Risk Related to Dropdown Assets
2%Unhedged
98%Fee-Based and
Fixed-Price

17
Accretive Dropdowns
20082008 20092009 20102010
5/2008IPO
5/2008IPO
12/2008 $210 MM
PRB Drop
12/2008 $210 MM
PRB Drop
7/2009 $107 MM Chipeta
Drop
7/2009 $107 MM Chipeta
Drop
1/2010 $254 MM Granger
Drop
1/2010 $254 MM Granger
Drop
8/2010$498 MM
Wattenberg Drop
8/2010$498 MM
Wattenberg Drop
Sponsor Also Continues to Invest in Midstream: $1.1B invested over past three years and $1B1 expected in 2011
7.9X
8.2X
7.2X
8.1X
1 including midstream acquisitions

18
Coverage RatioCoverage Ratio Reported EBITDAReported EBITDA
Strong Financial Results
All figures shown as originally reported
$0.0
$10.0
$20.0
$30.0
$40.0
$50.0
$60.0
3Q08 4Q08 1Q09 2Q09 3Q09 4Q09 1Q10 2Q10 3Q10 4Q10 1Q11
Mill
ions
CAGR: 57%
0.00x
0.20x
0.40x
0.60x
0.80x
1.00x
1.20x
1.40x
1.60x
1.80x
2.00x
3Q08 4Q08 1Q09 2Q09 3Q09 4Q09 1Q10 2Q10 3Q10 4Q10 1Q11

19
Midstream Asset Overview*Anadarko Western Gas
Gathering systems 18 12
Processing & treating facilities 9 14
Interstate gas pipelines -- 1
NGL/Crude oil pipelines 2 2
Miles of pipeline 5,900 8,800
Growth Strategy #1 – More Dropdowns
Aggregate throughput of approximately 4.0 Bcf/d for 1Q11
The combined portfolio serves several major producing basins
*As of March 31, 2011
20
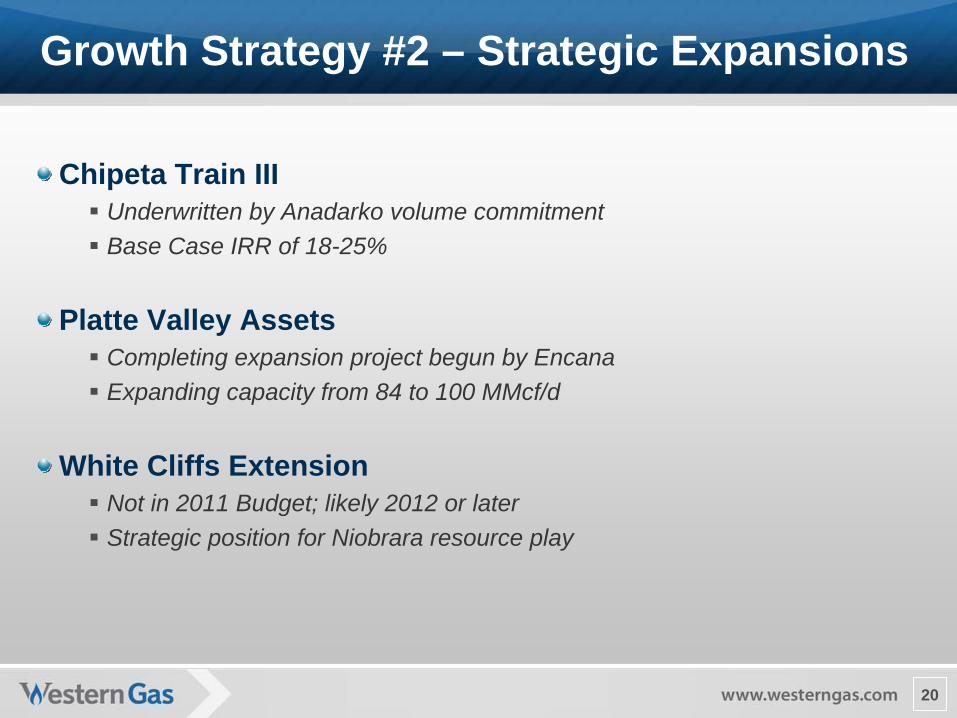
Growth Strategy #2 – Strategic Expansions
Chipeta Train III
Underwritten by Anadarko volume commitment
Base Case IRR of 18-25%
Platte Valley Assets
Completing expansion project begun by Encana
Expanding capacity from 84 to 100 MMcf/d
White Cliffs Extension
Not in 2011 Budget; likely 2012 or later
Strategic position for Niobrara resource play

21
Growth Strategy #3 – Equity Options
White Cliffs Case Study
APC Negotiates Equity Option
Uses negotiating leverage in committing firm transportation
WES Acquires Option from APC
Subsequent exercise
Immediate accretion
Potential for Replication
Mid-con, Marcellus, Eagleford, Niobrara

22
2011 Outlook
($ in millions) Full-Year 2011
Adjusted EBITDA $230 – 250
Total Capex $97 – 112
Maint. Capex as % of Adj. EBITDA 11 - 14%

www.westerngas.com
24
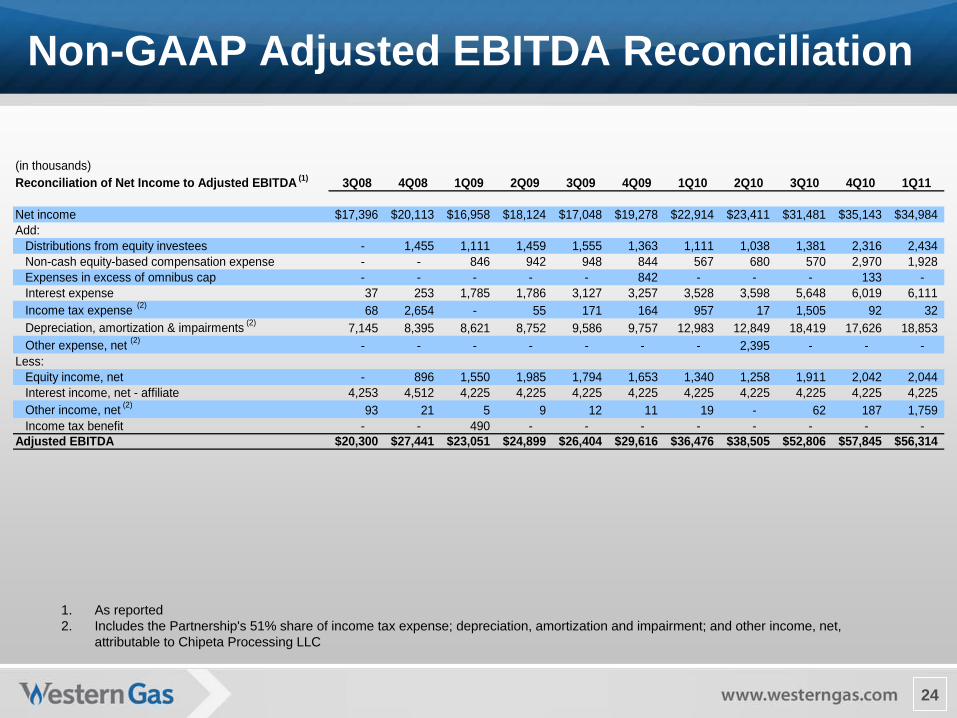
Non-GAAP Adjusted EBITDA Reconciliation
1. As reported 2. Includes the Partnership's 51% share of income tax expense; depreciation, amortization and impairment; and other income, net,
attributable to Chipeta Processing LLC
(in thousands)Reconciliation of Net Income to Adjusted EBITDA (1) 3Q08 4Q08 1Q09 2Q09 3Q09 4Q09 1Q10 2Q10 3Q10 4Q10 1Q11
Net income 17,396$ 20,113$ 16,958$ 18,124$ 17,048$ 19,278$ 22,914$ 23,411$ 31,481$ 35,143$ 34,984$ Add:
Distributions from equity investees - 1,455 1,111 1,459 1,555 1,363 1,111 1,038 1,381 2,316 2,434 Non-cash equity-based compensation expense - - 846 942 948 844 567 680 570 2,970 1,928 Expenses in excess of omnibus cap - - - - - 842 - - - 133 - Interest expense 37 253 1,785 1,786 3,127 3,257 3,528 3,598 5,648 6,019 6,111 Income tax expense (2) 68 2,654 - 55 171 164 957 17 1,505 92 32 Depreciation, amortization & impairments (2) 7,145 8,395 8,621 8,752 9,586 9,757 12,983 12,849 18,419 17,626 18,853 Other expense, net (2) - - - - - - - 2,395 - - -
Less:Equity income, net - 896 1,550 1,985 1,794 1,653 1,340 1,258 1,911 2,042 2,044 Interest income, net - affiliate 4,253 4,512 4,225 4,225 4,225 4,225 4,225 4,225 4,225 4,225 4,225 Other income, net (2) 93 21 5 9 12 11 19 - 62 187 1,759 Income tax benefit - - 490 - - - - - - - -
Adjusted EBITDA 20,300$ 27,441$ 23,051$ 24,899$ 26,404$ 29,616$ 36,476$ 38,505$ 52,806$ 57,845$ 56,314$