wes lefroy raboresearch agricultural analyst september ... · q1 2016 q2 2016 6 q4 2016 q1 2017 q2...
TRANSCRIPT
Rabobank Land Price Outlook
Wes LefroyRaboResearch Agricultural Analyst
More Smoke, Less Fire
September 2019Monaro Farming Systems
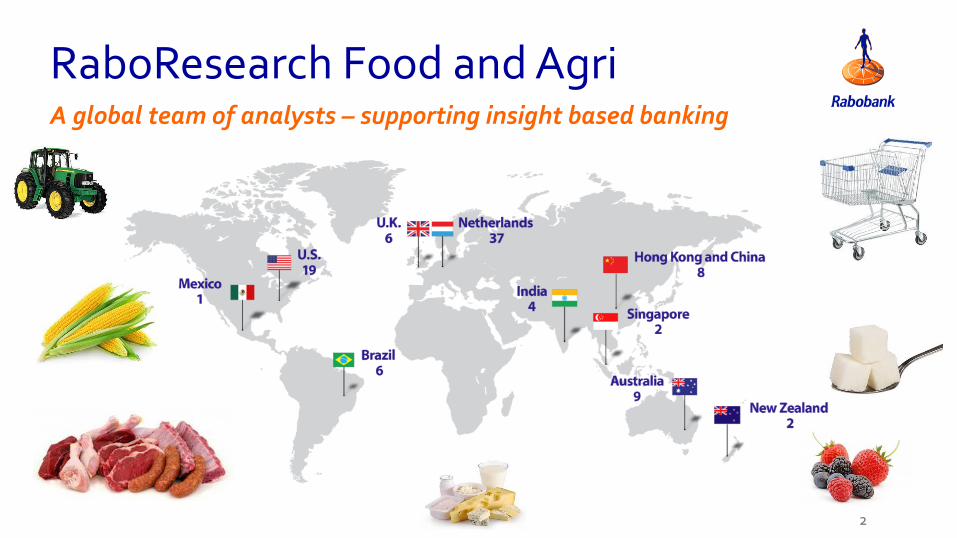
RaboResearch Food and Agri
2
A global team of analysts – supporting insight based banking
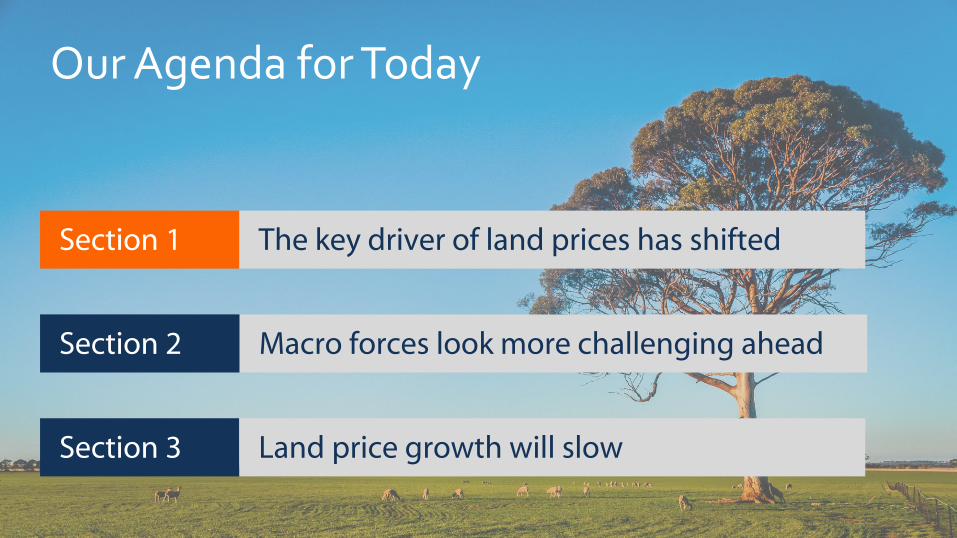
Our Agenda for Today
3
Section 1 The key driver of land prices has shifted
Section 2 Macro forces look more challenging ahead
Section 3 Land price growth will slow
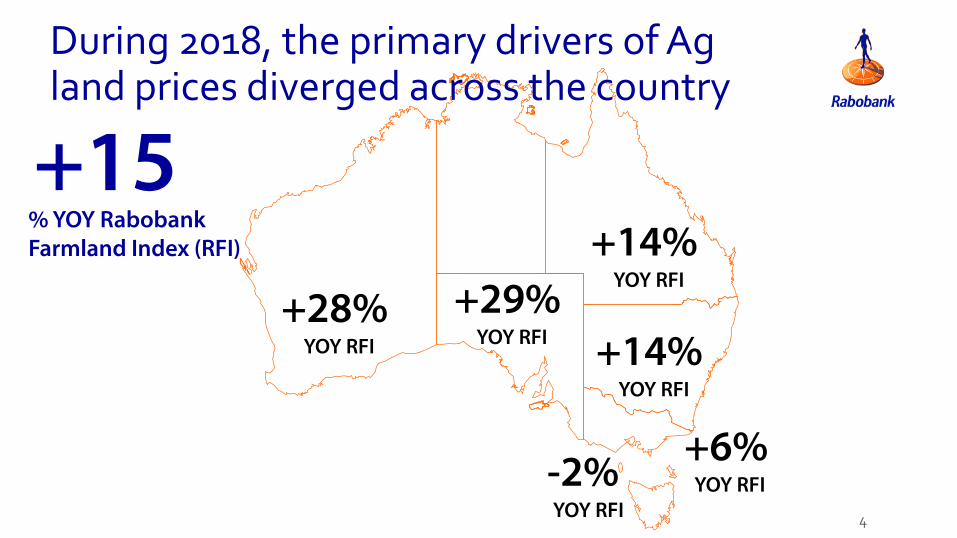
During 2018, the primary drivers of Ag land prices diverged across the country
4
+6%YOY RFI-2%
YOY RFI
+29%YOY RFI
+14%YOY RFI
+14%YOY RFI
+28%YOY RFI
+15% YOY Rabobank Farmland Index (RFI)
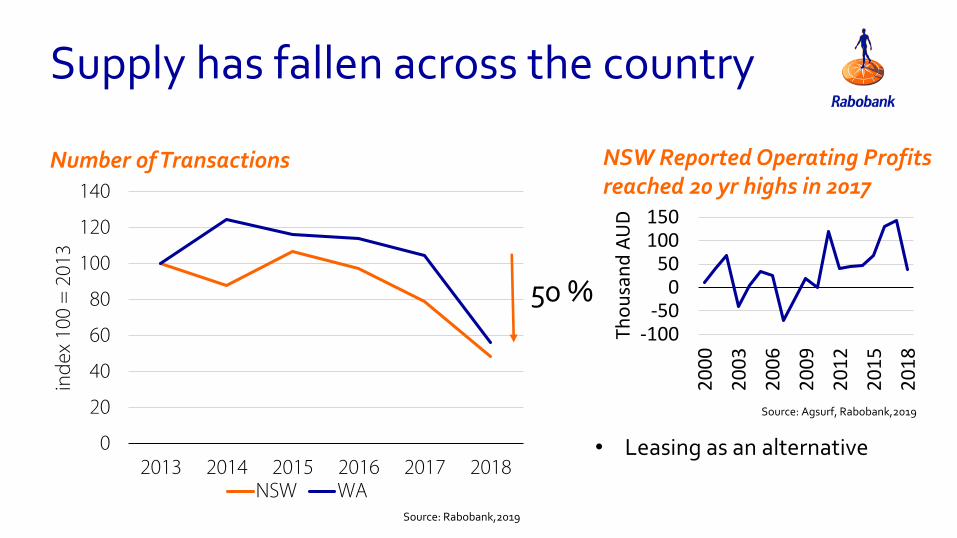
Supply has fallen across the country
Number of Transactions
0
20
40
60
80
100
120
140
2013 2014 2015 2016 2017 2018
ind
ex 1
00 =
201
3
NSW WA
50 %-100
-500
50100150
20
00
20
03
20
06
20
09
20
12
20
15
20
18
Tho
usa
nd
AU
D
NSW Reported Operating Profits reached 20 yr highs in 2017
• Leasing as an alternative
Source: Rabobank,2019
Source: Agsurf, Rabobank,2019
0%
5%
10%
15%
Q1
20
16
Q2
20
16
Q3
20
16
Q4
20
16
Q1
20
17
Q2
20
17
Q3
20
17
Q4
20
17
Q1
20
18
Q2
20
18
Q3
20
18
Q4
20
18
% o
f fa
rmer
s
NSW WA
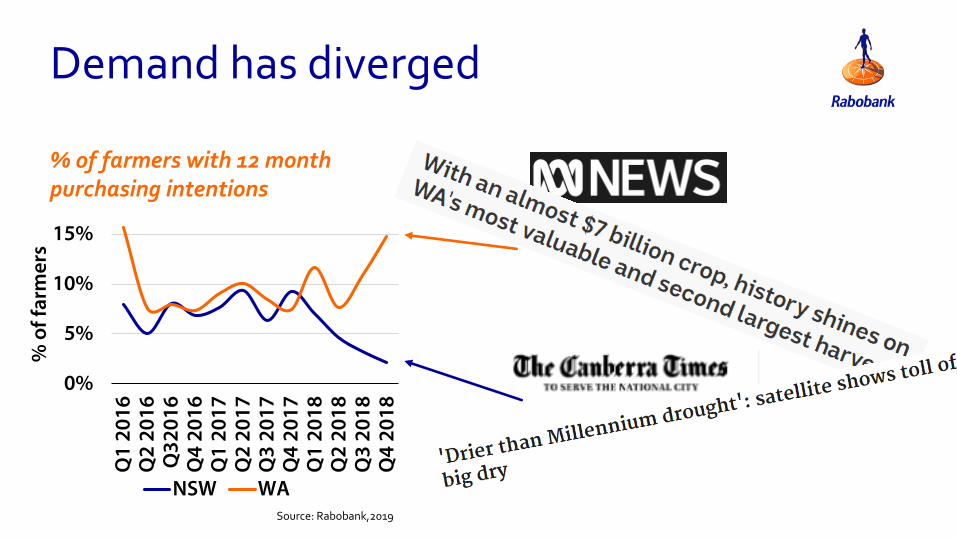
Demand has diverged
% of farmers with 12 month purchasing intentions
Source: Rabobank,2019
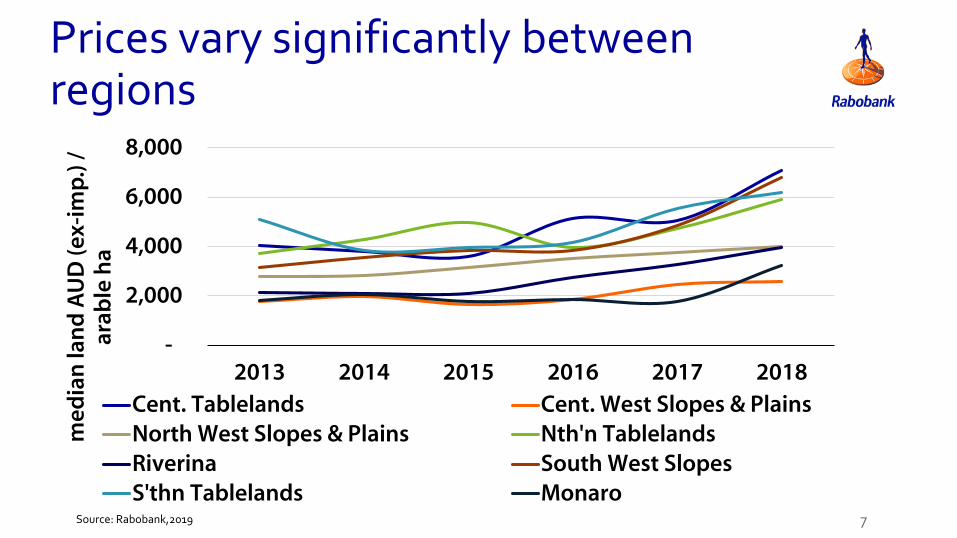
Prices vary significantly between regions
7
-
2,000
4,000
6,000
8,000
2013 2014 2015 2016 2017 2018
med
ian
lan
d A
UD
(ex-
imp
.) /
ar
able
ha
Cent. Tablelands Cent. West Slopes & PlainsNorth West Slopes & Plains Nth'n TablelandsRiverina South West SlopesS'thn Tablelands Monaro
Source: Rabobank,2019
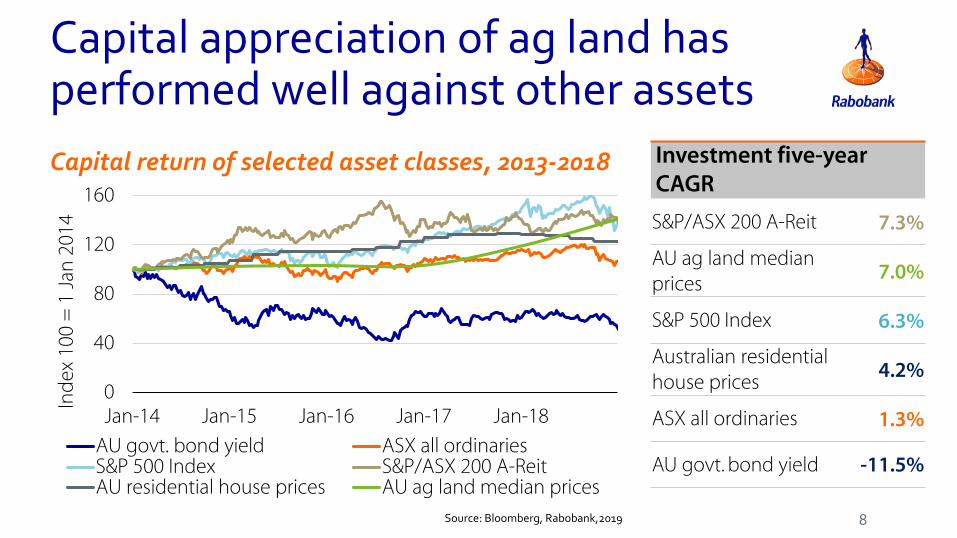
Capital appreciation of ag land has performed well against other assets
8
Capital return of selected asset classes, 2013-2018
0
40
80
120
160
Jan-14 Jan-15 Jan-16 Jan-17 Jan-18
Ind
ex 1
00 =
1 J
an 2
014
AU govt. bond yield ASX all ordinariesS&P 500 Index S&P/ASX 200 A-ReitAU residential house prices AU ag land median prices
Source: Bloomberg, Rabobank,2019
Investment five-year CAGR
S&P/ASX 200 A-Reit 7.3%
AU ag land median prices
7.0%
S&P 500 Index 6.3%
Australian residential house prices
4.2%
ASX all ordinaries 1.3%
AU govt. bond yield -11.5%
Our Agenda for Today
9
Section 1 The key driver of land prices has shifted
Section 2 Macro forces look more challenging ahead
Section 3 Land price growth will slow
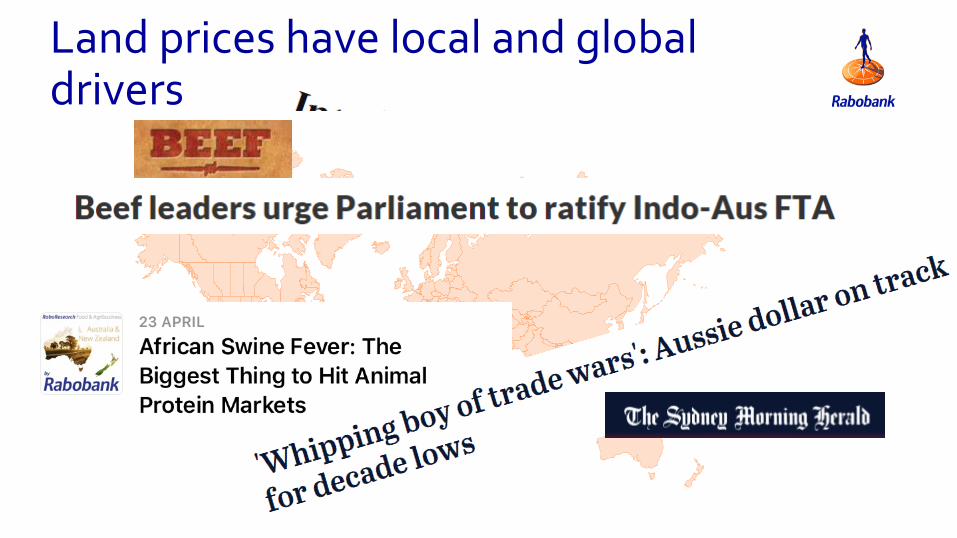
Land prices have local and global drivers
10
• Growth strategies of local farmers
• Corporate Interest
• Operating Profits
• Prices
• Production
• Alternative production possibilities
• Access to infrastructure
• Access to regional centres
• Regional confidence
State Influences
• Proximity to international markets
• Climate (current and future)
• State regulation
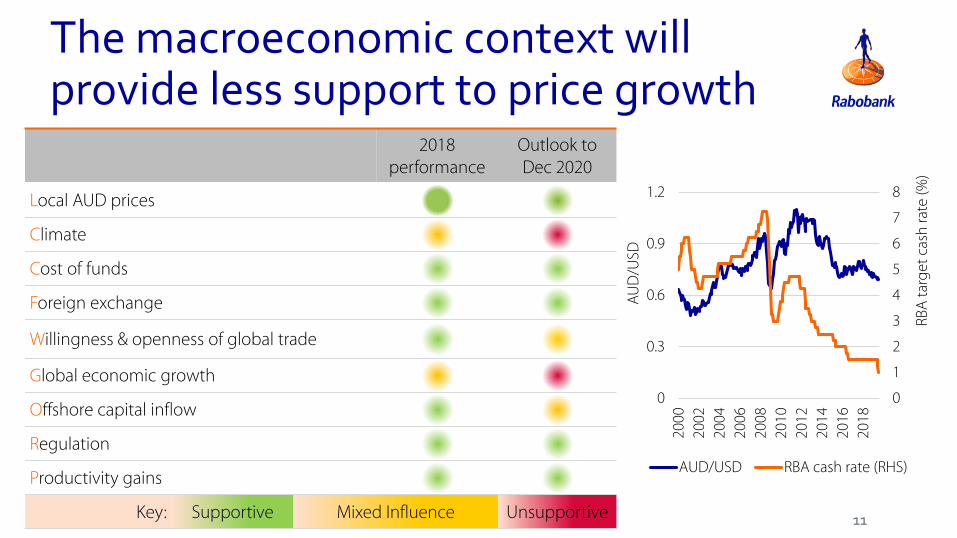
The macroeconomic context will provide less support to price growth
11
2018 performance
Outlook to Dec 2020
Local AUD prices
Climate
Cost of funds
Foreign exchange
Willingness & openness of global trade
Global economic growth
Offshore capital inflow
Regulation
Productivity gains
Key: Supportive Mixed Influence Unsupportive
0
1
2
3
4
5
6
7
8
0
0.3
0.6
0.9
1.2
2000
2002
2004
2006
2008
2010
2012
2014
2016
2018
RBA
tar
get
cas
h ra
te (%
)
AU
D/U
SD
AUD/USD RBA cash rate (RHS)

Our Agenda for Today
12
Section 1 The key driver of land prices has shifted
Section 2 Macro forces look more challenging ahead
Section 3 Land price growth will slow
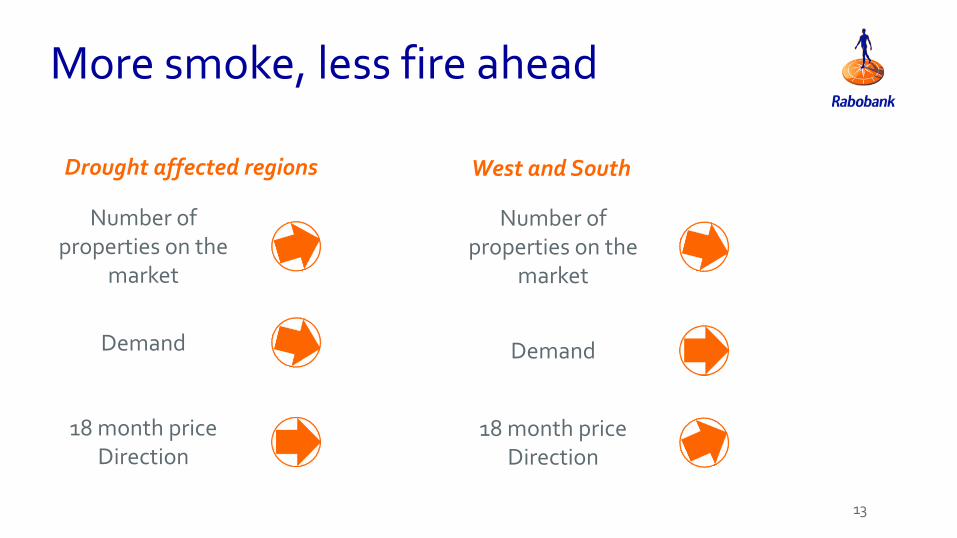
More smoke, less fire ahead
13
West and SouthDrought affected regions
Number of properties on the
market
Demand
18 month price Direction
Number of properties on the
market
Demand
18 month price Direction
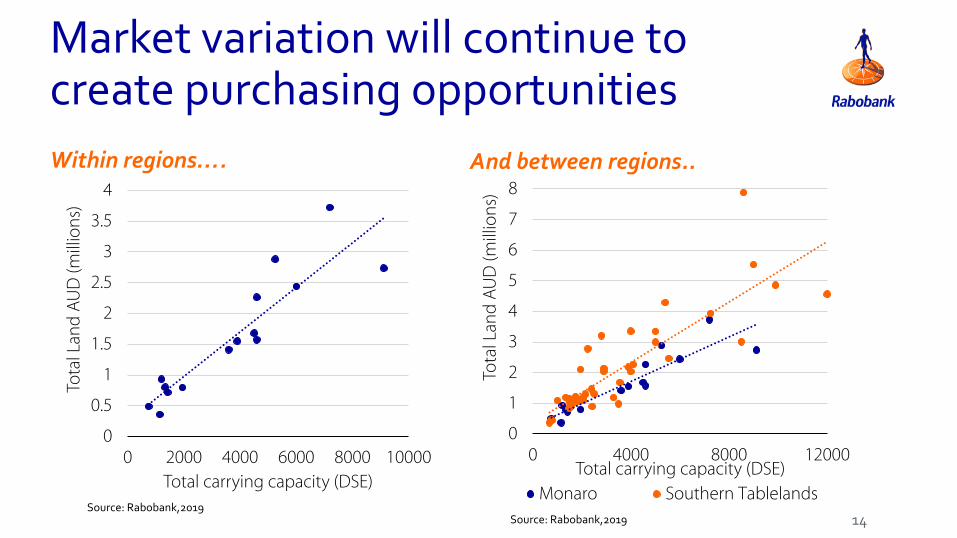
Market variation will continue to create purchasing opportunities
14
Within regions…. And between regions..
0
0.5
1
1.5
2
2.5
3
3.5
4
0 2000 4000 6000 8000 10000
Tota
l Lan
d A
UD
(mill
ion
s)
Total carrying capacity (DSE)
0
1
2
3
4
5
6
7
8
0 4000 8000 12000
Tota
l Lan
d A
UD
(mill
ion
s)Total carrying capacity (DSE)
Monaro Southern TablelandsSource: Rabobank,2019
Source: Rabobank,2019
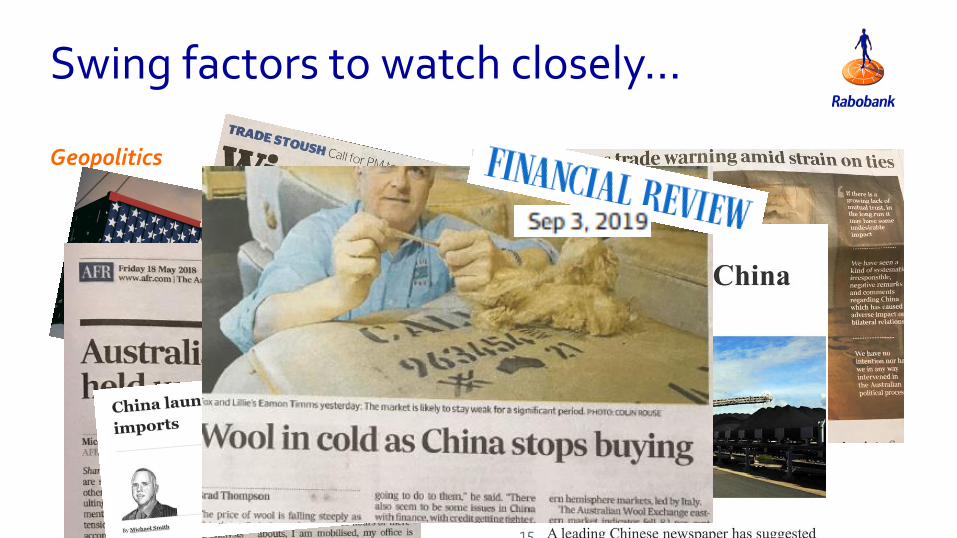
Swing factors to watch closely…
15
Geopolitics
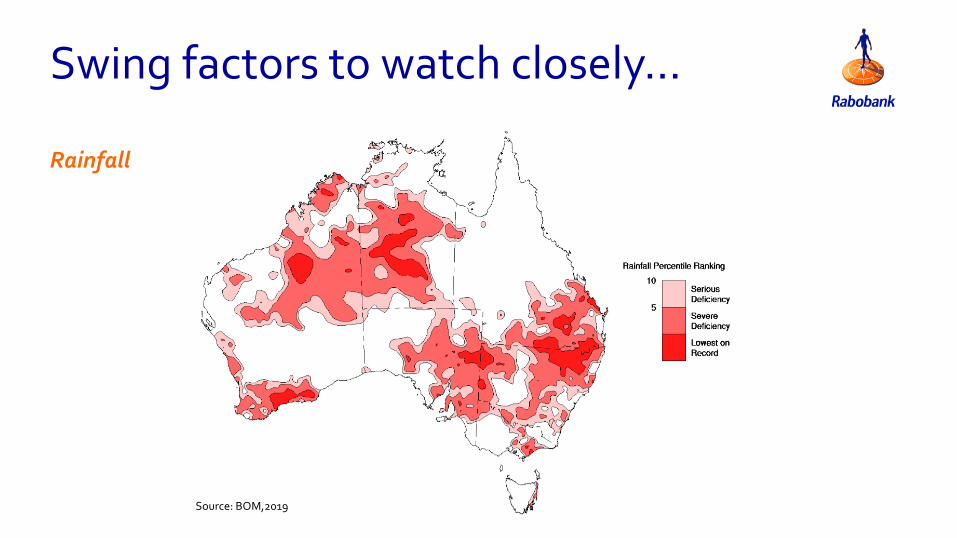
Swing factors to watch closely…
Rainfall
Source: BOM,2019
The bottom line…
17
• Ag land prices have been on fire over the last five years, with growth accelerating during 2017 and 2018.
• During 2018, the primary drivers of Ag land prices diverged across the country
• We expect the macro forces to provide less support to land price growth
• Regardless of a wet or dry scenario, we expect land price growth will plateau in drought affected regions in the 18 months ahead.
1818
This document is meant exclusively for you and does not carry any right of publication or disclosure other than to Coöperatieve Rabobank U.A. (“Rabobank”), registered in Amsterdam. Neither this document nor any of its contents may be distributed, reproduced, or used for any other purpose without the prior written consent of Rabobank. The information in this document reflects prevailing market conditions and our judgement as of this date, all of which may be subject to change. This document is based on public information. The information and opinions contained in this document have been compiled or derived from sources believed to be reliable; however, Rabobank does not guarantee the correctness or completeness of this document, and does not accept any liability in this respect. The information and opinions contained in this document are indicative and for discussion purposes only. No rights may be derived from any potential offers, transactions, commercial ideas, et cetera contained in this document. This document does not constitute an offer, invitation, or recommendation. This document shall not form the basis of, or cannot be relied upon in connection with, any contract or commitment whatsoever. The information in this document is not intended, and may not be understood, as an advice (including, without limitation, an advice within the meaning of article 1:1 and article 4:23 of the Dutch Financial Supervision Act). This document is governed by Dutch law. The competent court in Amsterdam, the Netherlands has exclusive jurisdiction to settle any dispute which may arise out of, or in connection with, this document and/or any discussions or negotiations based on it. This report has been published in line with Rabobank’s long-term commitment to international food and agribusiness. It is one of a series of publications undertaken by the global department of RaboResearch Food & Agribusiness. ©2017 - All Rights Reserved.
18
For further insight
Wes LefroyAgricultural AnalystRaboResearch Food & AgriAustralia and New [email protected]
See our websitewww.research.rabobank.com/far
Subscribe to our podcast channel(search RaboResearch on Apple podcast app)