west evanston tif district 6 report fy 2019
TRANSCRIPT

First Name: Last Name:
Address: Title:
Telephone: City: Evanston Zip: 60201-2796E-mail-
required
Date
FY 2019 TIF Administrator Contact Information
Name of Municipality:
County:
Evanston
Cook
Unit Code: 016/175/30
Reporting Fiscal Year:
Fiscal Year End:
2019
12/31/2019
FILL OUT ONE FOR EACH TIF DISTICT
I attest to the best of my knowledge, that this FY 2019 report of the redevelopment project area(s)
______________________________________________________ _____________________________
Section 1 (65 ILCS 5/11-74.4-5 (d) (1.5) and 65 ILCS 5/11-74.6-22 (d) (1.5)*)
is complete and accurate pursuant to Tax Increment Allocation Redevelopment Act [65 ILCS 5/11-74.4-3 et. seq.] and
or Industrial Jobs Recovery Law [65 ILCS 5/11-74.6-10 et. seq.].
in the City/Village of: Evanston
Name of Redevelopment Project Area Date Designated DD/MM/20YY Date If Terminated
West EvanstonTIF District -TIF 6 9/1/2005
FY 2019
DesaiHitesh
847-448-4311
ANNUAL TAX INCREMENT FINANCE
REPORT
Written signature of TIF Administrator
2100Ridge Avenue
Chief Financial Officer
*All statutory citations refer to one of two sections of the Illinois Municipal Code: The Tax Increment Allocation Redevelopment Act [65 ILCS 5/11-74.4-3 et. seq.] or the Industrial Jobs Recovery Law [65 ILCS 5/11-74.6-10 et. seq.]
8/13/2020
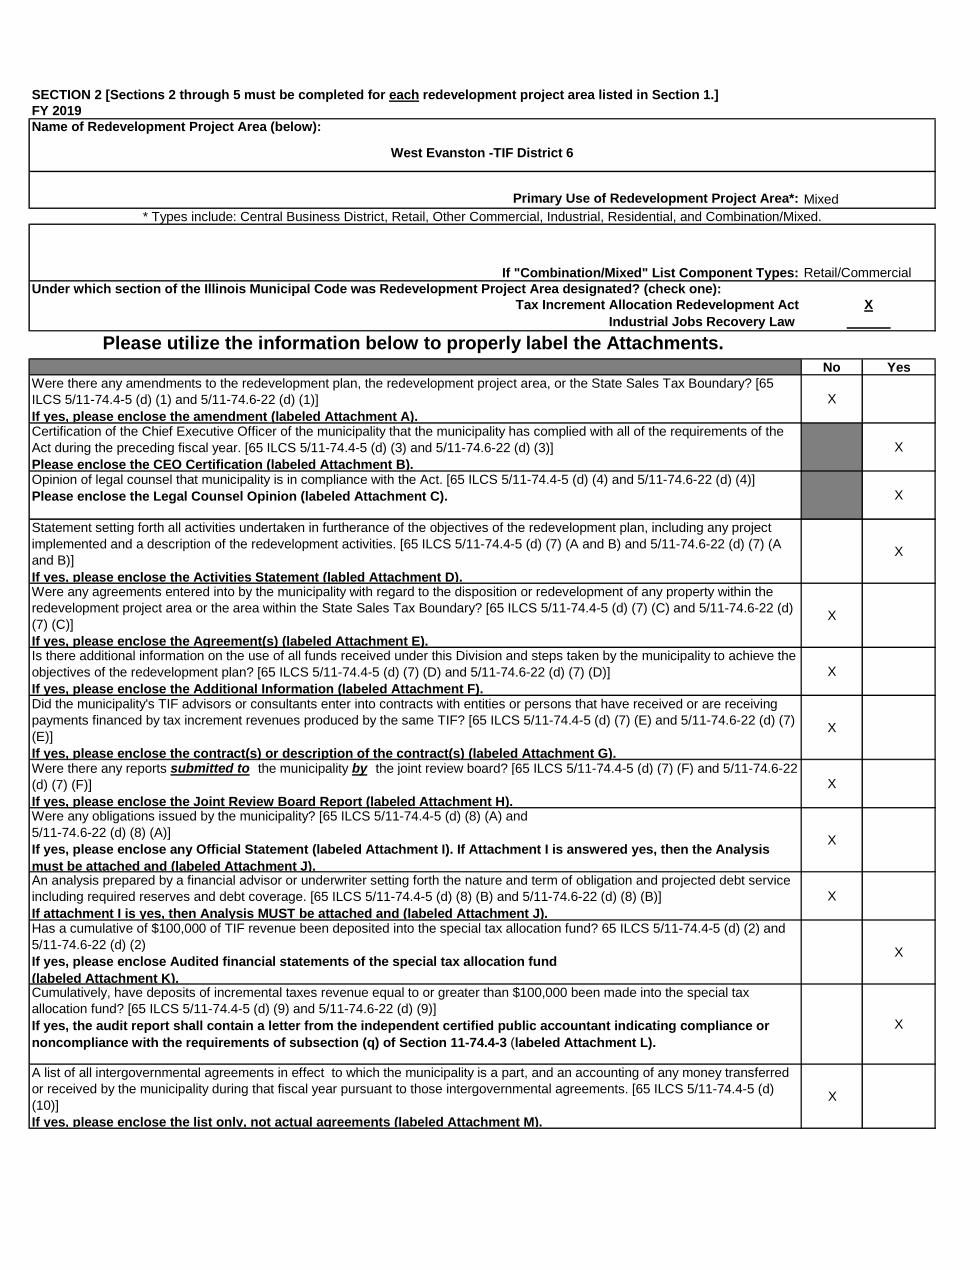
SECTION 2 [Sections 2 through 5 must be completed for each redevelopment project area listed in Section 1.]FY 2019Name of Redevelopment Project Area (below):
Primary Use of Redevelopment Project Area*:
If "Combination/Mixed" List Component Types:
Tax Increment Allocation Redevelopment Act
Industrial Jobs Recovery Law
No YesWere there any amendments to the redevelopment plan, the redevelopment project area, or the State Sales Tax Boundary? [65 ILCS 5/11-74.4-5 (d) (1) and 5/11-74.6-22 (d) (1)]
If yes, please enclose the amendment (labeled Attachment A).
X
Certification of the Chief Executive Officer of the municipality that the municipality has complied with all of the requirements of the Act during the preceding fiscal year. [65 ILCS 5/11-74.4-5 (d) (3) and 5/11-74.6-22 (d) (3)]
Please enclose the CEO Certification (labeled Attachment B).
X
Opinion of legal counsel that municipality is in compliance with the Act. [65 ILCS 5/11-74.4-5 (d) (4) and 5/11-74.6-22 (d) (4)]
Please enclose the Legal Counsel Opinion (labeled Attachment C). X
Statement setting forth all activities undertaken in furtherance of the objectives of the redevelopment plan, including any project implemented and a description of the redevelopment activities. [65 ILCS 5/11-74.4-5 (d) (7) (A and B) and 5/11-74.6-22 (d) (7) (A and B)]
If yes, please enclose the Activities Statement (labled Attachment D).
X
Were any agreements entered into by the municipality with regard to the disposition or redevelopment of any property within the redevelopment project area or the area within the State Sales Tax Boundary? [65 ILCS 5/11-74.4-5 (d) (7) (C) and 5/11-74.6-22 (d) (7) (C)]
If yes, please enclose the Agreement(s) (labeled Attachment E).
X
Is there additional information on the use of all funds received under this Division and steps taken by the municipality to achieve the objectives of the redevelopment plan? [65 ILCS 5/11-74.4-5 (d) (7) (D) and 5/11-74.6-22 (d) (7) (D)]
If yes, please enclose the Additional Information (labeled Attachment F).
X
Did the municipality's TIF advisors or consultants enter into contracts with entities or persons that have received or are receiving payments financed by tax increment revenues produced by the same TIF? [65 ILCS 5/11-74.4-5 (d) (7) (E) and 5/11-74.6-22 (d) (7) (E)]
If yes, please enclose the contract(s) or description of the contract(s) (labeled Attachment G).
X
Were there any reports submitted to the municipality by the joint review board? [65 ILCS 5/11-74.4-5 (d) (7) (F) and 5/11-74.6-22 (d) (7) (F)]
If yes, please enclose the Joint Review Board Report (labeled Attachment H).
X
Were any obligations issued by the municipality? [65 ILCS 5/11-74.4-5 (d) (8) (A) and 5/11-74.6-22 (d) (8) (A)]
If yes, please enclose any Official Statement (labeled Attachment I). If Attachment I is answered yes, then the Analysis
must be attached and (labeled Attachment J).
X
An analysis prepared by a financial advisor or underwriter setting forth the nature and term of obligation and projected debt service including required reserves and debt coverage. [65 ILCS 5/11-74.4-5 (d) (8) (B) and 5/11-74.6-22 (d) (8) (B)]
If attachment I is yes, then Analysis MUST be attached and (labeled Attachment J).
X
Has a cumulative of $100,000 of TIF revenue been deposited into the special tax allocation fund? 65 ILCS 5/11-74.4-5 (d) (2) and 5/11-74.6-22 (d) (2)
If yes, please enclose Audited financial statements of the special tax allocation fund
(labeled Attachment K).
X
Cumulatively, have deposits of incremental taxes revenue equal to or greater than $100,000 been made into the special tax allocation fund? [65 ILCS 5/11-74.4-5 (d) (9) and 5/11-74.6-22 (d) (9)]
If yes, the audit report shall contain a letter from the independent certified public accountant indicating compliance or
noncompliance with the requirements of subsection (q) of Section 11-74.4-3 (labeled Attachment L).
X
A list of all intergovernmental agreements in effect to which the municipality is a part, and an accounting of any money transferred or received by the municipality during that fiscal year pursuant to those intergovernmental agreements. [65 ILCS 5/11-74.4-5 (d) (10)]
If yes, please enclose the list only, not actual agreements (labeled Attachment M).
X
Please utilize the information below to properly label the Attachments.
West Evanston -TIF District 6
X
______
* Types include: Central Business District, Retail, Other Commercial, Industrial, Residential, and Combination/Mixed.
Mixed
Retail/CommercialUnder which section of the Illinois Municipal Code was Redevelopment Project Area designated? (check one):

FY 2019
Special Tax Allocation Fund Balance at Beginning of Reporting Period 620,381$
SOURCE of Revenue/Cash Receipts:
Revenue/Cash
Receipts for
Current Reporting
Year
Cumulative
Totals of
Revenue/Cash
Receipts for life
of TIF % of Total
Property Tax Increment 710,020$ 2,718,723$ 78%State Sales Tax Increment -$ 0%Local Sales Tax Increment -$ -$ 0%State Utility Tax Increment -$ -$ 0%Local Utility Tax Increment -$ -$ 0%Interest 11,794$ 26,826$ 1%Land/Building Sale Proceeds -$ 0%Bond Proceeds -$ 0%Transfers from Municipal Sources 11,311$ 22,622$ 1%Private Sources -$ 0%Other (identify source _____________; if multiple other sources, attach schedule) -$ 723,912$ 21%
All Amount Deposited in Special Tax Allocation Fund 733,125$
Cumulative Total Revenues/Cash Receipts 3,492,083$ 100%
Total Expenditures/Cash Disbursements (Carried forward from
Section 3.2)
643,030$
Transfers to Municipal Sources -$
Distribution of Surplus
Total Expenditures/Disbursements 643,030$
Net/Income/Cash Receipts Over/(Under) Cash Disbursements 90,095$
Previous Year Adjustment (Explain Below) -$
.FUND BALANCE, END OF REPORTING PERIOD* 710,476$
* If there is a positive fund balance at the end of the reporting period, you must complete Section 3.3
Previous Year Explanation:
SECTION 3.1 - (65 ILCS 5/11-74.4-5 (d)(5)(a)(b)(d)) and (65 ILCS 5/11-74.6-22 (d) (5)(a)(b)(d))
Provide an analysis of the special tax allocation fund.
West Evanston -TIF District 6

FY 2019
TIF NAME:
Amounts Reporting Fiscal Year
1,805
Transfer 30,000
31,805$
2. Annual administrative cost.
-$
3. Cost of marketing sites.
-$
-$
-$
-$
4. Property assembly cost and site preparation costs.
5. Costs of renovation, rehabilitation, reconstruction, relocation, repair or remodeling of existing public
or private building, leasehold improvements, and fixtures within a redevelopment project area.
6. Costs of the constructuion of public works or improvements.
1. Cost of studies, surveys, development of plans, and specifications. Implementation and
administration of the redevelopment plan, staff and professional service cost.
SECTION 3.2 A- (65 ILCS 5/11-74.4-5 (d) (5) (c) and 65 ILCS 5/11-74.6-22 (d) (5)(c))
Category of Permissible Redevelopment Cost [65 ILCS 5/11-74.4-3 (q) and 65 ILCS 5/11-74.6-10
(o)]
PAGE 1
ITEMIZED LIST OF ALL EXPENDITURES FROM THE SPECIAL TAX ALLOCATION FUND
(by category of permissible redevelopment project costs )
West Evanston -TIF District 6

-$
-$
611,225
611,225$
-$
-$
-$
10. Capital costs.
7. Costs of eliminating or removing contaminants and other impediments.
8. Cost of job training and retraining projects.
9. Financing costs.
PAGE 2
SECTION 3.2 A
11. Cost of reimbursing school districts for their increased costs caused by TIF assisted housing
projects.
12. Cost of reimbursing library districts for their increased costs caused by TIF assisted housing
projects.

-$
-$
-$
-$
-$
-
-$
643,030$
17. Cost of day care services.
TOTAL ITEMIZED EXPENDITURES
13. Relocation costs.
14. Payments in lieu of taxes.
15. Costs of job training, retraining, advanced vocational or career education.
16. Interest cost incurred by redeveloper or other nongovernmental persons in connection with a
redevelopment project.
SECTION 3.2 A
PAGE 3
18. Other.

FY 2019
TIF NAME:
Name Service Amount
List all vendors, including other municipal funds, that were paid in excess of $10,000 during the current reporting year.
Section 3.2 B
Optional: Information in the following sections is not required by law, but would be helpful in creating fiscal
transparency.
West Evanston -TIF District 6

FY 2019
TIF NAME:
FUND BALANCE BY SOURCE 710,476$
Amount of Original
Issuance Amount Designated
1. Description of Debt Obligations
Total Amount Designated for Obligations -$ -$
2. Description of Project Costs to be Paid
Redevelopment Project Cost Reimbursements 1,500,000$ Implementation Activities-Master Plan 1,000,000$ City TIF Reimbursement 60,000$
Total Amount Designated for Project Costs 2,560,000$
TOTAL AMOUNT DESIGNATED 2,560,000$
SURPLUS/(DEFICIT) (1,849,524)$
SECTION 3.3 - (65 ILCS 5/11-74.4-5 (d) (5d) 65 ILCS 5/11-74.6-22 (d) (5d)
Breakdown of the Balance in the Special Tax Allocation Fund At the End of the Reporting Period by source
West Evanston -TIF District 6

FY 2019
TIF NAME: West Evanston -TIF District 6
XCheck here if no property was acquired by the Municipality within the
Redevelopment Project Area.
Property Acquired by the Municipality Within the Redevelopment Project Area.
Property (1):
Street address:
Approximate size or description of property:
Purchase price:
Seller of property:
Property (2):
Street address:
Approximate size or description of property:
Purchase price:
Seller of property:
Property (3):
Street address:
Approximate size or description of property:
Purchase price:
Seller of property:
Property (4):
Street address:
Approximate size or description of property:
Purchase price:
Seller of property:
Provide a description of all property purchased by the municipality during the reporting fiscal year within theredevelopment project area.
SECTION 4 [65 ILCS 5/11-74.4-5 (d) (6) and 65 ILCS 5/11-74.6-22 (d) (6)]

TIF Name:
X
8
TOTAL: 11/1/99 to Date
Estimated Investment
for Subsequent Fiscal
Year
Total Estimated to
Complete Project
Private Investment Undertaken (See Instructions) 13,732,000$ -$ 27,926,943$
Public Investment Undertaken 172,805$ -$ 1,363,000$
Ratio of Private/Public Investment 79 20/43 20 23/47
Project 1*:LSL Industries
Private Investment Undertaken (See Instructions) 1,100,000$ 1,100,000$
Public Investment Undertaken
Ratio of Private/Public Investment 0 0
Project 2*:Church Street Townhouses
Private Investment Undertaken (See Instructions) 7,000,000$ 7,000,000$
Public Investment Undertaken
Ratio of Private/Public Investment 0 0
Project 3* Greenwood Loft
Private Investment Undertaken (See Instructions) 5,000,000$ 5,000,000$
Public Investment Undertaken
Ratio of Private/Public Investment 0 0
Project 4*: IRMCO Façade
Private Investment Undertaken (See Instructions) 13,943$
Public Investment Undertaken 200,000$
Ratio of Private/Public Investment 0 3/43
Project 5*:Northshore General Contractors Co-op
Private Investment Undertaken (See Instructions) 200,000$
Public Investment Undertaken
Ratio of Private/Public Investment 0 0
Project 6: Emerson Square
Private Investment Undertaken (See Instructions) 19,000$ 14,000,000$
Public Investment Undertaken 9,805$ 1,000,000$
Ratio of Private/Public Investment 1 15/16 14
Select ONE of the following by indicating an 'X':
SECTION 5 - 20 ILCS 620/4.7 (7)(F)
PAGE 1
FY 2019
West Evanston -TIF District 6
Page 1 is to be included with TIF report. Pages 2 and 3 are to be included ONLY if projects are listed.
1. NO projects were undertaken by the Municipality Within the Redevelopment Project Area.
2. The Municipality DID undertake projects within the Redevelopment Project Area. (If selecting this
option, complete 2a.)
2a. The total number of ALL activities undertaken in furtherance of the objectives of the redevelopment
plan:
LIST ALL projects undertaken by the Municipality Within the Redevelopment Project Area:
*PROJECT NAME TO BE LISTED AFTER PROJECT NUMBER

Project 7*:IRMCO
Private Investment Undertaken (See Instructions) 363,000$ 363,000$
Public Investment Undertaken 63,000$ 63,000$
Ratio of Private/Public Investment 5 16/21 5 16/21
Project 8*:Heartwood
Private Investment Undertaken (See Instructions) 250,000$ 250,000$
Public Investment Undertaken 100,000$ 100,000$
Ratio of Private/Public Investment 2 1/2 2 1/2
Project 9*:
Private Investment Undertaken (See Instructions)
Public Investment Undertaken
Ratio of Private/Public Investment 0 0
Project 10*:
Private Investment Undertaken (See Instructions)
Public Investment Undertaken
Ratio of Private/Public Investment 0 0
Project 11*:
Private Investment Undertaken (See Instructions)
Public Investment Undertaken
Ratio of Private/Public Investment 0 0
Project 12*:
Private Investment Undertaken (See Instructions)
Public Investment Undertaken
Ratio of Private/Public Investment 0 0
Project 13*:
Private Investment Undertaken (See Instructions)
Public Investment Undertaken
Ratio of Private/Public Investment 0 0
Project 14*:
Private Investment Undertaken (See Instructions)
Public Investment Undertaken
Ratio of Private/Public Investment 0 0
Project 15*:
Private Investment Undertaken (See Instructions)
Public Investment Undertaken
Ratio of Private/Public Investment 0 0
PAGE 2 **ATTACH ONLY IF PROJECTS ARE LISTED**
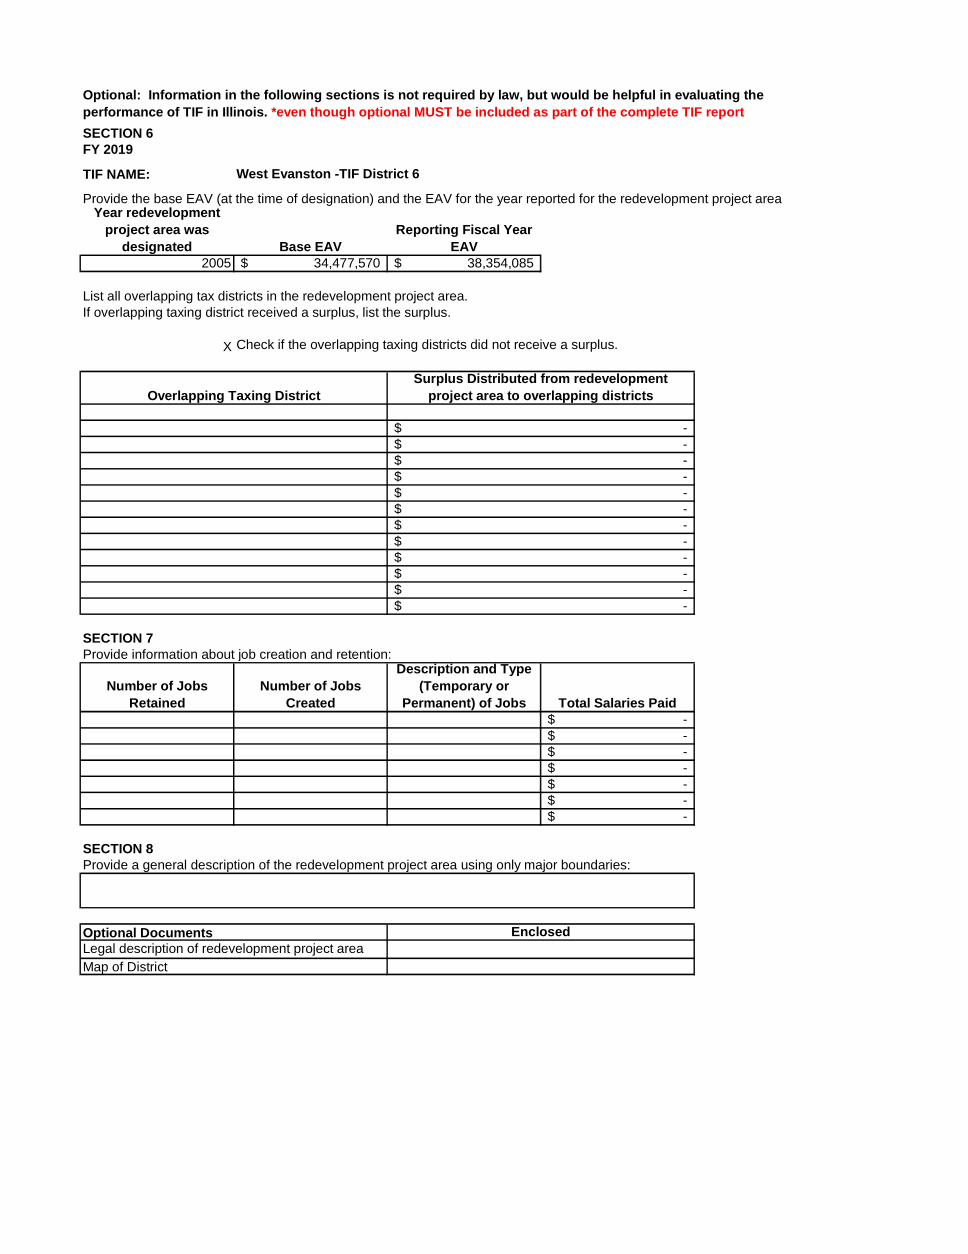
SECTION 6FY 2019
TIF NAME:
Year redevelopment
project area was
designated Base EAV
Reporting Fiscal Year
EAV2005 34,477,570$ 38,354,085$
X
SECTION 7Provide information about job creation and retention:
Number of Jobs
Retained
Number of Jobs
Created
Description and Type
(Temporary or
Permanent) of Jobs Total Salaries Paid-$ -$ -$ -$ -$ -$ -$
SECTION 8Provide a general description of the redevelopment project area using only major boundaries:
EnclosedOptional DocumentsLegal description of redevelopment project area
Map of District
-$ -$ -$
-$ -$ -$
-$ -$ -$
-$ -$ -$
Overlapping Taxing District
Surplus Distributed from redevelopment
project area to overlapping districts
Check if the overlapping taxing districts did not receive a surplus.
Optional: Information in the following sections is not required by law, but would be helpful in evaluating the
performance of TIF in Illinois. *even though optional MUST be included as part of the complete TIF report
Provide the base EAV (at the time of designation) and the EAV for the year reported for the redevelopment project area
List all overlapping tax districts in the redevelopment project area. If overlapping taxing district received a surplus, list the surplus.
West Evanston -TIF District 6

Mayor’s Office 2100 Ridge Avenue Evanston, Illinois 60201 T 847.866.2979 www.cityofevanston.org Stephen H. Hagerty Mayor
September 1, 2020 Re: West Evanston TIF District I, Stephen H. Hagerty, Mayor of the City of Evanston, County of Cook, State of Illinois, do hereby certify that to the best of my knowledge, the City of Evanston complied with the requirements pertaining to the Illinois Tax Increment Redevelopment Allocation Act during the Fiscal Year beginning January 1, 2019 and ending December 31, 2019. ______________________________ ____________________________ MAYOR DATE
09 / 09 / 2020
Doc ID: b394202f38fd3d18314c2d680eec98f98e426656

Law Department 2100 Ridge Avenue Evanston, Illinois 60201 T 847.448.8009 www.cityofevanston.org Kelley A. Gandurski Corporation Counsel
September 1, 2020 RE: Attorney Review City of West Evanston TIF District
To Whom It May Concern: This will confirm that I am the City Attorney for the City of Evanston, Illinois. I have reviewed all information provided to me by the City staff and consultants, and I find that the City of Evanston has conformed to all applicable requirements of the Illinois Tax Increment Redevelopment Allocation Act set forth thereunder for the Fiscal Year beginning January 1, 2019 and ending December 31, 2019, to the best of my knowledge and belief. Very truly yours, Corporation Counsel
Doc ID: b394202f38fd3d18314c2d680eec98f98e426656

Attachment D Statement setting forth all activities undertaken in furtherance of the objectives of the Redevelopment Plan, including:
A. Any project implemented during the reporting Period; and
B. A description of the redevelopment activities undertaken.
No new projects were undertaken by the City in the reporting Period. The City continued to monitor redevelopment activities.

City of Evanston, Illinois
_________________________________________________________________
Comprehensive Annual Financial Report
For the Year Ended December 31, 2019

CITY OF EVANSTON, ILLINOIS
COMPREHENSIVE ANNUAL
FINANCIAL REPORT
For the Year Ended
December 31, 2019
Prepared by the Finance Division of the City Manager’s Office

CITY OF EVANSTON, ILLINOIS
TABLE OF CONTENTS
Page(s)
INTRODUCTORY SECTION
Principal Officials ......................................................................................................... i
Organization Chart ........................................................................................................ ii
Certificate of Achievement for Excellence in Financial Reporting .............................. iii
Letter of Transmittal ..................................................................................................... iv-xii
FINANCIAL SECTION
INDEPENDENT AUDITOR’S REPORT .................................................................... 1-3
GENERAL PURPOSE EXTERNAL FINANCIAL STATEMENTS
Management’s Discussion and Analysis .................................................................. MD&A 1-8
Basic Financial Statements
Government-Wide Financial Statements
Statement of Net Position ............................................................................... 4-5
Statement of Activities ................................................................................... 6-7
Fund Financial Statements
Governmental Funds
Balance Sheet ............................................................................................. 8-9
Reconciliation of Fund Balances of Governmental Funds to
the Governmental Activities in the Statement of Net Position ................ 10
Statement of Revenues, Expenditures, and
Changes in Fund Balances ....................................................................... 11
Reconciliation of Governmental Funds Statement of Revenues,
Expenditures, and Changes in Fund Balances to the Governmental
Activities in the Statement of Activities .................................................. 12

CITY OF EVANSTON, ILLINOIS
TABLE OF CONTENTS (Continued)
Page(s)
FINANCIAL SECTION (Continued)
GENERAL PURPOSE EXTERNAL FINANCIAL STATEMENTS (Continued)
Basic Financial Statements (Continued)
Fund Financial Statements (Continued)
Proprietary Funds
Statement of Net Position .......................................................................... 13-14
Statement of Revenues, Expenses, and
Changes in Fund Net Position ................................................................. 15
Statement of Cash Flows ........................................................................... 16-17
Fiduciary Funds
Statement of Fiduciary Net Position .......................................................... 18
Statement of Changes in Fiduciary Net Position ....................................... 19
Notes to Financial Statements ............................................................................. 20-77
Required Supplementary Information
Schedule of Changes in the Employer’s Total OPEB Liability and Related Ratios Other Postemployment Benefits Plan ................................................................. 78
Schedule of Employer Contribution
Illinois Municipal Retirement Fund ............................................................... 79
Police Pension Fund ....................................................................................... 80
Firefighters' Pension Fund .............................................................................. 81
Schedule of Changes in the Employer’s Net Pension Liability
and Related Ratios
Illinois Municipal Retirement Fund ................................................................ 82
Police Pension Fund ....................................................................................... 83
Firefighters’ Pension Fund ............................................................................. 84
Schedule of Revenues, Expenditures, and Changes in Fund Balance -
Budget and Actual - General Fund .................................................................... 85

CITY OF EVANSTON, ILLINOIS
TABLE OF CONTENTS (Continued)
Page(s)
FINANCIAL SECTION (Continued)
GENERAL PURPOSE EXTERNAL FINANCIAL STATEMENTS (Continued)
Required Supplementary Information (Continued)
Schedule of Investment Returns
Police Pension Fund ....................................................................................... 86
Firefighters’ Pension Fund ............................................................................. 87
Notes to Required Supplementary Information .................................................. 88
COMBINING AND INDIVIDUAL FUND
FINANCIAL STATEMENTS AND SCHEDULES
MAJOR GOVERNMENTAL FUNDS
Schedule of Revenues - Budget and Actual - General Fund ............................... 89-92
Schedule of Expenditures - Budget and Actual - General Fund ......................... 93
Schedule of Revenues, Expenditures, and
Changes in Fund Balances - Budget and Actual
Crown Capital Fund ............................................................................................ 94
General Obligation Debt Fund ............................................................................ 95
NONMAJOR GOVERNMENTAL FUNDS
Combining Balance Sheet ................................................................................... 96-99
Combining Statement of Revenues, Expenditures,
and Changes in Fund Balances .......................................................................... 100-103
Schedule of Revenues, Expenditures, and
Changes in Fund Balance - Budget and Actual
Motor Fuel Tax Fund ...................................................................................... 104
Emergency Telephone System Fund .............................................................. 105
Neighborhood Improvement Fund ................................................................. 106
Affordable Housing Fund ............................................................................... 107
HOME Fund ................................................................................................... 108
Community Development Block Grant Fund ................................................. 109
Schedule of Expenditures - Budget and Actual (Budgetary Basis)
Community Development Block Grant Fund ................................................. 110-111
Schedule of Revenues, Expenditures, and
Changes in Fund Balance - Budget and Actual
Community Development Loan Fund ............................................................ 112
Special Service District No. 4 Fund ............................................................... 113

CITY OF EVANSTON, ILLINOIS
TABLE OF CONTENTS (Continued)
Page(s)
FINANCIAL SECTION (Continued)
COMBINING AND INDIVIDUAL FUND
FINANCIAL STATEMENTS AND SCHEDULES (Continued)
NONMAJOR GOVERNMENTAL FUNDS (Continued)
Schedule of Revenues, Expenditures, and
Changes in Fund Balance - Budget and Actual
Good Neighbor Fund ...................................................................................... 114
General Assistance Fund ................................................................................ 115
Capital Improvements Fund ........................................................................... 116
Special Assessment Capital Projects Fund ..................................................... 117
Combining Schedule of Revenues, Expenditures, and
Changes in Fund Balances - Budget and Actual - Debt Service Funds ............ 118-119
ENTERPRISE FUNDS
Water Fund
Schedule of Revenues, Expenses, and Changes in Net Position -
Budget and Actual ........................................................................................ 120
Water Fund - Operation and Maintenance Account
Schedule of Operating Revenues - Budget and Actual .................................. 121
INTERNAL SERVICE FUNDS
Combining Statement of Net Position ................................................................. 122
Combining Statement of Revenues, Expenses, and
Changes in Net Position .................................................................................... 123
Combining Statement of Cash Flows .................................................................. 124
COMPONENT UNIT - PUBLIC LIBRARY
All Governmental Funds
Combining Balance Sheet/Statement of Net Position .................................... 125-126
Combining Statement of Revenues, Expenditures, and
Changes in Fund Balances/Statement of Activities ...................................... 127-128

CITY OF EVANSTON, ILLINOIS
TABLE OF CONTENTS (Continued)
Page(s)
FINANCIAL SECTION (Continued)
COMBINING AND INDIVIDUAL FUND
FINANCIAL STATEMENTS AND SCHEDULES (Continued)
COMPONENT UNIT - PUBLIC LIBRARY (Continued)
Major Governmental Funds
Library Operating Fund
Schedule of Revenues, Expenditures, and Changes in
Fund Balance - Budget and Actual .......................................................... 129
SUPPLEMENTAL DATA
Consolidated Year End Financial Report ..................................................................... 130
STATISTICAL SECTION
Net Position by Component .......................................................................................... 131-132
Changes in Net Position ................................................................................................ 133-136
Fund Balances, Governmental Funds ........................................................................... 137-138
Changes in Fund Balances, Governmental Funds ........................................................ 139-140
Equalized Assessed Value and Actual Value of Taxable Property .............................. 141
Principal Property Taxpayers ........................................................................................ 142
Property Tax Levies and Collections ............................................................................ 143
Ratios of General Bonded Debt Outstanding ................................................................ 144
Ratios of Outstanding Debt by Type ............................................................................ 145
Direct and Overlapping Governmental Activities Debt ................................................ 146
Legal Debt Margin ........................................................................................................ 147
Pledged-Revenue Coverage .......................................................................................... 148
Demographic and Economic Statistics ......................................................................... 149
Principal Employers ...................................................................................................... 150
Full-Time Equivalent City Government Employees by Function ................................ 151
Property Tax Rates per $100 - Direct and Overlapping Governments ......................... 152
Water Sold by Type of Customer (in 100 cubic feet) ................................................... 152
Water Sold by Major Customers................................................................................... 154
Operating Indicators by Function/Program .................................................................. 155
Capital Assets Statistics by Function ............................................................................ 156
COMPLIANCE SECTION
INDEPENDENT ACCOUNTANT’S REPORT ON COMPLIANCE
WITH STATE OF ILLINOIS PUBLIC ACT 85-1142 .............................................. 157

INTRODUCTORY SECTION

- i -
CITY OF EVANSTON
Principal Officials
December 31, 2019
______________________________________________________________________
LEGISLATIVE
Stephen H. Hagerty, Mayor
Judy Fiske 1st Ward
Peter Braithwaite 2nd Ward
Melissa A. Wynne 3rd Ward
Donald N. Wilson 4th Ward
Robin Rue Simmons 5th Ward
Thomas M. Suffredin 6th Ward
Eleanor Revelle 7th Ward
Ann Rainey 8th Ward
Cicely L. Fleming 9th Ward
Devon Reid, City Clerk
EXECUTIVE
Erika Storlie, Interim City Manager Kimberly Richardson, Deputy City Manager
Hitesh Desai, CFO / Treasurer
ADMINISTRATIVE
Interim Administrative Services Director City Attorney Luke Stowe Health and Human Services Director Ikenga Ogbo Community Development Director Johanna Leonard
Parks, Recreation, & Community Services Director Lawrence Hemingway
Michelle Masoncup
Public Works Agency Director Dave Stoneback Police Chief Demitrous Cook Fire Chief
Brian Scott
Library Director Karen Danczak Lyons

City of Evanston
Organizational Chart
- ii -
Residents
Mayor City Council
City Clerk
Police
Fire Community
Development
Public Works Agency
Health and
Human
Services
Parks, Recreation & Community
Services
Law
Administrative Services
City Manager Assistant City
Manager CFO/City
Treasurer
Boards and Commissions
Library

- iii -

City Manager’s Office 2100 Ridge Avenue
Evanston, Illinois 60201-2798 T 847.866.2936
TTY 847.448.8064 www.cityofevanston.org
July 14, 2020 The Honorable Mayor Stephen H. Hagerty, Members of the City Council City of Evanston, Illinois INTRODUCTION
The Comprehensive Annual Financial Report (CAFR) of the City of Evanston (City) for the fiscal year ended December 31, 2019 is hereby submitted. The CAFR is prepared by the City’s Finance Division in accordance with the financial reporting principles and standards set forth by the Governmental Accounting Standards Board (GASB). Responsibility for both the accuracy of the data and the completeness and fairness of the presentation, including all disclosures, rests with the City. We believe the enclosed data is accurate in all material respects and is reported in a manner designed to fairly present the financial position and results of operations of the various funds and capital assets of the City. All disclosures needed to enable the reader to understand the City's financial activities have been included. This report consists of management’s representations concerning the finances of the City of Evanston for the period of January 1, 2019 to December 31, 2019. Management assumes full responsibility for the completeness and reliability of all of the information presented in this report. To provide a reasonable basis for making these representations, City management has established a comprehensive internal control framework that is designed to both protect the government’s assets from loss, theft, or misuse and to compile sufficient, reliable information for the preparation of the City of Evanston’s financial statements in conformity with Generally Accepted Accounting Principles (GAAP) within the United States of America. Because the cost of internal controls should not outweigh their benefits, the City’s comprehensive framework of internal controls has been designed to provide reasonable, rather than absolute, assurance that the financial statements will be free from material misstatement. As management, we assert that to the best of our knowledge and belief, this financial report is complete and reliable in all material respects. The City is required to undergo an annual single audit in conformity with the provisions of the Single Audit Act of 1984 as amended and U.S. Office of Management and Budget Circular A-133, Audits of States, Local Governments, and Non-Profit Organizations. Information related to this single audit, including the schedule of federal financial assistance, findings and recommendations, and auditors' reports on the internal control
- iv -

2100 Ridge AvenueEvanston, Illinois 60201-2798
T 847.328.2100TTY 847.448 8064
www.cityofevanston.org
structure and compliance with applicable laws and regulations, is to be presented in aseparate single audit report.
The attached report includes all the funds and capital assets of the City and itscomponent unit, the Evanston Library. The Town of the City of Evanston (the Township)has been previously presented as a separate legal entity which administered GeneralAssistance for food, shelter and medical needs. Effective May 1, 2014, the City ofEvanston assumed all the responsibility of providing the services that were previouslyprovided by the Township. Audits after 2014 include the functions of the Township.
Library activity numbers are shown separately as a discrete component unit based onan ordinance passed by the City Council on March 10, 2012 giving the Libraryindependence in running day to day operations. The Library has a separate Boardwhose members are appointed by the Mayor.
The City’s financial statements have been audited by Sikich, LLP, a firm of licensedcertified public accountants. The goal of the independent audit is to provide reasonableassurance that the financial statements of the City of Evanston for the fiscal year endedDecember 31, 2019, are free of material misstatement. The independent audit involvedexamining, on a test basis, evidence supporting the amounts and disclosures in thefinancial statements, assessing the accounting principles used and significant estimatesby management, and evaluating the overall financial statement presentation. Theindependent auditors concluded, based upon the audit, that there was a reasonablebasis for rendering an unmodified opinion that the City’s financial statements for thefiscal year ended December 31, 2019, are fairly presented in conformity with GAAP.The independent auditors’ report is presented as the first component of the financialsection of this report.
GAAP requires that management provide a narrative introduction, overview, andanalysis to accompany the basic financial statements in the form of Management’sDiscussion and Analysis (MD&A). This letter of transmittal is designed to complementthe MD&A and should be read in conjunction with it. The City’s MD&A can be foundimmediately following the report of the independent auditors.
PROFILE OF THE CITY OF EVANSTON
The City: The City of Evanston constitutes many communities, perspectives, andqualities as a Chicago suburb with a major university, urban center, and lakefront.Evanston has apartments, condominiums, and student housing; its residents arecommuters and locally employed workers; its downtown is prospering, andneighborhood commercial centers are also stable. It is a part of the Chicago-landeconomy and has a vigorous commercial and professional economy of its own. Apopulation of approximately 75,000 is diverse by race, religion, age, education,
Doc ID: c8b3ded5ca0952fb7d29e2a0c4067a9d1f953aae
- v -

2100 Ridge AvenueEvanston, Illinois 60201-2798
T 847.328.2100TTY 847.448 8064
www.cityofevanston.org
economics, and occupation. With 8,700 people per square mile, Evanston has doublethe population density of the average North and Northwest suburb, and approximatelyhalf the density of Chicago. The City has over 260 acres in 75 parks and 5 beaches.
Evanston is contiguous with Chicago, and only 13 miles by rapid transit, commuter rail,expressway, or parkway from downtown Chicago. It borders the north shorecommunities of Skokie and Wilmette.
In 1863, the Village of Evanston was incorporated as a town, and after severalannexations in 1892, the town became a city. The City’s southern boundary ofapproximately eight square miles was established with the City of Chicago and thepresent City limits. The City also has four miles of shoreline along Lake Michigan.
Evanston is the home of Northwestern University, aptly named to serve the NorthwestTerritory. The University first platted the village which surrounded it. The continuedvitality of the University and the cooperative relationship between the City andUniversity adds to the total Evanston community.
The Government: The City is a home rule municipality under the Illinois Constitution.As such, it has no tax rate or debt limits imposed by Illinois statute, nor is it required toconduct a referendum to authorize the increase of debt or the imposition of real estateproperty taxes.
The City has a Council/Manager form of government with an elected Mayor. The Mayoris elected to a four-year term. The Aldermen each represent one of nine wards and areelected to terms of four years. The City Council is organized into four standingcommittees: Administration and Public Works, Human Services, Planning andDevelopment, and Rules. The City Council has also established several specialcommittees, commissions and advisory boards.
The City Manager is the Chief Executive Officer of the City and is responsible for themanagement of all City operations under the direction of the City Council. The CityManager appoints and supervises the directors of the City’s 10 departments.
The City provides a broad range of municipal services, including police and fireprotection, streets and parking, water and sewer service, public libraries, healthservices, lakefront beaches, parks and recreation activities, cultural events, andcommunity and economic development activities.
Schools are provided by separate school districts which are governed by elected schoolboards. A portion of the City is served by the Skokie Park District. Wastewatertreatment is provided by the Metropolitan Water Reclamation District.
Doc ID: c8b3ded5ca0952fb7d29e2a0c4067a9d1f953aae
- vi -

2100 Ridge AvenueEvanston, Illinois 60201-2798
T 847.328.2100TTY 847.448 8064
www.cityofevanston.org
Budget Process: The City’s fiscal year 2020 began on January 1, 2020. The CityManager submitted to the City Council a proposed operating budget in October 2019 forthe fiscal year 2020 commencing the following January 1. The City budget team startedthe budget process for fiscal year 2020 in late summer followed by meeting with alldepartments for their individual budgets. The Council adopted the 2020 budget inNovember 2019. The City operates under the Illinois Budget Act, adopting a budget byResolution. All Funds are included in the Resolution.
The City is committed to long-term financial planning. The City Council resolved duringthe 2020 budget process to adopt budgets in 2020 and 2021 with a General Fundsurplus in order to meet the Council adopted fund balance target for the General Fund.The City is adopting a two-year budget for 2020 and 2021 in order to implement multi-year solutions. The 2020-2021 budget documents will include five-year financialprojections for all funds. The City closely monitors factors that contribute to long-termfinancial stability, including, bond ratings, debt ratios, and equalized assessed valuation.The City is also pursuing strategies to expand the City's revenue base and diversifyrevenue sources.
The City Manager is authorized to transfer budgeted amounts between departmentswithin any fund (such as the General Fund). However, any revisions that alter the totalexpenditures of any fund must be approved by the City Council.
Budgets are legally adopted on a basis consistent with accounting principles generallyaccepted in the United States of America. For purposes of preparing the General Fundschedule of revenues (budget and actual), GAAP revenue and expenditures have beenadjusted to the budgetary basis. The budgets of the governmental type funds areprepared on a cash basis. The Comprehensive Annual Financial Report (CAFR) of theCity presents expenditures and revenues on both a GAAP basis and a budgetary basisfor comparison.
Fund Accounting: The City uses funds to report on both its financial position andresults of its operations. Fund accounting is designated to demonstrate legalcompliance and to aid in financial management by segregating transactions related tocertain City functions or activities. Each fund is a separate, self-balancing accountingentity. In the City, there are three categories of funds: governmental, proprietary andfiduciary. Governmental funds are used to account for all or most of the City’s generalactivities, including the collection and disbursement of earmarked monies (specialrevenue funds), the acquisition or construction of capital assets (capital project funds),and the servicing of general long-term debt (debt service funds). The General Fund isused to account for all activities of the City not accounted for in other funds. In the fiscalyear 2020, the City projects that 36.5% ($117.2 million-including transfers) of all Cityexpenditures will occur in the General Fund. Other major funds include the CapitalImprovement, General Obligation Debt, Parking, Water, and Sewer Funds.
Doc ID: c8b3ded5ca0952fb7d29e2a0c4067a9d1f953aae
- vii -

2100 Ridge AvenueEvanston, Illinois 60201-2798
T 847.328.2100TTY 847.448 8064
www.cityofevanston.org
The Enterprise Funds (Water, Parking, Solid Waste Fund and Sewer) are operated andbudgeted on a full accrual basis. Expenditures are recognized when a commitment ismade, and revenues are recognized when they are obligated to the City (For example,water user fees are recognized as revenue when bills are produced).
Financial Control Procedures: The City reports financial results based on generallyaccepted accounting principles as promulgated by the GASB. The accounts of the Cityare divided into separate self-balancing funds comprised of its assets, liabilities, fundequity, revenues, and expenditures, as appropriate. The City’s expenditures are monitored on a regular basis by the Finance Department.Disbursements are made by fund and only if expenditures are within the authorizedbudget.
MAJOR INITIATIVES – FISCAL YEAR 2020
Following are annual goals and major initiatives by department as a part of budgetdocument preparation.
The Law Department will: Work with City Council and staff to secure new economic andcommunity development opportunities. Continue to work with City Council and staff tostandardize and improve uniformity amongst City Boards and Commissions and theirrespective City Code Sections. Continue to litigate a substantial majority of cases in-house and seek to prevail at summary disposition or trial in litigation. Analyze andevaluate the City’s purchasing contracts for all types of contracts.
The Administrative Services Department will: Focus on the timing of purchases/costsacross all divisions to further increase operational efficiency and reduce the potential fordelays and poor resource allocation. Continue citywide implementation and roll-outof Google Apps. Expand vehicle GPS program to include Fire and Police vehicles.
Continue to analyze internal service and operational data through an equity lens.Continued decrease of paper HR processes. Continued use of online software
systems for learning management, performance management and timekeeping.Continue to use an alternative sustainable fuel source for City vehicles. Request for proposal for parking review (citations, fees and general areas that
need improvement)
The Community Development Department will: Promoting neighborhood revitalization,ensuring a safe built environment and affordable housing and providing first-last miletransportation connections will continue to be major priorities of the CommunityDevelopment Department. Improve procedures for processing building permits,
Doc ID: c8b3ded5ca0952fb7d29e2a0c4067a9d1f953aae
- viii -

2100 Ridge AvenueEvanston, Illinois 60201-2798
T 847.328.2100TTY 847.448 8064
www.cityofevanston.org
plan review process and contractor registrations. Continue to review and proposeamendments to the Zoning Ordinance. Promote neighborhood revitalization, ensuring asafe built environment and affordable housing and providing first-last mile transportationconnections
The Economic Development division which was part of the Community DevelopmentDepartment is now part of the City Manager’s Office. They will: Encourage women- andminority-owned startups through Entrepreneurship Support Grant. Increase marketingand leasing efforts in every merchant district to support the vitality of Evanston’sbusiness community, including marketing city-owned space on Howard Street andimplement SSA on Central Street. Lead efforts for business retention and newdevelopment of properties in the West Evanston TIF district including City-ownedproperty at Church and Darrow.
The Police Department will: Complete the body-worn camera program in conjunctionwith Northwestern University. Implement and distribute STARCOM radios from thecurrent UHF T-Band frequency. Install National Incident-Based Reporting System(NIBRS) that will become federally mandated in 2020. Continue implementation ofthe accepted recommendations from Hillard Heintze staffing study. Managemandated training required by State law, Illinois Police Training Board, and IllinoisAttorney General. Develop fleet plan to reduce the cost of Police vehicle purchases
The Fire Department will: Conduct a promotional exam for the position of FireApparatus Operator. In cooperation with Human Resources, the Department willconduct a promotional exam for the position of Fire Captain and Fire Shift Chief.
Work with City Departments and the business community on enhancedemergency preparedness and continuity of operations as well expanding our communityoutreach of the City’s EvanstonAlerts Emergency Notification System. Offer theopportunity to complete Pediatric Advanced Life Support (PALS) certification. Work withOakton Community College on implementing an apprenticeship program aimed atpreparing Evanston residents for a career in the fire service. Offer communityengagement programs. Continue the ECHO (Evanston Community Health Outreach)program with AMITA St. Francis Hospital.
The Health and Human Services Department will: Increase awareness of leadpoisoning in children by providing education, prevention tools, lead hazard mitigationand provision of resources. Partner with Community Action Advocates to increasevisibility of social services support to vulnerable populations. Increase outreachand participants for We’re Out Walking (WOW) and the Rethink Your Drink programs.
Implement the application of suitable software for the FDA inspections. Createa clearinghouse of data to better measure health equity achievements. Create acommunity cohort of Seeking Educational Equity and Diversity (SEED) members.
Commence the process for the City’s Project for Local Assessment of Needs,
Doc ID: c8b3ded5ca0952fb7d29e2a0c4067a9d1f953aae
- ix -

2100 Ridge AvenueEvanston, Illinois 60201-2798
T 847.328.2100TTY 847.448 8064
www.cityofevanston.org
EPLAN for the State’s recertification of the Health and Human Services Department.
The Public Works Agency will: Begin construction on the Howard Street CorridorImprovements project. Begin construction on the Central Street Bridge Replacementproject. Complete the construction of the new Robert Crown Community Center,Library and Ice Complex project (including both the building and the site improvements).
Replace approximately 35 light fixtures in street light poles with new LED fixturesin conformance with the Street Light Master Plan. Receive proposals and award acontract for the Commercial, Business, Institutional and Multi-Family ResidentialBuildings Solid Waste Franchise Services.
The Parks, Recreation and Community Services will: Create a new City widespecial event for the community to enjoy. Increase the overall numberof participants in tennis and pickle ball. Maintain and encourage additionalpartnerships with other recreational groups or individuals to further enhanceand diversify the programs available to residents at the Robert CrownCommunity Center. O er a new full day and half day Creative PlayPreschool program at the Robert Crown Community Center. Execute andimplement cooperative agreements to o er visual arts programming and too er a concessionaire at the Robert Crown Community Center. Install a!oating dock system inside the Church Street Boat launch area for both PRCSboats and EFD jet skis to be kept throughout the season and make theseresources more readily available in the event of an emergency. Create morepartnerships with community organizations to bring more programming intothe Levy Center.
Library operations are shown separately in the City’s Comprehensive Annual FinancialReport as a discrete component unit. The Evanston Public Library promotes thedevelopment of independent, self-confident, and literate citizens through the provision ofopen access to cultural, intellectual, and informational resources for all ages.
FACTORS AFFECTING FINANCIAL CONDITION
The following are factors which could give a broader context to the financial informationcontained in this CAFR report.
Local Economy: During 2019, the City realized that some of the major revenues in theGeneral Fund would vary from their budgeted numbers. Some of the revenues whichperformed better than budget are:
State Income Tax and Use Tax Transportation Network Provider Tax
Doc ID: c8b3ded5ca0952fb7d29e2a0c4067a9d1f953aae
- x -

2100 Ridge AvenueEvanston, Illinois 60201-2798
T 847.328.2100TTY 847.448 8064
www.cityofevanston.org
Building Permits Athletic Tax
Some of the revenues which were lower than budget estimates are as follows: Wheel Tax Real Estate Transfer Tax Utility Taxes Local Motor Fuel tax
Based on this forecast, the city staff continually reviewed revenues and expenses forany major negative impact. The Budget Team periodically met with departments to goover and identify any discrepancies early on in the year. All departments wererequested to avoid incurring non-essential expenses during the latter part of the year.
The City ended FY2019 for General Fund with operating surplus of little over $2.0million compared to a budgeted surplus of $1.7 million. Total actual revenues arereported at $117.2 million compared to a budgeted number of $115.8 million. Actualexpenditures are reported at $115.1 million against the budgeted expenditure of $114.1million.
Overall, General Fund expenditures are at 101% of budgeted expenditures withCommunity Development and Health Department reporting less than 100%expenditures for FY 2019. Police and Fire departments are reporting slightly higher thantheir budgeted numbers.
AWARDS AND ACKNOWLEDGMENTS The Government Finance Officers Association (GFOA) awarded a Certificate ofAchievement for Excellence in Financial Reporting to the City for its comprehensiveannual financial report for the fiscal year ended December 31, 2018. In order to beawarded a Certificate of Achievement, the government published an easily readableand efficiently organized comprehensive annual financial report. This report satisfiedboth generally accepted accounting principles and applicable legal requirements.
A Certificate of Achievement is valid for a period of one year only. We believe that ourcurrent comprehensive annual financial report continues to meet the Certificate ofAchievement Program's requirements, and we are submitting it to the GFOA todetermine its eligibility for another certificate.
In addition, the City also received the GFOA's Award for Distinguished BudgetPresentation for its annual 2019 budget. In order to qualify for the Distinguished Budget
Doc ID: c8b3ded5ca0952fb7d29e2a0c4067a9d1f953aae
- xi -

2100 Ridge AvenueEvanston, Illinois 60201-2798
T 847.328.2100TTY 847.448 8064
www.cityofevanston.org
Presentation Award, the government's budget document was judged to be proficient inseveral categories, including policy documentation, financial planning, and organization.The City has already applied for the GFOA Award for its annual 2020 budget.
We acknowledge the contributions and excellent work of Andy Villamin, Melita Roque,and Nazmeen Ali in preparing the financial statements. Appreciation is also extended toall other Finance Division and City Staff who contributed to the preparation of thisreport. We also express gratitude to the Mayor’s Office and Members of City Council fortheir interest and support in planning and conducting the City’s financial affairs.
Respectfully submitted,
_______________________________ _______________________________
Erika Storlie Hitesh DesaiInterim City Manager Chief Financial Officer/Treasurer
Doc ID: c8b3ded5ca0952fb7d29e2a0c4067a9d1f953aae
- xii -

FINANCIAL SECTION

1415 West Diehl Road, Suite 400
Naperville, IL 60563
630.566.8400
INDEPENDENT AUDITOR’S REPORT
The Honorable Stephen H. Hagerty, Mayor and Members of the City Council City of Evanston, Illinois We have audited the accompanying financial statements of the governmental activities, the business-type activities, the discretely presented component unit, each major fund, and the aggregate remaining fund information of the City of Evanston, Illinois (the City), as of and for the year ended December 31, 2019, and the related notes to the financial statements, which collectively comprise the City’s basic financial statements as listed in the table of contents. Management’s Responsibility for the Financial Statements
Management is responsible for the preparation and fair presentation of these financial statements in accordance with accounting principles generally accepted in the United States of America; this includes the design, implementation, and maintenance of internal control relevant to the preparation and fair presentation of financial statements that are free from material misstatement, whether due to fraud or error. Auditor’s Responsibility
Our responsibility is to express opinions on these financial statements based on our audit. We conducted our audit in accordance with auditing standards generally accepted in the United States of America and the standards applicable to financial audits contained in Government Auditing Standards, issued by the Comptroller General of the United States. The financial statements of the Evanston Public Library were not audited in accordance with Government Auditing Standards. Those standards require that we plan and perform the audit to obtain reasonable assurance about whether the financial statements are free of material misstatement. An audit involves performing procedures to obtain audit evidence about the amounts and disclosures in the financial statements. The procedures selected depend on the auditor’s judgment, including the assessment of the risks of material misstatement of the financial statements, whether due to fraud or error. In making those risk assessments, the auditor considers internal control relevant to the City’s preparation and fair presentation of the financial statements in order to design audit procedures that are appropriate in the circumstances, but not for the purpose of expressing an opinion on the effectiveness of the City’s internal control. Accordingly, we express no such opinion. An audit also includes evaluating the appropriateness of accounting policies used and the reasonableness of significant accounting estimates made by management, as well as evaluating the overall presentation of the financial statements.
- 1 -

- 2 -
We believe that the audit evidence we have obtained is sufficient and appropriate to provide a basis for our audit opinions.
Opinions
In our opinion, the financial statements referred to above present fairly, in all material respects, the respective financial position of the governmental activities, the business-type activities, the discretely presented component unit, each major fund, and the aggregate remaining fund information of the City of Evanston, Illinois, as of December 31, 2019, and the respective changes in financial position, and, where applicable, cash flows thereof for the year ended in conformity with accounting principles generally accepted in the United States of America.
Change in Accounting Principle
The City adopted GASB Statement No. 84, Fiduciary Activities, which established standards for reporting fiduciary funds and modified certain disclosures in the notes to the financial statements. Our opinion is not modified with respect to these matters. Other Matters
Required Supplementary Information
Accounting principles generally accepted in the United States of America require that the management’s discussion and analysis and the other required supplementary information be presented to supplement the basic financial statements. Such information, although not a part of the basic financial statements, is required by the Governmental Accounting Standards Board, who considers it to be an essential part of financial reporting for placing the basic financial statements in an appropriate operational, economic, or historical context. We have applied certain limited procedures to the required supplementary information in accordance with auditing standards generally accepted in the United States of America, which consisted of inquiries of management about the methods of preparing the information and comparing the information for consistency with management’s responses to our inquiries, the basic financial statements, and other knowledge we obtained during our audit of the basic financial statements. We do not express an opinion or provide any assurance on the information because the limited procedures do not provide us with sufficient evidence to express an opinion or provide any assurance. Other Information
Our audit was conducted for the purpose of forming opinions on the financial statements that collectively comprise the City’s basic financial statements as a whole. The introductory section, combining and individual fund financial statements and schedules, and statistical section are presented for purposes of additional analysis and are not a required part of the basic financial statements. The combining and individual fund financial statements and schedules are the responsibility of management and were derived from and relate directly to the underlying accounting and other records used to prepare the basic financial statements. The information has been subjected to the auditing procedures applied in the audit of the basic financial statements and certain additional procedures, including comparing and reconciling such information directly to the underlying accounting and other records used to prepare the basic financial statements or
- 2 -

- 3 -
to the basic financial statements themselves, and other additional procedures in accordance with auditing standards generally accepted in the United States of America. In our opinion, the information is fairly stated in all material respects in relation to the basic financial statements as a whole. The introductory and statistical sections have not been subjected to the auditing procedures applied in the audit of the basic financial statements and, accordingly, we do not express an opinion or provide any assurance on them. Other Reporting Required by Government Auditing Standards In accordance with Governmental Auditing Standards, we have also issued our report dated July 14, 2020 on our consideration of the City’s internal control over financial reporting and on
our tests of its compliance with certain provisions of laws, regulations, contracts and grant agreements, and other matters. The purpose of that report is to describe the scope of our testing of internal control over financial reporting and compliance and the results of that testing and not to provide an opinion on internal control over financial reporting or on compliance. That report is an integral part of an audit performed in accordance with Governmental Auditing Standards in considering the City’s internal control over financial reporting and compliance. Naperville, Illinois July 14, 2020
- 3 -

GENERAL PURPOSE EXTERNAL
FINANCIAL STATEMENTS

(Unaudited)
MD&A 1
MANAGEMENT’S
DISCUSSION AND ANALYSIS
DECEMBER 31, 2019
The City of Evanston (the City) Discussion and Analysis is designed to (1) assist the reader in focusing on
significant financial issues, (2) provide an overview of the City's financial activity, (3) identify changes in
the City's financial position (its ability to address the next and subsequent year challenges), (4) identify any
material deviations from the financial plan (the approved budget), and (5) identify individual fund issues
or concerns. We encourage readers to consider the information presented here in conjunction with
additional information that we have furnished in our letter of transmittal, which can be found on page 4 of
this report.
FINANCIAL HIGHLIGHTS
A. The City's net position increased by $24,108,172 from the prior fiscal year. The governmental net
position increased by $21,078,962 or 15.8% from the prior period and the business-type activities net
position increased by $3,030,711 or 1.0% from the prior period.
B. The governmental activities revenue increased by $6,359,434 or 4.7% from the prior period principally
due to increase in capital grants and contributions. The expenses decreased by $25,402,837 or 16.4%
principally due to a decrease in public safety related expenses.
C. The business-type activities revenue increased by $6,373,802 or 16.4% principally due to increase in
charges for services. The expenses increased by $178,159 or 0.5% from the prior period.
D. The total cost of all City programs decreased by $25,224,678 or 13.4%. This decrease was mainly
attributable to a decrease in public safety related expenses.
E. Total assets of the City increased by$42,881,437 mainly due to increase in capital assets; while total
liabilities went up by $51,144,531 due to bond issuance.
F. Deferred outflows and inflows resources of the City had a net deferred outflows increase of
$32,371,266 principally due to increase in IMRF pension items.
USING THIS ANNUAL REPORT
The financial statements focus on both the City as a whole (government-wide) and on the major individual
funds. Both perspectives (government-wide and major fund) allow the user to address relevant questions,
broaden a basis for comparison and enhance the City's accountability.

(Unaudited)
MD&A 2
The City's financial reporting includes the funds of the City (primary government) and additionally,
organizations for which the City is accountable (component unit - the Library). Effective May 1, 2014 the
City of Evanston assumed all rights, powers, assets, properties and duties of the Evanston Township,
including the responsibility of providing the services that were previously provided by the Township. The
functions of the Township are reported along with the City, while the Library financials are shown as a
discretely presented component unit beginning in 2013. REPORTING THE CITY AS A WHOLE Government-wide Financial Statements
The City's annual report includes two government-wide financial statements. These statements provide both short-term and long-term information about the City's overall status. Financial reporting at this level uses a perspective similar to that found in the private sector with its basis in full accrual accounting and elimination or reclassification of internal activities (e.g., the City’s Fleet Services Fund). The first of these government-wide statements is the Statement of Net Position. This is the City-wide statement of financial position presenting information that includes all the City's assets and liabilities, with the difference reported as net position. Beginning in 2013, this statement also includes separate presentation of Library assets and liabilities. Over time, increases or decreases in net position may serve as a useful indicator of whether the financial position of the City as a whole is improving or deteriorating. Evaluation of the overall health of the City would extend to other non-financial factors such as diversification of the taxpayer base or the condition of City infrastructure in addition to the financial information provided in this report. The second government-wide statement is the Statement of Activities - which reports how the City's net position changed during the current fiscal period. All current period revenues and expenses for the city and Library are included regardless of when the cash was received or paid. An important purpose of the design of the statement of activities is to show the financial reliance of the City's distinct activities or functions on revenues provided by all government-wide sources. Both government-wide financial statements distinguish governmental activities of the City that are principally supported by taxes and intergovernmental revenues, such as grants, from business-type activities that are intended to recover all or a significant portion of their costs through user fees and charges. Governmental activities include general government, public safety, public service, fleet service, insurance fund, and culture and recreation. Business-type activities include water and sewer utilities, parking, and garages. Fiduciary activities, such as employee pension plans and agency funds, are not included in the government-wide statements since these assets are not available to fund City programs. The government-wide financial statements are presented on pages 4 - 7 of this report. REPORTING THE CITY'S MOST SIGNIFICANT FUNDS
Fund Financial Statements A fund is an accountability unit used to maintain control over resources segregated for specific activities or objectives. The City uses funds to ensure and demonstrate compliance with finance-related laws and regulations. Within the basic financial statements, fund financial statements focus on the City's most significant funds, rather than the City as a whole. Major funds are separately reported, while all others are combined into a single aggregated presentation. Individual fund data for non-major funds is provided in the form of combining schedules in a later section of this report.

(Unaudited)
MD&A 3
The City has three kinds of funds: Governmental funds are reported in the fund financial statements and encompass essentially the same functions reported as governmental activities in the government-wide financial statements. However, the focus is very different with fund statements providing a distinctive view of the City's governmental funds. These statements report short-term fiscal accountability focusing on the use of spendable resources and balances of spendable resources available at the end of the period. They are useful in evaluating annual financing requirements of governmental programs and the commitment of spendable resources for the near-term.
Since the government-wide focus includes the long-term view, comparisons between these two perspectives
may provide insight into the long-term impact of the short-term financing decision. Both the governmental
fund balance sheet and the governmental fund statement of revenues, expenditures, and changes in fund
balances provide a reconciliation to assist in understanding the differences between these two perspectives.
Budgetary comparison statements for General Fund are included in the required supplementary section of
this report. Budgetary comparison schedules for various special revenue funds and the debt service funds
are also included in the supplementary information section of this report. These statements and schedules
demonstrate compliance with the City's adopted and final revised budget.
The basic government fund financial statements are presented on pages 8 – 12 of this report.
Proprietary funds reported in the fund financial statements generally report services for which the City
charges customers a fee. There are two kinds of proprietary funds. These are enterprise funds and internal
service funds. Enterprise funds essentially encompass the same functions reported as business-type
activities in the government-wide statements. Services such as the water utilities and the parking garages
are provided to customers external to the City organization. Internal service funds provide services and
charge fees to customers within the City organization, such as equipment services (repair and maintenance
of city vehicles) and the insurance fund. Because the City's internal service funds primarily serve
governmental functions, they are included within the governmental activities of the government-wide
financial statements.
Proprietary fund statements and statements for discretely presented component units (reporting is similar
to proprietary funds) provide both short-term and long-term financial information consistent with the focus
provided by the government-wide financial statements. Individual fund information for internal service
funds is found in combining schedules in a later section of this report.
The basic proprietary fund financial statements are presented on pages 13 - 17 of this report.
Fiduciary funds such as the Police and Firefighter's pension plans are reported in the fiduciary fund financial
statements, but are excluded from the government-wide reporting. Fiduciary fund financial statements
report resources that are not available to fund City programs. These financial statements report similarly
to proprietary funds.
The basic fiduciary fund financial statements are presented on pages 18 - 19 of this report.
Notes to the financial statements
The accompanying notes to financial statements provide information essential to a full understanding of the
government-wide and fund financial statements. The notes to the financial statements begin on page 20 of
this report.

(Unaudited)
MD&A 4
Other information
In addition to the basic financial statements and accompanying notes, this report also presents certain
required supplementary information concerning the City's progress in funding its obligations to provide
pension benefits to its employees. Other supplementary information includes detail by fund and component
unit for receivables, payables, transfers, and payments within the reporting entity. Required supplementary
information can be found on pages 79 – 88 of this report.
Major funds and component units are reported in the basic financial statements, as discussed. Combining
statements, individual statements and schedules for nonmajor and internal service funds are presented in a
subsequent section of this report beginning on page 90. Additional information on capital assets and
long-term debt can be found on page 37 and 45, respectively.
Financial Analysis of the City as a Whole
The City's combined net position increased by $24,108,172 from $162,685,934 to $186,794,106
STATEMENT OF POSITION
The City’s increase in Net Position is principally due to increased capital grants and contributions combined
with a decrease in cost in public safety.
The City's total revenues increased by $12,617,615 or 7.2%. The City's total expenses for all programs
decreased by $25,338,798 or 13.5%. Business-type activity revenues increased by $6,258,181 in the current
fiscal period mainly due to increase in charges for services. Business-type activity expenses increased by
$64,039, while Governmental activity expense experienced a decrease of $25,402,837 due to lower cost in
public safety. The list of expenses can be found in the table below.
The governmental activities experienced an increase of $21,078,962 in the net position balance. This is
principally due to decreased cost in public safety.
The business-type activities experienced an increase of $3,029,210 in the net position balance primarily
due to the net operating surplus in the Sewer Fund in the amount of $2,753,411.
Governmental Activities Business-type Activities Total Primary Government
2019 2018 2019 2018 2019 2018
Current and Other Assets 124,680,604$ 125,284,013$ 18,587,294$ 21,364,336$ 143,267,898$ 146,648,349$
Capital Assets 218,657,844 186,607,522 360,296,585 346,085,019 578,954,429 532,692,541
Total Assets 343,338,448 311,891,535 378,883,879 367,449,355 722,222,327 679,340,890
Deferred Outflows 57,763,934 33,963,760 4,841,293 716,451 62,605,227 34,680,211
401,102,382 345,855,295 383,725,172 368,165,806 784,827,554 714,021,101
Long-Term Liabilities 426,077,198 398,461,618 77,548,599 63,837,397 503,625,797 462,299,015
Other Liabilities 20,888,736 12,119,814 4,874,804 3,825,977 25,763,540 15,945,791
Total Liabilities 446,965,934 410,581,432 82,423,403 67,663,374 529,389,337 478,244,806
Deferred Inflows 66,248,216 68,464,593 2,395,895 4,625,768 68,644,111 63,838,825
Total Liabilities and
Deferred Inflows 513,214,150 479,046,025 84,819,298 72,289,142 598,033,448 542,083,631
Net Investment in
Capital Assets 53,783,908 52,536,443 289,022,749 283,980,522 342,806,657 336,516,965
Restricted 15,555,267 8,650,574 - - 15,555,267 8,650,574
Unrestricted (Deficit) (181,450,943) (194,377,747) 9,884,626 11,896,142 (171,566,317) (182,481,605)
Total Net Position (112,111,768)$ (133,190,730)$ 298,907,375$ 295,876,664$ 186,795,607$ 162,685,934$

(Unaudited)
MD&A 5
The following table provides a summary of the City's changes in net position:
STATEMENT OF CHANGES IN NET POSITION
Governmental Activities Business-type Activities Total Primary Government
2019 2018 2019 2018 2019 2018
Revenue
Program Revenues:
Charges for services 25,803,631$ 26,967,262$ 43,877,956$ 38,662,058$ 69,681,587$ 65,629,320$
Operating grants and
contributions 5,775,144 5,243,789 - - 5,775,144 5,243,789
Capital grants and
contributions 8,630,229 125,000 - - 8,630,229 125,000
General Revenues:
Sales taxes 16,905,373 16,962,657 - - 16,905,373 16,962,657
Property taxes 44,162,966 47,101,540 820,000 - 44,982,966 47,101,540
Utility taxes 6,372,647 6,667,199 - - 6,372,647 6,667,199
Income taxes 7,991,868 7,185,203 - - 7,991,868 7,185,203
Other 24,685,909 24,606,840 7,412 - 24,693,321 24,606,840
Investment income 1,669,433 778,276 564,561 234,069 2,233,994 1,012,345
Total Revenue 141,997,200 135,637,766 45,269,929 38,896,127 187,267,129 174,533,893
Expenses
General management and
support 19,444,079 20,015,842 - - 19,444,079 20,015,842
Public safety 56,755,452 80,461,868 - - 56,755,452 80,461,868
Public works 26,584,419 22,717,732 - - 26,584,419 22,717,732
Health and human
resources development 2,895,010 3,455,215 - - 2,895,010 3,455,215
Recreation and cultural
opportunities 11,081,641 14,060,670 - - 11,081,641 14,060,670
Housing and economic
development 6,907,087 9,129,587 - - 6,907,087 9,129,587
Interest 5,453,818 4,683,429 - - 5,453,818 4,683,429
Water - - 12,879,721 12,963,491 12,879,721 12,963,491
Sewer - - 6,492,039 6,721,489 6,492,039 6,721,489
Solid Waste - - 5,078,507 4,851,568 5,078,507 4,851,568
Motor vehicle parking
system - - 9,585,683 9,321,243 9,585,683 9,321,243
Total Expense 129,121,506 154,524,343 34,035,950 33,857,791 163,157,456 188,382,134
Increase (decrease) in net
position before transfers 12,875,694 (18,886,577) 11,233,979 5,038,336 24,109,673 (13,848,241)
Transfers 8,203,268 1,480,488 (8,203,268) (1,480,488) - -
Increase/(Decrease) in
Net Position 21,078,962 (17,406,089) 3,030,711 3,557,848 24,109,673 (13,848,241)
Net Position - Beginning (133,190,730) (115,784,641) 295,876,664 292,318,816 162,685,934 176,534,175
Net Position - Ending (112,111,768)$ (133,190,730)$ 298,907,375$ 295,876,664$ 186,795,607$ 162,685,934$

(Unaudited)
MD&A 6
Financial Analysis of the City's Funds
Governmental Funds
As discussed, governmental funds are reported in the fund statement with a short-term inflow and outflow
of spendable resources focus. This information is useful in assessing resources available at the end of the
period in comparison with upcoming financing requirements. Governmental funds reported fund balances
of $51,903,065 as of December 31, 2019 which includes $415,394 non-spendable, $15,932,963 restricted,
$24,635,982 assigned and $10,918,726 unassigned fund balance. The restricted fund balance consists of
amounts required to be set aside by external authorities.
Fund Balance Amounts reported for governmental activities are different than the statement of net position
because of the treatment of capital assets, liabilities, payables and most importantly pension liabilities. This
reporting difference is clearly stated on page 10 of this report.
Major Governmental Funds
The General Fund is the City's primary operating fund and the largest source of day-to-day service delivery.
The fund balance of the General Fund reported an increase of $2,034,851 with actual revenue of
$108,643,055 and expenses of $112,117,151. The City generated better than expected taxes for the year.
Starting FY 2016 the Police and Fire pension employer contributions were included in the Adopted Budget
documents. These had previously been reported in a separate fund. So now, Property tax and Personal
Property Replacement Taxes are included in the General Fund and then transferred to the respective pension
funds.
The fund balance of the General Obligation Debt Fund had a decrease of $550 from $417,981 to $417,431.
The Crown Capital Fund which was previously reported as part of the Nonmajor Governmental Funds, had
a decrease in fund balance of $9,879,385 from $17,525,535 to $7,646,150. The decrease is attributable to
expenditures of $32,838,985 offset by the combined revenue and bond issuance of $22,959,600.
Combined Nonmajor Governmental Funds
Combined nonmajor fund balances totaled $27,949,585, an increase of $3,403,775 from prior period of
$24,545,810 (after reclassification of Crown Capital Fund). Non-major funds with surpluses for the fiscal
year include Motor Fuel, Affordable Housing, Home Fund, Emergency Telephone System, Neighborhood
Improvement, Good Neighbor, Reparations, Chicago Main TIF, SSD #6, Dempster Dodge TIF, West
Evanston TIF, Community Development Loan, SSD #4 and Special Assessment Capital Projects.
Nonmajor funds with deficits for the period include Community Development Block Grant, General
Assistance, Howard Ridge TIF and Capital Improvements.

(Unaudited)
MD&A 7
Proprietary Funds
The proprietary fund statements share the same focus as the government-wide statements, reporting both
short-term and long-term information about financial status.
The proprietary funds operated by the City are the Water, Sewer, Solid Waste and Parking Funds. These
funds have a combined net increase of $3,029,210 in the net position. The Sewer Fund reported the highest
increase in the amount of $2,753,411. This increase is mainly due to the operating surplus and reduced debt
service expense. The Solid Waste Fund added $559,718 to the net position during the year. The Water Fund
reported an increase of $1,298,203, while Parking Fund reported a decrease of $1,582,122. It should also
be noted that the Water and Sewer Funds carry substantial debt levels, although Parking and Solid Waste
Funds have lesser debts.
Internal Service Funds
The City's combined internal service fund’s net position decreased by $3,096,747 from a deficit of
$331,192, as of January 1, 2019 to a net deficit balance of $3,427,939 as of December 31, 2019. Fleet Fund
and Equipment Replacement reported a combined net decrease in net position of $297,496. The net deficit
in the Insurance Fund increased by $2,799,251 mainly due to claim settlements and legal fees.
General Fund Budgetary Highlights
Total budgetary basis revenues for the General Fund were $108,643,055 while total expenditures were
$112,117,151. Overall General Fund revenue came in higher than budget by $1,903,288. Total expenditures
in the General Fund were higher than budgeted amounts by $1,111,323. The actual net deficiency of
$3,474,096 was offset by $5,508,947 in net transfers to the General Fund from other funds.
Capital Assets
The City’s Capital Asset policy generally includes capitalizing assets or properties with $20,000 or more
in value (with the exception of vehicles to the $20,000 threshold). The City's capital assets (net of
depreciation) for governmental and business-type activities as of December 31, 2019, were $578,954,429.
The governmental funds capital assets had a net increase of $32,050,322, while business type capital assets
increased by $14,211,566. Overall, capital assets increased by 8.7% for the City as a whole. The net increase
in governmental funds capital assets were principally due to an increase in capital projects for the year.
Readers desiring more detailed information on capital asset activity should refer to Note 5 in the Notes to
the Financial Statements.
Long-Term Debt
As of December 31, 2019, the City had outstanding total general obligation bonded debt of $183,563,417
of which $28,608,753 was for business type activities to be paid for by the City's Water, Solid Waste and
Sewer Funds. Overall debt represents a $13,022,560 increase from 2018. The City's general obligation
debt service principal payments for 2019 totaled $10,677,440. During the current year, the City issued
$23,700,000 in general obligation bonds. As a home rule government under Illinois law, there is no legal
debt limit for the City. Readers desiring more detailed information on long-term debt should refer to Note
8 in the Notes to the Financial Statements.
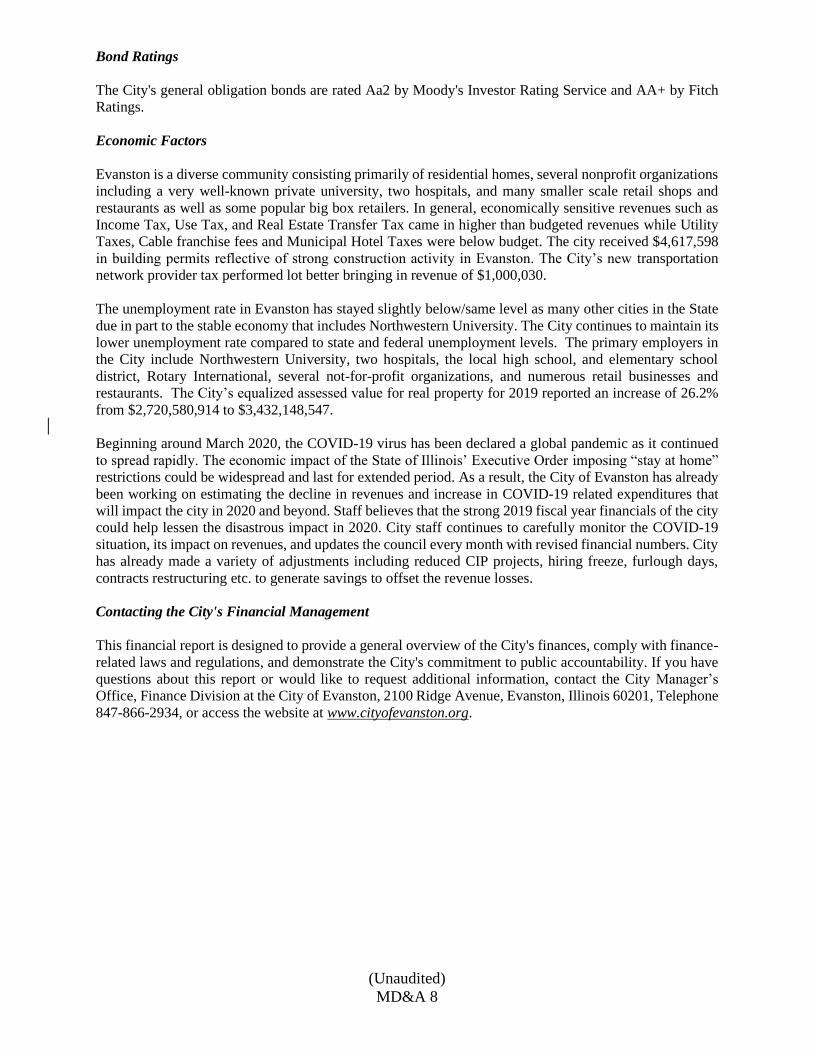
(Unaudited)
MD&A 8
Bond Ratings
The City's general obligation bonds are rated Aa2 by Moody's Investor Rating Service and AA+ by Fitch
Ratings.
Economic Factors
Evanston is a diverse community consisting primarily of residential homes, several nonprofit organizations
including a very well-known private university, two hospitals, and many smaller scale retail shops and
restaurants as well as some popular big box retailers. In general, economically sensitive revenues such as
Income Tax, Use Tax, and Real Estate Transfer Tax came in higher than budgeted revenues while Utility
Taxes, Cable franchise fees and Municipal Hotel Taxes were below budget. The city received $4,617,598
in building permits reflective of strong construction activity in Evanston. The City’s new transportation
network provider tax performed lot better bringing in revenue of $1,000,030.
The unemployment rate in Evanston has stayed slightly below/same level as many other cities in the State due in part to the stable economy that includes Northwestern University. The City continues to maintain its
lower unemployment rate compared to state and federal unemployment levels. The primary employers in
the City include Northwestern University, two hospitals, the local high school, and elementary school
district, Rotary International, several not-for-profit organizations, and numerous retail businesses and
restaurants. The City’s equalized assessed value for real property for 2019 reported an increase of 26.2%
from $2,720,580,914 to $3,432,148,547.
Beginning around March 2020, the COVID-19 virus has been declared a global pandemic as it continued
to spread rapidly. The economic impact of the State of Illinois’ Executive Order imposing “stay at home”
restrictions could be widespread and last for extended period. As a result, the City of Evanston has already
been working on estimating the decline in revenues and increase in COVID-19 related expenditures that
will impact the city in 2020 and beyond. Staff believes that the strong 2019 fiscal year financials of the city
could help lessen the disastrous impact in 2020. City staff continues to carefully monitor the COVID-19
situation, its impact on revenues, and updates the council every month with revised financial numbers. City
has already made a variety of adjustments including reduced CIP projects, hiring freeze, furlough days,
contracts restructuring etc. to generate savings to offset the revenue losses.
Contacting the City's Financial Management
This financial report is designed to provide a general overview of the City's finances, comply with finance-
related laws and regulations, and demonstrate the City's commitment to public accountability. If you have
questions about this report or would like to request additional information, contact the City Manager’s
Office, Finance Division at the City of Evanston, 2100 Ridge Avenue, Evanston, Illinois 60201, Telephone
847-866-2934, or access the website at www.cityofevanston.org.

BASIC FINANCIAL STATEMENTS

CITY OF EVANSTON, ILLINOIS
Statement of Net Position
December 31, 2019
Component UnitGovernmental Business-Type Evanston Public
Activities Activities Total Library
ASSETSCash and equivalents 15,356,403$ 10,399,329$ 25,755,732$ 7,713,405$ Investments 39,997,847 - 39,997,847 - Receivables (net, where applicable, of allowances for uncollectibles)
Property taxes 46,888,583 1,332,500 48,221,083 7,732,145 Utility taxes 694,112 - 694,112 - Accounts - 4,000,891 4,000,891 - Notes 400,000 204,000 604,000 - Loans 7,932,682 - 7,932,682 - Special assessments 482,723 - 482,723 - Accrued interest - - - - Other 974,586 833,207 1,807,793 95
Due from other governments 9,131,085 - 9,131,085 - Due from primary government - - - 324,908 Internal balances (816,877) 816,877 - - Inventories 1,407,988 828,180 2,236,168 - Prepaid items 2,231,472 172,310 2,403,782 - Capital assets
Capital assets not being depreciated 87,412,008 22,697,207 110,109,215 311,380 Capital assets being depreciated, net 131,245,836 337,599,378 468,845,214 11,927,654
Total Assets 343,338,448 378,883,879 722,222,327 28,009,587
DEFERRED OUTFLOWS OF RESOURCESPension items - Police 22,189,652 - 22,189,652 - Pension items - Fire 15,614,276 - 15,614,276 - Pension items - IMRF 17,493,657 4,721,565 22,215,222 2,389,078 OPEB items 2,466,349 119,728 2,586,077 39,483
Total Deferred Outflows of Resources 57,763,934 4,841,293 62,605,227 2,428,561
Total Assets and Deferred Outflows of Resources 401,102,382 383,725,172 784,827,554 30,438,148
Primary Government
(This statement is continued on the following page.)- 4 -

CITY OF EVANSTON, ILLINOIS
Statement of Net Position
December 31, 2019
Component UnitGovernmental Business-Type Evanston Public
Activities Activities Total Library
LIABILITIESVouchers payable 16,577,344$ 3,073,529$ 19,650,873$ 141,623$ Retainage payable - 1,558,172 1,558,172 - Deposits payable - 1,737 1,737 - Accrued payroll 2,261,457 - 2,261,457 - Accrued interest 487,754 241,366 729,120 21,458 Due to other governments 128,501 - 128,501 - Due to component unit 324,908 - 324,908 - Due to fiduciary fund 33,398 - 33,398 - Unearned revenue 1,075,374 - 1,075,374 - Noncurrent liabilities
Due within one year 16,025,178 6,537,095 22,562,273 302,009 Due in more than one year 410,052,020 71,011,504 481,063,524 9,696,903
Total Liabilities 446,965,934 82,423,403 529,389,337 10,161,993
DEFERRED INFLOWS OF RESOURCESPension items - Police Pension 7,823,290 - 7,823,290 - Pension items - Fire Pension 6,779,910 - 6,779,910 - Pension items - IMRF 3,770,156 1,017,572 4,787,728 514,884 OPEB items 986,277 45,823 1,032,100 15,757 Property taxes levied for future periods 46,888,583 1,332,500 48,221,083 7,732,145
Total Deferred Inflows of Resources 66,248,216 2,395,895 68,644,111 8,262,786
Total Liabilities and Deferred Inflows of Resources 513,214,150 84,819,298 598,033,448 18,424,779
NET POSITIONNet investment in capital assets 53,783,908 289,022,749 342,806,657 5,572,371 Restricted for
Highway maintenance 2,669,032 - 2,669,032 - Emergency telephone system 1,270,960 - 1,270,960 - HUD approved projects 298,207 - 298,207 - Neighborhood improvements 6,652,919 - 6,652,919 - Reparations 1,335 1,335 - Capital improvements 252,545 - 252,545 968,549 Debt service 4,047,228 - 4,047,228 1,144 General assistance 363,041 - 363,041 - Endowment - - - 4,447,514
Unrestricted (181,450,943) 9,883,125 (171,567,818) 1,023,791
Total Net Position (112,111,768)$ 298,905,874$ 186,794,106$ 12,013,369$
Primary Government
See accompanying notes to financial statements.- 5 -

CITY OF EVANSTON, ILLINOIS
Statement of Activities
For the Fiscal Year Ended December 31, 2019
Operating Capital FUNCTIONS/PROGRAMS Charges for Grants and Grants andPRIMARY GOVERNMENT Expenses Services Contributions Contributions
Governmental ActivitiesGeneral management and support 19,444,079$ 8,768,397$ 41,535$ -$ Public safety 56,755,452 4,948,393 398,971 - Public works 26,584,419 449,478 2,448,235 5,894,216 Health and human resource development 2,895,010 638,770 416,592 - Recreational and cultural opportunities 11,081,641 6,118,608 262,938 - Housing and economic development 6,907,087 4,879,985 2,206,873 2,736,013 Interest 5,453,818 - - -
Total Governmental Activities 129,121,506 25,803,631 5,775,144 8,630,229
Business-Type ActivitiesWater 12,879,721 17,788,361 - - Sewer 6,492,039 10,780,345 - - Solid waste 5,078,507 4,668,225 - - Motor vehicles parking system 9,585,683 10,639,524 - -
Total Business-Type Activities 34,035,950 43,876,455 - -
Total Primary Government 163,157,456$ 69,680,086$ 5,775,144$ 8,630,229$
Evanston Public LibraryCommunity services 9,155,411$ 155,163$ 587,854$ -$ Interest 175,973 - - -
Total Evanston Public Library 9,331,384$ 155,163$ 587,854$ -$
Program Revenues
- 6 -

ComponentUnit
Total EvanstonGovernmental Business-Type Primary Public
Activities Activities Government Library
(10,634,147)$ -$ (10,634,147)$ -$ (51,408,088) - (51,408,088) - (17,792,490) - (17,792,490) -
(1,839,648) - (1,839,648) - (4,700,095) - (4,700,095) - 2,915,784 - 2,915,784 -
(5,453,818) - (5,453,818) -
(88,912,502) - (88,912,502) -
- 4,908,640 4,908,640 - - 4,288,306 4,288,306 - - (410,282) (410,282) - - 1,053,841 1,053,841 -
- 9,840,505 9,840,505 -
(88,912,502) 9,840,505 (79,071,997) -
- - - (8,412,394) - - - (175,973)
- - - (8,588,367)
General RevenuesTaxes
Property tax 44,162,966 820,000 44,982,966 7,089,362 Other taxes 9,257,763 - 9,257,763 - Personal property replacement taxes 1,744,366 - 1,744,366 - Sales and home rule tax 16,905,373 - 16,905,373 - Utility tax 6,372,647 - 6,372,647 - Liquor tax 3,367,406 - 3,367,406 - Parking tax 3,271,175 - 3,271,175 - Real estate transfer tax 2,671,279 - 2,671,279 -
Income tax 7,991,868 - 7,991,868 - Investment income 1,669,433 564,561 2,233,994 982,803 Gain on sale of capital assets - 7,412 7,412 - Miscellaneous 4,373,920 - 4,373,920 169,706
Transfers 8,203,268 (8,203,268) - -
Total 109,991,464 (6,811,295) 103,180,169 8,241,871
Change in Net Position 21,078,962 3,029,210 24,108,172 (346,496)
Net Position, January 1 (133,190,730) 295,876,664 162,685,934 12,607,437
Prior period adjustment - - - (247,572)
Net Position, January 1 (restated) (133,190,730) 295,876,664 162,685,934 12,359,865
Net Position, December 31 (112,111,768)$ 298,905,874$ 186,794,106$ 12,013,369$
Net (Expense) Revenue and Change in Net Position
Primary Government
See accompanying notes to financial statements.- 7 -

General Nonmajor TotalObligation Governmental Governmental
General Crown Capital Debt Service Funds Funds
Cash and equivalents 7,227,257$ 237,051$ -$ 7,168,133$ 14,632,441$ Investments 1,508,466 17,524,960 664,088 20,300,333 39,997,847 Receivables
Property taxes 32,472,987 - 12,521,931 1,893,665 46,888,583 Utility 694,112 - - - 694,112 Notes 400,000 - - - 400,000 Loans - - - 7,932,682 7,932,682 Special assessments - - - 482,723 482,723 Other 929,505 - - 45,081 974,586
Due from other governments 7,805,551 - - 1,325,534 9,131,085 Due from other funds 7,318,558 - - 1,077,066 8,395,624 Advances to other funds - - - 4,000,000 4,000,000 Inventories 15,394 - - - 15,394
Total Assets 58,371,830$ 17,762,011$ 13,186,019$ 44,225,217$ 133,545,077$
ASSETS
December 31, 2019
CITY OF EVANSTON, ILLINOIS
Balance SheetGovernmental Funds
(This statement is continued on the following page.)- 8 -

General Nonmajor TotalObligation Governmental Governmental
General Crown Capital Debt Service Funds Funds
LIABILITIESVouchers payable 3,194,607$ 9,813,048$ -$ 3,263,405$ 16,271,060$ Accrued payroll 2,261,457 - - - 2,261,457 Due to other governments - - - 128,501 128,501 Due to component unit 324,908 - - - 324,908 Due to other funds - 302,813 246,657 1,574,656 2,124,126 Due to fiduciary funds 33,398 - - - 33,398 Advances from other funds 4,119,200 - - - 4,119,200 Unearned revenue 75,374 - - 1,000,000 1,075,374
Total Liabilities 10,008,944 10,115,861 246,657 5,966,562 26,338,024
DEFERRED INFLOWS OF RESOURCESLong-term loans - - - 8,415,405 8,415,405 Property taxes levied for future periods 32,472,987 - 12,521,931 1,893,665 46,888,583
Total Deferred Inflows of Resources 32,472,987 - 12,521,931 10,309,070 55,303,988
Total Liabilities and Deferred Inflows of Resources 42,481,931 10,115,861 12,768,588 16,275,632 81,642,012
FUND BALANCESNonspendable
Notes 400,000 - - - 400,000 Inventory 15,394 - - - 15,394
RestrictedHighway maintenance - - - 2,669,032 2,669,032 Emergency telephone system - - - 1,270,960 1,270,960 HUD approved projects - - - 298,207 298,207 Neighborhood improvements - - - 7,030,615 7,030,615 Reparations - - - 1,335 1,335 Debt service - - 417,431 3,629,797 4,047,228 Township - - - 363,041 363,041 Capital improvements - - - 252,545 252,545
AssignedCapital improvements - 7,646,150 12,660,246 20,306,396 Other 4,329,586 - - - 4,329,586
Unassigned 11,144,919 - - (226,193) 10,918,726
Total Fund Balances 15,889,899 7,646,150 417,431 27,949,585 51,903,065
Total Liabilities, Inflows of Resources, and Fund Balances 58,371,830$ 17,762,011$ 13,186,019$ 44,225,217$ 133,545,077$
December 31, 2019
CITY OF EVANSTON, ILLINOIS
Balance SheetGovernmental Funds
See accompanying notes to financial statements.- 9 -

Governmental Activities in the Statement of Net Position
Fund Balances of Governmental Funds 51,903,065$
Amounts reported for governmental activities in the statement of net position are different because:
Capital assets used in governmental activities are not financial resources and, therefore, are not reported in the governmental funds
Total governmental capital assets 218,657,844$ Less internal service fund portion 7,144,736 211,513,108
Total OPEB liability payable is not due and payable in the current period and, therefore, is not reported in the governmental funds (20,645,570)
Interest payable is not due and payable in the current period and, therefore, not reported in the governmental funds (487,754)
Long-term liabilities, including bonds payable, are not due and payable in the current period and, therefore, are not reported in the governmental funds
General obligation bonds payable (154,954,665) Bonds premium liability (9,919,270) Compensated absences payable (9,531,362)
Net pension liability (asset) is shown as a liability (asset) on the statement of net position
Illinois Municipal Retirement Fund (16,538,083) Police Pension Fund (109,646,586) Firefighters' Pension Fund (97,187,735)
Differences between expected and actual experiences, assumption changes, net differences between projected, and actual earnings are recognized as deferred outflows and inflows of resources on the statement of net position
Illinois Municipal Retirement Fund 13,723,501 Police Pension Fund 14,366,362 Firefighters' Pension Fund 8,834,366 OPEB 1,471,389
Deferred inflows for long-term loans are not a available and, therefore, not revenue in fund financial statements 8,415,405
The net position of the internal service fund is included in the governmental activities on the statement of net position (3,427,939)
Net Position of Governmental Funds (112,111,768)$
December 31, 2019
CITY OF EVANSTON, ILLINOIS
Reconciliation of Fund Balances of Governmental Funds to the
See accompanying notes to financial statements.- 10 -

General Nonmajor TotalObligation Governmental Governmental
General Crown Capital Debt Service Funds Funds
RevenuesTaxes 62,839,205$ -$ 10,581,996$ 5,223,447$ 78,644,648$ Licenses and permits 10,011,661 - - - 10,011,661 Special assessments - - - 230,526 230,526 Intergovernmental 19,855,436 - - 5,422,320 25,277,756 Charges for services 8,840,673 - - 84,261 8,924,934 Fines and forfeits 5,108,237 - - - 5,108,237 Investment income 210,357 534,207 200,611 724,258 1,669,433 Miscellaneous 1,777,486 6,250,000 87,456 4,015,063 12,130,005
Total Revenues 108,643,055 6,784,207 10,870,063 15,699,875 141,997,200
ExpendituresCurrent
General management and support 16,725,107 - 34 2,480,911 19,206,052 Public safety 64,372,499 - - 1,448,582 65,821,081 Public works 12,881,405 890,012 - 2,076,151 15,847,568 Health and human resource development 2,989,435 - - - 2,989,435 Recreational and cultural opportunities 12,246,544 - - - 12,246,544 Housing and economic development 2,902,161 - - 3,664,536 6,566,697
Capital outlay - 31,777,910 - 8,018,519 39,796,429 Debt service
Principal - - 9,517,155 648,812 10,165,967 Interest - - 5,736,517 12,256 5,748,773 Fiscal charges - 171,063 7,000 96,336 274,399
Total Expenditures 112,117,151 32,838,985 15,260,706 18,446,103 178,662,945
Excess (Deficiency) of Revenues Over Expenditures (3,474,096) (26,054,778) (4,390,643) (2,746,228) (36,665,745)
Other Financing Sources (Uses)
Issuance of bonds - 12,750,000 - 7,020,000 19,770,000 Issuance of loans - - - - - Premium (discount) on bonds issued - 2,728,206 - 1,477,734 4,205,940 Transfers in 8,817,013 1,000,000 4,390,093 198,181 14,405,287 Transfers (out) (3,308,066) (302,813) - (2,545,912) (6,156,791)
Total Other Financing Sources (Uses) 5,508,947 16,175,393 4,390,093 6,150,003 32,224,436
Net Change in Fund Balances 2,034,851 (9,879,385) (550) 3,403,775 (4,441,309)
Fund Balances, January 1 13,855,048 17,525,535 417,981 24,545,810 56,344,374
Fund Balances, December 31 15,889,899$ 7,646,150$ 417,431$ 27,949,585$ 51,903,065$
CITY OF EVANSTON, ILLINOIS
Statement of Revenues, Expenditures, and Changes in Fund BalancesGovernmental Funds
For the Fiscal Year Ended December 31, 2019
See accompanying notes to financial statements.- 11 -

Net Change in Fund Balances - Total Governmental Funds (4,441,309)$
Amounts reported for governmental activities in the statement of activities are different because:
Governmental funds report capital outlay as expenditures; however, they are capitalized and and depreciated in the statement of activities 41,738,872
Some expenses in the statement of net position (e.g., depreciation) do not require the use of current financial resources and, therefore, are not reported as expenditures in governmental funds
Depreciation (9,613,145)
The issuance of long-term debt is reported as an other financing sources in governmental funds, but as an increase of principal outstanding in the statement of activities (23,975,940)
The repayment of long-term debt is reported as an expenditure when due in governmental funds but as a reduction of principal outstanding in the statement of activities 10,169,098
The amortization of premium on long-term debt is reported as a reduction of interest expense on the statement of activities 640,603
Changes in total other postemployment benefits obligations are reported only in the statement of activities (3,521,783)
The change in compensated absences payable is shown as an expense on the statement of activities 499,402
The change in the accrual of interest is reported as interest expense on the statement of activities (71,249)
The change in the net pension liability (asset) is reported only in the statement of activitiesIllinois Municipal Retirement Fund (25,107,500) Police Pension Fund 8,623,507 Firefighters' Pension Fund (742,223)
The change in deferred inflows and outflows of resources is reported only in the statement of activities
Illinois Municipal Retirement Fund 25,670,813 Police Pension Fund 3,309,910 Firefighters' Pension Fund (1,181,007) OPEB 2,555,356
The change in deferred inflows for long-term loans is not an expense on the statement of activities (377,696)
Internal service funds are reported separately in the fund financial statements (3,096,747)
Change in Net Position of Governmental Activities 21,078,962$
CITY OF EVANSTON, ILLINOIS
Reconciliation of Governmental Funds Statement of Revenues, Expenditures, and Changes in Fund Balances to the Governmental Activities in the Statement of Activities
For the Fiscal Year Ended December 31, 2019
See accompanying notes to financial statements.- 12 -

CITY OF EVANSTON, ILLINOIS
Statement of Net PositionProprietary Funds
December 31, 2019
GovernmentalActivities -
Motor Vehicle Internal ServiceWater Sewer Solid Waste Parking System Total Funds
Current AssetsCash and cash equivalents 5,042,058$ 2,474,441$ -$ 2,882,830$ 10,399,329$ 723,962$ Receivables
Property taxes - - 1,332,500 - 1,332,500 - Accounts - water and sewerage charges
Accounts - billed 131,943 166,715 134,697 - 433,355 - Accounts - unbilled 1,257,173 1,639,394 670,969 - 3,567,536 - Other 801,177 - 32,030 - 833,207 -
Inventories 703,696 124,484 - - 828,180 1,392,594 Prepaid items - - 172,310 - 172,310 2,231,472 Due from other funds 519,976 1,188,089 - 63 1,708,128 - Advances to other funds - - - 119,200 119,200 -
Total Current Assets 8,456,023 5,593,123 2,342,506 3,002,093 19,393,745 4,348,028
Noncurrent AssetsCapital assets
Capital assets not being depreciated 18,300,728 - - 4,396,479 22,697,207 - Capital assets being depreciated 123,693,914 258,957,907 267,825 91,921,037 474,840,683 25,550,015 Accumulated depreciation (32,356,644) (67,461,052) (26,783) (37,396,826) (137,241,305) (18,405,279)
Total Capital Assets 109,637,998 191,496,855 241,042 58,920,690 360,296,585 7,144,736
Other assetsNotes receivable - - - 204,000 204,000 -
Total Other Assets - - - 204,000 204,000 -
Total Noncurrent Assets 109,637,998 191,496,855 241,042 59,124,690 360,500,585 7,144,736
Total Assets 118,094,021 197,089,978 2,583,548 62,126,783 379,894,330 11,492,764
Deferred Outflows of ResourcesPension items - IMRF 2,711,394 637,251 516,690 856,230 4,721,565 - OPEB items 49,481 22,013 27,778 20,456 119,728 14,067
Total Deferred Outflows of Resources 2,760,875 659,264 544,468 876,686 4,841,293 14,067
Total Assets and Deferred Outflows of Resources 120,854,896 197,749,242 3,128,016 63,003,469 384,735,623 11,506,831
(This statement is continued on the following page.)- 13 -

CITY OF EVANSTON, ILLINOIS
Statement of Net PositionProprietary Funds
December 31, 2019
GovernmentalActivities -
Motor Vehicle Internal ServiceWater Sewer Solid Waste Parking System Total Funds
Current LiabilitiesVouchers payable 2,384,028$ 80,695$ 197,482$ 411,324$ 3,073,529$ 306,284$ Retainage payable 1,558,172 - - - 1,558,172 - Deposits payable 862 184 691 - 1,737 - Interest payable - restricted 87,712 153,654 - - 241,366 - Notes payable - IEPA 219,051 4,821,649 - - 5,040,700 - Current portion of GO bonds payable 1,046,544 242,874 - - 1,289,418 - Current portion of total OPEB liability 15,559 6,922 8,735 6,432 37,648 4,423 Claims payable - - - - - 1,391,550 Due to other funds - - 1,010,451 - 1,010,451 6,969,175 Due to component unit - - - - - - Compensated absences payable 110,452 22,871 10,233 25,773 169,329 22,813
Total Current Liabilities 5,422,380 5,328,849 1,227,592 443,529 12,422,350 8,694,245
Noncurrent LiabilitiesNotes payable - IEPA 14,605,321 21,045,530 - - 35,650,851 - General obligation bonds payable 26,377,520 2,915,347 - - 29,292,867 - Total OPEB liability 383,033 170,403 215,028 158,351 926,815 108,891 Claims payable - - - - - 6,035,000 Compensated absences payable 441,810 91,482 40,933 103,091 677,316 91,250 Net pension liability - IMRF 2,563,287 602,442 488,467 809,459 4,463,655 -
Total Long-Term Liabilities 44,370,971 24,825,204 744,428 1,070,901 71,011,504 6,235,141
Total Liabilities 49,793,351 30,154,053 1,972,020 1,514,430 83,433,854 14,929,386
Deferred Inflows of ResourcesPension items - IMRF 584,348 137,338 111,355 184,531 1,017,572 - OPEB items 18,938 8,425 10,631 7,829 45,823 5,384 Deferred property taxes - - 1,332,500 - 1,332,500 -
Total Deferred Inflows of Resources 603,286 145,763 1,454,486 192,360 2,395,895 5,384
Total Liabilities and Deferred Inflows of Resources 50,396,637 30,299,816 3,426,506 1,706,790 85,829,749 14,934,770
Net Position (Deficit)Net investment in capital assets 67,389,562 162,471,455 241,042 58,920,690 289,022,749 7,144,736 Unrestricted 3,068,697 4,977,971 (539,532) 2,375,989 9,883,125 (10,572,675)
Total Net Position (Deficit) 70,458,259$ 167,449,426$ (298,490)$ 61,296,679$ 298,905,874$ (3,427,939)$
See accompanying notes to financial statements.- 14 -

CITY OF EVANSTON, ILLINOIS
Statement of Revenues, Expenses, and Changes in Fund Net PositionProprietary Funds
For the Fiscal Year Ended December 31, 2019
GovernmentalActivities -
Motor Vehicle Internal ServiceWater Sewer Solid Waste Parking System Total Funds
Operating RevenuesCharges for services 16,510,511$ 10,757,395$ 4,661,645$ 10,431,844$ 42,361,395$ 23,488,291$ Miscellaneous 1,277,850 22,950 6,580 207,680 1,515,060 45
Total Operating Revenues 17,788,361 10,780,345 4,668,225 10,639,524 43,876,455 23,488,336
Operating Expenses Excluding DepreciationAdministration 890,296 1,602,996 1,163,189 2,233,432 5,889,913 - Operations 8,374,585 413,341 3,887,870 4,629,699 17,305,495 25,084,451
Total Operating Expenses Excluding Depreciation 9,264,881 2,016,337 5,051,059 6,863,131 23,195,408 25,084,451
Operating Income (Loss) Before Depreciation 8,523,480 8,764,008 (382,834) 3,776,393 20,681,047 (1,596,115)
Depreciation 2,648,980 3,681,927 26,783 2,694,291 9,051,981 1,490,126
Operating Income (Loss) 5,874,500 5,082,081 (409,617) 1,082,102 11,629,066 (3,086,241)
Non-Operating Revenue (Expenses)Investment income 189,122 39,012 - 336,427 564,561 3,104 Property taxes - - 820,000 - 820,000 - Interest expense (893,274) (793,775) (665) (1,004) (1,688,718) - Gain (loss) on disposal of capital assets (72,586) 7,412 - (27,257) (92,431) 31,618
Total Non-Operating Revenues (Expenses) (776,738) (747,351) 819,335 308,166 (396,588) 34,722
Income (Loss) Before Transfers 5,097,762 4,334,730 409,718 1,390,268 11,232,478 (3,051,519)
TransfersTransfers in - - 150,000 - 150,000 - Transfers (out) (3,799,559) (1,581,319) - (2,972,390) (8,353,268) (45,228)
Total Transfers (3,799,559) (1,581,319) 150,000 (2,972,390) (8,203,268) (45,228)
Net Income (Loss) 1,298,203 2,753,411 559,718 (1,582,122) 3,029,210 (3,096,747)
Net Position (Deficit), January 1 69,160,056 164,696,015 (858,208) 62,878,801 295,876,664 (331,192)
Net Position (Deficit), December 31 70,458,259$ 167,449,426$ (298,490)$ 61,296,679$ 298,905,874$ (3,427,939)$
See accompanying notes to financial statements.- 15 -
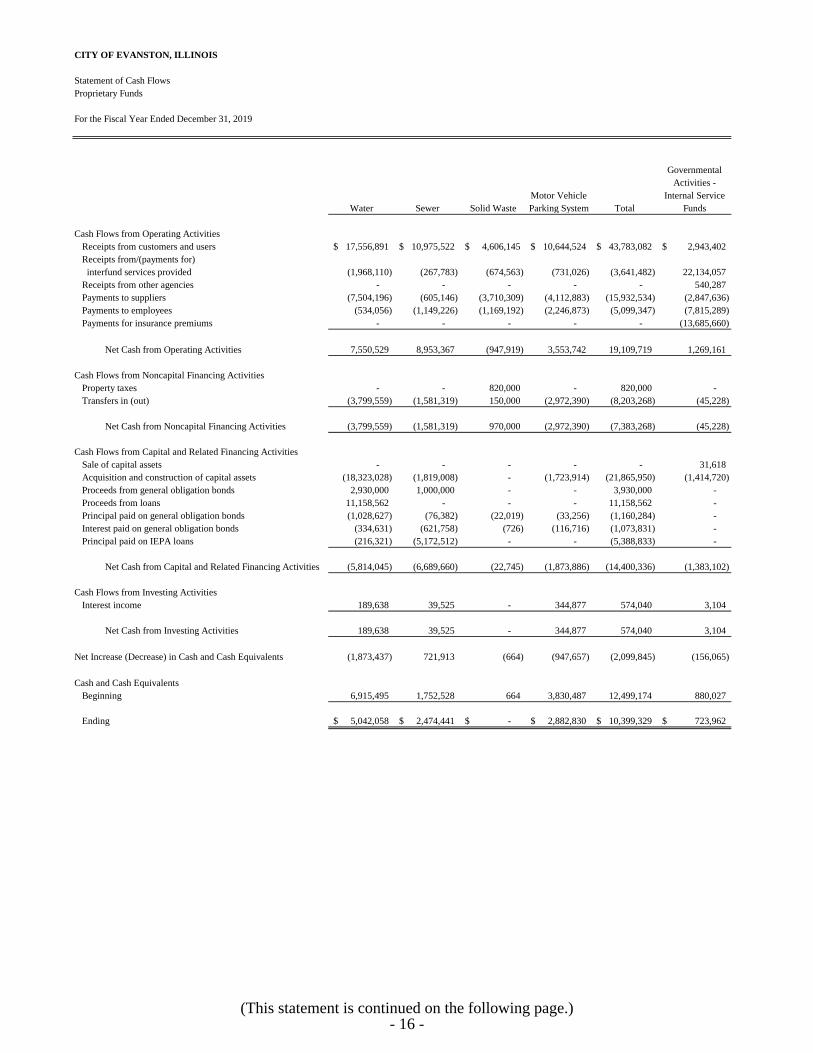
CITY OF EVANSTON, ILLINOIS
Statement of Cash FlowsProprietary Funds
For the Fiscal Year Ended December 31, 2019
GovernmentalActivities -
Motor Vehicle Internal ServiceWater Sewer Solid Waste Parking System Total Funds
Cash Flows from Operating ActivitiesReceipts from customers and users 17,556,891$ 10,975,522$ 4,606,145$ 10,644,524$ 43,783,082$ 2,943,402$ Receipts from/(payments for) interfund services provided (1,968,110) (267,783) (674,563) (731,026) (3,641,482) 22,134,057 Receipts from other agencies - - - - - 540,287 Payments to suppliers (7,504,196) (605,146) (3,710,309) (4,112,883) (15,932,534) (2,847,636) Payments to employees (534,056) (1,149,226) (1,169,192) (2,246,873) (5,099,347) (7,815,289) Payments for insurance premiums - - - - - (13,685,660)
Net Cash from Operating Activities 7,550,529 8,953,367 (947,919) 3,553,742 19,109,719 1,269,161
Cash Flows from Noncapital Financing ActivitiesProperty taxes - - 820,000 - 820,000 - Transfers in (out) (3,799,559) (1,581,319) 150,000 (2,972,390) (8,203,268) (45,228)
Net Cash from Noncapital Financing Activities (3,799,559) (1,581,319) 970,000 (2,972,390) (7,383,268) (45,228)
Cash Flows from Capital and Related Financing ActivitiesSale of capital assets - - - - - 31,618 Acquisition and construction of capital assets (18,323,028) (1,819,008) - (1,723,914) (21,865,950) (1,414,720) Proceeds from general obligation bonds 2,930,000 1,000,000 - - 3,930,000 - Proceeds from loans 11,158,562 - - - 11,158,562 - Principal paid on general obligation bonds (1,028,627) (76,382) (22,019) (33,256) (1,160,284) - Interest paid on general obligation bonds (334,631) (621,758) (726) (116,716) (1,073,831) - Principal paid on IEPA loans (216,321) (5,172,512) - - (5,388,833) -
Net Cash from Capital and Related Financing Activities (5,814,045) (6,689,660) (22,745) (1,873,886) (14,400,336) (1,383,102)
Cash Flows from Investing ActivitiesInterest income 189,638 39,525 - 344,877 574,040 3,104
Net Cash from Investing Activities 189,638 39,525 - 344,877 574,040 3,104
Net Increase (Decrease) in Cash and Cash Equivalents (1,873,437) 721,913 (664) (947,657) (2,099,845) (156,065)
Cash and Cash EquivalentsBeginning 6,915,495 1,752,528 664 3,830,487 12,499,174 880,027
Ending 5,042,058$ 2,474,441$ -$ 2,882,830$ 10,399,329$ 723,962$
(This statement is continued on the following page.)- 16 -

CITY OF EVANSTON, ILLINOIS
Statement of Cash FlowsProprietary Funds
For the Fiscal Year Ended December 31, 2019
GovernmentalActivities -
Motor Vehicle Internal ServiceWater Sewer Solid Waste Parking System Total Funds
Reconciliation of Operating Income (Loss) to Net Cash from Operating Activities
Operating income (loss) 5,874,500$ 5,082,081$ (409,617)$ 1,082,102$ 11,629,066$ (3,086,241)$ Adjustments to reconcile operating income (loss) to net cash from operating activities
Depreciation 2,648,980 3,681,927 26,783 2,694,291 9,051,981 1,490,126 Changes in assets and liabilities
Accounts receivable (232,332) 195,146 (62,080) - (99,266) - Notes receivable - - - 5,000 5,000 - Interfund receivable (519,976) 393,037 - 238,337 111,398 134,031 Prepaid expenses - - (172,310) 126,142 (46,168) (1,687,814) Inventories (65,221) 12,462 - - (52,759) (144,965) Compensated absences (56,765) (10,322) 4,379 (9,038) (71,746) (14,303) OPEB items 6,116 10,863 (6,173) 13,682 24,488 640 Pension items - IMRF (61,603) (15,110) (4,209) (18,085) (99,007) - Deposits payable 862 31 85 - 978 - Vouchers payable 112,598 (396,480) (115,148) (37,617) (436,647) (186,642) Interfund payable (156,630) (268) (209,629) (541,072) (907,599) 1,995,379 Claims payable - - - - - 2,768,950
Net Cash from Operating Activities 7,550,529$ 8,953,367$ (947,919)$ 3,553,742$ 19,109,719$ 1,269,161$
See accompanying notes to financial statements.- 17 -

CITY OF EVANSTON, ILLINOIS
Statement of Fiduciary Net PositionFiduciary Funds
December 31, 2019
PensionTrust
AssetsInvestments at fair value
Cash and cash equivalents 10,560,450$ U.S. Treasury obligations 21,040,633 U.S. agency obligations 8,664,091 Corporate bonds 32,200,180 Common stock 37,379,730 Equity mutual funds 109,857,552 Index funds 9,902,639 Real estate 1,064,103
ReceivablesAccrued interest 414,106 Due from other governments 33,398
Total Assets 231,116,882
LiabilitiesNone -
Total Liabilities -
Net Position Restricted For Pensions 231,116,882$
See accompanying notes to financial statements.- 18 -

CITY OF EVANSTON, ILLINOIS
Statement of Changes in Fiduciary Net PositionFiduciary Funds
For the Fiscal Year Ended December 31, 2019
AdditionsContributions - employer 18,768,892$ Contributions - plan members 2,537,743
Total Contributions 21,306,635
Investment incomeNet appreciation in fair value of investments 34,935,424
Interest on investments 5,184,897 Less investment expenses (549,147)
Total Investment Income 39,571,174
Total Additions 60,877,809
DeductionsAdministration 149,676 Benefit payments and refunds 22,147,426
Total Deductions 22,297,102
Net Increase 38,580,707
Net Position Restricted For Pensions
January 1 192,536,175
December 31 231,116,882$
See accompanying notes to financial statements.- 19 -

CITY OF EVANSTON, ILLINOIS
Notes to the Financial Statements
For the Fiscal Year Ended December 31, 2019Page(s)
Note 1 Summary of Significant Accounting Policies
A. Reporting Entity 23-24B. Government-Wide and Fund Financial Statements 25C. Fund Accounting 25D. Measurement Focus, Basis of Accounting, and Financial Statement Presentation 26-28E. Cash and Cash Equivalents 28F. Investments 28G. Inventories and Prepaid Items 28H. Capital Assets 29I. Compensated Absences 29J. Long-Term Obligations 29K. Self-Insurance 30L. Deferred Inflows of Resources 30M. Property Taxes 30N. Fund Equity 31O. Interfund Transactions 31P. Use of Estimates 32Q. Conduit Debt 32R. Deferred Implementation 32
Note 2 Stewardship, Compliance, and Accountability
A. Deficit Fund Equity 33
Note 3 Deposits With Financial Institutions and Investments
A. Types of Accounts and Securities 34B. Pooling Cash and Investments 34C. Types of Investments 35D. Deposits 35
Note 4 Receivables
A. Summary of Receivables 36B. Loans Receivable - Special Revenue Funds 36
Note 5 Capital Assets
A. Capital Asset Activity 37-39B. Construction Commitments 39
- 20 -

CITY OF EVANSTON, ILLINOIS
Notes to the Financial Statements
For the Fiscal Year Ended December 31, 2019Page(s)
(Continued from the previous page)
Note 6 Interfunds
A. Interfund Accounts 40B. Interfund Advances 41C. Interfund Transfers 42-44
Note 7 Long-Term Debt
A. Changes in Long-Term Debt 45-46B. General Obligation Bonds Payable 47C. Notes Payable - IEPA Loans 48D. Postemployment Benefits other than Pensions (Defined Benefit Plan) 48-51
Note 8 Fund Equity
A. Restricted Net Position - Fiduciary Funds 52B. Assigned Fund Balances 52
Note 9 Individual Fund Activities
A. General Obligation Debt Service Fund 53B. Water Fund 53C. Special Service District No. 4 53
Note 10 Risk Management - Claims and Judgements 54
Note 11 Contingencies 55
Note 12 Joint Ventures
A. Solid Waste Agency of Northern Cook County 55-56
Note 13 Employee Retirement Systems
A. Plan Descriptions 57-71
Note 14 Pension Trust Funds
A. Schedule of Net Position 72B. Changes in Plan Net Position 73
- 21 -

CITY OF EVANSTON, ILLINOIS
Notes to the Financial Statements
For the Fiscal Year Ended December 31, 2019Page(s)
(Continued from the previous page)
Note 15 Evanston Library Component Unit
A. Types of Accounts and Securities 74B. Reconciliation of Cash and Investments 75C. Summary Receivables 75D. Capital Assets Activity 75E. Long-Term Debt 76F. Prior period adjustment 76
Note 16 Subsequent Event 77
- 22 -

CITY OF EVANSTON, ILLINOIS
Notes to the Financial Statements
For the Fiscal Year Ended December 31, 2019
NOTE 1. SUMMARY OF SIGNIFICANT ACCOUNTING POLICIES
The more significant of the City's and the Library's accounting policies are described below.
A. Reporting Entity
Blended Component Unit:
The financial statements of the City of Evanston, Illinois (the City) and Evanston Public Library (the Library or EPL)have been prepared in conformity with accounting principles generally accepted in the United States of America asapplied to governmental units (hereinafter referred to as generally accepted accounting principles (GAAP)). TheGovernmental Accounting Standards Board (GASB) is the accepted standard-setting body for establishing governmentalaccounting and financial reporting principles.
This report includes all of the funds of the City and the Library. The reporting entity for the City consists of the primarygovernment and its component units. Component units are legally separate organizations for which the primarygovernment is financially accountable or other organizations for which the nature and significance of their relationshipwith the primary government are such that their exclusion would cause the reporting entity's financial statements to bemisleading. The primary government is financially accountable if (1) it appoints a voting majority of the organization'sgoverning body and it is able to impose its will on that organization, (2) it appoints a voting majority of the organization'sgoverning body and there is a potential for the organization to provide specific financial benefits to, or impose specificfinancial burdens on, the primary government, (3) the organization is fiscally dependent on and there is a potential for theorganization to provide specific financial benefits to, or impose specific financial burdens on, the primary government.Certain legally separate, tax exempt organizations should also be reported as a component unit if all of the followingcriteria are met: (1) the economic resources received or held by the separate organization are entirely or almost entirelyfor the direct benefit of the primary government, its component units, or its constituents; (2) the primary government orits component units, is entitled to, or has the ability to access, a majority of the economic resources received or held bythe separate organization; and (3) the economic resources received or held by an individual organization that the primarygovernment, or its component units, is entitled to, or has the ability to otherwise access, are significant to the primarygovernment.
Component units are reported using one of two methods, discrete presentation or blending. Generally, component unitsshould be discretely presented in a separate column in the financial statements. A component unit should be reported aspart of the primary government using the blending method if it meets any one of the following criteria: (1) the primarygovernment and the component unit have substantively the same governing body and a financial benefit or burdenrelationship exists; (2) the primary government and the component unit have substantively the same governing body andmanagement of the primary government has operational responsibility for the component unit; (3) the component unitserves or benefits, exclusively or almost exclusively, the primary government rather than its citizens; or (4) the total debtof the component unit will be paid entirely or almost entirely from resources of the primary government.
The Town of the City of Evanston, Illinois (the Township) has been previously presented as a separate legal entity whichadministers General Assistance, a public welfare program assigned by Illinois law to townships. Eligible clients receivedGeneral Assistance for food, shelter, and medical needs. Through the town fund levy, the Township also supported anumber of community action programs, which provided direct services to welfare recipients. The Township was governedby a Township Board of Trustees and provided services within the same geographic boundaries of the City. TheTownship Board of Trustees were the same individuals as the City Council. The Township board levied taxes and wasresponsible for adopting the Township budget and approving payment of bills. On April 30, 2014, the Township wasdiscontinued and dissolved following the March 18, 2014 general election vote taken by the registered voters of theTownship. Pursuant to 60 ILCS 1/27-15 and 1/27-20, effective 12:00 am May 1, 2014, the City assumed all rights,powers, assets, property, obligations, and duties of the Township, including the responsibility of providing the servicesthat were previously provided by the Township. Beginning May 1, 2014, the functions of the Township are reportedalong with the City.
- 23 -

CITY OF EVANSTON, ILLINOIS
Notes to the Financial Statements
For the Fiscal Year Ended December 31, 2019
NOTE 1. SUMMARY OF SIGNIFICANT ACCOUNTING POLICIES - Continued
A. Reporting Entity - Continued
Discrete Component Unit:
The City's financial statements include two pension trust funds:
Police Pension Employees Retirement System
Firefighters' Pension Employees Retirement System
Joint Ventures:
The EPL serves the community through three branches. The EPL partners with Northwestern University and otheragencies to implement digitally based science, technology, and math learning opportunities for teens. The EPL iscontinually focused on expanding summer reading programs to serve the patrons of all ages. The Library has alsoexpanded community outreach by promoting library services at various local places and events.
The Library Director submits a proposed budget to the EPL Board of Trustees for the upcoming calendar year. Thisbudget is included in the budget documents submitted by the City Manager to the City Council. The Library budget islegally enacted through passage of a resolution by the City Council.
The EPL promotes the development of independent, self-confident, and literate citizens through the provision of openaccess to cultural, intellectual, and informational resources for all ages. Beginning FY 2013, the Library financials areshown separately as a discrete component unit of the City. However, the Library does not issue its own independent set offinancial statements. The Library Debt Service Fund was created as a part of FY2014 budget. The Library is governed bythe Library Board of Trustees. The board members are appointed by the Mayor of the City.
The City participates in one joint venture, which is reported as non-equity governmental joint venture and is described in Footnote 13. The joint venture is Solid Waste Agency of Northern Cook County (SWANCC).
The City’s financial statements include the Police Pension Employees Retirement System (PPERS) as a fiduciarycomponent unit reported as a pension trust fund. The City’s sworn police employees participate in the PPERS. PPERSfunctions for the benefit of these employees and is governed by a five-member pension board. Two members appointedby the City Council, one elected pension beneficiary, and two elected police employees constitute the pension board. Theparticipants are required to contribute a percentage of salary as established by state statute and the City is obligated tofund all remaining PPERS costs based upon actuarial valuations. The State of Illinois is authorized to establish benefitlevels and the City is authorized to approve the actuarial assumptions used in the determination of the City’s contributionlevels. Accordingly, the PPERS is fiscally dependent on the City.
The City’s financial statements include the Firefighters’ Pension System (the FPERS) as a fiduciary component unitreported as a Pension Trust Fund. The City’s sworn full-time firefighters participate in the FPERS. FPERS functions forthe benefit of these employees and is governed by a five-member pension board. Two members appointed by the CityCouncil, one elected pension beneficiary, and two elected from active participants of the Firefighters’ Pension Fundconstitute the pension board. The participants are required to contribute a percentage of salary as established by statestatute and the City is obligated to fund all remaining FPERS costs based upon actuarial valuations. The State of Illinoisis authorized to establish benefit levels and the City is authorized to approve the actuarial assumptions used in thedetermination of contribution levels. Accordingly, the FPERS is fiscally dependent on the City.
- 24 -

CITY OF EVANSTON, ILLINOIS
Notes to the Financial Statements
For the Fiscal Year Ended December 31, 2019
NOTE 1. SUMMARY OF SIGNIFICANT ACCOUNTING POLICIES - Continued
B. Government-Wide and Fund Financial Statements
C. Fund Accounting
Separate financial statements are provided for governmental funds, proprietary funds, and fiduciary funds, even thoughthe latter are excluded from the government-wide financial statements. Major individual governmental funds and majorindividual enterprise funds are reported as separate columns in the fund financial statements. Nonmajor funds arereported in the supplementary information.
The City and the Library use funds to report on its financial position and the results of its operations. A fund is a separateaccounting entity with a self-balancing set of accounts. Fund accounting is designed to demonstrate legal compliance andto aid financial management by segregating transactions related to certain government functions or activities.
Fiduciary funds are used to account for assets held on behalf of outside parties, including other governments, or on behalfof other funds within the City. When these assets are held under the terms of a formal trust agreement, a private purposetrust fund is used. The pension trust fund accounts for the activities of the Police and Firefighters' Pension Funds, whichaccumulate resources for pension benefit payments to retired police and fire personnel.
The government-wide financial statements (i.e., the statement of net position and the statement of activities) reportinformation on all of the nonfiduciary activities of the City and the Library. The effect of interfund activity has beenremoved from these statements excluding interfund services provided. Governmental activities, which normally aresupported by taxes and intergovernmental revenues, are reported separately from business-type activities, which rely to asignificant extent on fees and charges for support.
The statement of activities demonstrates the degree to which the direct expenses of a given function or segment are offsetby program revenues. Direct expenses are those that are clearly identifiable with a specific function or segment. Programrevenues include (1) charges to customers or applicants who purchase, use, or directly benefit from goods, services, orprivileges provided by a given function or segment and (2) grants and contributions that are restricted to meeting theoperational or capital requirements of a particular function or segment. Taxes and other items not properly includedamong program revenues are reported instead as general revenues.
Funds are classified into three categories: governmental, proprietary, and fiduciary. Each category, in turn, is dividedinto separate "fund types."
Governmental funds are used to account for all or most of the City's general activities, including the collection anddisbursement of restricted or committed monies (special revenue funds), the funds committed, restricted, or assigned forthe acquisition or construction of general capital assets (capital projects funds), and the funds restricted, committed, orassigned for the servicing of general long-term debt (debt service funds). The General Fund is used to account for allactivities of the City not accounted for in some other fund.
Proprietary funds are used to account for activities similar to those found in the private sector, where the determination ofnet income is necessary or useful for sound financial administration. Goods or services from such activities can beprovided either to outside parties (enterprise funds) or to other departments or agencies primarily within the City (internalservice funds). Internal service funds are included with the governmental funds on the government-wide financialstatements.
- 25 -

CITY OF EVANSTON, ILLINOIS
Notes to the Financial Statements
For the Fiscal Year Ended December 31, 2019
NOTE 1. SUMMARY OF SIGNIFICANT ACCOUNTING POLICIES - Continued
D. Measurement Focus, Basis of Accounting, and Financial Statement Presentation
1.) Taxes 5.) Recycling program fees and salesProperty *Sales (home rule) 6.) FinesUtility Traffic finesPersonal propertyHotel tax 7.) IntergovernmentalAthletic contest tax Motor fuel tax allotmentsCigarette tax Local motor fuel tax allotmentsLiquor tax GrantsParking tax Supplemental Security income reimbursements
Income taxes 2.) Licenses Sales taxes
Use tax3.) Franchise fees
8.) Investment income4.) Charges for services
* Property taxes are defined as available if collected within at most 60 days after fiscal year end.
The City reports the following major governmental funds:
The General Fund is the City's primary operating fund. It accounts for all financial resources of the generalgovernment, except those accounted for in another fund.
The Crown Capital Fund is a capital projects fund which accounts for the capital improvements (primarily alleypaving) financed by both special assessments on property owners and city contributions.
The government-wide financial statements are reported using the economic resources measurement focus and the accrualbasis of accounting, as are the proprietary fund statements. Revenues are recorded when earned and expenses arerecorded when a liability is incurred, regardless of the timing of related cash flows. Property taxes are recognized asrevenues in the year for which they are levied. Grants and similar items are recognized as revenue as soon as all eligibilityrequirements imposed by the provider have been met.
Governmental funds report deferred inflows of resources in connection with receivables for revenues that are notconsidered to be available to liquidate liabilities of the current period.
The General Obligation Debt Fund is a debt service fund which accumulate monies for the principal and interestpayments on general obligation debt.
The City's and the Library's governmental fund financial statements are reported using the current financial resourcesmeasurement focus and the modified accrual basis of accounting. Revenues are recognized as soon as they are bothmeasurable and available. Revenues are considered to be available when they are collectible within the current period orsoon enough thereafter to pay liabilities of the current period, generally 60 days except for sales taxes andtelecommunication taxes which use 90 days. Expenditures generally are recorded when a liability is incurred, as underaccrual accounting. However, debt service expenditures, as well as expenditures related to compensated absences, arerecorded when payment is due or when amounts have been accumulated in the debt service fund for payment to be madeearly in the following year.
The following revenues associated with the current fiscal period are all considered to be susceptible to accrual and sohave been recognized as revenues of the current fiscal period.
All other revenue items are considered to be measurable and available only when cash is received by the City and theLibrary.
- 26 -

CITY OF EVANSTON, ILLINOIS
Notes to the Financial Statements
For the Fiscal Year Ended December 31, 2019
NOTE 1. SUMMARY OF SIGNIFICANT ACCOUNTING POLICIES - Continued
D. Measurement Focus, Basis of Accounting, and Financial Statement Presentation - Continued
The City reports the following major proprietary funds:
Additionally, the City reports the following fund types:
The Library reports the Operating Fund, Endowment Fund, and Debt Service Fund.
Proprietary funds distinguish operating revenues and expenses from non-operating items. Operating revenues andexpenses generally result from providing services and producing and delivering goods in connection with a proprietaryfund's principal ongoing operations. The principal operating revenues of the enterprise funds and of the City’s internalservice funds are charges to customers for sales and services. Operating expenses for enterprise funds and internal servicefunds include the cost of sales and services, administrative expenses, and depreciation on capital assets. All revenues andexpenses not meeting this definition are reported as non-operating revenues and expenses.
The Solid Waste Fund accounts for the recycling, refuse, and yard waste removal services related fees andexpenses. Refuse and yard waste are contracted out, while recycling is handled by the City staff.
The Motor Vehicle Parking System accounts for the provision of the public and residential parking facility onChurch Street, Maple Avenue, and Sherman Avenue, as well as all the City's parking lots and meters. All activitiesare accounted for including administration, operations, financing, and revenue collection.
The Water Fund accounts for the provision of water services to the residents of the City and the sale of water to theVillage of Skokie, Illinois and the Northwest Water Commission. All activities necessary to provide such servicesare accounted for in this fund, including, but not limited to, administration, operation, maintenance, financing andrelated debt service, and billing and collection.
The Sewer Fund accounts for the provision of sewer repair and improvement services to the residents of the City.All activities necessary to provide such services are accounted for in this fund, including administration, operations,financing, and billing and collection.
Pension Trust Funds account for the activities of the Police and Firefighters' Pension Funds, which accumulateresources for pension benefit payments to qualified public safety employees.
As a general rule, the effect of interfund activity has been eliminated from the government-wide financial statements.Exceptions to this general rule are charges between the City's enterprise funds and various other functions of thegovernment. Elimination of these charges would distort the direct costs and program revenues reported for the variousfunctions concerned.
Amounts reported as program revenues include (1) charges to customers for goods, services, or privileges provided, (2)operating grants and contributions, and (3) capital grants and contributions, including assessments. Internally dedicatedresources are reported as general revenue rather than as program revenue. Likewise, general revenues include all taxes.
Internal Service Funds account for the fleet management and insurance services provided to other departments oragencies of the government, or to other governments, on a cost reimbursement basis.
- 27 -

CITY OF EVANSTON, ILLINOIS
Notes to the Financial Statements
For the Fiscal Year Ended December 31, 2019
NOTE 1. SUMMARY OF SIGNIFICANT ACCOUNTING POLICIES - Continued
D. Measurement Focus, Basis of Accounting, and Financial Statement Presentation - Continued
E. Cash and Equivalents
F. Investments
G. Inventories and Prepaid Items
Investments with a maturity of less than one year when purchased, non-negotiable certificates of deposit, and othernonparticipating investments are stated at cost or amortized cost. Investments with a maturity greater than one year whenpurchased and all investments of the pension trust funds are stated at fair value. Fair value is the price that would bereceived to sell an asset or paid to transfer a liability in an orderly transaction between market participants at themeasurement date.
Inventories in the Water, Sewer, and Fleet Service Funds are valued at cost. Inventory amounts are recorded on the basisof a physical count.
The City and Library report unearned revenue and unavailable/deferred revenue on its financial statements. Unavailablerevenues arise when a potential revenue does not meet both the measurable and available criteria for recognition in thecurrent period, under the modified accrual basis of accounting. Deferred revenues arise when property tax levies areintended to finance the next fiscal year. Unearned revenue arises when a revenue is measurable but not earned under theaccrual basis of accounting. Unearned revenues also arise when resources are received by the City and Library before ithas a legal claim to them or prior to the provision of services, as when grant monies are received prior to the issuance ofqualifying expenditures. In subsequent periods, when both revenue recognition criteria are met, or when the City andLibrary have a legal claim to the resources, the liability and deferred inflows of resource for unearned andunavailable/deferred revenue are removed from the financial statements and revenue is recognized.
Certain payments to vendors reflect costs applicable to future accounting periods and are recorded as prepaid items inboth government-wide and fund financial statements. In governmental funds, prepaid items are recorded based onconsumption method.
When both restricted and unrestricted resources are available for use, it is the City and Library’s policy to use restrictedresources first, then unrestricted resources as they are needed.
Cash and equivalents represent cash on hand, cash deposited in interest-bearing and non-interest-bearing checkingaccounts, and investments in money markets, certificates of deposit, and treasury obligations with maturities of threemonths or less at the date of acquisition, and cash deposited with The Illinois Funds.
- 28 -

CITY OF EVANSTON, ILLINOIS
Notes to the Financial Statements
For the Fiscal Year Ended December 31, 2019
NOTE 1. SUMMARY OF SIGNIFICANT ACCOUNTING POLICIES - Continued
H. Capital Assets
Description Years Description Years
Land improvements 10-100 Buildings and improvements 10-50Leasehold improvements 10-100 Office equipment and furniture 5-15Plant 20-100 Machinery and equipment 3-15Transmission and distribution Infrastructure 30-100 system 5-100 Library collections 7Sewer system and Intangible assets 5-10 underground lines 75-100Parking meters 15
I. Compensated Absences
J. Long-Term Obligations
Property, plant, and equipment are depreciated, and intangible assets are amortized using the straight-line method overthe following estimated useful lives:
A capital asset is property, such as equipment, buildings, land, utility infrastructure, roads, bridges with a cost or valueequal to or greater than $20,000 (per asset) at the date of acquisition and an expected useful life of more than one year(12 months or longer). Acquisition of motor vehicles is an exception to the $20,000 threshold. Also additional cost of lessthan $20,000 associated with an asset may be capitalized if the expense is necessary to put the asset in service or itsintended use; and/or if it extends the service life of the asset. Such assets are recorded at historical cost or estimatedhistorical cost if purchased or constructed. Donated capital assets are recorded at acquisition value at the date ofdonation.
The costs of normal maintenance and repairs that do not add to the value of the asset or materially extend assets' lives arenot capitalized. Infrastructure acquired prior to the February 28, 2003 implementation of GASB Statement No. 34 hasbeen reported.
In the fund financial statements, governmental fund types recognize bond premiums and discounts, as well as bondissuance costs, during the current period. The face amount of debt issued is reported as other financing sources.Premiums received on debt issuances are reported as other financing sources, while discounts on debt issuances arereported as other financing uses. Issuance costs, whether or not withheld from the actual debt proceeds received, arereported as debt service expenditures.
In the government-wide financial statements and proprietary fund types in the fund financial statements, long-term debt,and other long-term obligations are reported as liabilities in the applicable governmental activities, business-typeactivities, or proprietary fund type statement of net position. Bond premiums and discounts, if material, are deferred andamortized over the life of the bonds. Bonds payable are reported net of the applicable bond premium or discount.
Major outlays for capital assets and improvements are capitalized as projects are constructed.
It is the City's and the Library’s policy to permit employees to accumulate earned but unused vacation and sick paybenefits. All payments due in the event of termination are accrued when incurred in the government-wide and proprietaryfund financial statements. The General Fund has been used in prior years to liquidate the liability for compensatedabsences of governmental funds.
- 29 -

CITY OF EVANSTON, ILLINOIS
Notes to the Financial Statements
For the Fiscal Year Ended December 31, 2019
NOTE 1. SUMMARY OF SIGNIFICANT ACCOUNTING POLICIES - Continued
K. Self-Insurance
L. Deferred Inflows/Outflows of Resources
M. Property Taxes
The property tax calendar for Cook County is as follows:
Description Date
Lien date January 1 of levy yearLevy date December of levy yearFirst installment due date (55% of prior bill) March 1/April 1 of year following levy yearSecond installment due date (balance of total bill) September 1/October 1 of year following levy year
In addition to assets, the statement of financial position will sometimes report a separate section for deferred outflows ofresources. This separate financial statement element, deferred outflows of resources, represents a consumption of netassets that applies to a future period(s) and so will not be recognized as an outflow of resources (expense/expenditure)until then.
In addition to liabilities, the statement of financial position will sometimes report a separate section for deferred inflowsof resources. This separate financial statement element, deferred inflows of resources, represents an acquisition of netassets that applies to a future period(s) and so will not be recognized as an inflow of resources (revenue) until that time.
Property taxes are collected by the Cook County Collector and are remitted periodically to all taxing bodies, including theCity and Library. Distributions are made more often during the two main collection periods. Property taxes are levied ona calendar year basis by passage of a tax levy ordinance.
The City and the Library are self-insured to certain limits for general liability claims and for workers' compensationinsurance. A liability is recorded when it is probable that a loss has occurred and the amount of the loss can be reasonablyestimated. Claims liabilities are based on estimates of the ultimate cost of reported claims including future claimsadjustment expenses. General liability and workers' compensation claims are paid out of the Insurance Fund.
Property taxes are recognized as revenues in the year for which they are levied (i.e., intended to finance). On this basis,property tax revenue includes all cash distributions of property tax related to the 2018 tax levy received during the fiscalperiod between January 1, 2019 and December 31, 2019. A 3% allowance for loss is reflected in the City and the Libraryfinancial statements.
The 2019 tax levy collections are intended to finance the 2020 fiscal year and are not considered available for currentoperations and are, therefore, shown as unavailable/deferred revenue.
- 30 -

CITY OF EVANSTON, ILLINOIS
Notes to the Financial Statements
For the Fiscal Year Ended December 31, 2019
NOTE 1. SUMMARY OF SIGNIFICANT ACCOUNTING POLICIES - Continued
N. Fund Equity
O. Interfund Transactions
5. Unassigned - Includes residual positive fund balance within the General Fund which has not been classifiedwithin the other above mentioned categories. Unassigned fund balance may also include negative balances for anygovernmental fund if expenditures exceeds amounts restricted, committed, or assigned for those purposes.
Transactions that constitute reimbursements to a fund for expenditures/expenses initially made from it that are properlyapplicable to another fund are recorded as expenditures/expenses in the reimbursing fund and as reductions ofexpenditures/expenses in the fund that is reimbursed. All other interfund transactions are reported as transfers.
1. Nonspendable - Includes fund balance amounts that can not be spent either because they are not in spendableform or because legal or contractual stipulations require them to be maintained intact.
2. Restricted - Consists of fund balances with constraints placed on their use either by (1) external groups such ascreditors, grantors, contributors, or laws or regulations of other governments or (2) law through constitutional provisionsor enabling legislation.
3. Committed - Includes fund balance amounts that are constrained for specific purposes that are internally imposedby the government through formal action of the highest level of decision-making authority. Fund balance amounts arecommitted through a formal action of the City. This formal action must occur prior to the end of the reporting period, butthe amount of commitment, which will be subject to constraints, may be determined in the subsequent period. Anychanges to the constraints imposed require the same formal action of the City that originally created the commitment.
Assignments may not create unassigned deficits in any fund. However, nonspendable, restricted, or committed fundbalance may create an unassigned deficit. Also, restricted, committed, and assigned balances themselves may not benegative.
4. Assigned - Includes spendable fund balance amounts that are intended to be used for specific purposes that arenot considered restricted or committed. Fund balance may be assigned through the following: (1) Council may takeofficial action to assign amounts, (2) all remaining positive spendable amounts in governmental funds, other than theGeneral Fund, that are neither restricted nor committed. Assignments may take place after the end of the reporting period.
The City has established a policy requiring a minimum of 16.6% or two months of operating expenditures to bemaintained as a reserve. This is reported as unassigned fund balance.
In the government-wide and proprietary financial statements, restricted net position is legally restricted by outside partiesfor a specific purpose. Net position has not been restricted by enabling legislation adopted by the City. Net investment incapital assets represents the book value of capital assets less any long-term debt outstanding issued to construct thecapital assets.
The City and the Library consider restricted amounts to be spent first when both restricted and unrestricted fund balanceis available unless there are legal documents/contracts that prohibit doing this, such as in grant agreements requiringdollar for dollar spending. Additionally, the City and the Library would first use committed, then assigned, and lastlyunassigned amounts of unrestricted fund balance when expenditures are made.
Governmental fund equity is classified as fund balance. In February 2009, GASB issued Statement No. 54, Fund
Balance Reporting and Governmental Fund Type Definitions. This statement establishes fund balance classificationsbased primarily on the extent to which the government is bound to honor constraints on the use of the resources reportedin each governmental fund as well as establishes additional notes disclosures regarding fund balance classificationpolicies and procedures. The City Council may, by an ordinance, establish, modify, or remove a fund balancecommitment. In accordance with GASB Statement No. 54, the City and the Library classifies governmental fund balanceas follows:
- 31 -

CITY OF EVANSTON, ILLINOIS
Notes to the Financial Statements
For the Fiscal Year Ended December 31, 2019
NOTE 1. SUMMARY OF SIGNIFICANT ACCOUNTING POLICIES - Continued
P. Use of Estimates
Q. Conduit Debt
Q. Deferred Implementation
The City approved the issuance of $5,000,000 Series 2010 Revenue Bonds during the fiscal year 2010-2011 to providefinancial assistance to Chiaravalle Montessori School, deemed to be in public interest. The use of proceeds includes theproperty purchase from the City, improvement to the existing building, refinancing existing debt, and payment ofmiscellaneous costs. The bonds are secured by the property or mortgages financed and are payable from the monies,securities, and other revenues pledged under the indenture by the school. The City is not obligated in any manner for therepayment of bonds. Accordingly, the bonds outstanding are not reported as a liability in these financial statements. TheSeries 2010 Revenue Bonds were refunded in 2019, and the City approved the issuance of $3,925,000 Series 2019ARevenue Bonds and $3,735,000 Series 2019B Revenue Bonds, dated December 1, 2019. As of December 31, 2019,outstanding bond balance of the 2019A Revenue Bonds was $3,925,000 and outstanding balance of the 2019B RevenueBonds was $3,735,000.
In preparing financial statements, management is required to make estimates and assumptions that affect the reportedamounts of assets and liabilities, the disclosure of contingent assets and liabilities at the date of the financial statements,and the reported amounts of revenues and expenses during the reporting period. Actual results could differ from thoseestimates.
The City has chosen to defer the implementation of GASB Statement No. 83, Certain Asset Retirement Obligations, asallowable under GASB Statement No. 95, Postponement of the Effective Dates of Certain Authoritative Guidance.
The City approved the issuance of $13,590,000 Series 2011 Revenue Bonds during the fiscal period ended December 31,2011 to provide financial assistance to Roycemore School, deemed to be in public interest. The use of proceeds includesthe property purchase and renovation of 1201 Davis, the new location of the school, and payment of miscellaneous costs.The bonds are secured by the property or mortgages financed and are payable from the moneys, securities, and otherrevenues pledged under the indenture by the school. The City is not obligated in any manner for the repayment of bonds.Accordingly, the bonds outstanding are not reported as a liability in these financial statements. As of December 31, 2019,outstanding bond balance was $11,890,000.
- 32 -

CITY OF EVANSTON, ILLINOIS
Notes to the Financial Statements
For the Fiscal Year Ended December 31, 2019
NOTE 2. STEWARDSHIP, COMPLIANCE, AND ACCOUNTABILITY
A. Deficit Fund Equity
The Insurance Fund, an internal service fund, had a net deficit of $11,593,098 as of December 31, 2019. The Cityplans to use current resources to pay for future liabilities.
The Solid Waste Fund had a net deficit of $298,490 as of December 31, 2019. The City plans to use current resourcesto pay for future liabilities.
The Special Service District No. 4 had a net deficit of $226,193 as of December 31, 2019. The City plans to usecurrent resources to pay for future liabilities.
- 33 -

CITY OF EVANSTON, ILLINOIS
Notes to the Financial Statements
For the Fiscal Year Ended December 31, 2019
NOTE 3. DEPOSITS WITH FINANCIAL INSTITUTIONS AND INVESTMENTS
A. Types of Accounts and Securities
B. Pooling of Cash and Investments
The City and pension funds categorize the fair value measurements within the fair value hierarchy established by generally accepted accountingprinciples. The hierarchy is based on the valuation inputs used to measure the fair value of the asset. Level 1 inputs are quoted prices in active markets foridentical assets; Level 2 inputs are significant other observable inputs; and Level 3 inputs are significant unobservable inputs.
Illinois Statutes and the City's investment policies authorize the City to invest in obligations of the U.S. Treasury, in Government Sponsored Enterprises(GSE) such as Federal Home Loan Mortgage Corporation (FHLMC), Federal Home Loan Bank (FHLB), and Fannie Mae (FNMA); bankers acceptancesas well as commercial paper rated only in the highest tier; repurchase agreements of the highest grade; collateralized certificates of deposit issued by FDICinsured financial institutions, money market mutual funds with portfolios limited to securities guaranteed by the United States Government, the IllinoisMetropolitan Investment Fund (IMET), and The Illinois Funds.
It is the policy of the City to invest public funds in a manner whereby its investment objectives are prioritized in the following order: safety of principal,liquidity, and rate of return. The City also seeks to maintain diversification of investments to avoid overconcentration of any one specific issuer orbusiness sector. To mitigate interest rate risk, the City tries to structure the investment portfolio to meet daily cash flow needs so as to avoid needing to sell securities on the open market. The City seeks to attain market rates of return consistent with constraints imposed by safety and cash flow needs. The Cityinvests to conform to all state and local statutes governing the investment of public funds. More detail is available in the City's investment policy.
The Firefighters' and Police Pension Funds are set up for the exclusive purpose of providing retirement and other benefits to plan participants andbeneficiaries. All investments are governed and authorized by the respective Fire and Police Pension Boards. The investment objectives and parametersmirror those listed above for the City. However, unlike the City's public funds, the Firefighters' and Police Pension Funds may invest in various equityaccounts up to a limit of 65% of the aggregate value of each respective fund's assets. The pension funds invest to conform to all state and local statutesgoverning pension funds. Additional detail is available in each pension fund's investment policies.
Except for cash and investments in certain restricted and special accounts, the City pools the cash of various funds to maximize interest earnings. Interestincome is allocated to the various funds based upon their respective participation.
The Illinois Funds, created by the Illinois State Legislature under the control of the State Comptroller, operates as qualified external investment pools inaccordance with the criteria established in GASB Statement No. 79, Certain External Investment Pools and Pool Participants , and thus, reports allinvestments at amortized cost rather than fair value. The investment in The Illinois Funds by participants is also reported at amortized cost. The IllinoisFunds does not have any limitations or restrictions on participant withdrawals. The Illinois Funds Treasurer's Office issues a separate financial report forThe Illinois Funds which may be obtained by contacting the Administrative Office at Illinois Business Center, 400 West Monroe Street, Suite 401,Springfield, Illinois 62704.
IMET is a not-for-profit investment trust formed pursuant to the Illinois Municipal code and managed by a Board of Trustees elected from theparticipating members. IMET is not registered with the SEC as an investment company. Investments in IMET are valued at IMET's share price, the pricefor which the investment could be sold.
- 34 -

CITY OF EVANSTON, ILLINOIS
Notes to the Financial Statements
For the Fiscal Year Ended December 31, 2019
NOTE 3. DEPOSITS WITH FINANCIAL INSTITUTIONS AND INVESTMENTS – Continued
C. Types of Investments
The following table presents the investment and maturities of the City's debt securities as of December 31, 2019:
Fair Value Less Than 1 Year 1 - 5 Years 6 - 10 Years Greater than 10 Years
Municipal bonds 1,338,052$ 1,338,052 - - -
Total 1,338,052$ 1,338,052 - - -
D. Deposits
Deposits consist of deposits in interest-bearing and non-interest-bearing checking accounts. At December 31, 2019, the carrying amount of the City'sdeposits, including cash on hand of $10,200 was $25,755,732. The financial institutions' balances totaled $31,758,614.
Interest Rate Risk. The City's investment policy does not limit investment maturities as a means of managing its exposure to fair value losses arising fromincreasing interest rates. The objective is to maintain a core portfolio with maturities primarily in the three month to three years range.
Credit Risk. State law limits investments in commercial paper, corporate bonds, and mutual bonds funds to the top two ratings issued by nationallyrecognized statistical rating organizations. The City's investment policy does not impose further limits on investment choices. The Police and Firefighters'Pension Funds have investments in corporate bonds with S&P ratings ranging from BBB- to AAA. The Illinois Funds and money markets were ratedAAA by Standard & Poor's. IMET exclusively invests in AAA Standard & Poor's securities, such as treasury and agency obligations. The City'smunicipal bond investments were rated from Aa3 to Aa2 by Moody's. IMET's Convenience Fund collateralizes all of its deposits 110%. The investmentsin the securities of the U.S. government agencies were all rated AAA or Aaa by the Standard & Poor’s and by Moody’s Investor’s Services. Thefollowing investments of the City in The Illinois Funds, PMA, and IMET are valued at the funds' share price, the price for which the investments could besold.
Custodial Credit Risk. For an investment, custodial credit risk is the risk that, in the event of the failure of the counterparty, the City will not be able torecover the value of its investment or collateral securities that are in the possession of an outside party. All of the City's investments were insured,registered, or held by the counterparty’s trust department in the City’s name.
On September 29, 2014, IMET was informed of defaults on certain loans believed to be guaranteed in its Convenience Fund caused by fraud on the partof First Farmer's Financial (FFF), a USDA approved lender. This resulted in a decrease in the value of the City's IMET investment in the amount of$552,862 and leaving an impairment on the remaining balance of $169,720. The City believes that it will recover the remaining value of the investment.
Concentration of Credit Risk. It is the policy of the City to diversify its investment portfolio. Investments shall be diversified to eliminate the risk of lossresulting from overconcentration in a security, maturity, issuer, or class of securities.
Custodial Credit Risk. For a deposit, custodial credit risk is the risk that, in the event of the failure of the counterparty, the City will not be able torecover the value of its deposit or collateral securities that are in the possession of an outside party. Collateral is required for City deposits equal to orgreater than the amount of City deposits which exceed FDIC insured amounts. The City's depository pledges a Federal Home Loan Bank line of credit inthe City's name as collateral. All of the City's deposits were insured or collateralized at December 31, 2019.
The City has the following recurring fair value measurements as of December 31, 2019. The investments in municipal bonds and mutual funds are valued using quoted matrix pricing models (Level 2 inputs).
City Investment TypeInvestment Maturities (In Years)
- 35 -

CITY OF EVANSTON, ILLINOIS
Notes to the Financial Statements
For the Fiscal Year Ended December 31, 2019
NOTE 4. RECEIVABLES
A. Summary of Receivables
GeneralGovernmental Business-Type
Activities Activities TotalReceivables (net, where applicable,
of allowances for uncollectibles):Amusement tax 32,518$ -$ 32,518$ Cigarette tax 36,000 - 36,000 Hotel tax 79,243 - 79,243 Liquor tax 332,223 - 332,223 Local motor fuel tax 89,524 - 89,524 Parking tax 97,031 - 97,031 Franchise fees - 32,030 32,030 Transportation network tax 260,092 260,092 Other miscellaneous 47,955 801,177 849,132
Net Total Receivables 974,586$ 833,207$ 1,807,793$
B. Loans Receivable - Special Revenue Funds
Loan Interest Loans Loan LoanType Rates Beginning Made Repayments Adjustments Ending
Title Transfer 0% - 8% 2,455,944$ 55,173$ 69,178$ 4,327$ 2,446,266$ Amortizing 0% - 8% 1,097,527 - 59,693 - 1,037,834 Forgivable 0% - 8% 4,811,680 - 263,253 (21,845) 4,526,582 Allowance (78,000) - - - (78,000)
Total Loans 8,287,151$ 55,173$ 392,124$ (17,518)$ 7,932,682$
Other receivables as of December 31, 2019 for the government’s individual major funds, nonmajor, internal service funds, and fiduciary funds in theaggregate, including the applicable allowances for uncollectible accounts, are as follows:
The City provides resources to city residents for the sale and rehabilitation of single-family and multi-family housing. Initial funding for these resourceswas from Community Development Block Grant (CDBG) and Housing and Urban Development (HUD) Funds. Three types of loans are made: (1) titletransfer loans which are due in full when the housing unit is sold, (2) amortizing loans which are due in monthly installments over varying lengths of time,and (3) forgivable loans which are forgiven over varying lengths of time based on occupancy requirements. Repayments of principal and any interestearned on these receivables, which are recorded in the respective Special Revenue Funds, are used to make additional rehabilitation loans. An allowanceof $78,000 exists in the Special Revenue Funds due to doubtful accounts. Loan activity for the current period is summarized as follows:
Governmental funds report deferred inflows of resources in connection with receivables for revenues that are not considered to be available to liquidateliabilities of the current period. Governmental funds also defer revenue recognition in connection with resources that have been received, but not yetearned.
- 36 -

CITY OF EVANSTON, ILLINOIS
Notes to the Financial Statements
For the Fiscal Year Ended December 31, 2019
NOTE 5. CAPITAL ASSETS
A. Capital Asset Activity
Capital asset activity for the fiscal year ended December 31, 2019 was as follows:
Beginning Additions Deletions Transfers EndingGovernmental Activities:
Capital Assets, not being Depreciated:Land 7,193,044$ -$ -$ -$ 7,193,044$ Right of way 18,695,896 - - - 18,695,896 Artwork 373,551 - - - 373,551 Construction in progress 27,375,681 39,482,397 5,708,561 - 61,149,517
Total Capital Assets, not being Depreciated 53,638,172 39,482,397 5,708,561 - 87,412,008
Capital Assets, being Depreciated/Amortized:Buildings and improvements 86,921,300 1,429,838 - - 88,351,138 Office equipment and furniture 5,942,860 374,698 - - 6,317,558 Intangible assets 7,612,047 231,258 - - 7,843,305 Machinery and equipment 27,495,623 2,034,223 734,753 - 28,795,093 Infrastructure 186,593,067 5,309,740 - - 191,902,807 Capitalized leases 502,532 - - - 502,532
Total Capital Assets being Depreciated/Amortized 315,067,429 9,379,757 734,753 - 323,712,433
Less Accumulated Depreciation/Amortization for:Buildings and improvements 39,911,194 1,916,641 - - 41,827,835 Office equipment and furniture 4,418,503 331,703 - - 4,750,206 Intangible assets 6,656,117 226,253 - - 6,882,370 Machinery and equipment 19,803,505 1,686,133 734,753 - 20,754,885 Infrastructure 110,825,768 6,938,633 - - 117,764,401 Capitalized leases 482,992 3,908 - - 486,900
Total Accumulated Depreciation/Amortization 182,098,079 11,103,271 734,753 - 192,466,597
Total Capital Assets being Depreciated/Amortized, Net 132,969,350 (1,723,514) - - 131,245,836
Governmental Activities Capital Assets, Net 186,607,522$ 37,758,883$ 5,708,561$ -$ 218,657,844$
- 37 -

CITY OF EVANSTON, ILLINOIS
Notes to the Financial Statements
For the Fiscal Year Ended December 31, 2019
NOTE 5. CAPITAL ASSETS - Continued
A. Capital Asset Activity - Continued
Beginning Additions Deletions Transfers EndingBusiness-Type activities:
Capital Assets, not being Depreciated:Land 4,592,141$ -$ -$ -$ 4,592,141$ Construction in progress 2,130,401 16,429,800 814,887 - 17,745,314 Artwork 359,752 - - - 359,752
Total Capital Assets, not being Depreciated 7,082,294 16,429,800 814,887 - 22,697,207
Capital Assets, being Depreciated/Amortized:Land improvements 9,514,270 312,620 - - 9,826,890 Buildings and improvements 76,738,346 974,945 - - 77,713,291 Leasehold improvements 772,131 - - - 772,131 Plant 46,612,798 219,131 455,066 (24,776) 46,352,087 Transmission and distribution system 73,268,052 3,689,790 25,711 24,776 76,956,907 Sewer system and underground lines 255,526,032 1,502,480 - - 257,028,512 Intangible assets 1,260,258 115,150 124,918 - 1,250,490 Equipment 4,862,738 284,549 2,000,653 - 3,146,634 Parking meters 1,859,028 642,400 707,687 - 1,793,741
Total Capital Assets being Depreciated/Amortized 470,413,653 7,741,065 3,314,035 - 474,840,683
Less Accumulated Depreciation/Amortization for:Land improvements 3,056,861 442,089 - - 3,498,950 Buildings and improvements 30,387,777 1,849,268 - - 32,237,045 Leasehold improvements 332,011 25,793 - - 357,804 Plant 19,723,370 1,409,046 389,417 (26,389) 20,716,610 Transmission and distribution system 10,007,568 1,239,934 18,775 26,389 11,255,116 Sewer system and underground lines 63,248,917 3,463,035 - - 66,711,952 Intangible assets 768,688 85,613 121,956 - 732,345 Equipment 2,677,228 344,588 2,003,901 - 1,017,915 Parking meters 1,208,508 192,615 687,555 - 713,568
Total Accumulated Depreciation/Amortization 131,410,928 9,051,981 3,221,604 - 137,241,305
Total Capital Assets being Depreciated/Amortized, Net 339,002,725 (1,310,916) 92,431 - 337,599,378
Business-Type Activities Capital Assets, Net 346,085,019$ 15,118,884$ 907,318$ -$ 360,296,585$
- 38 -

CITY OF EVANSTON, ILLINOIS
Notes to the Financial Statements
For the Fiscal Year Ended December 31, 2019
NOTE 5. CAPITAL ASSETS - Continued
A. Capital Asset Activity - Continued
Depreciation expense was charged to functions/programs of the primary government as follows:
Governmental Activities:General management and support 545,890$ Public safety 665,950 Public works 7,085,327 Housing and economic development 9,303 Recreation and cultural opportunities 1,306,675 Internal service funds 1,490,126
Total Depreciation Expense - Governmental Activities 11,103,271$
Business-Type Activities:Water 2,648,980$ Sewer 3,681,927 Solid waste 26,783 Motor vehicle parking 2,694,291
Total Depreciation Expense - Business-Type Activities 9,051,981$
B. Construction Commitments
Capital Improvement Fund 17,506,399$ Motor Fuel Tax Fund 132,883 Water Fund 9,867,029 Sewer Fund 912,564 Motor Vehicle Parking System Fund 155,269
Total Construction Commitments 28,574,144$
The value of construction contracts signed, where the work has not yet been performed at December 31, 2019 is as follows:
- 39 -

CITY OF EVANSTON, ILLINOIS
Notes to the Financial Statements
For the Fiscal Year Ended December 31, 2019
NOTE 6. INTERFUNDS
A. Interfund Accounts
At December 31, 2019, interfund receivables and payables consist of the following:
Due DueFunds From To
General Fund 7,318,558$ 358,306$ Crown Capital Fund - 302,813 Debt Service Fund - 246,657 Water Fund 519,976 - Sewer Fund 1,188,089 - Solid Waste Fund - 1,010,451 Motor Vehicle Parking System Fund 63 - Nonmajor Governmental Funds 1,077,066 1,574,656 Fiduciary 33,398 - Internal Service Funds - 6,969,175
Total 10,137,150$ 10,462,058$
Due DueFunds From To
Component UnitCity
Capital Improvements Fund 324,908$ -$
Total 324,908$ -$ Library
Library General Fund -$ 1,055$ Capital Improvements Fund 1,055 -
Total 1,055$ 1,055$
The outstanding balances between funds result mainly from the time lag between the dates that (1) interfund goodsand services are provided or reimbursable expenditures occur, (2) transactions are recorded in the accountingsystem, and (3) payments between funds are made.
- 40 -

CITY OF EVANSTON, ILLINOIS
Notes to the Financial Statements
For the Fiscal Year Ended December 31, 2019
NOTE 6. INTERFUNDS - Continued
B. Interfund Advances
At December 31, 2019, interfund advances consist of the following:
Advances AdvancesFunds To From
Governmental FundsGeneral Fund
Capital Improvements Fund -$ 4,000,000$ Motor Vehicle Parking System - 119,200 Total General Fund - 4,119,200
Enterprise FundsMotor Vehicle Parking System
General Fund 119,200 - Total Motor Vehicle Parking System 119,200 -
Nonmajor Governmental FundsCapital Improvements Fund
General Fund 4,000,000 - Total Nonmajor Governmental Funds 4,000,000 -
Grand Total 4,119,200$ 4,119,200$
- 41 -

CITY OF EVANSTON, ILLINOIS
Notes to the Financial Statements
For the Fiscal Year Ended December 31, 2019
NOTE 6. INTERFUNDS - Continued
C. Interfund Transfers
At December 31, 2019, transfers in (out) consist of the following:
Transfers TransfersFunds In Out
Governmental FundsGeneral Fund
Emergency Telephone System 60,000$ -$ Dempster Dodge TIF 5,000 - Howard Ridge TIF 60,000 - Chicago-Main TIF 5,000 - Capital Improvement Fund - 198,181 Water 3,799,559 - Sewer 330,167 - Special Assessment 92,000 - Motor Vehicle Parking System 2,972,390 - Solid Waste - 150,000 Motor Fuel Tax 982,897 - West Evanston TIF 30,000 - General Obligation Debt Service Fund - 2,959,885 Good Neighbor 480,000 - Total General Fund 8,817,013 3,308,066
Crown Capital FundGeneral Obligation Debt Service - 302,813 Sewer Fund 1,000,000 - Total Crown Capital Fund 1,000,000 302,813
General Obligation Debt Service FundGeneral 2,959,885 - Insurance 10,114 - Fleet 35,114 - Sewer 251,152 - Special Assessment 194,955 - Capital Improvements 303,644 - Crown Capital 302,813 - Chicago-Main TIF 95,610 - Dempster Dodge TIF 65,870 - Howard Ridge TIF 143,112 - Community Development Block Grant 13,790 - Emergency Telephone System 14,034 -
Total General Obligation Debt Service Fund 4,390,093 -
Transfers are used to (1) move revenues from the fund with collection authorization to the Debt Service Fund as debtservice principal and interest payments become due, (2) move restricted amounts from borrowings to the Debt Service Fundto establish mandatory reserve accounts, (3) move restricted General Fund revenues to finance various programs that thegovernment must account for in other funds in accordance with budgetary authorization, including amounts provided assubsidies or matching funds for various grant programs.
- 42 -

CITY OF EVANSTON, ILLINOIS
Notes to the Financial Statements
For the Fiscal Year Ended December 31, 2019
NOTE 6. INTERFUNDS - Continued
C. Interfund Transfers - Continued
Transfers TransfersFunds In Out
Nonmajor Governmental FundsDempster Dodge TIF
General -$ 5,000$ General Obligation Debt Service Fund - 65,870 Total Dempster Dodge TIF - 70,870
Howard Ridge TIFGeneral - 60,000 General Obligation Debt Service Fund - 143,112 Total Howard Ridge TIF - 203,112
Chicago-Main TIFGeneral 5,000 General Obligation Debt Service Fund - 95,610 Total Chicago-Main TIF - 100,610
West Evanston Tax Increment DistrictGeneral - 30,000 Total West Evanston Tax Increment District - 30,000
Capital ImprovementsGeneral 198,181 - General Obligation Debt Service - 303,644 Total Capital Improvement 198,181 303,644
Special AssessmentGeneral 92,000 General Obligation Debt Service - 194,955 Total Special Assessment - 286,955
Emergency Telephone SystemGeneral - 60,000 General Obligation Debt Service - 14,034 Total Emergency Telephone System - 74,034
Motor Fuel TaxGeneral - 982,897 Total Motor Fuel Tax - 982,897
Community Development Block GrantGeneral Obligation Debt Service - 13,790 Total Community Development Block Grant - 13,790
- 43 -
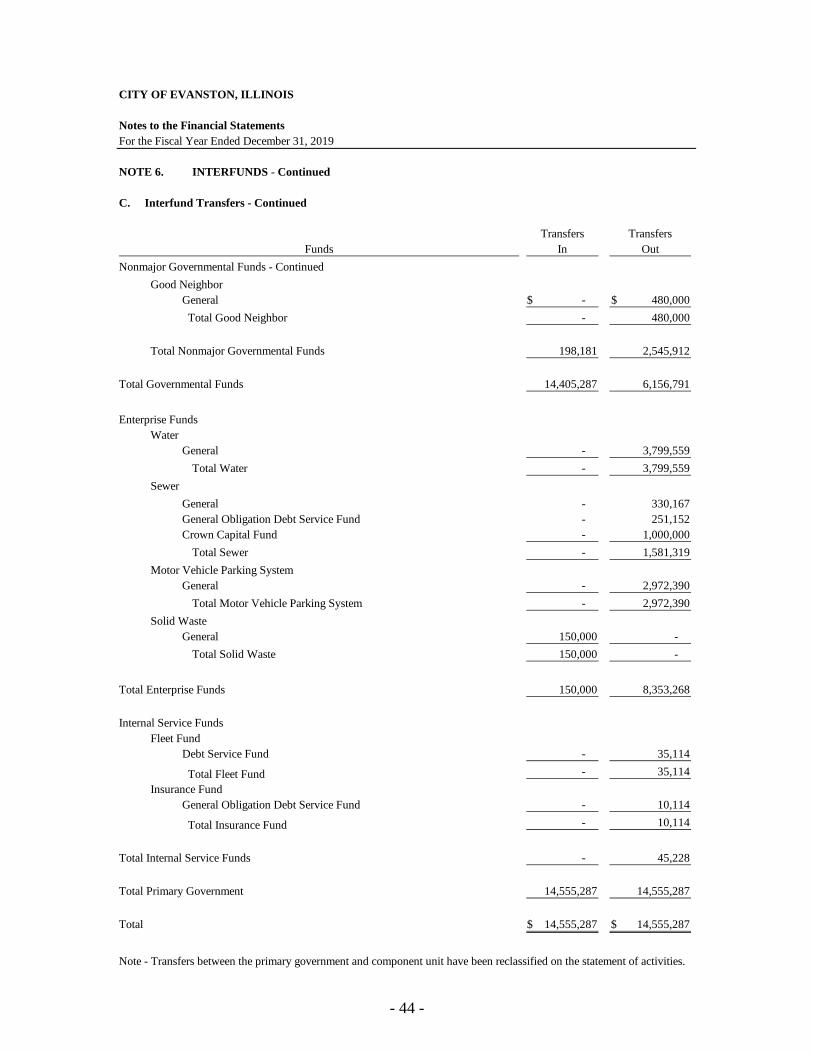
CITY OF EVANSTON, ILLINOIS
Notes to the Financial Statements
For the Fiscal Year Ended December 31, 2019
NOTE 6. INTERFUNDS - Continued
C. Interfund Transfers - Continued
Transfers TransfersFunds In Out
Nonmajor Governmental Funds - ContinuedGood Neighbor
General -$ 480,000$ Total Good Neighbor - 480,000
Total Nonmajor Governmental Funds 198,181 2,545,912
Total Governmental Funds 14,405,287 6,156,791
Enterprise FundsWater
General - 3,799,559 Total Water - 3,799,559
SewerGeneral - 330,167 General Obligation Debt Service Fund - 251,152 Crown Capital Fund - 1,000,000
Total Sewer - 1,581,319 Motor Vehicle Parking System
General - 2,972,390 Total Motor Vehicle Parking System - 2,972,390
Solid WasteGeneral 150,000 -
Total Solid Waste 150,000 -
Total Enterprise Funds 150,000 8,353,268
Internal Service FundsFleet Fund
Debt Service Fund - 35,114
Total Fleet Fund - 35,114 Insurance Fund
General Obligation Debt Service Fund - 10,114
Total Insurance Fund - 10,114
Total Internal Service Funds - 45,228
Total Primary Government 14,555,287 14,555,287
Total 14,555,287$ 14,555,287$
Note - Transfers between the primary government and component unit have been reclassified on the statement of activities.
- 44 -

CITY OF EVANSTON, ILLINOIS
Notes to the Financial Statements
For the Fiscal Year Ended December 31, 2019
NOTE 7. LONG-TERM DEBT
A. Changes in Long-Term Debt Final
Interest Maturity Balance Balance Due WithinRate Date 12/31/2018 Issued Refunded Payments 12/31/2019 One Year
G.O. Debt Governmental Activities
Series 2010A 2.00%-3.625% 12/1/2029 4,395,000$ -$ -$ 335,000$ 4,060,000$ 345,000$ Series 2010B 1.00%-3.30% 12/1/2019 948,066 - - 948,066 - - Series 2011A 2.00%-4.50% 12/1/2031 9,412,933 - - 589,421 8,823,512 605,016 Series 2012A 2.00%-3.25% 12/1/2032 5,960,000 - - 640,000 5,320,000 645,000 Series 2013A 2.00%-4.75% 12/1/2033 8,695,000 - - 490,000 8,205,000 500,000 Series 2013B 2.00%-3.00% 12/1/2025 10,696,847 - - 1,680,457 9,016,390 1,739,508 Series 2014 1.25%-5.00% 12/1/2034 7,945,000 - - 395,000 7,550,000 400,000 Series 2015A 2.00%-4.00% 12/1/2035 6,765,000 - - 300,000 6,465,000 320,000 Series 2015B 2.00%-3.00% 12/1/2022 6,775,000 - - 1,550,000 5,225,000 1,750,000 Series 2016A 2.00%-4.00% 12/1/2036 8,720,000 - - 395,000 8,325,000 405,000 Series 2016B 2.00%-3.00% 12/1/2026 6,275,000 - - 720,000 5,555,000 730,000 Series 2017A 3.00%-4.00% 12/1/2037 11,245,000 - - 440,000 10,805,000 455,000 Series 2017B 4.00%-5.00% 12/1/2027 7,575,855 - - 946,981 6,628,874 763,102 Series 2017C 2.05%-4.00% 12/1/2035 5,000,000 - - - 5,000,000 230,000 Series 2018A 3.12%-5.00% 12/1/2043 24,385,000 - - - 24,385,000 - Series 2018B 2.29%-5.00% 12/1/2038 9,675,439 - - - 9,675,439 - Series 2018C 4.00%-5.00% 12/1/2038 6,662,680 - - 87,230 6,575,450 888,911 Series 2018D 3.70%-4.25% 12/1/2035 3,570,000 - - - 3,570,000 - Series 2019A 1.72%-2.85% 12/1/2043 - 12,750,000 - - 12,750,000 - Series 2019B 1.66%-2.68% 12/1/2039 - 7,020,000 - - 7,020,000 211,396
Subtotal Governmental Activities 144,701,820 19,770,000 - 9,517,155 154,954,665 9,987,933
Bonds premium 6,353,933 4,205,940 - 640,603 9,919,270 - OPEB liability - City 17,123,787 3,521,783 - - 20,645,570 805,914 OPEB liability - Internal Service Funds 97,800 15,514 - - 113,314 4,423 Net pension liability - IMRF * - 16,538,083 - - 16,538,083 - Net pension liability - Police Pension 118,270,093 - - 8,623,507 109,646,586 - Net pension liability - Firefighters' Pension 96,445,512 742,223 - - 97,187,735 - Compensated absences payable - City 10,030,764 3,512,905 - 4,012,307 9,531,362 3,812,545 Compensated absences payable - Internal Service Funds 128,366 11,370 - 25,673 114,063 22,813 First Bank loan 648,812 - - 648,812 - - Other loans 3,131 - - 3,131 - - Claims payable 4,657,600 6,013,618 - 3,244,668 7,426,550 1,391,550
Subtotal Other Governmental Activities Liabilities 253,759,798 34,561,436 - 17,198,701 271,122,533 6,037,245
Total Governmental Activities Debt and Liabilities 398,461,618$ 54,331,436$ -$ 26,715,856$ 426,077,198$ 16,025,178$
G.O. Debt Business-Type Activities
Series 2010B W/S/San/Pkg 1.00%-3.30% 12/1/2019 186,935$ -$ -$ 186,935$ -$ -$ Series 2011A W/S 2.00%-4.50% 12/1/2031 2,887,063 - - 180,579 2,706,484 184,984 Series 2012A 2.00%-3.25% 12/1/2032 3,395,000 - - 200,000 3,195,000 205,000 Series 2013A - Water 2.00%-4.75% 12/1/2033 1,630,000 - - 80,000 1,550,000 85,000 Series 2014 1.25%-5.00% 12/1/2034 2,330,000 - - 105,000 2,225,000 110,000 Series 2015A 2.00%-4.00% 12/1/2035 4,915,000 - - 210,000 4,705,000 220,000 Series 2016A 2.00%-4.00% 12/1/2036 3,355,000 - - 140,000 3,215,000 145,000 Series 2017A 3.00%-4.00% 12/1/2037 945,000 - - 40,000 905,000 40,000 Series 2018B 2.29%-5.00% 12/1/2038 4,837,719 - - - 4,837,719 - Series 2018C 4.00%-5.00% 12/1/2038 1,357,320 - 17,770 1,339,550 181,089 Series 2019B 1.66%-2.68% 12/1/2039 - 3,930,000 - - 3,930,000 118,345
Subtotal Business-Type Activities 25,839,037 3,930,000 - 1,160,284 28,608,753 1,289,418
IEPA loans 2.535%-3.59% Various 34,921,822 11,158,562 - 5,388,833 40,691,551 5,040,700
Bonds premium 1,343,637 827,278 - 197,383 1,973,532 - Compensated absences payable - City 918,391 111,932 - 183,678 846,645 169,329 Net pension liability - IMRF * - 4,463,655 - - 4,463,655 - OPEB liability 814,509 149,954 - - 964,463 37,648
Subtotal Other Business-Type Activities Liabilities 3,076,537 5,552,819 - 381,061 8,248,295 206,977
Total Business-Type Activities Debt and Liabilities 63,837,396$ 20,641,381$ -$ 6,930,178$ 77,548,599$ 6,537,095$
Total Governmental and Business-Type Activities Debt and Liabilities 462,299,014$ 74,972,817$ -$ 33,646,034$ 503,625,797$ 22,562,273$
Note: Sewer Fund, Water Fund, Solid Waste Fund, Parking Fund, and General Fund have been used to liquidate IMRF pension liability. General Fund, Fleet Fund, Water Fund,Parking Fund, Solid Waste Fund, and Sewer Fund have been used to liquidate other postemployment benefit obligations.
- 45 -

CITY OF EVANSTON, ILLINOIS
Notes to the Financial Statements
For the Fiscal Year Ended December 31, 2019
NOTE 7. LONG-TERM DEBT - Continued
A. Changes in Long-Term Debt - Continued
Business-Type Activities - IEPA Loans
IEPA loans payable consist of the following:
Date of Final Interest OriginalIssue Maturity Rates Indebtedness Balance
Various Various Various 113,805,322$ 40,691,551$
Total Business-Type Activities - IEPA Loan Debt 40,691,551$
Business-type activities IEPA loans are payable from revenues derived from Sewer and Water service fees. The City haspledged future revenues, net of operating expenses, to repay principal totaling $113,805,322 in IEPA loans issued in 1994through 2019. Proceeds from the loans provided financing for the Long-Term Sewer and Water Improvement Program. The IEPA loans, payable from operating revenues, are payable through 2040. Annual principal and interest on the loans areexpected to require $5,695,999 of net revenues for the fiscal year 2020. The total principal and interest remaining to be paidon the loans is $40,900,138. Principal and interest paid for the current period and total customer net revenues were$6,174,889 and $9,669,676, respectively.
- 46 -

CITY OF EVANSTON, ILLINOIS
Notes to the Financial Statements
For the Fiscal Year Ended December 31, 2019
NOTE 7. LONG-TERM DEBT - Continued
B. General Obligation Bonds Payable
Year Ending Governmental Activities Business-Type ActivitiesDecember 31, Principal Interest Principal Interest
2020 9,987,933$ 5,853,046$ 1,289,418$ 1,103,278$ 2021 10,286,763 5,550,110 1,335,894 1,054,055 2022 11,170,864 5,225,067 1,359,429 1,001,849 2023 9,783,164 4,833,448 1,416,107 947,102 2024 9,490,771 4,469,490 1,640,837 889,794
2025-2029 41,396,374 16,959,338 9,094,887 3,386,933 2030-2034 32,498,157 9,638,008 8,563,504 1,632,099 2035-2039 20,780,638 4,303,019 3,908,677 390,824 2040-2044 9,560,000 1,064,250 - -
Total 154,954,664$ 57,895,776$ 28,608,753$ 10,405,934$
The City issues general obligation bonds to provide funds for the acquisition and construction of major capital facilities.General obligation bonds have been issued for both governmental and business-type activities.
General obligation bonds are direct obligations and pledge the full faith and credit of the City. These bonds generally areissued as 20-year serial bonds with equal amounts of principal maturing each year.
In June 2019, the City issued Series 2019A General Obligation Bonds for a total of $12,750,000 with interest rates rangingfrom 1.72% to 2.85%. The bonds were issued to provide financing for construction and equipment of a new Robert CrownCommunity Center, Ice Complex, and Library Center.
Also in June 2019, the City issued Series 2019B General Obligation Bonds for a total of $12,785,000 with interest ratesranging from 1.66% to 2.68%. Proceeds were allocated to governmental activities ($7,020,000), business-type activities($3,930,000), and component unit ($1,835,000). The bonds were issued to provide financing for certain publicimprovement projects for governmental activities, business-type activities, and component unit activities.
The following schedule illustrates the annual debt service requirements to maturity for general obligation bonds.
- 47 -

CITY OF EVANSTON, ILLINOIS
Notes to the Financial Statements
For the Fiscal Year Ended December 31, 2019
NOTE 7. LONG-TERM DEBT - Continued
C. Notes Payable - IEPA Loans
Notes payable - IEPA debt service requirements to maturity are as follows:
For the Fiscal Year Ending Principal Interest
2020 5,040,700$ 655,299$ 2021 5,011,337 736,774 2022 3,751,172 623,241 2023 3,839,912 534,789 2024 3,599,049 446,376 2025-2029 9,913,585 1,324,867 2030-2034 5,276,324 646,919 2035-2039 3,595,875 231,135 2040-2045 663,597 9,187
Total 40,691,551$ 5,208,587$
D. Postemployment Benefits other than Pensions (Defined Benefit Plan)
Contribution requirements are established through Illinois State laws. The City and the Library implicitly contributes thedifference between retiree's contributions and unblended rates. Retirees pay 100% of the blended premiums to coverthemselves and their covered dependents ranging from $540 for single coverage to $1,984 for family coverage. The Citypays 100% of health care premiums for police officers and firefighters, their dependents and their surviving spouses anddependent children if they were injured or killed in the line of duty during an emergency, ranging from $493 for singlecoverage to $1,984 for family coverage. For the year ended December 31, 2019, the City and Library's estimatedcontribution to the plan is $860,932. The City's and the Library's annual other postemployment benefit (OPEB) cost(expense) is calculated based on the annual required contribution of the employer (ARC), an amount actuarially determinedin accordance with parameters of GASB Statement No. 75. The ARC represents a level of funding that, if paid on anongoing basis, is projected to cover normal cost each year and amortize any unfunded actuarial liabilities (or fundingexcess) over a period not to exceed 30 years.
The City's and the Library's group health insurance plan provides coverage to active employees and retirees (or otherqualified terminated employees) at blended premium rates. This results in an other postemployment benefit (OPEB) for theretirees, commonly referred to as an implicit rate subsidy. The group health insurance plan does not issue a publiclyavailable financial report.
Business-Type Activities
As of December 31, 2019, the City currently has 23 outstanding loans from the IEPA. The City will repay the loans solelyfrom revenues derived from the sewer and water system; the loans do not constitute a full faith and credit obligation of theCity. They will be repaid with equal installments consisting of principal plus simple interest, on unpaid principal balances,over a period of 20 years. Initial principal balances will consist of disbursements and interest accrued during construction.Repayments begin not later than six months after completion of construction.
The City and the Library administer a single-employer defined benefit health care plan which provides coverage to activeemployees and retired members. Benefit provisions are established through collective bargaining agreements and state thateligible retires and their spouses at established contribution rates.
- 48 -

CITY OF EVANSTON, ILLINOIS
Notes to the Financial Statements
For the Fiscal Year Ended December 31, 2019
NOTE 7. LONG-TERM DEBT - Continued
D. Postemployment Benefits other than Pensions (Defined Benefit Plan) - Continued
Membership
Retirees and beneficiaries current receiving benefits 62Terminated employees entitles to benefits but not yet receiving them 14Active employees 710
Total 786
Actuarial valuation date December 31, 2018Measurement date December 31, 2019Actuarial cost method Entry-age normalInflation 3.00%Discount rate 2.75%Healthcare cost trend rates 8.50% in Fiscal
2018, to an ultimate trend rate of 4.50%
Asset valuation method N/AMortality rates
RP - 2014 Blue Collar base rates for Police and Fire, RP-2014 base rates for all other employees, projected to 2018 using scale MP2018.
Discount Rate
The total OPEB liability was determined by an actuarial valuation performed as of December 31, 2018 using the followingactuarial methods and assumptions.
The discount rate was based on the S&P Municipal Bond 20 year high-grade rate index rate for tax exempt generalobligation municipal bonds rated AA or better at December 31, 2019.
At December 31, 2019, membership consisted of:
Actuarial Assumptions and Other Inputs
- 49 -

CITY OF EVANSTON, ILLINOIS
Notes to the Financial Statements
For the Fiscal Year Ended December 31, 2019
NOTE 7. LONG-TERM DEBT - Continued
D. Postemployment Benefits other than Pensions (Defined Benefit Plan) - Continued
City Library
Balances at January 1, 2019 18,036,096$ 291,830$
Changes for the periodService cost 959,826 14,617 Interest 722,789 11,007 Changes in assumptions 2,852,654 27,121 Implicit benefit payments (848,018) (12,914) Other changes - -
Net changes 3,687,251 39,831
Balances at December 31, 2019 21,723,347$ 331,661$
There was a change in assumptions related to the discount rate in 2019.
Rate Sensitivity
Current1% Decrease Discount Rate 1% Increase
(1.75%) (2.75%) (3.75%)City $ 23,868,202 $ 21,723,347 $ 19,737,088 Library 364,495 331,661 301,409
Total OPEB Liability $ 24,232,697 $ 22,055,008 $ 20,038,497
Current1% Decrease Discount Rate 1% Increase(7% to 3.5%) (8% to 4.5%) (9% to 5.5%)
City $ 18,993,979 $ 21,723,347 $ 25,030,820 Library 289,248 331,661 381,180
Total OPEB Liability $ 19,283,227 $ 22,055,008 $ 25,412,000
Changes in the Total OPEB Liability
The following is a sensitive analysis of total OPEB liability to changes in the discount rate and the healthcare cost trendrate. The table below presents the total OPEB liability of the City and Library calculated using the discount rate of 2.75% as well as what the City's and Library's total OPEB liability would be if it were calculated using a discount rate that is 1percentage point lower (1.75%) or 1 percentage point higher (3.75%) than the current rate:
The table below presents the total OPEB liability of the City and Library calculated using the healthcare rate of 8% decreasing to 4.5% as well as what the City's and Library’s total OPEB liability would be if it were calculated using ahealthcare rate that is 1 percentage point lower (7% decreasing to 3.5%) or 1 percentage point higher (9% decreasing to5.5%) than the current rate:
Total OPEB Liability
- 50 -

CITY OF EVANSTON, ILLINOIS
Notes to the Financial Statements
For the Fiscal Year Ended December 31, 2019
NOTE 7. LONG-TERM DEBT - Continued
D. Postemployment Benefits other than Pensions (Defined Benefit Plan) - Continued
Deferred DeferredOutflows of Inflows ofResources Resources
Changes in assumption $ 2,586,077 $ 1,032,099
Total $ 2,586,077 $ 1,032,099
Year EndingDecember 31,
2020 139,753$ 2021 139,753 2022 139,753 2023 139,753 2024 139,753 Thereafter 855,213
Total 1,553,978$
Amounts reported as deferred outflows of resources and deferred inflows of resources related to OPEB will be recognizedin OPEB expense as follows:
The deferred outflows and deferred inflows of resources presented in the table above include amounts for the City. TheLibrary’s proportionate share of the deferred outflows and deferred inflows of resources at December 31, 2019 was$39,483 and $15,757, respectively.
For the year ended December 31, 2019, the City recognized OPEB expense of $991,555. At December 31, 2019, the Cityreported deferred outflows and deferred inflows of resources related to OPEB from the following sources:
OPEB Expense and Deferred Outflows of Resources and Deferred Inflows of Resources Related to OPEB
- 51 -

CITY OF EVANSTON, ILLINOIS
Notes to the Financial Statements
For the Fiscal Year Ended December 31, 2019
NOTE 8. FUND EQUITY
A. Restricted Net Position - Fiduciary Funds
Fiduciary FundsFirefighters' Pension Fund restriction for employee pension benefits 89,807,041$ Police Pension Fund restriction for employee pension benefits 141,309,841
Total Fiduciary Funds 231,116,882$
B. Assigned Fund Balances
The following are the assigned fund balances:
General FundAssigned for Arts Council 3,948$ Assigned for Dutch elm inoculation 499,973 Assigned for parkway trees 60,722 Assigned for Butterfield sculpture 30,883 Assigned for scholarship contributions 10,806 Assigned for Noyes Center 254,705 Assigned for recreation group activities 207,123 Assigned for parks and recreation 629,792 Assigned for Mayor's programs 93,179 Assigned for IMRF - Pension 1,112,052 Assigned for compensated absences 1,181,867 Other assignments 244,536
Total General Fund 4,329,586
Crown Capital FundAssigned for capital improvements 7,646,150
Total Crown Capital Fund 7,646,150
Nonmajor Governmental FundsAssigned for capital improvements 9,732,440 Assigned for special assessment capital projects 2,927,806
Total Nonmajor Governmental Funds 12,660,246
Total Assigned Fund Balances 24,635,982$
- 52 -

CITY OF EVANSTON, ILLINOIS
Notes to the Financial Statements
For the Fiscal Year Ended December 31, 2019
NOTE 9. INDIVIDUAL FUND ACTIVITIES
A. General Obligation Debt Service Fund
B. Water Fund
C. Special Service District No. 4
The City usually adopts several resolutions abating portions of the property tax debt service levies. The amount ofproperty taxes abated is derived from principal and interest payments by private assessments on street paving projects;additional water/sewer service fees related to the citywide water/sewer improvement project; tax increment revenues inthe Howard Hartrey Tax Increment District; revenues from the Motor Vehicle Parking System Fund associated with theMaple Garage, Sherman Garage, and Church Street Self-Park Garage; and General Obligation Debt Service Fundinterest income.
On January 28, 1997, the City executed a long-term water supply contract with the Village of Skokie, Illinois, to replacean expiring contract. The contract took effect on March 1, 1997 and continues in effect for a period of 20 years untilFebruary 28, 2017. The contract was extended further until October 31, 2017. Currently, the City is working with theVillage of Skokie to have a new contract with revised terms to supply Lake Michigan water to the Village of Skokie.
The City provides potable Lake Michigan water to the Northwest Water Commission (NWWC) under a long-term watersupply contract. Sale of potable water under this contract began on February 28, 1985 and continues until February 28,2030. Under the terms of the current contract, the City is to supply NWWC sufficient potable Lake Michigan water tosatisfy NWWC’s maximum 24-hour demands for Lake Michigan water for resale to NWWC’s customers.
On September 23, 2019, the City Council adopted Ordinance No. 109-O-19 which extended the life of Special ServiceDistrict No. 4 until December 31, 2034. Special Service District No. 4 comprises the central business district of the City.The special district was established for the purpose of providing funds for special maintenance and repair and forpromotion and advertisement. The annual property tax levy for 2019 was $610,995 which includes an estimatedallowance amount of $18,330.
The City also provides potable Lake Michigan water to the Morton Grove Niles Water Commission (MGNWC) under along-term water supply contract. Sale of potable water under this contract began January 24, 2017 and continues untilDecember 31, 2056. Under the terms of the current contract, the City is to supply MGNWC sufficient potable LakeMichigan water to satisfy MGNWC's maximum 24-hour demands for Lake Michigan water for resale to MGNW'scustomers.
- 53 -

CITY OF EVANSTON, ILLINOIS
Notes to the Financial Statements
For the Fiscal Year Ended December 31, 2019
NOTE 10. RISK MANAGEMENT - CLAIMS AND JUDGMENTS
The changes in the balances of claims liabilities during the past two fiscal periods are as follows:
Workers’ GeneralCompensation Liability Total
December 31, 2017 2,913,500$ 1,374,000$ 4,287,500$
New claims and/or estimate revisions 876,824 1,368,400 2,245,224 Claims payments (718,224) (1,156,900) (1,875,124)
December 31, 2018 3,072,100 1,585,500 4,657,600
New claims and/or estimate revisions 233,618 5,780,000 6,013,618 Claims payments (688,168) (2,556,500) (3,244,668)
December 31, 2019 2,617,550$ 4,809,000$ 7,426,550$
The City records estimated liabilities for workers' compensation and for general claims. Claims liabilities are based on estimates of theultimate cost of reported claims including future claim adjustment expenses.
Workers' compensation and general liability risks are accounted for in the Insurance Fund. The fund was established on March 1, 1994to administer general liability claims and workers' compensation programs on a cost-reimbursement basis. The fund accounts for theaforementioned liabilities of the City, but does not constitute a transfer of risk from the City.
The City is exposed to various risks of loss related to torts; theft of, damage to, and destruction of assets; errors and omissions; naturaldisasters; and injuries to the City's employees. The City maintains commercial all-risk property insurance to cover damage to cityfacilities and contents and other losses including business interruption and loss of rents. The coverage is subject to a deductible of$50,000 (except $100,000 for flood and earthquake and $10,000 for artwork) for each loss and each location. The City also maintainscrime and fidelity insurance coverage with a $25,000 deductible to a limit of $2,000,000. In addition, coverage is maintained forambulance/paramedic liability.
For workers' compensation, specific excess coverage in excess of $750,000 per occurrence is purchased from a commercial insurancecompany. For general liability claims, the City retains risk of loss of $1,250,000 to a limit of $10,000,000.
For its health insurance coverages, the City participates through a sub-pool in the Intergovernmental Personnel Benefit Cooperative(IPBC). IPBC is a public entity risk pool established in 1979 by certain units of local government in Illinois to administer some or all ofthe personnel benefit programs (primarily medical, dental, and life insurance coverage) offered by these members to their officers andemployees and to the officers and employees of certain other governmental, quasi governmental, and nonprofit public service entities.Management consists of a Board of Directors comprised of one appointed representative from each member. The officers of IPBC arechosen by the Board of Directors from among their membership. The City does not exercise any control over the activities of IPBCbeyond its representation on the Board of Directors of the sub-pool. To obtain IPBC’s financial statements, contact the administrativeoffices of IPBC at 301 East Irving Park Road, Streamwood, Illinois 60107.
- 54 -

CITY OF EVANSTON, ILLINOIS
Notes to the Financial Statements
For the Fiscal Year Ended December 31, 2019
NOTE 11. CONTINGENCIES
NOTE 12. JOINT VENTURES
A. Solid Waste Agency of Northern Cook County
Complete financial statements for the Agency can be obtained at 77 W. Hintz Rd., Suite 200, Wheeling, Illinois, 60090.
There are various claims and legal actions pending against the City for which provision has been made in the financialstatements. At the present time, the City believes that the reserves established are sufficient so that the expected liability forthese claims and legal actions will not materially exceed the amounts recorded in the financial statements. Amountsreceived or receivable from grantor agencies are subject to audit and adjustment by grantor agencies, principally the federal government. Any disallowed claims, including amounts already collected, may constitute a liability of the applicablefunds. The amount, if any, of the expenditures which may be disallowed by the grantor cannot be determined at this timealthough the City expects such amounts, if any, to be immaterial.
Under the 1992 project use agreement executed by the City with the Agency, the City’s share of project costs, includingdebt service and disposal, is based on its share of deliveries to the Wheeling Transfer Station for each year. The City doesnot control the Agency's fiscal management or operations nor is the City legally responsible for any more than its share ofthe Agency's debt or operating deficits, if any.
On March 28, 1988, the Evanston City Council authorized agreements providing for the City's participation in the SolidWaste Agency of Northern Cook County (Agency) and in the interim financing of that Agency. The Agency was plannedand developed by the Northwest Municipal Conference, of which the City is a member. The Agency is empowered to plan,finance, construct, and operate a solid waste disposal system.
The Agency is a municipal joint action agency created as of May 2, 1988 under the provisions of the IntergovernmentalCooperation Act (the Act), 5 ILCS 220/3.2. The Agency consists of 23 municipalities. The Agency is governed by aBoard of Directors consisting of one official selected by each member community who serves a two-year term. Eachdirector has one vote. The Board of Directors determines the general policies of the Agency. The Executive Committee ofthe Agency consists of seven persons elected by the Board of Directors. Each person is entitled to one vote. The ExecutiveCommittee may take action not specifically reserved to the Board of Directors by the Act, the Agency agreement, or the by-laws.
The authority to designate management, influence operations, and formulate budgets rests with the Board of Directors andExecutive Committee. No one member has the ability to significantly influence operations; therefore, the Agency is not acomponent unit of any other governmental reporting entity.
- 55 -

CITY OF EVANSTON, ILLINOIS
Notes to the Financial Statements
For the Fiscal Year Ended December 31, 2019
NOTE 13. EMPLOYEE RETIREMENT SYSTEMS
A. Plan Descriptions
Illinois Municipal Retirement Fund
Plan Administration
Plan Membership
Inactive employees or their beneficiaries currently receiving benefits 681 Inactive employees entitled to but not
376 Active employees 532
Total 1,589
Benefits Provided
yet receiving benefits
At December 31, 2018, IMRF membership consisted of:
All employees hired in positions that meet or exceed the prescribed annual hourly standard must be enrolled in IMRFas participating members.
The City contributes to the Illinois Municipal Retirement Fund (IMRF), a defined benefit agent multiple-employerpublic employee retirement system that acts as a common investment and administrative agent for local governmentsand school districts in Illinois (other than those covered by the Police or Firefighters' Pension Plan). The IllinoisPension Code establishes the benefit provisions of the plan that can only be amended by the Illinois GeneralAssembly. IMRF issues a publicly available financial report that includes financial statements and supplementaryinformation for the plan as a whole, but not by individual employer. That report may be obtained by writing to theIllinois Municipal Retirement Fund, 2211 York Road, Suite 500, Oak Brook, Illinois 60523.
The plan is accounted for on the economic resources measurement focus and the accrual basis of accounting.Employer and employee contributions are recognized when earned in the year that the contributions are required,benefits and refunds are recognized as an expense and liability when due and payable.
The IMRF data included in the table above includes membership of both the City and the Library.
IMRF provides two tiers of pension benefits. Employees hired prior to January 1, 2011 are eligible for Tier 1 benefits.For Tier 1 employees, pension benefits vest after eight years of service. Participating members who retire at age 55(reduced benefits) or after age 60 (full benefits) with eight years of credited service are entitled to an annual retirementbenefit, payable monthly for life, in an amount equal to 1 2/3% of their final rate of earnings, for each year of creditedservice up to 15 years, and 2% for each year thereafter. Employees hired on or after January 1, 2011 are eligible forTier 2 benefits. For Tier 2 employees, pension benefits vest after ten years of service. Participating members who retire at age 62 (reduced benefits) or after age 67 (full benefits) with ten years of credited service are entitled to an annualretirement benefit, payable monthly for life, in an amount equal to 1 2/3% of their final rate of earnings, for each yearof credited service up to 15 years, and 2% for each year thereafter. IMRF also provides death and disability benefits.These benefit provisions and all other requirements are established by state statute.
- 56 -

CITY OF EVANSTON, ILLINOIS
Notes to the Financial Statements
For the Fiscal Year Ended December 31, 2019
NOTE 13. EMPLOYEE RETIREMENT SYSTEMS - Continued
A. Plan Descriptions - Continued
Illinois Municipal Retirement Fund - Continued
Contributions
Actuarial Assumptions
Actuarial valuation date December 31, 2018
Actuarial cost method Entry-age normal
Assumptions Inflation 2.50%
Salary increases 3.39% to 14.25%
Interest rate 7.25%
Cost of living adjustments 3.00%
Asset valuation method Fair value
The City’s net pension liability was measured as of December 31, 2018 and the total pension liability used to calculatethe net pension liability was determined by an actuarial valuation performed as of the same date using the followingactuarial methods and assumptions.
For nondisabled retirees, an IMRF specific mortality table was used with fully generational projection scale MP-2017(base year 2015). IMRF specific rates were developed from the RP-2014 Blue Collar Health Annuitant MortalityTable with adjustments to match current IMRF experience. For disabled retirees, an IMRF specific mortality table wasused with fully generational projection scale MP-2017 (base year 2015). IMRF specific rates were developed from theRP-2014 Disabled Retirees Mortality Table applying the same adjustment that were applied for nondisabled lives. Foractive members, an IMRF specific mortality table was used with fully generational projection scale MP-2017 (baseyear 2015). IMRF specific rates were developed from the RP-2014 Employee Mortality Table with adjustments tomatch current IMRF experience.
Employees participating in IMRF are required to contribute 4.50% of their annual covered salary to IMRF. Themember rate is established by state statute. The City is required to contribute the remaining amounts necessary to fundIMRF as specified by statue. The employer contribution rate for the calendar year ended December 31, 2019 was6.22% of covered payroll.
Changes in assumptions related to the discount rate were made since the prior measurement date.
- 57 -

CITY OF EVANSTON, ILLINOIS
Notes to the Financial Statements
For the Fiscal Year Ended December 31, 2019
NOTE 13. EMPLOYEE RETIREMENT SYSTEMS - Continued
A. Plan Descriptions - Continued
Illinois Municipal Retirement Fund - Continued
Discount Rate
Changes in Net Pension Liability
(a) (b) (a) - (b)Total Pension Plan Fiduciary Net Pension
Liability Net Position Liability (Asset)Balances at January 1, 2018 234,141,501$ 245,990,805$ (11,849,304)$
Changes for the period Service cost 3,671,434 - 3,671,434 Interest 17,185,510 - 17,185,510 Difference between expected and actual experience 2,992,302 - 2,992,302 Changes in assumptions 6,567,349 - 6,567,349 Employer contributions - 3,634,209 (3,634,209) Employee contributions - 1,847,906 (1,847,906) Net investment income - (14,090,715) 14,090,715 Benefit payments and refunds (13,674,160) (13,674,160) - Administrative expense - - - Other (net transfer) - 3,915,577 (3,915,577)
Net changes 16,742,435 (18,367,183) 35,109,618
Balances at December 31, 2018 250,883,936$ 227,623,622$ 23,260,314$
The discount rate used to measure the total pension liability was 7.25%. The projection of cash flows used todetermine the discount rate assumed that member contributions will be made at the current contribution rate and thatthe City contributions will be made at rates equal to the difference between actuarially determined contribution ratesand the member rate. Based on those assumptions, the City’s fiduciary net position was projected to be available tomake all projected future benefit payments of current plan members.
The table presented above includes amounts for both the City and the Library. The City’s proportionate share of thenet pension liability (asset) at January 1, 2018, the employer contributions, and the net pension liability at December31, 2018 was $(10,748,504), $3,281,327, and $21,001,738, respectively. The Library’s proportionate share of the netpension liability (asset) at January 1, 2018, the employer contributions and the net pension liability at December 31,2018 was $(1,100,800), $352,882, and $2,258,576, respectively.
- 58 -

CITY OF EVANSTON, ILLINOIS
Notes to the Financial Statements
For the Fiscal Year Ended December 31, 2019
NOTE 13. EMPLOYEE RETIREMENT SYSTEMS - Continued
A. Plan Descriptions - Continued
Illinois Municipal Retirement Fund - Continued
Pension Expense and Deferred Outflows of Resources and Deferred Inflows of Resources
Deferred DeferredOutflows of Inflows ofResources Resources
Difference between expected and actual experience 1,961,036$ 1,472,554$ Changes in assumption 4,303,982 3,315,173 Net difference between projected and actual earningson pension plan investments 13,770,722 - Employer contributions after the measurement date 2,179,482 -
Total 22,215,222$ 4,787,727$
Year EndingDecember 31,
2020 4,019,586$ 2021 2,242,665 2022 3,138,645 2023 5,847,117 Thereafter -
Total 15,248,013$
For the year ended December 31, 2019, the City recognized pension expense of $1,517,159. At December 31, 2019,the City reported deferred outflows of resources and deferred inflows of resources related to IMRF from the followingsources:
The deferred outflows presented in the table above include amounts for the City. The Library’s proportionate share ofthe deferred outflows and inflows of resources at December 31, 2019 was $2,389,078 and $514,884, respectively.
$2,179,482 reported as deferred outlfows of resources related to pensions resulting from contributions subsequent tothe measurement date will be recognized as a reduction of the net pension liability in the reporting year endingDecember 31, 2020. Other amounts reported as deferred outflows of resources and deferred inflows of resourcesrelated to IMRF will be recognized in pension expense as follows:
- 59 -
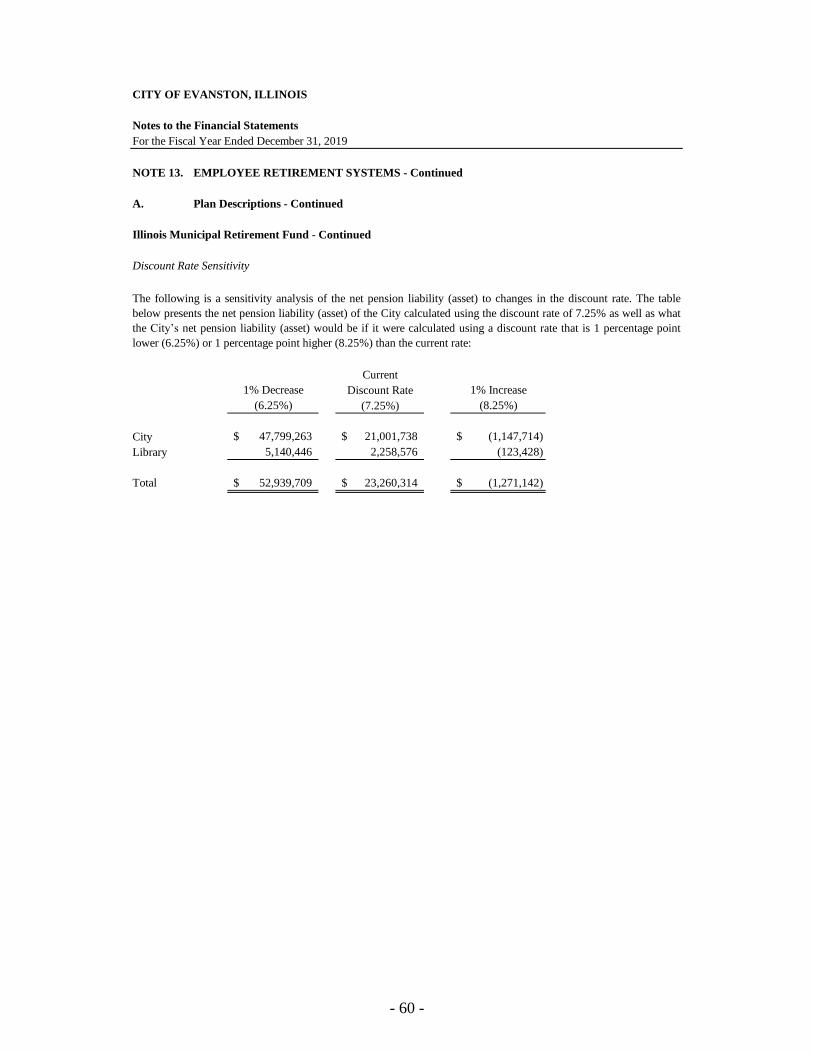
CITY OF EVANSTON, ILLINOIS
Notes to the Financial Statements
For the Fiscal Year Ended December 31, 2019
NOTE 13. EMPLOYEE RETIREMENT SYSTEMS - Continued
A. Plan Descriptions - Continued
Illinois Municipal Retirement Fund - Continued
Discount Rate Sensitivity
Current1% Decrease Discount Rate 1% Increase
(6.25%) (7.25%) (8.25%)
City 47,799,263$ 21,001,738$ (1,147,714)$ Library 5,140,446 2,258,576 (123,428)
Total 52,939,709$ 23,260,314$ (1,271,142)$
The following is a sensitivity analysis of the net pension liability (asset) to changes in the discount rate. The tablebelow presents the net pension liability (asset) of the City calculated using the discount rate of 7.25% as well as whatthe City’s net pension liability (asset) would be if it were calculated using a discount rate that is 1 percentage pointlower (6.25%) or 1 percentage point higher (8.25%) than the current rate:
- 60 -

CITY OF EVANSTON, ILLINOIS
Notes to the Financial Statements
For the Fiscal Year Ended December 31, 2019
NOTE 13. EMPLOYEE RETIREMENT SYSTEMS - Continued
A. Plan Descriptions - Continued
Police and Firefighters' Pension Plans
Plan Administration
Plan Membership
At January 1, 2019, plan membership consisted of:
Firefighters'Police Pension Pension
Inactive plan members or beneficiariescurrently receiving benefits 183 144
Inactive plan members entitled to but not yet receiving benefits 20 2Active plan members 158 99
Total 361 245
Benefits Provided
The Police Pension Plan and Firefighters' Pension Plan are contributory, single employer defined benefit publicemployee retirement plans administered by the City and a Board of Trustees for each fund. All sworn city police officersand firefighters are participants in the plans. The plans do not issue stand-alone financial reports and they are notincluded in the report of a public employee retirement system or another entity. The City accounts for the Police Pensionand Firefighters' Pension Plans as pension trust funds.
The plans are governed by a five-member pension board. Two members appointed by the City's Council, one electedretired pension member, and two elected active members constitute the pension boards.
For employer contributions, the City’s budget policy is to fund pension plans at the funding level recommended annuallyby the actuary. The General Fund is used to liquidate the net pension liability.
As provided for in the Illinois Compiled Statutes, the Police and Firefighters' Pension Funds provide retirement benefitsas well as death and disability benefits to employees grouped into two tiers. Tier 1 is for employees hired prior toJanuary 1, 2011 and Tier 2 is for employees hired after that date. The following is a summary of the Police andFirefighters' Pension Funds as provided for in Illinois Compiled Statutes.
The Police and Firefighters' Pension Plans are accounted for on the economic resources measurement focus and the accrual basis of accounting. Employer and employee contributions are recognized when earned in the year that the contributions are required, benefits and refunds are recognized on an expense and liability when due and payable.
- 61 -

CITY OF EVANSTON, ILLINOIS
Notes to the Financial Statements
For the Fiscal Year Ended December 31, 2019
NOTE 13. EMPLOYEE RETIREMENT SYSTEMS – Continued
A. Plan Descriptions - Continued
Police and Firefighters' Pension Plans - Continued
Benefits Provided - Continued
Police Pension Plan
Firefighters' Pension Plan
Tier 1 ‑ Covered employees hired prior to January 1, 2011 attaining the age of 50 or more with 20 or more years ofcreditable service are entitled to receive an annual retirement benefit of one half of the salary attached to the rank on thelast day of service, or for one year prior to the last day, whichever is greater. The pension shall be increased by 2.5% ofsuch salary for each additional year of service over 20 years up to 30 years to a maximum of 75% of such salary.Employees with at least 8 years but less than 20 years of credited service may retire at or after age 60 and receive areduced retirement benefit. The monthly pension of a police officer who retired with 20 or more years of service afterJanuary 1, 1977 shall be increased annually, following the first anniversary date of retirement and paid upon reaching atleast age 55, by 3% of the original pension and 3% compounded annually thereafter.
Tier 2 ‑ Covered employees hired on or after January 1, 2011 attaining the age of 55 or older with ten or more years ofcreditable service are entitled to receive an annual retirement benefit equal to the greater of the average monthly salaryobtaining by dividing the total salary during the 48 consecutive months of service within the last of 60 months in whichthe total salary was the highest by the number of months in that period; or the average monthly salary obtained bydividing the total salary of the police officer during the 96 consecutive months of service within the last 120 months ofservice in which the total salary was the highest by the number of months of service in that period. Police officers’
salary for pension purposes is capped at $106,800, plus the lesser of ½ of the annual change in the Consumer PriceIndex or 3% compounded. The annual benefit shall be increased by 2.50% of such salary for each additional year ofservice over 20 years up to 30 years to a maximum of 75% of such salary. Employees with at least ten years may retireat or after age 50 and receive a reduced benefit (i.e., ½% for each month under 55). The monthly benefit of a Tier 2police officer shall be increased annually at age 60 on the January 1st after the police officer retires, or the firstanniversary of the pension starting date, whichever is later. Noncompounding increases occur annually, each Januarythereafter. The increase is the lesser of 3% or ½ of the change in the Consumer Price Index for the preceding calendaryear.
Tier 1 - Covered employees hired prior to January 1, 2011 attaining the age of 50 or more with 20 or more years ofcreditable service are entitled to receive a monthly retirement benefit of one-half of the monthly salary attached to therank held in the fire service at the date of retirement. The monthly pension shall be increased by one-twelfth of 2.5% ofsuch monthly salary for each additional month over 20 years of service through 30 years of service to a maximum of75% of such monthly salary. Employees with at least 10 years but less than 20 years of credited service may retire at orafter age 60 and receive a reduced retirement benefit. The monthly pension benefit of a firefighter who retired with 20or more years of service after January 1, 1977 shall be increased annually, following the first anniversary date ofretirement and paid upon reaching at least the age 55, by 3% of the original pension and 3% compounded annuallythereafter.
Tier 2 ‑ Covered employees hired on or after January 1, 2011 attaining the age of 55 or older with ten or more years ofcreditable service are entitled to receive an annual retirement benefit equal to the greater of (1) the average monthlysalary obtained by dividing the total salary of the firefighter during the 48 consecutive months of service within the lastof 60 months in which the total salary was the highest by the number of months in that period; or (2) the averagemonthly salary obtained during the 96 consecutive months of service within the last 120 months of service in which thetotal salary was the highest by the number of months of service in that period. Firefighters’ salary for pension purposesis capped at $106,800, plus the lesser of ½ of the annual change in the Consumer Price Index or 3% compoundedannually. The annual benefit shall be increased by 2.50% of such salary for each additional year of service over 20 yearsup to 30 years to a maximum of 75% of such salary. Employees with at least ten years may retire at or after age 50 andreceive a reduced benefit (i.e., ½% for each month under 55). The monthly benefit of a Tier 2 firefighter shall beincreased annually at age 60 on the January 1st after the firefighter retires or the first anniversary of the pension startingdate, whichever is later. Noncompounding increases occur annually, each January thereafter. The increase is the lesserof 3% or ½ of the change in the Consumer Price Index for the preceding calendar year.
- 62 -

CITY OF EVANSTON, ILLINOIS
Notes to the Financial Statements
For the Fiscal Year Ended December 31, 2019
NOTE 13. EMPLOYEE RETIREMENT SYSTEMS - Continued
A. Plan Descriptions - Continued
Police and Firefighters' Pension Plans - Continued
Contributions
Investment Policy
Police Pension Fund
Police Pension Asset Class
Domestic Large-Cap Equities 3.60%Domestic Small-Cap Equities 4.50%International Equities 5.20%Fixed Income 3.20%REITS 4.00%Cash -0.10%
Total
5.00%
Covered employees are required to contribute 9.91% of their base salary to the Police Pension Plan. If an employeeleaves covered employment with less than 20 years of service, accumulated employee contributions may be refundedwithout accumulated interest. The City is required to contribute the remaining amounts necessary to finance the plans asactuarially determined by an enrolled actuary. Effective January 1, 2011, the City's contributions must accumulate to thepoint where the past service cost for the Police Pension Plan is 90% funded by the year 2040. For the year endedDecember 31, 2019, the City's contribution was 65.72% of covered payroll.
Participants contribute a fixed percentage of their base salary to the Firefighters' Pension Plan. At December 31, 2019,the contribution percentage was 9.455%. If a participant leaves covered with less than 20 years of service, accumulatedparticipant contributions may be refunded without accumulated interest. The City is required to contribute the remainingamounts necessary to finance the plan as actuarially determined by an enrolled actuary. Effective January 1, 2011, theCity's contributions must accumulate to the point where the past service cost for the Firefighters' Pension Plan is 90%funded by the year 2040. For the year ended December 31, 2019, the City's contribution was 79.94% of covered payroll.
Permitted Deposits and Investments - Statutes and the Police Pension Fund’s (the Fund) investment policy authorize theFund to make deposits/invest in insured commercial banks, savings and loan institutions, obligations of the U.S.Treasury and U.S. agencies, insured credit union shares, money market mutual funds with portfolios of securities issuedor guaranteed by the United States Government or agreements to repurchase these same obligations, repurchaseagreements, short-term commercial paper rated within the three highest classifications by at least two standard ratingservices, The Illinois Funds, IMET, certain non-U.S. obligations, Illinois municipal corporations tax anticipationwarrants, veteran’s loans, obligations of the State of Illinois and its political subdivisions, and Illinois insurancecompany general and separate accounts, mutual funds and equity securities (not to exceed 65% of the total net positionof the Fund), contracts and agreements of life insurance companies (no more than 10% of portfolio in real estate and nomore than 10% of portfolio in bonds with ratings of less than Baa1), and corporate bonds. During the year, no changesto the investment policy were approved by the Board of Trustees.
The Fund's investment policy allows investments in all of the above listed accounts, but does exclude any repurchaseagreements. The Fund's investment policy, in accordance with Illinois Statutes, establishes the following targetallocation across asset classes:
Long-Term Expected Target Allocation Real Rate of Return
52.00%
5.00%32.00%
3.00%3.00%
100.00%
- 63 -

CITY OF EVANSTON, ILLINOIS
Notes to the Financial Statements
For the Fiscal Year Ended December 31, 2019
NOTE 13. EMPLOYEE RETIREMENT SYSTEMS - Continued
A. Plan Descriptions - Continued
Police and Firefighters' Pension Plans - Continued
Investment Policy - Continued
Police Pension Fund - Continued
Firefighters' Pension Fund
Firefighters' Pension Asset Class Target Allocation
U.S. Large Cap 34.10% 5.20%U.S. Mid Cap 7.60% 6.10%U.S. Small Cap 4.90% 5.60%International Equities 7.20% 5.20%Emerging & Frontier Market Equities 0.50% 7.60%Fixed Income and Preferred 36.20% 0.50%Alternatives 9.50% 2.70%
Total 100.00%
The long-term expected rate of return on the Fund's investments was determined using a building-block method inwhich best-estimate ranges of expected future real rates of return (expected returns, net of pension plan investmentexpenses, and inflation) are developed for each major asset class. These ranges are combined to produce the long-termexpected rate of return by weighting the expected future real rates of return by the target asset allocation percentage andby adding expected inflation. Best estimates of arithmetic real rates of return for each major asset class included in theFund's target asset allocation as of December 31, 2019 are listed in the table above.
The Firefighters' Pension Fund (the Fund) allows funds to be invested in any type of security authorized by the IllinoisPension Code. During the year, no changes to the investment policy were approved by the Board of Trustees. TheFund's investment policy, in accordance with Illinois Statutes, establishes the following target allocation across assetclasses:
Long-Term Expected Real Rate of Return
The long-term expected rate of return on the Fund's investments was determined using a building-block method inwhich best-estimate ranges of expected future real rates of return (expected returns, net of pension plan investmentexpenses, and inflation) are developed for each major asset class. These ranges are combined to produce the long-termexpected rate of return by weighting the expected future real rates of return by the target asset allocation percentage andby adding expected inflation. Best estimates of arithmetic real rates of return for each major asset class included in theFund's target asset allocation as of December 31, 2019 are listed in the table above.
- 64 -

CITY OF EVANSTON, ILLINOIS
Notes to the Financial Statements
For the Fiscal Year Ended December 31, 2019
NOTE 13. EMPLOYEE RETIREMENT SYSTEMS - Continued
A. Plan Descriptions - Continued
Police and Firefighters' Pension Plans - Continued
Investment Valuations
Investment Rate of Return
Deposits with Financial Institutions
Interest Rate Risk
Fair Value Less Than 1 Year 1 - 5 Years 6 - 10 Years
Corporate bonds 32,200,180$ 1,013,649$ 19,913,019$ 8,984,776$ U.S. Treasuries 21,040,633 1,131,129 7,439,151 8,807,997 Federal Home Loan Bank 3,907,863 2,375,027 770,822 762,014 Federal Home Loan Mortgage Corp 1,405,716 - 17,666 109,377 Fannie Mae 1,199,906 143 283,229 339,428 Ginnie Mae 4,711 - 877 2,739 Other U.S. Government Agencies 2,145,895 - 301,253 288,801
Total Police and Firefighters' Investment $ 61,904,904 $ 4,519,948 $ 28,726,017 $ 19,295,132
For the year ended December 31, 2019, the Police Pension Plan annual money-weighted rate of return on pension planinvestment, net of pension plan investment expense, was 21.13%. The money-weighted rate of return expressesinvestment performance, net of investment expense, adjusted for the changing amounts actually invested.
All investments in the Police and Firefighters' Pension Plans are stated at fair value and are recorded as of the trade date.Fair value is based on quoted market prices at December 31 for debt securities, equity securities and mutual funds, andcontract values for any insurance contracts. Investment income is recognized as earned. Gains and losses on sales andexchanges of fixed income securities are recognized on the transaction date.
For the year ended December 31, 2019, the Firefighters' Pension Plan annual money weighted rate of return on pensionplan investment, net of pension plan investment expense, was 19.62%. The money-weighted rate of return expressesinvestment performance, net of investment expense, adjusted for the changing amounts actually invested.
Custodial credit risk for deposits with financial institutions is the risk that in the event of a bank’s failure, the Funds'deposits may not be returned to them. The Funds' investment policies do not require pledging of collateral for all bankbalances in excess of federal depository insurance, since flow-through FDIC insurance is available for the Funds'deposits with financial institutions.
The following table presents the investments and maturities of the Funds' debt securities as of December 31, 2019:
Police and Firefighters' PensionInvestment Type
In accordance with its investment policy, the Funds' limit exposure to interest rate risk by structuring the portfolio toprovide liquidity for operating funds not needed within a one-year period. The investment policies does not limit themaximum maturity length of investments in the Funds'.
Investment Maturities (In Years)
- 65 -

CITY OF EVANSTON, ILLINOIS
Notes to the Financial Statements
For the Fiscal Year Ended December 31, 2019
NOTE 13. EMPLOYEE RETIREMENT SYSTEMS - Continued
A. Plan Descriptions - Continued
Police and Firefighters' Pension Plans - Continued
Interest Rate Risk (Continued)
Credit Risk
Custodial Credit Risk - Investments
The Funds' limits its exposure to credit risk, the risk that the issuer of a debt security will not pay its par value uponmaturity, by investing in obligations guaranteed by the United States Government or securities issued by agencies of theUnited States Government that are explicitly or implicitly guaranteed by the United States Government bonds andinvestment grade bonds. The U.S. Treasury and agency obligations are rated by Moody’s Aaa and the corporate bondsare rated between Baa3 and Aaa. The Illinois Funds is rated Aaa by Standard and Poor’s.
Custodial credit risk for investments is the risk that, in the event of the failure of the counterparty to the investment, theFunds' will not be able to recover the value of their investments that are in possession of an outside party. To limit itsexposure, the Funds' investment policies require all security transactions that are exposed to custodial credit risk to beprocessed on a delivery versus payment (DVP) basis with the underlying investments held by a third party acting as theFunds' agent separate from where the investment was purchased in the Funds' name. The Illinois Funds and IMET arenot subject to custodial credit risk.
Concentration of Credit Risk - Illinois Compiled Statutes (ILCS) limits the Funds' investments in equities, mutual funds,and variable annuities to 65%. Securities in any one company should not exceed 5% of the total fund. The blended asset class is comprised of all other asset classes to allow for rebalancing the portfolio.
The Police Pension Trust Fund had no significant investments (other than U.S. Treasuries and corporate bonds) in anyone organization that represented 5% or more of the fund's fiduciary net position.
The Firefighters' Pension Trust Fund had no significant investments (other than corporate bonds) in any oneorganization that represented 5% or more of the fund's fiduciary net position.
The Police and Firefighters' Pension Funds categorize the fair value measurements within the fair value hierarchyestablished by generally accepted accounting principles. The hierarchy is based on the valuation inputs used to measurethe fair value of the asset. Level 1 inputs are quoted prices in active markets for identical assets; Level 2 inputs aresignificant other observable inputs; and Level 3 inputs are significant unobservable inputs.
The City's Police Pension Fund has the following recurring fair value measurements as of December 31, 2019. The U.S.Treasury Obligations, Domestic and International Equity securities, and mutual funds are valued using quoted marketprices (Level 1 inputs). Corporate bonds and U.S. agency obligations, and real estate pools are valued using matrixpricing models (Level 2 inputs).
The City's Firefighters' Pension Fund has the following recurring fair value measurements as of December 31, 2019.The U.S. Treasury Obligations, equity index funds, and mutual funds are valued using quoted market prices (Level 1inputs). Corporate bonds and U.S. agency obligations are valued using matrix pricing models (Level 2 inputs).
- 66 -

CITY OF EVANSTON, ILLINOIS
Notes to the Financial Statements
For the Fiscal Year Ended December 31, 2019
NOTE 13. EMPLOYEE RETIREMENT SYSTEMS - Continued
A. Plan Descriptions - Continued
Police and Firefighters' Pension Plans - Continued
Actuarial Assumptions
Actuarial valuation dateActuarial cost methodAsset valuation methodActuarial assumptions: Projected salary increases graded by age
InflationInterest rate
Cost-of-living adjustments
Discount Rate
Police Pension Firefighters' Pension
The total pension liability above was determined by an actuarial valuation performed using the following actuarialmethods and assumptions.
December 31, 2019 December 31, 2019Entry-age normal Entry-age normal
From 7.36% to 3.62% From 7.36% to 3.62%
Fair value Fair value
6.50% 6.50%From 3.00% to 1.25% From 3.00% to 1.25%
Mortality rates were based on the RP-2000 Combined Healthy Mortality table with a Blue Collar Adjustment; disabledmortality rate is based on RP-2000 Disabled Retiree Mortality table.
The discount rate used to measure the total police pension liability was 6.50%. The projection of cash flows used todetermine the discount rate assumed that member contributions will be made at the current contribution rate and that theCity contribution will be made at rates equal to the difference between actuarially determined contribution rates and themember rate. Based on those assumptions, the Police Pension Plan's fiduciary net position was projected to be availableto make all projected future benefit payments of current plan members. Effective January 1, 2011, the City has until theyear 2040 to fund 90% of the past service cost for the Police Pension Plan. However, the City has elected to fund 100%of the past service cost by 2040.
The discount rate used to measure the total firefighters' pension liability was 6.50%. The projection of cash flows usedto determine the discount rate assumed that member contributions will be made at the current contribution rate and thatthe City contribution will be made at rates equal to the difference between actuarially determined contribution rates andthe member rate. Based on those assumptions, the Firefighters' Pension Plan's fiduciary net position was projected to beavailable to make all projected future benefit payments of current plan members. Effective January 1, 2011, the City hasuntil the year 2040 to fund 90% of the past service cost for the Police Pension Plan. However, the City has elected tofund 100% of the past service cost by 2040.
2.50% 2.50%
- 67 -

CITY OF EVANSTON, ILLINOIS
Notes to the Financial Statements
For the Fiscal Year Ended December 31, 2019
NOTE 13. EMPLOYEE RETIREMENT SYSTEMS - Continued
A. Plan Descriptions - Continued
Police and Firefighters' Pension Plans - Continued
Discount Rate (Continued)
Current Discount 1% Decrease Rate 1% Increase
Police Pension Fund: Discount rate 5.50% 6.50% 7.50% Net pension liability $ 144,043,342 $ 109,646,586 $ 81,422,570
Firefighters’ Pension Fund:
Discount rate 5.50% 6.50% 7.50% Net pension liability $ 122,410,362 $ 97,187,735 $ 76,473,617
Total Net Pension Liability $ 266,453,704 $ 206,834,321 $ 157,896,187
Changes in the Net Pension Liability
Police Pension Fund
(a) (b) (a) - (b)Total Pension Plan Fiduciary Net Pension
Liability Net Position Liability
Balances at January 1, 2019 235,025,150$ 116,755,057$ 118,270,093$
Changes for the period Service cost 3,980,758 - 3,980,758 Interest 15,128,398 - 15,128,398 Changes of benefit terms 853,365 - 853,365 Difference between expected and actual experience 4,364,013 - 4,364,013 Changes in assumptions 4,127,403 - 4,127,403 Employer contributions - 10,502,308 (10,502,308) Employee contributions - 1,583,631 (1,583,631) Net investment income - 25,043,593 (25,043,593) Benefit payments and refunds (12,522,660) (12,522,660) - Administrative expense - (52,088) 52,088 Other (net transfer) - - -
Net changes 15,931,277 24,554,784 (8,623,507)
Balances at December 31, 2019 250,956,427$ 141,309,841$ 109,646,586$
- 68 -

CITY OF EVANSTON, ILLINOIS
Notes to the Financial Statements
For the Fiscal Year Ended December 31, 2019
NOTE 13. EMPLOYEE RETIREMENT SYSTEMS - Continued
A. Plan Descriptions - Continued
Police and Firefighters' Pension Plans - Continued
Changes in the Net Pension Liability - Continued
Firefighters' Pension Fund(a) (b) (a) - (b)
Total Pension Plan Fiduciary Net PensionLiability Net Position Liability
Balances at January 1, 2019 172,226,630$ 75,781,118$ 96,445,512$
Changes for the period Service cost 2,763,258 - 2,763,258 Interest 11,061,538 - 11,061,538 Changes of benefit terms 799,936 - 799,936 Difference between expected and actual experience 5,218,449 - 5,218,449 Changes in assumptions 4,549,731 - 4,549,731 Employer contributions - 8,266,584 (8,266,584) Employee contributions - 954,112 (954,112) Net investment income - 14,527,581 (14,527,581) Benefit payments and refunds (9,624,766) (9,624,766) - Administrative expense - (97,588) 97,588 Other (net transfer) - - -
Net changes 14,768,146 14,025,923 742,223
Balances at December 31, 2019 186,994,776$ 89,807,041$ 97,187,735$
Pension Expense and Deferred Outflows of Resources and Deferred Inflows of Resources
Police Pension Fund
Deferred DeferredOutflows of Inflows ofResources Resources
Difference between expected and actual experience 4,158,527$ 1,607,100$ Changes in assumption 12,180,846 6,216,190 Net difference between projected and actual earnings on pension plan investments 5,850,279 -
Total 22,189,652$ 7,823,290$
For the year ended December 31, 2019, the City recognized police pension expense of $(1,431,109). At December 31,2019, the City reported deferred outflows of resources and deferred inflows of resources related to the Fund from thefollowing sources:
- 69 -

CITY OF EVANSTON, ILLINOIS
Notes to the Financial Statements
For the Fiscal Year Ended December 31, 2019
NOTE 13. EMPLOYEE RETIREMENT SYSTEMS - Continued
A. Plan Descriptions - Continued
Police and Firefighters' Pension Plans - Continued
Pension Expense and Deferred Outflows of Resources and Deferred Inflows of Resources - Continued
Police Pension Fund - Continued
Year EndingDecember 31,
2020 5,332,075$ 2021 4,074,047 2022 2,664,016 2023 3,026,241 2024 (730,017) Thereafter -
Total 14,366,362$
Firefighters' Pension Fund
Deferred DeferredOutflows of Inflows ofResources Resources
Difference between expected and actual experience 961,485$ 1,619,610$ Changes in assumption 8,860,650 5,160,300 Net difference between projected and actual earnings on pension plan investments 5,792,141 -
Total 15,614,276$ 6,779,910$
Amounts reported as deferred outflows of resources and deferred inflows of resources related to the Police Pension Planwill be recognized in pension expense as follows:
For the year ended December 31, 2019, the City recognized firefighters' pension expense of $10,189,814. At December31, 2019, the City reported deferred outflows of resources and deferred inflows of resources related to the Fund fromthe following sources:
- 70 -

CITY OF EVANSTON, ILLINOIS
Notes to the Financial Statements
For the Fiscal Year Ended December 31, 2019
NOTE 13. EMPLOYEE RETIREMENT SYSTEMS - Continued
A. Plan Descriptions - Continued
Police and Firefighters' Pension Plans - Continued
Pension Expense and Deferred Outflows of Resources and Deferred Inflows of Resources - Continued
Firefighters' Pension Fund - Continued
Year EndingDecember 31,
2020 3,634,545$ 2021 2,764,135 2022 1,759,258 2023 1,644,333 2024 (967,905) Thereafter -
Total 8,834,366$
Amounts reported as deferred outflows of resources and deferred inflows of resources related to the Firefighters'Pension Plan will be recognized in pension expense as follows:
- 71 -

CITY OF EVANSTON, ILLINOIS
Notes to the Financial Statements
For the Fiscal Year Ended December 31, 2019
NOTE 14. PENSION TRUST FUNDS
Fiduciary Funds Summary Financial Information
The following is summary financial information for the Police Pension Plan and the Firefighters' Pension Plan:
A. Schedule of Net Position
Firefighters' PolicePension Pension Total
AssetsCash and cash equivalents 3,544,896$ 7,015,554$ 10,560,450$ Investments at fair value
U.S. Treasury obligations 5,444,922 15,595,711 21,040,633 U.S. agency obligations 3,411,429 5,252,662 8,664,091 Corporate bonds 11,222,463 20,977,717 32,200,180 Common stock - 37,379,730 37,379,730 Equity mutual funds 56,150,386 53,707,166 109,857,552 Index funds 9,902,639 - 9,902,639 Real estate - 1,064,103 1,064,103
Receivables Accrued interest 116,211 297,895 414,106 Due from other governments 14,095 19,303 33,398
Total Assets 89,807,041 141,309,841 231,116,882
LiabilitiesNone - - -
Total Liabilities - - -
Net Position Held in Trust For Pension Benefits 89,807,041$ 141,309,841$ 231,116,882$
- 72 -

CITY OF EVANSTON, ILLINOIS
Notes to the Financial Statements
For the Fiscal Year Ended December 31, 2019
NOTE 14. PENSION TRUST FUNDS - Continued
Fiduciary Funds Summary Financial Information - Continued
B. Changes in Plan Net Position
Firefighters' PolicePension Pension Total
AdditionsContributions
Employer 8,266,584$ 10,502,308$ 18,768,892$ Plan members 954,112 1,583,631 2,537,743
Total Contributions 9,220,696 12,085,939 21,306,635
Investment IncomeNet appreciation (depreciation)
in fair value of investments 12,680,364 22,255,060 34,935,424 Interest on investments 2,050,406 3,134,491 5,184,897 Less investment expenses (203,189) (345,958) (549,147)
Total Investment Income 14,527,581 25,043,593 39,571,174
Total Additions 23,748,277 37,129,532 60,877,809
DeductionsAdministrative 97,588 52,088 149,676 Benefits payments 9,624,766 12,522,660 22,147,426
Total Deductions 9,722,354 12,574,748 22,297,102
Net Increase (Decrease) 14,025,923 24,554,784 38,580,707
Net Position Held in Trust For Pension Benefits
January 1 75,781,118 116,755,057 192,536,175
December 31 89,807,041$ 141,309,841$ 231,116,882$
- 73 -
CITY OF EVANSTON, ILLINOIS
Notes to the Financial Statements
For the Fiscal Year Ended December 31, 2019
NOTE 15. EVANSTON LIBRARY COMPONENT UNIT
A. Types of Accounts and Securities
Custodial Credit Risk. For a deposit, custodial credit risk is the risk that, in the event of the failure of thecounterparty, the Library will not be able to recover the value of its deposit or collateral securities that are in thepossession of an outside party. At December 31, 2019, all of the Library's deposits were insured or collateralized byan agent of the Library in the Library's name.
Illinois Statutes authorize the Library to invest in obligations of the U.S. Treasury, in Government SponsoredEnterprises (GSE) such as Federal Home Loan Mortgage Corporation (FHLMC), Federal Home Loan Bank (FHLB),and Fannie Mae (FNMA); bankers acceptances as well as commercial paper rated only in the highest tier;repurchase agreements of the highest grade; collateralized certificates of deposit issued by FDIC insured financialinstitutions, money market mutual funds with portfolios limited to securities guaranteed by the United StatesGovernment, IMET, and The Illinois Funds.
Library investments consists of equities, ETFs, money market funds, mutual funds, corporate bonds, and U.S.Treasuries. Investments are reported at fair value, except that non-negotiable certificate of deposits are stated at cost.The Library has a formal investment policy adopted by its governing board to handle endowment funds. The fundswill be invested and administered by a three-member committee. It is the general policy of the Library to invest itsfunds in a manner which will provide the highest investment return with the maximum security while meeting thedaily cash flow demands of the Library and conforming to all state and local statutes governing the investment ofpublic funds using "prudent person" standard for managing the overall portfolio. It may be noted though that theLibrary has investments in equities which is not permissible under the state statutes.
Interest Rate Risk is the risk that changes in interest rates will adversely affect the fair value of an investment. Theexposure to interest rate risk can be limited by structuring the portfolio to provide liquidity for cash requirements forongoing operations in shorter term securities.
Custodial Credit Risk. For an investment, custodial credit risk is the risk that, in the event of the failure of thecounterparty, the Library will not be able to recover the value of its investment or collateral securities that are in thepossession of an outside party. The Illinois Funds are not subject to custodial credit risk.
Concentration of Credit Risk is the risk that the Library has a high percentage of its investments invested in one typeof investments. Currently, the Library has diversified its investments in various types of investments. The Libraryinvestment policy provides the high/low limits for various type of investments like equity, fixed income securities,and cash.
Credit Risk is the risk that the issuer of the debt security will not pay its par value upon maturity. The Library'sinvestment policy has several guidelines to minimize the potential losses on individual investment by diversifying theinvestment portfolio, not permitting the investment in certain high risk securities. State law limits investments incommercial paper, corporate bonds, and mutual bonds funds to the top two ratings issued by nationally recognizedstatistical rating organizations.
The Illinois Funds, created by the Illinois State Legislature under the control of the State Comptroller, operates asqualified external investment pools in accordance with the criteria established in GASB Statement No. 79, CertainExternal Investment Pools and Pool Participants, and thus, reports all investments at amortized cost rather than fairvalue. The investment in The Illinois Funds by participants is also reported at amortized cost. The Illinois Fundsdoes not have any limitations or restrictions on participant withdrawals. The Illinois Funds Treasurer's Office issuesa separate financial report for The Illinois Funds which may be obtained by contacting the Administrative Office atIllinois Business Center, 400 West Monroe Street, Suite 401, Springfield, Illinois 62704.
IMET is a not-for-profit investment trust formed pursuant to the Illinois Municipal code and managed by a Board ofTrustees elected from the participating members. IMET is not registered with the SEC as an investment company.Investments in IMET are valued at IMET's share price, the price for which the investment could be sold.
- 74 -

CITY OF EVANSTON, ILLINOIS
Notes to the Financial Statements
For the Fiscal Year Ended December 31, 2019
NOTE 15. EVANSTON LIBRARY COMPONENT UNIT - Continued
B. Reconciliation of Cash and Investments
Cash and Equivalents 3,265,890$ Investments 4,447,514
Total per Statement of Position $ 7,713,404
Cash in bank 3,265,890$ Vanguard Money Market 305,045 Vanguard Equity Mutual Funds 4,142,469
Total Cash and Investments $ 7,713,404
C. Summary of Receivables
Receivables:Property taxes 7,732,145$
D. Capital Assets Activity
Beginning Additions Deletions Ending
Capital Assets, not being Depreciated:Land 311,380$ -$ -$ 311,380$
Capital Assets, being Depreciated/Amortized:Buildings and improvements 19,800,359 510,352 - 20,310,711 Office equipment and furniture 2,285,009 - - 2,285,009 Infrastructure 230,006 - - 230,006 Library collections 9,239,512 177,872 - 9,417,384 Capitalized leases 266,191 - - 266,191
Total capital assets being depreciated/amortized 31,821,077 688,224 - 32,509,301
Less Accumulated Depreciation/Amortization for:Buildings and improvements 8,961,624 466,447 - 9,428,071 Office equipment and furniture 2,285,009 - - 2,285,009 Infrastructure 140,232 14,757 - 154,989 Library collections 8,155,373 292,015 - 8,447,388 Capitalized leases 266,190 - - 266,190
Total Accumulated Depreciation/Amortization 19,808,428 773,219 - 20,581,647
Total Capital Assets being Depreciated/Amortized, Net 12,012,649 (84,995) - 11,927,654
Library Activities Capital Assets, Net 12,324,029$ (84,995)$ -$ 12,239,034$
- 75 -

CITY OF EVANSTON, ILLINOIS
Notes to the Financial Statements
For the Fiscal Year Ended December 31, 2019
NOTE 15. EVANSTON LIBRARY COMPONENT UNIT - Continued
E. Long-Term Debt
Final RestatedInterest Maturity Balance Balance Due Within
Rate Date 1/1/2019 Issued Payments 12/31/2019 One YearGeneral Obligations Debt
Series 2013B 2.00%-3.00% 12/1/2025 188,153$ -$ 24,543$ 163,610$ 25,492$ Series 2016A 2.00%-4.00% 12/1/2036 605,000 - 25,000 580,000 25,000 Series 2017A 3.00%-4.00% 12/1/2037 1,340,000 - 50,000 1,290,000 50,000 Series 2017B 4.00%-5.00% 12/1/2027 664,144 - 83,018 581,126 66,898 Series 2018B 2.29%-5.00% 12/1/2038 2,031,842 - - 2,031,842 - Series 2019B 1.66%-2.68% 12/1/2039 - 1,835,000 - 1,835,000 55,258
4,829,139 1,835,000 182,561 6,481,578 222,648
Bond premiums 247,572 386,274 38,825 595,021 - Total OPEB liability 291,830 39,831 - 331,661 12,946 Compensated absences payable - Library 388,138 21,566 77,628 332,076 66,415 Net pension liability - IMRF - 2,258,576 - 2,258,576 -
Total Long-Term Debt 5,756,679$ 4,541,247$ 299,014$ 9,998,912$ 302,009$
The Library had an IMRF net pension asset of $1,100,800 at January 1, 2019.
Year Ending December 31, Principal Interest
2020 222,648$ 257,496$ 2021 232,343 249,900 2022 264,706 241,919 2023 275,730 232,183 2024 353,392 221,284
2025-2029 1,718,739 881,893 2030-2034 1,778,336 532,049 2035-2039 1,635,684 177,219
Total 6,481,578$ 2,793,943$
F. Prior period adjustment
The following schedule illustrates the annual debt service requirements to maturity for Library General Obligation Bonds.
The beginning net position of the governmental activities was restated by $(247,572) to properly reflect the balance of the unamortized bond premiums.
- 76 -

CITY OF EVANSTON, ILLINOIS
Notes to the Financial Statements
For the Fiscal Year Ended December 31, 2019
NOTE 16. SUBSEQUENT EVENTS
Beginning around March 2020, the Covid-19 virus has been declared a global pandemic as it continues to spread rapidly. As aresult, equity investments of the Police Pension Plan and Firefighters Pension Plan have experienced significant declines inquoted prices on active markets. Management of both plans are carefully monitoring the situation and evaluating its optionsduring this time. No adjustments have been made to these financial statements as a result of this uncertainty.
On July 13, 2020, the City approved the first reading of an ordinance for the issuance of the General Oblication CorporatePurpose Bonds Series 2020 in an amount not to exceed $34,000,000. These bonds will be used to refund the Series 2010A andSeries 2011A bonds as well as provide for the funding of capital projects. The final interest rate and maturity schedule has notyet been determined.
Also on July 13, 2020, the City authorized staff to borrow up to $11,000,000 from the Illinois Environmental Protection Agency(IEPA) Public Water Supply Loan Program for a 30 inch diameter transmission main rehabilitation. The final interest rate andmaturity schedule will be determined at the end of the project.
- 77 -

REQUIRED SUPPLEMENTARY INFORMATION

CITY OF EVANSTON, ILLINOIS
Schedule of Changes in the Employer's Total OPEB Liability and Related RatiosOther Postemployment Benefit Plan
Last Two Fiscal Years
MEASUREMENT DATE DECEMBER 31, 2018 2019
TOTAL OPEB LIABILITY
Service cost 1,050,028$ 974,443$ Interest 630,168 733,796 Changes in assumptions (1,272,525) 2,879,775 Implicit benefit payments (797,159) (860,932) Other changes - -
Net change in total OPEB liability (389,488) 3,727,082
Total OPEB liability - beginning 18,717,414 18,327,926
TOTAL OPEB LIABILITY - ENDING 18,327,926$ 22,055,008$
Covered payroll 59,333,084$ 60,964,744$
Employer's total OPEB liability as a percentage of covered payroll 30.89% 36.18%
There was a change in assumptions related to the discount rate in 2019.
There was a change in assumptions related to the discount rate and mortality rate assumptions in 2018.
The information above is presented for the City and Library in total.
Ultimately, this schedule should present information for the last ten years. However, until ten years ofinformation can be compiled, information will be presented for as many years as is available.
(See independent auditor's report.)- 78 -

CITY OF EVANSTON, ILLINOIS
Schedule of Employer ContributionsIllinois Municipal Retirement Fund
Last Five Fiscal Years
FISCAL YEAR ENDED DECEMBER 31, 2015 2016 2017 2018 2019
Actuarially determined contribution 3,977,718$ 3,882,629$ 3,695,564$ 3,628,058$ 2,373,864$
Contributions in relation to the actuarially determined contribution 4,018,268 3,963,856 3,702,271 3,628,058 2,373,864
Contribution Deficiency (Excess) (40,550)$ (81,227)$ (6,707)$ -$ -$
Percentage contributed 101.0% 102.1% 100.2% 100.0% 100.0%
Covered payroll 37,703,487$ 37,477,116$ 37,480,368$ 38,519,776$ 38,158,079$
Contributions as a percentage of covered payroll 10.7% 10.6% 9.9% 9.4% 6.2%
Notes to the Required Supplemental Information
The information presented was determined as part of the actuarial valuations as of January 1 of the prior fiscal year. Additionalinformation as of the latest actuarial valuation presented is as follows: the actuarial cost method was entry-age normal; the amortizationmethod was level percent of pay, closed and the amortization period was 25 years; the asset valuation method was market; and thesignificant actuarial assumptions were an investment rate of return at 7.50% annually, projected salary increases assumption of 3.75% to14.50% annually, and postretirement benefit increases of 3.00% compounded annually.
Ultimately, this schedule should present information for the last ten years. However, until ten years of information can be compiled,information will be presented for as many years as is available.
(See independent auditor's report.)- 79 -

CITY OF EVANSTON, ILLINOIS
Schedule of Employer ContributionsPolice Pension Fund
Last Six Fiscal Years
FISCAL YEAR ENDED DECEMBER 31, 2014 2015 2016 2017 2018 2019
Actuarially determined contribution 8,358,924$ 8,257,475$ 9,380,940$ 10,237,200$ 10,462,704$ 10,502,308$
Contributions in relation to the actuarially determined contribution 8,644,196 8,804,264 9,450,824 10,300,549 10,462,704 10,502,308
Contribution Deficiency (Excess) (285,272)$ (546,789)$ (69,884)$ (63,349)$ -$ -$
Percentage contributed 103.4% 106.6% 100.7% 100.6% 100.0% 100.0%
Covered payroll 13,537,726$ 14,921,328$ 17,474,672$ 15,352,846$ 15,845,701$ 15,980,131$
Contributions as a percentage of covered payroll 63.9% 59.0% 54.1% 67.1% 66.0% 65.7%
Notes to the Required Supplemental Information
The information presented was determined as part of the actuarial valuations as of January 1. Additional information as of the latest actuarial valuationpresented is as follows: the actuarial cost method was entry-age normal; the amortization method was level percent of pay, closed and the amortizationperiod was 21 years; the asset valuation method was market and the significant actuarial assumptions were an investment rate of return at 6.50%annually, projected salary increases assumption of 3.62% to 7.36% annually and postretirement benefit increases of 3.00% compounded annually.
Ultimately, this schedule should present information for the last ten years. However, until ten years of information can be compiled, information will bepresented for as many years as is available.
(See independent auditor's report.)- 80 -
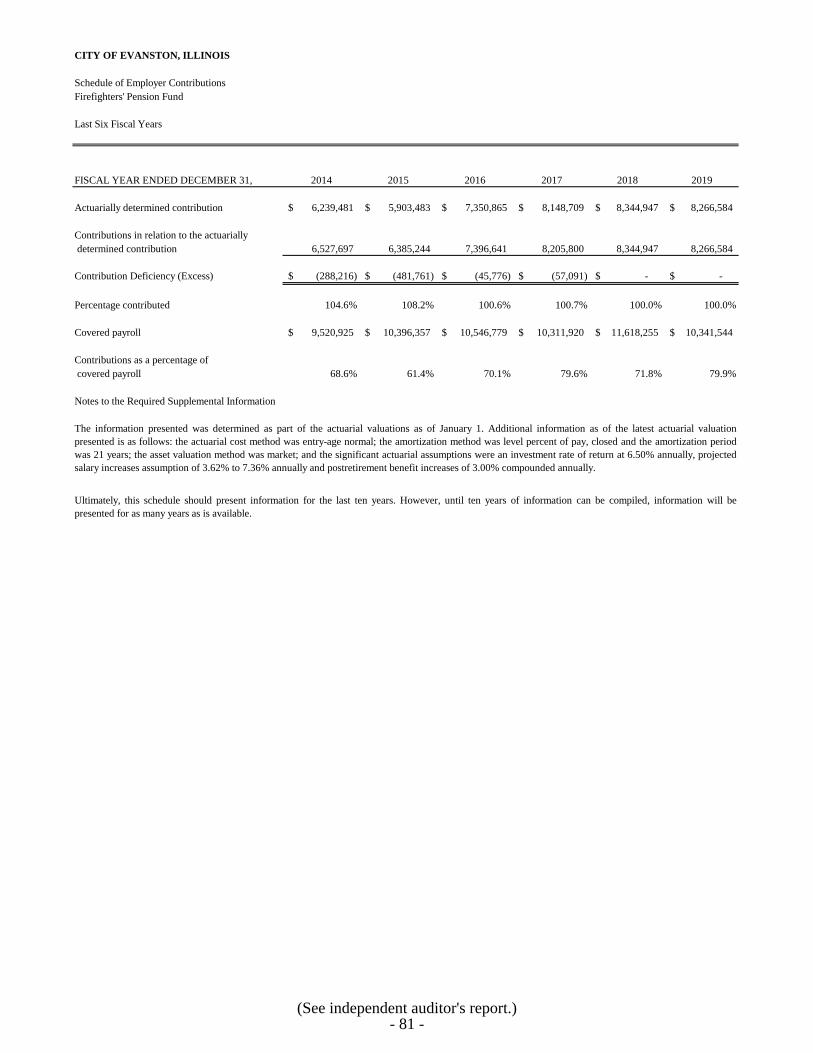
CITY OF EVANSTON, ILLINOIS
Schedule of Employer ContributionsFirefighters' Pension Fund
Last Six Fiscal Years
FISCAL YEAR ENDED DECEMBER 31, 2014 2015 2016 2017 2018 2019
Actuarially determined contribution 6,239,481$ 5,903,483$ 7,350,865$ 8,148,709$ 8,344,947$ 8,266,584$
Contributions in relation to the actuarially determined contribution 6,527,697 6,385,244 7,396,641 8,205,800 8,344,947 8,266,584
Contribution Deficiency (Excess) (288,216)$ (481,761)$ (45,776)$ (57,091)$ -$ -$
Percentage contributed 104.6% 108.2% 100.6% 100.7% 100.0% 100.0%
Covered payroll 9,520,925$ 10,396,357$ 10,546,779$ 10,311,920$ 11,618,255$ 10,341,544$
Contributions as a percentage of covered payroll 68.6% 61.4% 70.1% 79.6% 71.8% 79.9%
Notes to the Required Supplemental Information
The information presented was determined as part of the actuarial valuations as of January 1. Additional information as of the latest actuarial valuationpresented is as follows: the actuarial cost method was entry-age normal; the amortization method was level percent of pay, closed and the amortization periodwas 21 years; the asset valuation method was market; and the significant actuarial assumptions were an investment rate of return at 6.50% annually, projectedsalary increases assumption of 3.62% to 7.36% annually and postretirement benefit increases of 3.00% compounded annually.
Ultimately, this schedule should present information for the last ten years. However, until ten years of information can be compiled, information will bepresented for as many years as is available.
(See independent auditor's report.)- 81 -

CITY OF EVANSTON, ILLINOIS
Schedule of Changes in the Employer's Net Pension Liability and Related RatiosIllinois Municipal Retirement Fund
Last Five Fiscal Years
MEASUREMENT DATE DECEMBER 31, 2014 2015 2016 2017 2018
Total Pension LiabilityService cost 3,898,440$ 3,910,996$ 3,951,687$ 3,970,214$ 3,671,434$ Interest 14,880,724 16,235,086 16,947,408 17,355,320 17,185,510 Changes in benefit terms - - - - - Differences between expected and actual experience 3,043,895 1,465,442 (2,905,680) (2,489,328) 2,992,302 Changes of assumptions 7,927,038 266,906 (269,039) (7,652,648) 6,567,349 Benefit payments, including refunds of member contributions (11,468,097) (11,928,345) (12,270,564) (12,922,439) (13,674,160)
Net Change in Total Pension Liability 18,282,000 9,950,085 5,453,812 (1,738,881) 16,742,435
Total Pension Liability - Beginning 202,194,485 220,476,485 230,426,570 235,880,382 234,141,501
Total Pension Liability - Ending 220,476,485$ 230,426,570$ 235,880,382$ 234,141,501$ 250,883,936$
Plan Fiduciary Net PositionContributions - employer 3,963,983$ 4,018,268$ 3,963,856$ 3,702,271$ 3,634,209$ Contributions - member 1,710,168 1,767,523 1,705,636 1,693,912 1,847,906 Net investment income 12,425,190 1,062,353 14,441,739 39,438,193 (14,090,715) Benefit payments, including refunds of member contributions (11,468,097) (11,928,345) (12,270,564) (12,922,439) (13,674,160) Administrative expense 2,322,043 737,427 (142,981) (4,817,948) 3,915,577
Net Change in Plan Fiduciary Net Position 8,953,287 (4,342,774) 7,697,686 27,093,989 (18,367,183)
Plan Fiduciary Net Position - Beginning 206,588,617 215,541,904 211,199,130 218,896,816 245,990,805
Plan Fiduciary Net Position - Ending 215,541,904$ 211,199,130$ 218,896,816$ 245,990,805$ 227,623,622$
Employer's Net Pension Liability (Asset) 4,934,581$ 19,227,440$ 16,983,566$ (11,849,304)$ 23,260,314$
Plan fiduciary net position as a percentage of the total pension liability (asset) 97.76% 91.66% 92.80% 105.06% 90.73%
Covered payroll 35,171,426$ 37,703,487$ 37,477,116$ 37,480,368$ 38,519,776$
Employer's net pension liability as a percentage of covered payroll 14.03% 51.00% 45.32% -31.61% 60.39%
There were changes in assumptions related to the discount rate in 2018.
There were changes in assumptions related to price inflation, salary increases, retirement age and mortality rates in 2017. There was a change in assumption related to thediscount rate made since the prior measurement date. The discount rate used in the actuarial valuation dated December 31, 2016, is 7.50%. The discount rate used in theprior actuarial valuations, dated December 31, 2015 and December 31, 2014 was 7.49% and 7.50%, respectively.
Ultimately, this schedule should present information for the last ten years. However, until ten years of information can be compiled, information should be presented foras many years as is available.
(See independent auditor's report.)- 82 -
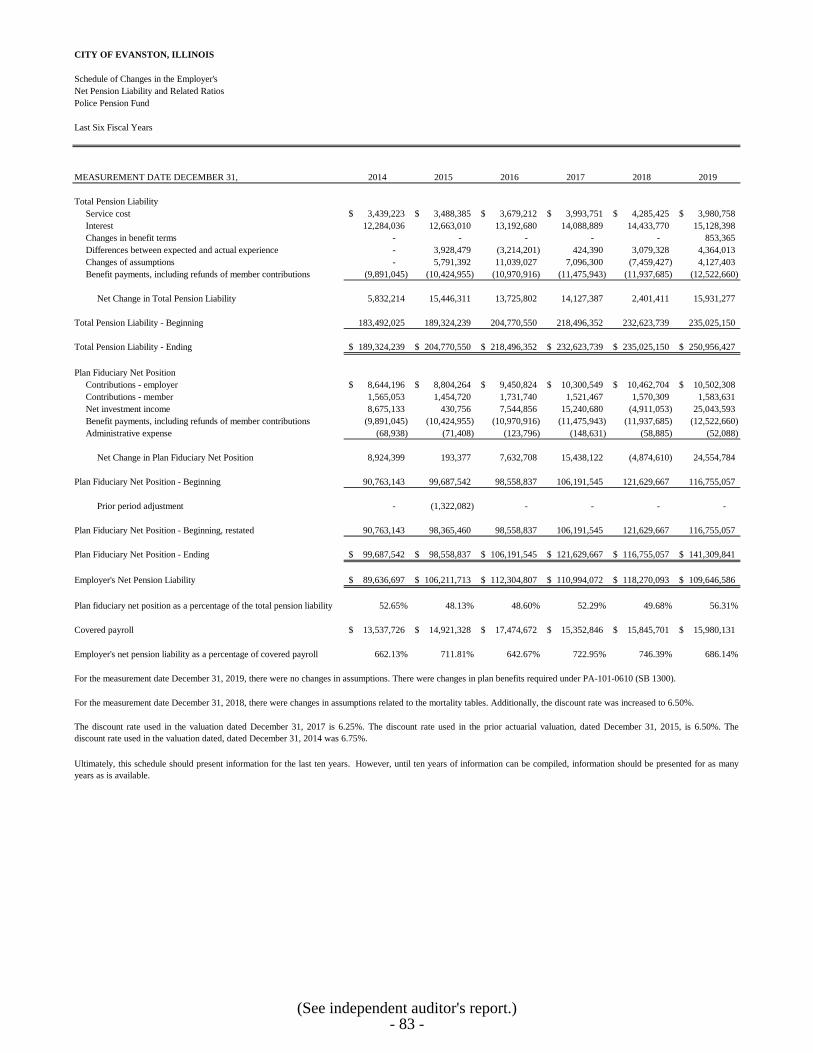
CITY OF EVANSTON, ILLINOIS
Schedule of Changes in the Employer's Net Pension Liability and Related RatiosPolice Pension Fund
Last Six Fiscal Years
MEASUREMENT DATE DECEMBER 31, 2014 2015 2016 2017 2018 2019
Total Pension LiabilityService cost 3,439,223$ 3,488,385$ 3,679,212$ 3,993,751$ 4,285,425$ 3,980,758$ Interest 12,284,036 12,663,010 13,192,680 14,088,889 14,433,770 15,128,398 Changes in benefit terms - - - - - 853,365 Differences between expected and actual experience - 3,928,479 (3,214,201) 424,390 3,079,328 4,364,013 Changes of assumptions - 5,791,392 11,039,027 7,096,300 (7,459,427) 4,127,403 Benefit payments, including refunds of member contributions (9,891,045) (10,424,955) (10,970,916) (11,475,943) (11,937,685) (12,522,660)
Net Change in Total Pension Liability 5,832,214 15,446,311 13,725,802 14,127,387 2,401,411 15,931,277
Total Pension Liability - Beginning 183,492,025 189,324,239 204,770,550 218,496,352 232,623,739 235,025,150
Total Pension Liability - Ending 189,324,239$ 204,770,550$ 218,496,352$ 232,623,739$ 235,025,150$ 250,956,427$
Plan Fiduciary Net PositionContributions - employer 8,644,196$ 8,804,264$ 9,450,824$ 10,300,549$ 10,462,704$ 10,502,308$ Contributions - member 1,565,053 1,454,720 1,731,740 1,521,467 1,570,309 1,583,631 Net investment income 8,675,133 430,756 7,544,856 15,240,680 (4,911,053) 25,043,593 Benefit payments, including refunds of member contributions (9,891,045) (10,424,955) (10,970,916) (11,475,943) (11,937,685) (12,522,660) Administrative expense (68,938) (71,408) (123,796) (148,631) (58,885) (52,088)
Net Change in Plan Fiduciary Net Position 8,924,399 193,377 7,632,708 15,438,122 (4,874,610) 24,554,784
Plan Fiduciary Net Position - Beginning 90,763,143 99,687,542 98,558,837 106,191,545 121,629,667 116,755,057
Prior period adjustment - (1,322,082) - - - -
Plan Fiduciary Net Position - Beginning, restated 90,763,143 98,365,460 98,558,837 106,191,545 121,629,667 116,755,057
Plan Fiduciary Net Position - Ending 99,687,542$ 98,558,837$ 106,191,545$ 121,629,667$ 116,755,057$ 141,309,841$
Employer's Net Pension Liability 89,636,697$ 106,211,713$ 112,304,807$ 110,994,072$ 118,270,093$ 109,646,586$
Plan fiduciary net position as a percentage of the total pension liability 52.65% 48.13% 48.60% 52.29% 49.68% 56.31%
Covered payroll 13,537,726$ 14,921,328$ 17,474,672$ 15,352,846$ 15,845,701$ 15,980,131$
Employer's net pension liability as a percentage of covered payroll 662.13% 711.81% 642.67% 722.95% 746.39% 686.14%
For the measurement date December 31, 2019, there were no changes in assumptions. There were changes in plan benefits required under PA-101-0610 (SB 1300).
For the measurement date December 31, 2018, there were changes in assumptions related to the mortality tables. Additionally, the discount rate was increased to 6.50%.
The discount rate used in the valuation dated December 31, 2017 is 6.25%. The discount rate used in the prior actuarial valuation, dated December 31, 2015, is 6.50%. Thediscount rate used in the valuation dated, dated December 31, 2014 was 6.75%.
Ultimately, this schedule should present information for the last ten years. However, until ten years of information can be compiled, information should be presented for as manyyears as is available.
(See independent auditor's report.)- 83 -

CITY OF EVANSTON, ILLINOIS
Schedule of Changes in the Employer's Net Pension Liability and Related RatiosFirefighters' Pension Fund
Last Six Fiscal Years
MEASUREMENT DATE DECEMBER 31, 2014 2015 2016 2017 2018 2019
Total Pension LiabilityService cost 2,326,092$ 2,431,680$ 2,731,257$ 2,813,961$ 3,026,223$ 2,763,258$ Interest 9,391,253 9,656,198 9,922,911 10,507,435 10,741,734 11,061,538 Changes in benefit terms - - - - - 799,936 Differences between expected and actual experience - 1,184,609 (3,239,221) 368,761 384,928 5,218,449 Changes of assumptions - 4,239,272 7,971,672 5,192,584 (6,192,362) 4,549,731 Benefit payments, including refunds of member contributions (7,727,683) (8,067,965) (8,343,940) (8,609,369) (9,150,830) (9,624,766)
Net Change in Total Pension Liability 3,989,662 9,443,794 9,042,679 10,273,372 (1,190,307) 14,768,146
Total Pension Liability - Beginning 140,667,430 144,657,092 154,100,886 163,143,565 173,416,937 172,226,630
Total Pension Liability - Ending 144,657,092$ 154,100,886$ 163,143,565$ 173,416,937$ 172,226,630$ 186,994,776$
Plan Fiduciary Net PositionContributions - employer 6,527,697$ 6,385,244$ 7,396,641$ 8,205,800$ 8,344,947$ 8,266,584$ Contributions - member 919,874 956,092 997,198 974,992 1,098,506 954,112 Net investment income 3,549,131 228,236 3,894,765 7,974,296 (3,478,827) 14,527,581 Benefit payments, including refunds of member contributions (7,727,683) (8,067,965) (8,343,940) (8,609,369) (9,150,830) (9,624,766) Administrative expense (52,248) (44,597) (85,750) (72,640) (105,755) (97,588)
Net Change in Plan Fiduciary Net Position 3,216,771 (542,990) 3,858,914 8,473,079 (3,291,959) 14,025,923
Plan Fiduciary Net Position - Beginning 65,024,941 68,241,712 66,741,084 70,599,998 79,073,077 75,781,118
Prior period adjustment - (957,638) - - - -
Plan Fiduciary Net Position - Beginning, restated 65,024,941 67,284,074 66,741,084 70,599,998 79,073,077 75,781,118
Plan Fiduciary Net Position - Ending 68,241,712$ 66,741,084$ 70,599,998$ 79,073,077$ 75,781,118$ 89,807,041$
Employer's Net Pension Liability 76,415,380$ 87,359,802$ 92,543,567$ 94,343,860$ 96,445,512$ 97,187,735$
Plan fiduciary net position as a percentage of the total pension liability 47.17% 43.31% 43.27% 45.60% 44.00% 48.03%
Covered payroll 9,520,925$ 10,396,357$ 10,546,779$ 10,311,920$ 11,618,255$ 10,341,544$
Employer's net pension liability as a percentage of covered payroll 802.60% 840.29% 877.46% 914.90% 830.12% 939.78%
For the measurement date December 31, 2019, there were no changes in assumptions. There were changes in plan benefits required under PA-101-0610 (SB 1300).
For the measurement date December 31, 2018, there were changes in assumptions related to the mortality tables. Additionally, the discount rate was increased to 6.50%.
The discount rate used in the valuation dated December 31, 2017 is 6.25%. The discount rate used in the prior actuarial valuation, dated December 31, 2015, is 6.50%. The discountrate used in the actuarial valuation dated December 31, 2014 was 6.75%.
Ultimately, this schedule should present information for the last ten years. However, until ten years of information can be compiled, information should be presented for as many yearsas is available.
(See independent auditor's report.)- 84 -
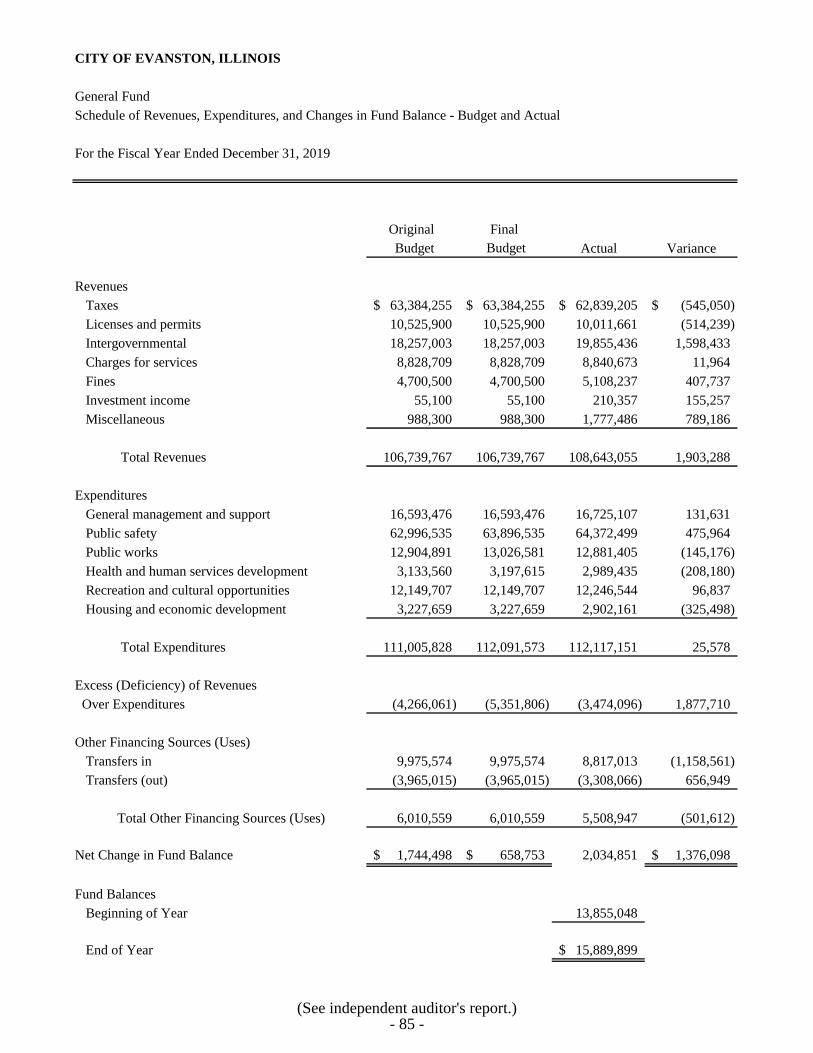
CITY OF EVANSTON, ILLINOIS
General FundSchedule of Revenues, Expenditures, and Changes in Fund Balance - Budget and Actual
For the Fiscal Year Ended December 31, 2019
Original Final Budget Budget Actual Variance
RevenuesTaxes 63,384,255$ 63,384,255$ 62,839,205$ (545,050)$ Licenses and permits 10,525,900 10,525,900 10,011,661 (514,239) Intergovernmental 18,257,003 18,257,003 19,855,436 1,598,433 Charges for services 8,828,709 8,828,709 8,840,673 11,964 Fines 4,700,500 4,700,500 5,108,237 407,737 Investment income 55,100 55,100 210,357 155,257 Miscellaneous 988,300 988,300 1,777,486 789,186
Total Revenues 106,739,767 106,739,767 108,643,055 1,903,288
ExpendituresGeneral management and support 16,593,476 16,593,476 16,725,107 131,631 Public safety 62,996,535 63,896,535 64,372,499 475,964 Public works 12,904,891 13,026,581 12,881,405 (145,176) Health and human services development 3,133,560 3,197,615 2,989,435 (208,180) Recreation and cultural opportunities 12,149,707 12,149,707 12,246,544 96,837 Housing and economic development 3,227,659 3,227,659 2,902,161 (325,498)
Total Expenditures 111,005,828 112,091,573 112,117,151 25,578
Excess (Deficiency) of Revenues Over Expenditures (4,266,061) (5,351,806) (3,474,096) 1,877,710
Other Financing Sources (Uses)Transfers in 9,975,574 9,975,574 8,817,013 (1,158,561) Transfers (out) (3,965,015) (3,965,015) (3,308,066) 656,949
Total Other Financing Sources (Uses) 6,010,559 6,010,559 5,508,947 (501,612)
Net Change in Fund Balance 1,744,498$ 658,753$ 2,034,851 1,376,098$
Fund BalancesBeginning of Year 13,855,048
End of Year 15,889,899$
(See independent auditor's report.)- 85 -

CITY OF EVANSTON, ILLINOIS
Schedule of Investment ReturnsPolice Pension Fund
Last Six Fiscal Years
FISCAL YEAR ENDED DECEMBER 31, 2014 2015 2016 2017 2018 2019
Annual money-weighted rate of return, net of investment expense 9.54% 1.45% 6.90% 14.25% -5.20% 21.13%
Ultimately, this schedule should present return information for the last ten years. However, until ten years of information can becompiled, return information should be presented for as many years as is available.
(See independent auditor's report.)- 86 -
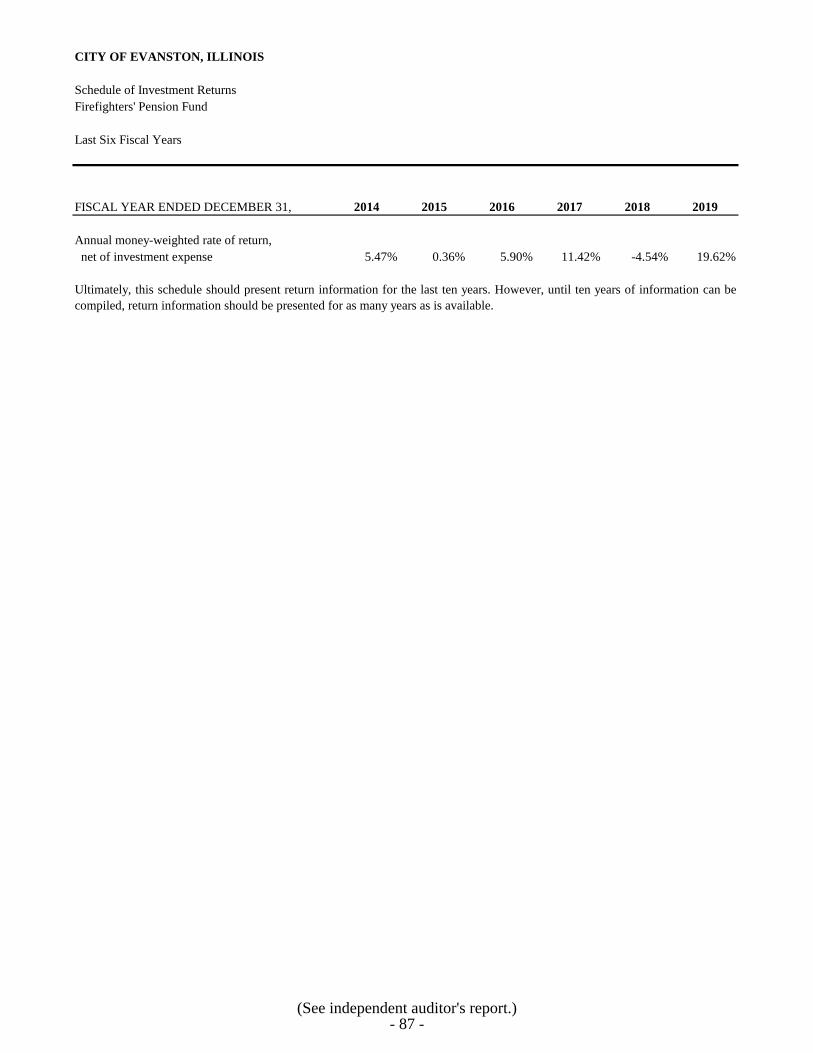
CITY OF EVANSTON, ILLINOIS
Schedule of Investment ReturnsFirefighters' Pension Fund
Last Six Fiscal Years
FISCAL YEAR ENDED DECEMBER 31, 2014 2015 2016 2017 2018 2019
Annual money-weighted rate of return, net of investment expense 5.47% 0.36% 5.90% 11.42% -4.54% 19.62%
Ultimately, this schedule should present return information for the last ten years. However, until ten years of information can becompiled, return information should be presented for as many years as is available.
(See independent auditor's report.)- 87 -

CITY OF EVANSTON, ILLINOIS
Notes to Required Supplementary Information
December 31, 2019
Budgetary Information
The City follows these procedures in establishing the budgetary data reflected in the financial statements:
1.
2. Public budget hearings are conducted. Taxpayer comments are received and noted.
3. The budget is legally enacted through passage of a resolution.
4.
5.
Discrete Component Unit:
1.
2.
3.
4.
5.
During the year, budget amendments were approved by the City Council.
Final Fund Actual Budget Variance
General $ 112,117,151 $ 112,091,573 $ 25,578 Neighborhood Improvement 113 - 113 Howard Ridge Tax Increment District 657,449 514,337 143,112
A series of public library board meetings are conducted as the EPL Board of Trustees considers thebudget proposal. Taxpayer comments are received and noted.
Because of a calendar year, the City Manager will submit to the City Council a proposed operatingbudget for the upcoming fiscal year commencing January 1, 2019. The operating budget includesproposed expenditures and the means of financing them.
The City Manager is authorized to transfer budgeted amounts between departments within any fund;however, any revisions that alter the total expenditures of any fund must be approved by the CityCouncil. There were budget allocations within General Fund.
The Library follows these procedures in establishing the budgetary data reflected in the financial statements:
Because of a calendar year, the Library Director submits a proposed operating budget for the upcomingfiscal year commencing January 1, 2019 to the EPL Board of Trustees. Upon approval of the budgetproposal by the EPL Board of Trustees, the Library’s proposed budget is submitted to the City Manager.The Library's budget is included in the budget documents which the City Manager will submit to the CityCouncil. The operating budget includes proposed expenditures and the means of financing them.
Budgets are legally adopted on a basis consistent with GAAP. Annual appropriated budgets are adoptedfor the General, Special Revenue, Debt Service, Capital Projects, Enterprise, and Internal Service Funds,and Pension Trust Funds. All annual budgets lapse at fiscal year end.
The following funds had an excess of actual budgetary expenditures over original and final budget for the fiscal yearended December 31, 2019:
The budget is legally enacted through passage of a resolution by the City Council.
The Library Director is authorized to transfer budgeted amounts between library departments within anylibrary fund; however, any revisions that alter the total expenditures of any library fund must be approvedby the EPL Board of Trustees. There were budget allocations within the Library Fund but the total did notchange.
The level of control (level at which expenditures may not exceed budget) is the fund. All unencumbered annualappropriations lapse at the end of the fiscal year.
Budgets are legally adopted on a basis consistent with GAAP. The budget is prepared for the LibraryOperating Fund, Library Capital Fund, and Library Debt Service Fund.
- 88 -

COMBINING AND INDIVIDUAL FUND
FINANCIAL STATEMENTS AND SCHEDULES

MAJOR GOVERNMENTAL FUNDS
General Fund - to account for all financial resources of the City except those accounted for in
another fund.
Crown Capital - To account for capital improvements (primarily alley paving) financed by both
special assessments on property owners and city contributions.
General Obligation Debt Fund - to account for non-abated, general obligation payments on the
principal and interest related to bonds and/or other city debt.

CITY OF EVANSTON, ILLINOIS
General FundSchedule of Revenues - Budget and Actual
For the Fiscal Year Ended December 31, 2019
Variance withFinal Budget
Original Final OverBudget Budget Actual (Under)
RevenuesTaxes
PropertyCurrent year levy 30,047,955$ 30,047,955$ 29,888,938$ (159,017)$
Total Property Taxes 30,047,955 30,047,955 29,888,938 (159,017)
Personal Property Replacement Tax 1,451,300 1,451,300 1,744,366 293,066
Other TaxesState use tax 2,000,000 2,000,000 2,513,280 513,280 Sales tax - home rule 6,300,000 6,300,000 6,375,631 75,631 Auto rental tax 55,000 55,000 57,703 2,703 Transportation network provider tax 680,000 680,000 1,000,030 320,030 Athletic contest tax 1,080,000 1,080,000 1,224,283 144,283 Municipal hotel tax 2,390,000 2,390,000 2,262,400 (127,600) Utility tax 6,840,000 6,840,000 6,372,647 (467,353) Cigarette tax 250,000 250,000 180,000 (70,000) Evanston motor fuel tax 1,225,000 1,225,000 1,069,482 (155,518) Liquor tax 3,150,000 3,150,000 3,367,406 217,406 Parking tax 3,450,000 3,450,000 3,271,175 (178,825) Amusement tax 315,000 315,000 662,116 347,116 Foreign fire tax - - 178,469 178,469 Real estate transfer tax 4,150,000 4,150,000 2,671,279 (1,478,721)
Total Other Taxes 31,885,000 31,885,000 31,205,901 (679,099)
Total Taxes 63,384,255 63,384,255 62,839,205 (545,050)
Licenses and PermitsVehicle licenses 2,875,000 2,875,000 2,344,475 (530,525) Business licenses 65,000 65,000 34,293 (30,707) Bed and breakfast licenses 150 150 150 - Collection box license 2,500 2,500 1,125 (1,375) Pet licenses 28,000 28,000 17,266 (10,734) Contractor licenses 170,000 170,000 45,650 (124,350) Rooming house licenses 195,000 195,000 165,567 (29,433) Liquor licenses 525,000 525,000 551,954 26,954 One-day liquor licenses 12,000 12,000 20,621 8,621 Farmer's market licenses 51,250 51,250 50,158 (1,092) Rental building register 85,000 85,000 74,313 (10,687) Other licenses 20,000 20,000 6,005 (13,995) Long-term care license 120,000 120,000 99,540 (20,460) Seasonal foot ESTB 15,000 15,000 11,998 (3,002) Mobile food vehicle license 1,000 1,000 1,437 437 Hen coop license 800 800 250 (550) Child resident care license - - 60 60 Resident care home license 1,200 1,200 900 (300) Building permits 3,875,100 3,875,100 4,617,598 742,498 Plumbing permits - - 100 100 Electrical permits - - 45 45 Signs and awnings 32,800 32,800 1,925 (30,875) Other/miscellaneous permits 350,000 350,000 66,771 (283,229) Elevator permits 42,000 42,000 18,565 (23,435) Heating vent/AC permits - - - - Right of way permits 358,000 358,000 275,586 (82,414)
(This schedule is continued on the following pages.)- 89 -

CITY OF EVANSTON, ILLINOIS
General FundSchedule of Revenues - Budget and Actual
For the Fiscal Year Ended December 31, 2019
Variance withFinal Budget
Original Final OverBudget Budget Actual (Under)
Revenues - ContinuedLicenses and Permits - Continued
Property cleaning permit 10,000$ 10,000$ -$ (10,000)$ Residents parking permit 228,000 228,000 121,594 (106,406) Visitor parking permit 13,000 13,000 13,523 523 Fire suppression/alarm permit 100,000 100,000 55,451 (44,549) Oversize truck permit 20,000 20,000 33,850 13,850 Annual sign fees - - 151 151 Moving van permit 57,000 57,000 46,656 (10,344) Plat PR. and Sign approval HRG fees 2,100 2,100 525 (1,575) IL Bell franchise fee - - 163,926 163,926 Alarm panel franchise fee 4,000 4,000 - (4,000) Northwestern University easement 47,000 47,000 47,000 - Cable franchise fee 1,000,000 1,000,000 1,023,285 23,285 PEG fees - Comcast 145,000 145,000 54,841 (90,159) Nicor franchise fee 75,000 75,000 44,507 (30,493)
Total Licenses and Permits 10,525,900 10,525,900 10,011,661 (514,239)
Intergovernmental - Revenue from Other AgenciesRetailer and service occupation tax 10,250,000 10,250,000 10,529,742 279,742 State income tax 7,210,000 7,210,000 7,991,868 781,868 State highway maintenance 72,200 72,200 75,814 3,614 Health Department Basic Service Grant 82,070 82,070 106,221 24,151 Summer food inspections 200 200 - (200) Illinois tobacco free community 26,000 26,000 25,000 (1,000) IL HIV Surveillance Grant 4,000 4,000 1,542 (2,458) Childhood Lead Poisoning Grant 12,600 12,600 32,900 20,300 Other State/County Grant 91,000 91,000 77,037 (13,963) Tanning parlor inspection 300 300 - (300) Fire Department training 6,000 6,000 1,583 (4,417) CRI Grant 14,100 14,100 49,803 35,703 PEHP Grant 30,000 30,000 77,125 47,125 Lead Paid Hazard Grant 39,333 39,333 18,700 (20,633) Federal Grant/Aid 161,700 161,700 412,667 250,967 Commission on Aging Grant - Advocate 55,000 55,000 115,517 60,517 Vacant Property Grant 37,500 37,500 58,648 21,148 Civil Defense Grants (F.E.M.A.) - - 38,116 38,116 Narcotics enforcement revenue - - 21,750 21,750 Police training 5,000 5,000 2,178 (2,822) eShare revenue - - 69,600 69,600 Police DUI reimbursement 15,000 15,000 16,263 1,263 HUD Emergency Shelter Grant 135,000 135,000 133,362 (1,638) Other Federal Aid 10,000 10,000 - (10,000)
Total Intergovernmental - Revenue from Other Agencies 18,257,003 18,257,003 19,855,436 1,598,433
Charges for ServicesRecreation
Recreation - program 5,549,409 5,549,409 5,867,376 317,967 Recreation - other - - 54,193 54,193 Recreation - charges 3,000 3,000 - (3,000) Recreation - special events 25,000 25,000 31,523 6,523
Total Recreation Revenue 5,577,409 5,577,409 5,953,092 375,683
(This schedule is continued on the following pages.)- 90 -

CITY OF EVANSTON, ILLINOIS
General FundSchedule of Revenues - Budget and Actual
For the Fiscal Year Ended December 31, 2019
Variance withFinal Budget
Original Final OverBudget Budget Actual (Under)
Revenues - ContinuedCharges for Services (Continued)
Other Charges for ServicesHealth clinic fees - food establishment 200,000$ 200,000$ 211,696$ 11,696$ Sanitation classes - - 5,000 5,000 Temporary license fee 10,000 10,000 12,308 2,308 Food delivery vehicle 5,000 5,000 4,450 (550) Beverage snack vending machine 41,000 41,000 39,272 (1,728) Tobacco license 17,000 17,000 10,500 (6,500) Beekeeper license - - 225 225 Birth and death records - - 4,394 4,394 Birth certificate 100,000 100,000 (1,824) (101,824) Death certificate 30,000 30,000 (564) (30,564) Funeral director license 6,300 6,300 - (6,300) Temp funeral director licenses 4,000 4,000 - (4,000) Parking enforcement reimbursement 33,500 33,500 57,588 24,088 Senior Taxi coupon sales 115,000 115,000 84,883 (30,117) Fire cost recovery charge 1,000 1,000 1,040 40 Historic preservation 30,000 30,000 39,634 9,634 Tree preservation revenue 5,000 5,000 10,522 5,522 Ambulance service 2,150,000 2,150,000 2,112,492 (37,508) Towing charges 1,000 1,000 - (1,000) Police report fees 25,000 25,000 32,063 7,063 Zoning fees 210,000 210,000 52,592 (157,408) Fire building inspections 100 100 - (100) Fire report fee 25,000 25,000 12,140 (12,860) Passport processing Fee 35,000 35,000 22,052 (12,948) Alarm panel subscription fees 115,000 115,000 145,465 30,465 Skokie animal board fee - - 360 360 Background check daycare providers 400 400 195 (205) New pavement degradation 80,000 80,000 30,022 (49,978) I Heart Evanston Trees project 7,000 7,000 380 (6,620) Plan review 5,000 5,000 696 (4,304)
Total Other Service Charges 3,251,300 3,251,300 2,887,581 (363,719)
Total Charges for Services 8,828,709 8,828,709 8,840,673 11,964
FinesTicket fines - parking 3,740,000 3,740,000 3,972,067 232,067 Regular fines 115,000 115,000 133,867 18,867 Penalties - - 47,842 47,842 Animal ordinance penalties 7,500 7,500 - (7,500) Boot release fee 45,000 45,000 134,651 89,651 Fire false alarm fines 115,000 115,000 122,275 7,275 Police CTA detail 400,000 400,000 542,297 142,297 Police false alarm fines - - (30) (30) Housing code violation fines 60,000 60,000 31,527 (28,473) Permit penalty fees 8,000 8,000 3,347 (4,653) Administrative adjudication fee 210,000 210,000 120,394 (89,606)
Total Fines 4,700,500 4,700,500 5,108,237 407,737
(This schedule is continued on the following page.)- 91 -

CITY OF EVANSTON, ILLINOIS
General FundSchedule of Revenues - Budget and Actual
For the Fiscal Year Ended December 31, 2019
Variance withFinal Budget
Original Final OverBudget Budget Actual (Under)
Revenues - ContinuedInvestment Income 55,100$ 55,100$ 210,357$ 155,257$
Other RevenuesPolice equipment reimbursement 10,000 10,000 12,150 2,150 Waste transfer station revenue - - 7,000 7,000 Aging well revenue - - 2,000 2,000 Holiday food drive 10,000 10,000 12,415 2,415 Women Out Walking 5,000 5,000 2,775 (2,225) Property sales and rentals 51,100 51,100 285,522 234,422 Donation 15,400 15,400 24,860 9,460 Miscellaneous revenue 443,800 443,800 349,782 (94,018) Market Link vouchers 30,000 30,000 28,951 (1,049) Sale of other assets 1,500 1,500 1,398 (102) Reimbursements - serve and protect 92,000 92,000 63,187 (28,813) Reimbursements - sale use 45,000 45,000 68,019 23,019 Reimbursements - fire department 30,000 30,000 93,413 63,413 Reimbursements - police - - 321,565 321,565 Payment in lieu of taxes 200,000 200,000 86,500 (113,500) Chargeback revenue - - 363,466 363,466 Private Elm Trees Insurance 33,000 33,000 37,660 4,660 Citizens CPR class fees 6,500 6,500 16,823 10,323 Parking permits - Ryan Field 15,000 15,000 - (15,000)
Total Other Revenues 988,300 988,300 1,777,486 789,186
Total Revenues 106,739,767$ 106,739,767$ 108,643,055$ 1,903,288$
(See independent auditor's report.)- 92 -
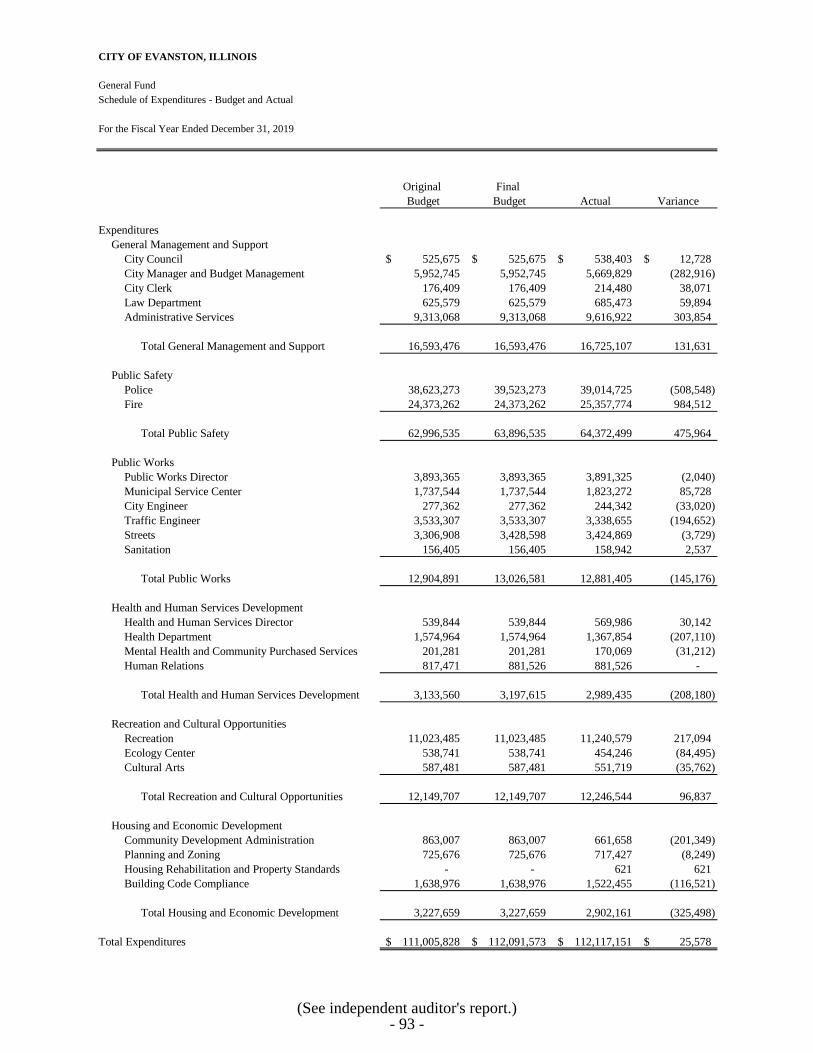
CITY OF EVANSTON, ILLINOIS
General FundSchedule of Expenditures - Budget and Actual
For the Fiscal Year Ended December 31, 2019
Original Final Budget Budget Actual Variance
ExpendituresGeneral Management and Support
City Council 525,675$ 525,675$ 538,403$ 12,728$ City Manager and Budget Management 5,952,745 5,952,745 5,669,829 (282,916) City Clerk 176,409 176,409 214,480 38,071 Law Department 625,579 625,579 685,473 59,894 Administrative Services 9,313,068 9,313,068 9,616,922 303,854
Total General Management and Support 16,593,476 16,593,476 16,725,107 131,631
Public SafetyPolice 38,623,273 39,523,273 39,014,725 (508,548) Fire 24,373,262 24,373,262 25,357,774 984,512
Total Public Safety 62,996,535 63,896,535 64,372,499 475,964
Public WorksPublic Works Director 3,893,365 3,893,365 3,891,325 (2,040) Municipal Service Center 1,737,544 1,737,544 1,823,272 85,728 City Engineer 277,362 277,362 244,342 (33,020) Traffic Engineer 3,533,307 3,533,307 3,338,655 (194,652) Streets 3,306,908 3,428,598 3,424,869 (3,729) Sanitation 156,405 156,405 158,942 2,537
Total Public Works 12,904,891 13,026,581 12,881,405 (145,176)
Health and Human Services DevelopmentHealth and Human Services Director 539,844 539,844 569,986 30,142 Health Department 1,574,964 1,574,964 1,367,854 (207,110) Mental Health and Community Purchased Services 201,281 201,281 170,069 (31,212) Human Relations 817,471 881,526 881,526 -
Total Health and Human Services Development 3,133,560 3,197,615 2,989,435 (208,180)
Recreation and Cultural OpportunitiesRecreation 11,023,485 11,023,485 11,240,579 217,094 Ecology Center 538,741 538,741 454,246 (84,495) Cultural Arts 587,481 587,481 551,719 (35,762)
Total Recreation and Cultural Opportunities 12,149,707 12,149,707 12,246,544 96,837
Housing and Economic DevelopmentCommunity Development Administration 863,007 863,007 661,658 (201,349) Planning and Zoning 725,676 725,676 717,427 (8,249) Housing Rehabilitation and Property Standards - - 621 621 Building Code Compliance 1,638,976 1,638,976 1,522,455 (116,521)
Total Housing and Economic Development 3,227,659 3,227,659 2,902,161 (325,498)
Total Expenditures 111,005,828$ 112,091,573$ 112,117,151$ 25,578$
(See independent auditor's report.)- 93 -
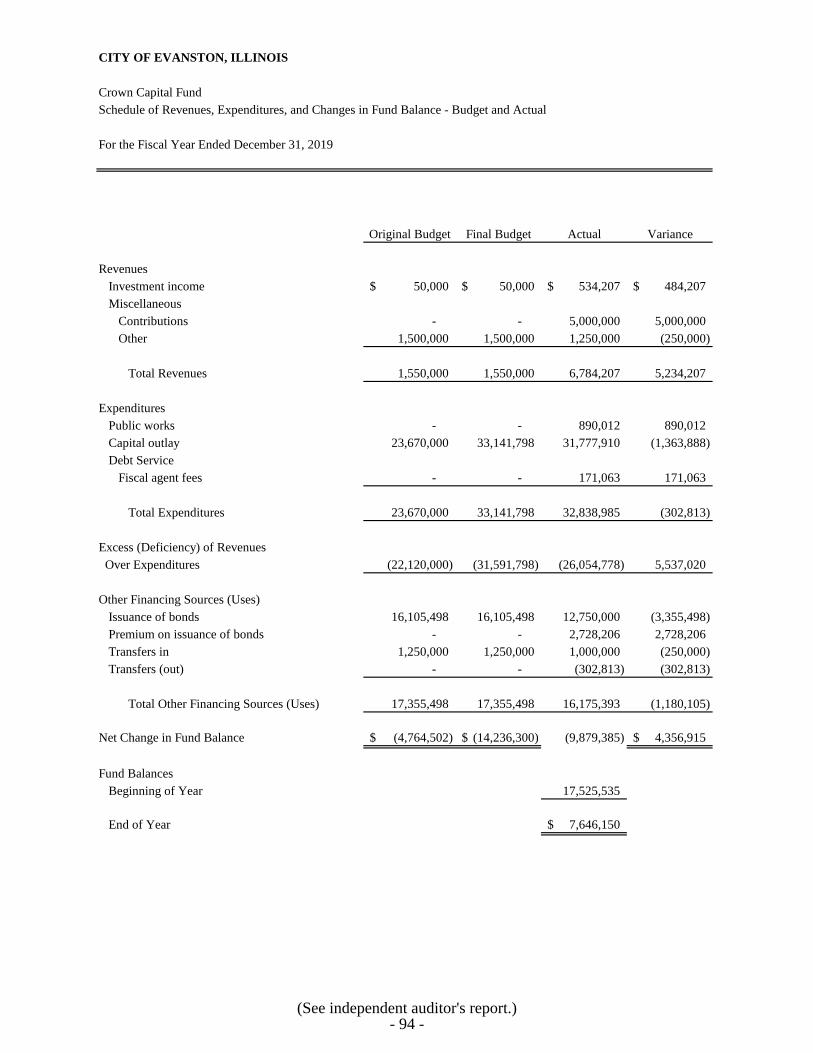
CITY OF EVANSTON, ILLINOIS
Crown Capital FundSchedule of Revenues, Expenditures, and Changes in Fund Balance - Budget and Actual
For the Fiscal Year Ended December 31, 2019
Original Budget Final Budget Actual Variance
RevenuesInvestment income 50,000$ 50,000$ 534,207$ 484,207$ Miscellaneous
Contributions - - 5,000,000 5,000,000 Other 1,500,000 1,500,000 1,250,000 (250,000)
Total Revenues 1,550,000 1,550,000 6,784,207 5,234,207
ExpendituresPublic works - - 890,012 890,012 Capital outlay 23,670,000 33,141,798 31,777,910 (1,363,888) Debt Service
Fiscal agent fees - - 171,063 171,063
Total Expenditures 23,670,000 33,141,798 32,838,985 (302,813)
Excess (Deficiency) of Revenues Over Expenditures (22,120,000) (31,591,798) (26,054,778) 5,537,020
Other Financing Sources (Uses)Issuance of bonds 16,105,498 16,105,498 12,750,000 (3,355,498) Premium on issuance of bonds - - 2,728,206 2,728,206 Transfers in 1,250,000 1,250,000 1,000,000 (250,000) Transfers (out) - - (302,813) (302,813)
Total Other Financing Sources (Uses) 17,355,498 17,355,498 16,175,393 (1,180,105)
Net Change in Fund Balance (4,764,502)$ (14,236,300)$ (9,879,385) 4,356,915$
Fund BalancesBeginning of Year 17,525,535
End of Year 7,646,150$
(See independent auditor's report.)- 94 -
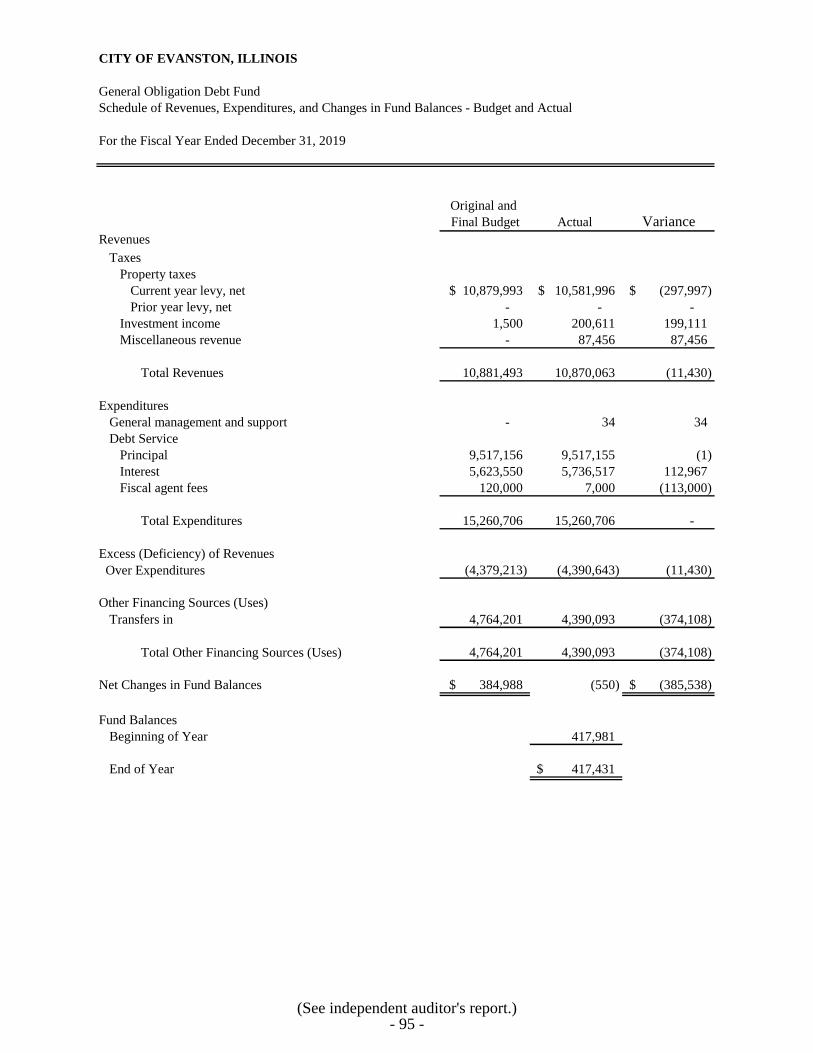
CITY OF EVANSTON, ILLINOIS
General Obligation Debt FundSchedule of Revenues, Expenditures, and Changes in Fund Balances - Budget and Actual
For the Fiscal Year Ended December 31, 2019
Original and Final Budget Actual Variance
TaxesProperty taxes
Current year levy, net 10,879,993$ 10,581,996$ (297,997)$ Prior year levy, net - - -
Investment income 1,500 200,611 199,111 Miscellaneous revenue - 87,456 87,456
Total Revenues 10,881,493 10,870,063 (11,430)
General management and support - 34 34 Debt Service
Principal 9,517,156 9,517,155 (1) Interest 5,623,550 5,736,517 112,967 Fiscal agent fees 120,000 7,000 (113,000)
Total Expenditures 15,260,706 15,260,706 -
Excess (Deficiency) of Revenues Over Expenditures (4,379,213) (4,390,643) (11,430)
Transfers in 4,764,201 4,390,093 (374,108)
Total Other Financing Sources (Uses) 4,764,201 4,390,093 (374,108)
Net Changes in Fund Balances 384,988$ (550) (385,538)$
Fund Balances Beginning of Year 417,981
End of Year 417,431$
Revenues
Expenditures
Other Financing Sources (Uses)
(See independent auditor's report.)- 95 -
NONMAJOR GOVERNMENTAL FUNDS
Special Revenue Funds
Special Revenue Funds are used to account for specific revenues that are legally restricted to expenditures
for a particular purpose.
Motor Fuel Tax - to account for the operation of street maintenance programs and capital projects as
authorized by the Illinois Department of Transportation. Financing is provided by the City’s share of
gasoline taxes.
Emergency Telephone System - to account for revenues and expenditures for 911 emergency telephone
service. Financing provided by network connection surcharges.
Neighborhood Improvement - to account for a portion of the sales tax revenues derived from retail sales
of the Home Depot U.S.A. Inc. store in the City. Sales tax revenues allocated to this fund are to be
expended on public projects that will benefit the immediate neighborhood of the store.
Affordable Housing - to account for costs associated with housing-related programs of the City.
HOME - to account for the activity of the HOME program. Financing is provided by the federal
government. Expenditures are made in accordance with the requirements of federal law.
Community Development Block Grant - to account for revenues and expenditures of the Community
Block Grant program. Financing is provided by the federal government on a reimbursement basis in
accordance with federal formula. Expenditures are made in accordance with the requirements of federal
law.
Community Development Loan - to account for residential rehabilitation loans to residents.
Special Service District No. 4 - to account for promotion, advertisement, and street maintenance costs of
the area located in the City’s central business district. Financing is provided by the City through an annual
property tax levy.
Reparations – to account for the municipal tax revenues (at 3% of retail price) collected from the sales of
recreational cannabis
Good Neighbor - to account for the resources provided by Northwestern University to assist city functions
and increase programming.
General Assistance - to account for the assistance given to persons and/or families to meet their basic
living expenses.

Debt Service Funds
Debt Service Funds are used to account for the servicing of general long-term debt.
Chicago Main TIF - To account for principal and interest payments on debt proceeds issued and allocated
to this tax increment financing district.
Special Service Area No. 6 Fund - to account for promotion, advertisement, and street maintenance costs
of the area located in the City's commercial district surrounding Dempster, Chicago, and Main. Financing
is provided by the City through an annual special service area property tax levy.
Dempster-Dodge TIF - To account for principal and interest payments on debt proceeds issued and
allocated to this tax increment financing district.
Howard/Ridge TIF- To account for principal and interest payments on debt proceeds issued and allocated
to this tax increment financing district.
West Evanston TIF - To account for principal and interest payments on debt proceeds issued and
allocated to this tax increment financing district.
Capital Projects Funds
Capital Improvement - To account for capital projects not funded through special revenue, tax increment
financing, or enterprise funds. Capital projects include, but are not limited to: long-term improvements to
public buildings, the paving of city streets, and the improvement and development of recreation facilities.
Financing is provided primarily by grants and general obligation bond proceeds.
Special Assessment - To account for capital improvements (primarily alley paving) financed by both
special assessments on property owners and City contributions.

CITY OF EVANSTON, ILLINOIS
Combining Balance SheetNonmajor Governmental Funds
December 31, 2019
EmergencyMotor Fuel Telephone Neighborhood Affordable
Tax System Improvement Housing
Cash and equivalents -$ 204,851$ 171,864$ 1,697,856$ Investments 2,342,062 688,754 - 2,390,719 Receivables
Property tax - - - - Loans - - - 1,123,471 Special assessments - - - - Other - - - -
Due from other governments 326,970 383,749 - - Due from other funds - - - - Advances to other funds - - - -
Total Assets 2,669,032$ 1,277,354$ 171,864$ 5,212,046$
LiabilitiesVouchers payable -$ 6,394$ -$ 34,471$ Due to other governments - - - 128,501 Due to component unit - - - - Due to other funds - - - - Advances from other funds - - - - Unearned revenue - - - -
Total Liabilities - 6,394 - 162,972
Deferred Inflows of ResourcesLong-term notes receivable - - - 1,123,471 Unavailable revenue - property taxes - - - -
Total Deferred Inflows of Resources - - - 1,123,471
Total Liabilities and Deferred Inflows of Resources - 6,394 - 1,286,443
Fund Balances Restricted for
Highway Maintenance 2,669,032 - - - Emergency Telephone System - 1,270,960 - - HUD Approved Projects - - - - Neighborhood Improvements - - 171,864 3,925,603 Reparations - - - - Debt Service - - - - Township - - - - Capital Improvements - - - -
Committed - - - - Assigned - - - - Unassigned (deficit) - - - -
Total Fund Balances (Deficit) 2,669,032 1,270,960 171,864 3,925,603
Total Liabilities, Deferred Inflows of Resources, and Fund Balances 2,669,032$ 1,277,354$ 171,864$ 5,212,046$
Assets
Special Revenue
- 96 -

SpecialCommunity Community Service Total
Development Development District Good General SpecialHOME Block Grant Loan No. 4 Reparations Neighbor Assistance Revenue
13,302$ -$ 221,038$ -$ 1,335$ 1,255,161$ 348,269$ 3,913,676$ - - - - - - 15,576 5,437,111
- - - 592,665 - - 1,080,000 1,672,665 4,964,924 - 1,844,287 - - - - 7,932,682
- - - - - - - - - - - - - - - -
57,763 166,139 - - - - - 934,621 - - - - - - - - - - - - - - - -
5,035,989$ 166,139$ 2,065,325$ 592,665$ 1,335$ 1,255,161$ 1,443,845$ 19,890,755$
63,380$ 36,720$ 30,876$ 53,308$ -$ 2,616$ 223$ 227,988$ - - - - - - - 128,501 - - - - - - - - 160 66,122 (37,223) 172,885 - - 581 202,525 - - - - - - - - - - - - - 1,000,000 - 1,000,000
63,540 102,842 (6,347) 226,193 - 1,002,616 804 1,559,014
4,964,924 - 1,844,287 - - - - 7,932,682 - - - 592,665 - - 1,080,000 1,672,665
4,964,924 - 1,844,287 592,665 - - 1,080,000 9,605,347
5,028,464 102,842 1,837,940 818,858 - 1,002,616 1,080,804 11,164,361
- - - - - - - 2,669,032 - - - - - - - 1,270,960
7,525 63,297 227,385 - - - - 298,207 - - - - - - - 4,097,467 - - - - 1,335 - - 1,335 - - - - - - - - - - - - - - 363,041 363,041 - - - - - 252,545 - 252,545 - - - - - - - - - - - - - - - - - - - (226,193) - - - (226,193)
7,525 63,297 227,385 (226,193) 1,335 252,545 363,041 8,726,394
5,035,989$ 166,139$ 2,065,325$ 592,665$ 1,335$ 1,255,161$ 1,443,845$ 19,890,755$
Special Revenue
(This schedule is continued on the following pages.)- 97 -

CITY OF EVANSTON, ILLINOIS
Combining Balance SheetNonmajor Governmental Funds
December 31, 2019
Chicago Main Special Dempster-DodgeTax Service Tax
Increment Area IncrementDistrict No. 6 District
Cash and equivalents 686,753$ 5,342$ 107,803$ Investments - - - Receivables
Property tax - 221,000 - Loans - - - Special assessments - - - Other - - -
Due from other governments - - - Due from other funds - - - Advances to other funds - - -
Total Assets 686,753$ 226,342$ 107,803$
LiabilitiesVouchers payable -$ -$ -$ Due to other governments - - - Due to component unit - - - Due to other funds - - - Advances from other funds - - - Unearned revenue - - -
Total Liabilities - - -
Deferred Inflows of ResourcesLong-term notes receivable - - - Unavailable revenue - property taxes - 221,000 -
Total Deferred Inflows of Resources - 221,000 -
Total Liabilities and Deferred Inflows of Resources - 221,000 -
Fund Balances Restricted for
Highway Maintenance - - - Emergency Telephone System - - - HUD Approved Projects - - - Neighborhood Improvements - 5,342 - Reparations - - - Debt Service 686,753 - 107,803 Township - - - Capital Improvements - - -
Committed - - - Assigned - - - Unassigned (deficit) - - -
Total Fund Balances (Deficit) 686,753 5,342 107,803
Total Liabilities, Deferred Inflows of Resources, and Fund Balances 686,753$ 226,342$ 107,803$
Assets
Debt Service
- 98 -

Howard Ridge West Evanston TotalTax Tax Total Total Nonmajor
Increment Increment Debt Capital Special Capital GovernmentalDistrict District Service Improvements Assessment Projects Funds
-$ -$ 799,898$ 1,856,047$ 598,512$ 2,454,559$ 7,168,133$ 1,646,152 710,476 2,356,628 10,232,649 2,273,945 12,506,594 20,300,333
- - 221,000 - - - 1,893,665 - - - - - - 7,932,682 - - - - 482,723 482,723 482,723 - - - 40,800 4,281 45,081 45,081 - - - 390,913 - 390,913 1,325,534
1,025,998 - 1,025,998 - 51,068 51,068 1,077,066 - - - 4,000,000 - 4,000,000 4,000,000
2,672,150$ 710,476$ 4,403,524$ 16,520,409$ 3,410,529$ 19,930,938$ 44,225,217$
547,385$ -$ 547,385$ 2,488,032$ -$ 2,488,032$ 3,263,405$ - - - - - - 128,501 - - - - - - - - - - 1,372,131 - 1,372,131 1,574,656 - - - - - - - - - - - - - 1,000,000
547,385 - 547,385 3,860,163 - 3,860,163 5,966,562
- - - - 482,723 482,723 8,415,405 - - 221,000 - - - 1,893,665
- - 221,000 - 482,723 482,723 10,309,070
547,385 - 768,385 3,860,163 482,723 4,342,886 16,275,632
- - - - - - 2,669,032 - - - - - - 1,270,960 - - - - - - 298,207 - - 5,342 - 2,927,806 2,927,806 7,030,615 - - - - - - 1,335
2,124,765 710,476 3,629,797 - - - 3,629,797 - - - - - - 363,041 - - - - - - 252,545 - - - - - - - - - - 12,660,246 - 12,660,246 12,660,246 - - - - - - (226,193)
2,124,765 710,476 3,635,139 12,660,246 2,927,806 15,588,052 27,949,585
2,672,150$ 710,476$ 4,403,524$ 16,520,409$ 3,410,529$ 19,930,938$ 44,225,217$
Capital ProjectsDebt Service
(See independent auditor's report.)- 99 -

CITY OF EVANSTON, ILLINOIS
Combining Statement of Revenues, Expenditures, and Changes in Fund Balances Nonmajor Governmental Funds
For the Fiscal Year Ended December 31, 2019
EmergencyMotor Fuel Telephone Neighborhood Affordable
Tax System Improvement Housing
RevenuesTaxes -$ 1,468,418$ -$ 63,000$ Special assessments - - - - Intergovernmental 2,443,580 - - 11,013 Charges for services - - - - Investment income 47,205 19,740 903 41,125 Miscellaneous
Contributions - - - 2,725,000 Other - - - 12,534
Total Revenues 2,490,785 1,488,158 903 2,852,672
ExpendituresCurrent
General management and support - - - - Public safety - 905,229 - - Public works 874,910 - - - Housing and economic development - - 113 292,224
Capital outlay - - - - Debt service
Principal - - - - Interest - - - - Fiscal agent fees - - - -
Total Expenditures 874,910 905,229 113 292,224
Excess (Deficiency) of Revenues Over Expenditures 1,615,875 582,929 790 2,560,448
Other Financing Sources (Uses)Issuance of bonds - - - - Issuance of loans - - - - Premium (discount) on bonds issued - - - - Transfers in - - - - Transfers (out) (982,897) (74,034) - -
Total Other Financing Sources (Uses) (982,897) (74,034) - -
Net Change in Fund Balances 632,978 508,895 790 2,560,448
Fund Balances (Deficit), January 1 2,036,054 762,065 171,074 1,365,155
Fund Balances (Deficit), December 31 2,669,032$ 1,270,960$ 171,864$ 3,925,603$
Special Revenue
- 100 -
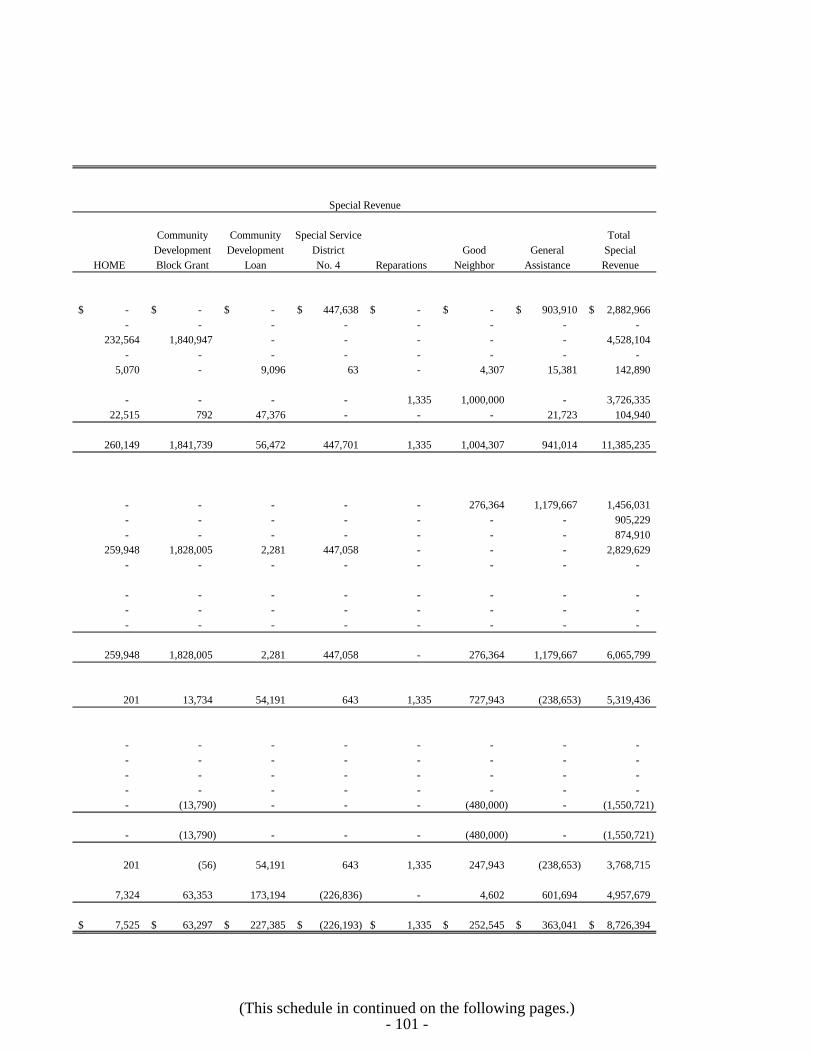
Community Community Special Service Total Development Development District Good General Special
HOME Block Grant Loan No. 4 Reparations Neighbor Assistance Revenue
-$ -$ -$ 447,638$ -$ -$ 903,910$ 2,882,966$ - - - - - - - -
232,564 1,840,947 - - - - - 4,528,104 - - - - - - - -
5,070 - 9,096 63 - 4,307 15,381 142,890
- - - - 1,335 1,000,000 - 3,726,335 22,515 792 47,376 - - - 21,723 104,940
260,149 1,841,739 56,472 447,701 1,335 1,004,307 941,014 11,385,235
- - - - - 276,364 1,179,667 1,456,031 - - - - - - - 905,229 - - - - - - - 874,910
259,948 1,828,005 2,281 447,058 - - - 2,829,629 - - - - - - - -
- - - - - - - - - - - - - - - - - - - - - - - -
259,948 1,828,005 2,281 447,058 - 276,364 1,179,667 6,065,799
201 13,734 54,191 643 1,335 727,943 (238,653) 5,319,436
- - - - - - - - - - - - - - - - - - - - - - - - - - - - - - - - - (13,790) - - - (480,000) - (1,550,721)
- (13,790) - - - (480,000) - (1,550,721)
201 (56) 54,191 643 1,335 247,943 (238,653) 3,768,715
7,324 63,353 173,194 (226,836) - 4,602 601,694 4,957,679
7,525$ 63,297$ 227,385$ (226,193)$ 1,335$ 252,545$ 363,041$ 8,726,394$
Special Revenue
(This schedule in continued on the following pages.)- 101 -

CITY OF EVANSTON, ILLINOIS
Combining Statement of Revenues, Expenditures, and Changes in Fund Balances Nonmajor Governmental Funds
For the Fiscal Year Ended December 31, 2019
Chicago Main Special Dempster-Tax Service Dodge Tax
Increment Area IncrementDistrict No. 6 District
RevenuesTaxes 603,848$ 223,306$ 122,797$ Special assessments - - - Intergovernmental - - - Charges for services - - - Investment income 10,673 2,305 2,095 Miscellaneous
Contributions - - - Other - - -
Total Revenues 614,521 225,611 124,892
ExpendituresCurrent
General management and support - - - Public safety - - - Public works - - - Housing and economic development 1,067 223,368 1,061
Capital outlay - - - Debt service
Principal - - - Interest - - - Fiscal agent fees - - -
Total Expenditures 1,067 223,368 1,061
Excess (Deficiency) of Revenues Over Expenditures 613,454 2,243 123,831
Other Financing Sources (Uses)Issuance of bonds - - - Issuance of loans - - - Premium (discount) on bonds issued - - - Transfers in - - - Transfers (out) (100,610) - (70,870)
Total Other Financing Sources (Uses) (100,610) - (70,870)
Net Change in Fund Balances 512,844 2,243 52,961
Fund Balances (Deficit), January 1 173,909 3,099 54,842
Fund Balances (Deficit), December 31 686,753$ 5,342$ 107,803$
Debt Service
- 102 -

Howard Ridge West Evanston TotalTax Tax Total Total Nonmajor
Increment Increment Debt Capital Special Capital GovernmentalDistrict District Service Improvements Assessment Projects Funds
680,510$ 710,020$ 2,340,481$ -$ -$ -$ 5,223,447$ - - - - 230,526 230,526 230,526 - - - 894,216 - 894,216 5,422,320 - - - 84,261 - 84,261 84,261
39,159 11,794 66,026 448,753 66,589 515,342 724,258
- - - - - - 3,726,335 48,795 11,311 60,106 123,682 - 123,682 288,728
768,464 733,125 2,466,613 1,550,912 297,115 1,848,027 15,699,875
- - - 1,023,648 1,232 1,024,880 2,480,911 - - - 543,353 - 543,353 1,448,582 - - - 1,201,241 - 1,201,241 2,076,151
607,606 1,805 834,907 - - - 3,664,536 - - - 8,017,042 1,477 8,018,519 8,018,519
48,812 600,000 648,812 - - - 648,812 1,031 11,225 12,256 - - - 12,256
- - - 93,276 3,060 96,336 96,336
657,449 613,030 1,495,975 10,878,560 5,769 10,884,329 18,446,103
111,015 120,095 970,638 (9,327,648) 291,346 (9,036,302) (2,746,228)
- - - 6,770,000 250,000 7,020,000 7,020,000 - - - - - - - - - - 1,425,108 52,626 1,477,734 1,477,734 - - - 198,181 - 198,181 198,181
(203,112) (30,000) (404,592) (303,644) (286,955) (590,599) (2,545,912)
(203,112) (30,000) (404,592) 8,089,645 15,671 8,105,316 6,150,003
(92,097) 90,095 566,046 (1,238,003) 307,017 (930,986) 3,403,775
2,216,862 620,381 3,069,093 13,898,249 2,620,789 16,519,038 24,545,810
2,124,765$ 710,476$ 3,635,139$ 12,660,246$ 2,927,806$ 15,588,052$ 27,949,585$
Capital ProjectsDebt Service
(See independent auditor's report.)- 103 -

CITY OF EVANSTON, ILLINOIS
Motor Fuel Tax FundSchedule of Revenues, Expenditures, and Changes in Fund Balance - Budget and Actual
For the Fiscal Year Ended December 31, 2019
Original and Final Budget Actual Variance
RevenuesIntergovernmental allotments 1,910,000$ 2,443,580$ 533,580$ Interest 12,000 47,205 35,205
Total Revenues 1,922,000 2,490,785 568,785
ExpendituresPublic Works 1,206,000 874,910 (331,090)
Excess (Deficiency) of Revenues Over Expenditures 716,000 1,615,875 899,875
Other Financing Sources (Uses)Transfers (out) (982,897) (982,897) -
Other Financing Sources (Uses) - Net (982,897) (982,897) -
Net Change in Fund Balance (266,897)$ 632,978 899,875$
Fund BalancesBeginning of Year 2,036,054
End of Year 2,669,032$
(See independent auditor's report.)- 104 -

CITY OF EVANSTON, ILLINOIS
Emergency Telephone System FundSchedule of Revenues, Expenditures, and Changes in Fund Balance - Budget and Actual
For the Fiscal Year Ended December 31, 2019
Original and Final Budget Actual Variance
RevenuesTaxes and special assessments 1,312,800$ 1,468,418$ 155,618$ Interest 7,000 19,740 12,740
Total Revenues 1,319,800 1,488,158 168,358
ExpendituresPublic safety 947,455 905,229 (42,226)
Excess (Deficiency) of Revenues Over Expenditures 372,345 582,929 210,584
Other Financing Sources (Uses)Transfers (out) (74,034) (74,034) -
Net Change in Fund Balance 298,311$ 508,895 210,584$
Fund BalanceBeginning of Year 762,065
End of Year 1,270,960$
(See independent auditor's report.)- 105 -

CITY OF EVANSTON, ILLINOIS
Neighborhood Improvement FundSchedule of Revenues, Expenditures, and Changes in Fund Balance - Budget and Actual
For the Fiscal Year Ended December 31, 2019
Original and Final Budget Actual Variance
RevenuesInterest -$ 903$ 903$
ExpendituresHousing and economic development - 113 113
Excess (Deficiency) of Revenues Over Expenditures - 790 790
Other Financing Sources (Uses)Transfers (out) (100,000) - 100,000
Total other financing sources (uses) (100,000) - 100,000
Net Change in Fund Balance (100,000)$ 790 100,790$
Fund BalancesBeginning of Year 171,074
End of Year 171,864$
(See independent auditor's report.)- 106 -
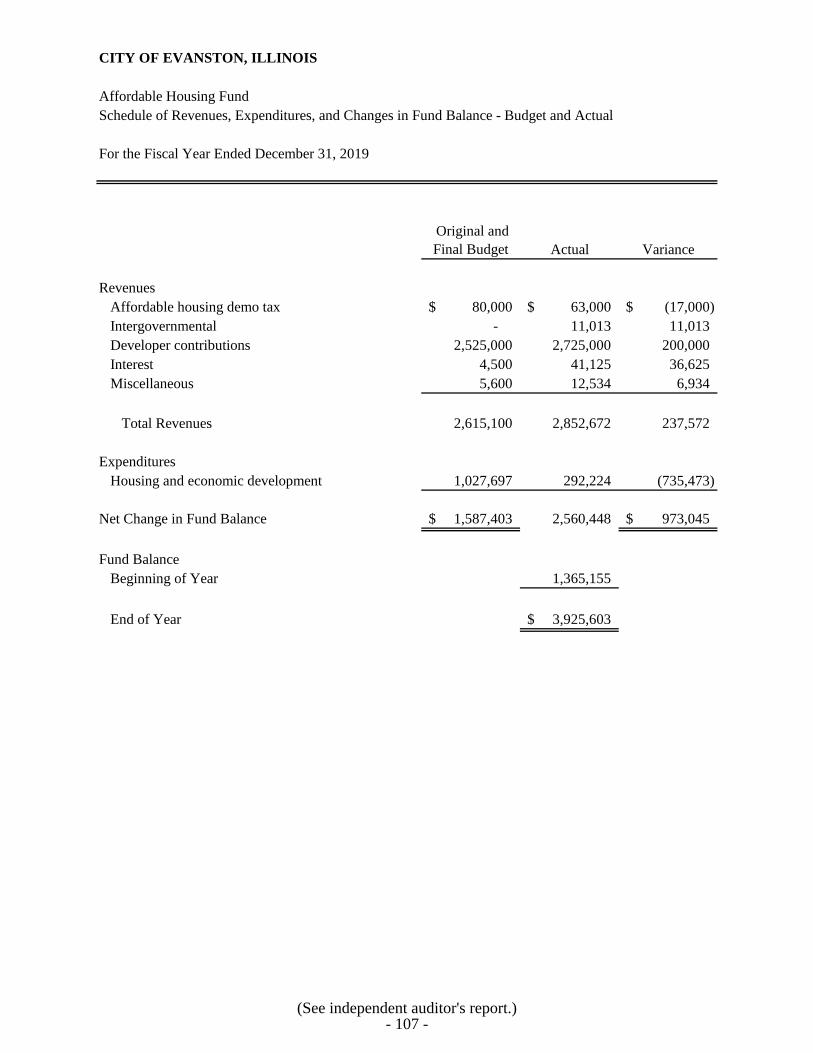
CITY OF EVANSTON, ILLINOIS
Affordable Housing FundSchedule of Revenues, Expenditures, and Changes in Fund Balance - Budget and Actual
For the Fiscal Year Ended December 31, 2019
Original and Final Budget Actual Variance
RevenuesAffordable housing demo tax 80,000$ 63,000$ (17,000)$ Intergovernmental - 11,013 11,013 Developer contributions 2,525,000 2,725,000 200,000 Interest 4,500 41,125 36,625 Miscellaneous 5,600 12,534 6,934
Total Revenues 2,615,100 2,852,672 237,572
ExpendituresHousing and economic development 1,027,697 292,224 (735,473)
Net Change in Fund Balance 1,587,403$ 2,560,448 973,045$
Fund BalanceBeginning of Year 1,365,155
End of Year 3,925,603$
(See independent auditor's report.)- 107 -
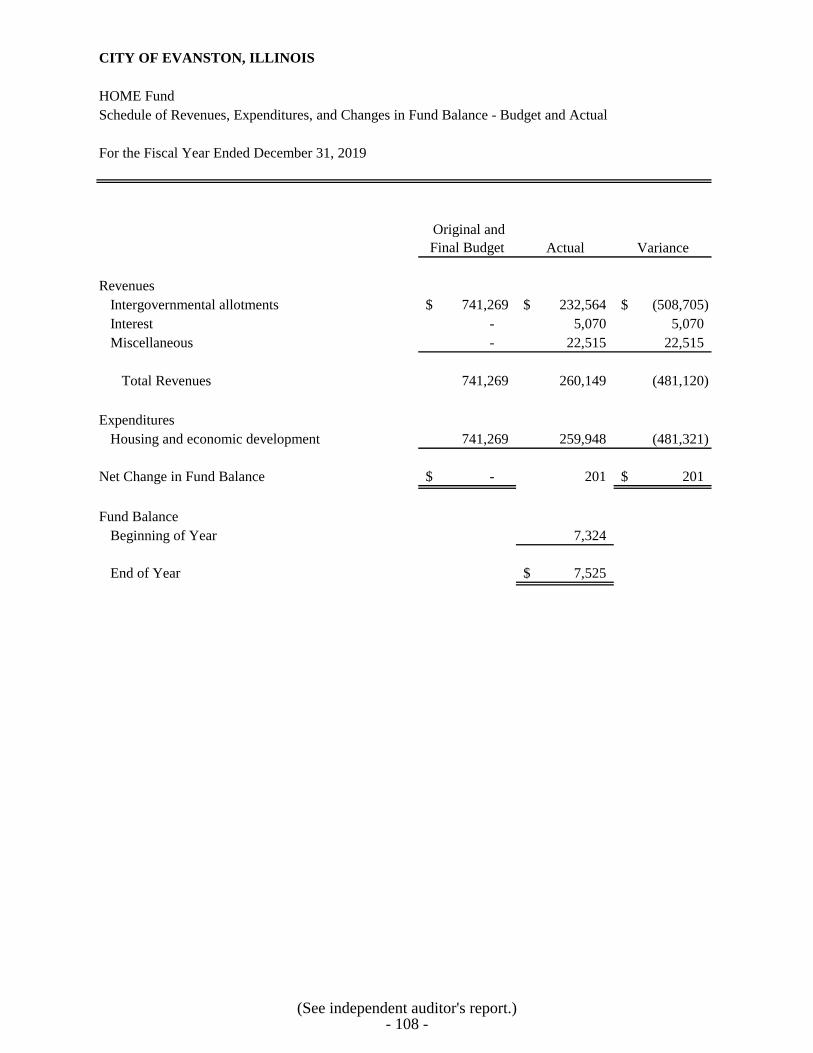
CITY OF EVANSTON, ILLINOIS
HOME FundSchedule of Revenues, Expenditures, and Changes in Fund Balance - Budget and Actual
For the Fiscal Year Ended December 31, 2019
Original and Final Budget Actual Variance
RevenuesIntergovernmental allotments 741,269$ 232,564$ (508,705)$ Interest - 5,070 5,070 Miscellaneous - 22,515 22,515
Total Revenues 741,269 260,149 (481,120)
ExpendituresHousing and economic development 741,269 259,948 (481,321)
Net Change in Fund Balance -$ 201 201$
Fund BalanceBeginning of Year 7,324
End of Year 7,525$
(See independent auditor's report.)- 108 -

CITY OF EVANSTON, ILLINOIS
Community Development Block Grant FundSchedule of Revenues, Expenditures, and Changes in Fund Balance - Budget and Actual
For the Fiscal Year Ended December 31, 2019
Original and Final Budget Actual Variance
RevenuesIntergovernmental allotments grant from U.S. Department of Housing and Urban Development 2,631,080$ 1,840,947$ (790,133)$ Miscellaneous - 792 792
Total Revenues 2,631,080 1,841,739 (789,341)
ExpendituresHousing and economic development 1,998,605 1,828,005 (170,600)
Total Expenditures 1,998,605 1,828,005 (170,600)
Excess (Deficiency) of Revenues Over Expenditures 632,475 13,734 (618,741)
Other Financing Sources (Uses) Transfers (out) (632,475) (13,790) 618,685
Other Financing Sources (Uses) - Net (632,475) (13,790) 618,685
Net Change in Fund Balance -$ (56) (56)$
Fund BalanceBeginning of Year 63,353
End of Year 63,297$
(See independent auditor's report.)- 109 -

CITY OF EVANSTON, ILLINOIS
Community Development Block Grant FundSchedule of Expenditures - Budget and Actual (Budgetary Basis)
For the Fiscal Year Ended December 31, 2019
Original and Final Budget Actual Variance
Administration/PlanningCDBG administration 1,292,650$ 259,622$ (1,033,028)$
Total Administration/Planning 1,292,650 259,622 (1,033,028)
Economic DevelopmentEvanston Community Development Corporation 50,000 - (50,000)
Total Economic Development 50,000 - (50,000)
HousingRehab construction administration 214,455 136,495 (77,960) Targeted housing code enforcement - 336,071 336,071
Total Housing 214,455 472,566 258,111
Neighborhood RevitalizationFoster Field Park - 225,615 225,615 Alley paving program - 323,516 323,516 Street resurfacing - 4,940 4,940 Mason Park - 11,000 11,000 Clyde Brummel Park - 20,970 20,970 Infant Welfare Society - 97,249 97,249 Reba Replace Early Childhood Learning Center - 20,030 20,030 McGaw YMCA - 56,400 56,400 CJE Senior Life - 23,387 23,387 Toddler Town Daycare HVAC - 9,855 9,855 Special assessments - 12,462 12,462
Total Neighborhood Revitalization - 805,424 805,424
Public ServicesGirl Scouts Making Choices - 5,500 5,500 Moran/Defender - 20,400 20,400 Youth Job Center of Evanston - 27,399 27,399 Summer youth - 43,400 43,400 YWCA Domestic Violence - 35,000 35,000 Connection for Homeless - 25,000 25,000 Family Focus - 11,400 11,400 Shore Community Services - 7,500 7,500 Meals at Home - 14,200 14,200 North Shore Senior Center - 8,600 8,600 Evanston Schoars - 11,200 11,200 Open Studio Art - 4,800 4,800 Interfaith Housing Program - Homeshare - 15,020 15,020 Books and Breakfast - 5,620 5,620
(This schedule is continued on the following page.)- 110 -

CITY OF EVANSTON, ILLINOIS
Community Development Block Grant FundSchedule of Expenditures - Budget and Actual (Budgetary Basis)
For the Fiscal Year Ended December 31, 2019
Original and Final Budget Actual Variance
Public Services (Continued)The Harbor, Inc. -$ 5,200$ 5,200$ Graffiti - 37,000 37,000 Iwork/hous options - 13,000 13,000 Other charges - 154 154 Contributions to other agencies 441,500 - (441,500)
Total Public Services 441,500 290,393 (151,107)
Total Expenditures 1,998,605$ 1,828,005$ (170,600)$
(See independent auditor's report.)- 111 -

CITY OF EVANSTON, ILLINOIS
Community Development Loan FundSchedule of Revenues, Expenditures, and Changes in Fund Balance - Budget and Actual
For the Fiscal Year Ended December 31, 2019
Original and Final Budget Actual Variance
RevenuesInterest -$ 9,096$ 9,096$ Miscellaneous 250,000 47,376 (202,624)
Total Revenues 250,000 56,472 (193,528)
ExpendituresHousing and economic development 250,000 2,281 (247,719)
Net Change in Fund Balance -$ 54,191 54,191$
Fund Balances Beginning of Year 173,194
End of Year 227,385$
(See independent auditor's report.)- 112 -

CITY OF EVANSTON, ILLINOIS
Special Service District No. 4 FundSchedule of Revenues, Expenditures, and Changes in Fund Balance - Budget and Actual
For the Fiscal Year Ended December 31, 2019
Original and Final Budget Actual Variance
RevenuesProperty taxes
Current year 525,000$ 447,638$ (77,362)$ Investment income - 63 63
Total Revenues 525,000 447,701 (77,299)
ExpendituresHousing and economic development 525,000 447,058 (77,942)
Net Change in Fund Balance (Deficit) -$ 643 643$
Fund Balance (Deficit)Beginning of Year (226,836)
End of Year (226,193)$
(See independent auditor's report.)- 113 -

CITY OF EVANSTON, ILLINOIS
Good Neighbor FundSchedule of Revenues, Expenditures, and Changes in Fund Balance - Budget and Actual
For the Fiscal Year Ended December 31, 2019
Original and Final Budget Actual Variance
RevenuesMiscellaneous 1,000,000$ 1,000,000$ -$ Investment income 2,000 4,307 2,307
Total Revenues 1,002,000 1,004,307 2,307
ExpendituresGeneral management and support 520,000 276,364 (243,636)
Excess (Deficiency) of Revenues Over Expenditures 482,000 727,943 245,943
Other Financing Sources (Uses) Transfers (out) (480,000) (480,000) -
Other Financing Sources (Uses) - Net (480,000) (480,000) -
Net Change in Fund Balance 2,000$ 247,943 245,943$
Fund BalanceBeginning of Year 4,602
End of Year 252,545$
(See independent auditor's report.)- 114 -

CITY OF EVANSTON, ILLINOIS
General Assistance FundSchedule of Revenues, Expenditures, and Changes in Fund Balance - Budget and Actual
For the Fiscal Year Ended December 31, 2019
Original and Final Budget Actual Variance
RevenuesProperty taxes 925,000$ 903,910$ (21,090)$ Investment income 1,000 15,381 14,381Miscellaneous 27,500 21,723 (5,777)
Total Revenues 953,500 941,014 (12,486)
ExpendituresGeneral management and support 1,273,776 1,179,667 (94,109)
Net Change in Fund Balance (320,276)$ (238,653) 81,623$
Fund BalanceBeginning of Year 601,694
End of Year 363,041$
(See independent auditor's report.)- 115 -

CITY OF EVANSTON, ILLINOIS
Capital Improvements FundSchedule of Revenues, Expenditures, and Changes in Fund Balance - Budget and Actual
For the Fiscal Year Ended December 31, 2019
Original and Final Budget Actual Variance
RevenuesIntergovernmental allotments 3,970,000$ 894,216$ (3,075,784)$ Charges for services - 84,261 84,261 Investment income - 448,753 448,753 Miscellaneous - 123,682 123,682
Total Revenues 3,970,000 1,550,912 (2,419,088)
ExpendituresGeneral management and support - 1,023,648 1,023,648 Public safety - 543,353 543,353 Public works 648,393 1,201,241 552,848 Capital outlay 13,612,156 8,017,042 (5,595,114) Debt Service
Fiscal agent fees - 93,276 93,276
Total Expenditures 14,260,549 10,878,560 (3,381,989)
Excess (Deficiency) of Revenues Over Expenditures (10,290,549) (9,327,648) 962,901
Other Financing Sources (Uses)Issuance of bonds 9,000,000 6,770,000 (2,230,000) Premium on issuance of bonds - 1,425,108 1,425,108 Transfers in 715,000 198,181 (516,819) Transfers (out) - (303,644) (303,644)
Total Other Financing Sources (Uses) 9,715,000 8,089,645 (1,625,355)
Net Change in Fund Balance (575,549)$ (1,238,003) (662,454)$
Fund BalancesBeginning of Year 13,898,249
End of Year 12,660,246$
(See independent auditor's report.)- 116 -

CITY OF EVANSTON, ILLINOIS
Special Assessment Capital Projects FundSchedule of Revenues, Expenditures, and Changes in Fund Balance - Budget and Actual
For the Fiscal Year Ended December 31, 2019
Original and Final Budget Actual Variance
RevenuesSpecial assessments 210,167$ 230,526$ 20,359$ Investment income 8,000 66,589 58,589
Total Revenues 218,167 297,115 78,948
ExpendituresCurrent
General management and support - 1,232 1,232 Capital outlay 650,000 1,477 (648,523) Debt Service
Principal - - - Interest - - - Fiscal agent fees - 3,060 3,060
Total Expenditures 650,000 5,769 (644,231)
Excess (Deficiency) of Revenues Over Expenditures (431,833) 291,346 723,179
Other Financing Sources (Uses)Issuance of bonds 250,000 250,000 - Premium on issuance of bonds - 52,626 52,626 Transfers (out) (286,955) (286,955) -
Other Financing Sources (Uses) - Net (36,955) 15,671 52,626
Net Change in Fund Balance (468,788)$ 307,017 775,805$
Fund BalanceBeginning of Year 2,620,789
End of Year 2,927,806$
(See independent auditor's report.)- 117 -

CITY OF EVANSTON, ILLINOIS
Debt Service FundsCombining Schedule of Revenues, Expenditures, and Changes in Fund Balances - Budget and Actual
For the Fiscal Year Ended December 31, 2019
Original Final OriginalBudget Budget Actual Budget
TaxesProperty taxes 225,000$ 225,000$ 603,848$ 221,000$ Investment income - - 10,673 500 Miscellaneous - - - -
Total Revenues 225,000 225,000 614,521 221,500
Housing and economic development - 1,067 1,067 221,500 Debt Service
Principal - - - - Interest - - - -
Total Expenditures - 1,067 1,067 221,500
Excess (Deficiency) of Revenues Over Expenditures 225,000 223,933 613,454 -
Issuance of loans - - - - Premium (discount) on bonds issued - - - - Transfers in (out)
General (5,000) (5,000) (5,000) - Other (95,610) (95,610) (95,610) -
Total Other Financing Sources (Uses) (100,610) (100,610) (100,610) -
Net Changes in Fund Balances 124,390$ 123,323$ 512,844 -$
Fund Balances Beginning of Year 173,909
End of Year 686,753$
Other Financing Sources (Uses)
Expenditures
Revenues
Increment DistrictChicago Main Tax Special Service Area
No. 6
- 118 -
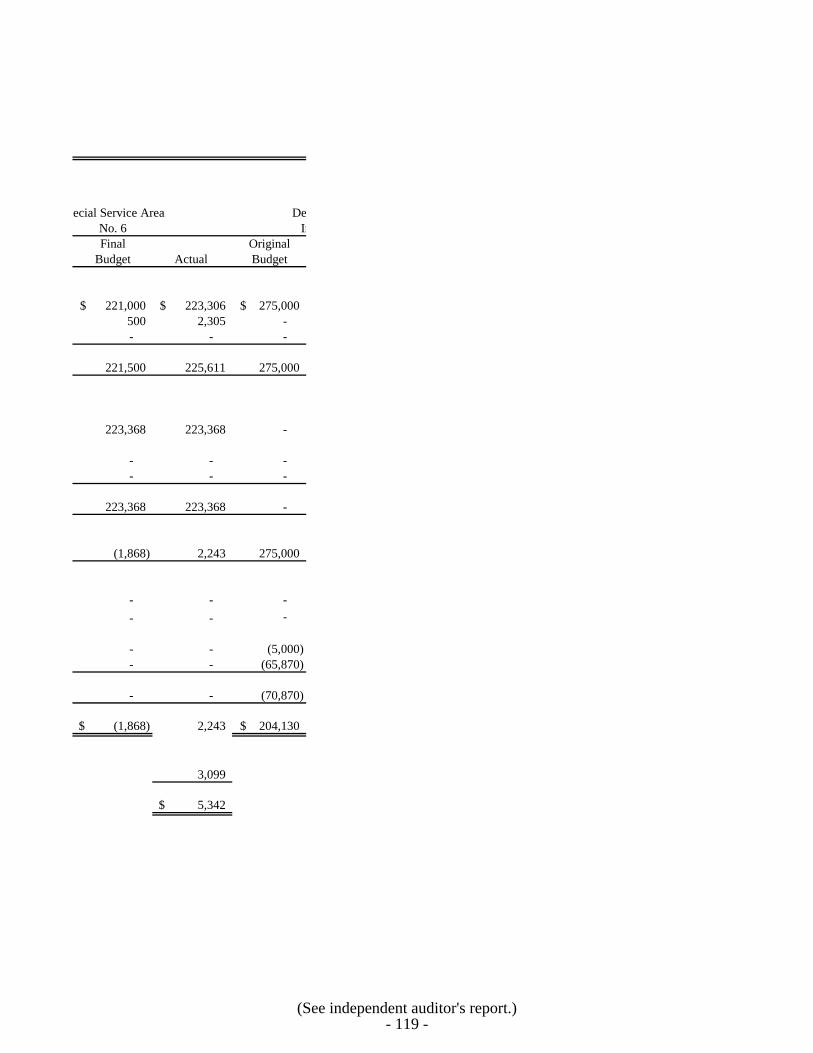
Final OriginalBudget Actual Budget
221,000$ 223,306$ 275,000$ 500 2,305 - - - -
221,500 225,611 275,000
223,368 223,368 -
- - - - - -
223,368 223,368 -
(1,868) 2,243 275,000
- - - - - -
- - (5,000) - - (65,870)
- - (70,870)
(1,868)$ 2,243 204,130$
3,099
5,342$
Special Service AreaNo. 6
Dempster-Dodge TaxIncrement District
(See independent auditor's report.)- 119 -

Final Original Final Original FinalBudget Actual Budget Budget Actual Budget Budget Actual
275,000$ 122,797$ 655,000$ 655,000$ 680,510$ 220,000$ 220,000$ 710,020$ - 2,095 400 400 39,159 4,000 4,000 11,794 - - - - 48,795 11,000 11,000 11,311
275,000 124,892 655,400 655,400 768,464 235,000 235,000 733,125
1,061 1,061 400,000 514,337 607,606 - 31 1,805
- - - - 48,812 600,000 600,000 600,000 - - - - 1,031 13,000 13,000 11,225
1,061 1,061 400,000 514,337 657,449 613,000 613,031 613,030
273,939 123,831 255,400 141,063 111,015 (378,000) (378,031) 120,095
- - - - - - - - - - - - - - - -
(5,000) (5,000) (60,000) (60,000) (60,000) (30,000) (30,000) (30,000) (65,870) (65,870) (286,225) (286,225) (143,112) - - -
(70,870) (70,870) (346,225) (346,225) (203,112) (30,000) (30,000) (30,000)
203,069$ 52,961 (90,825)$ (205,162)$ (92,097) (408,000)$ (408,031)$ 90,095
54,842 2,216,862 620,381
107,803$ 2,124,765$ 710,476$
West Evanston TaxIncrement District
Dempster-Dodge TaxIncrement District
Howard Ridge TaxIncrement District
- 120 -

Original and Final Budget Actual
1,596,000$ 2,340,481$ 4,900 66,026
11,000 60,106
1,611,900 2,466,613
739,864 834,907
600,000 648,812 13,000 12,256
1,352,864 1,495,975
259,036 970,638
- - - -
(100,000) (100,000) (447,705) (304,592)
(547,705) (404,592)
(288,669)$ 566,046
3,069,093
3,635,139$
Total
- 121 -

ENTERPRISE FUNDS
Water Fund - To account for all activity related to providing water to the City’s residents, as well as the
Village of Skokie and the Northwest Water Commission. All activities necessary to provide such services
are accounted for in this fund, including, but not limited to: administration, operation, maintenance, debt
service, and billing/collection.
Sewer Fund - To account for all activity related to providing sewer service to the City’s residents and
businesses. Activities necessary to provide such service include, but are not limited to: administration,
operations, financing, capital improvements/maintenance, and billing/collection.
Parking Fund - To account for all city-owned parking facilities/garages, lots, and metered spaces. Maple
Avenue and Sherman Plaza Garage activities have been included in this fund beginning in FY09-10. All
activities are accounted for including administration, operations, financing, and revenue collection.
Solid Waste Fund - To account for all activity related to refuse, recycling, and yard waste collection and
disposal. Activities necessary to provide such service include, but are not limited to: administration,
operations, and revenue collection.

CITY OF EVANSTON, ILLINOIS
Water FundSchedule of Revenues, Expenses, and Changes in Net Position - Budget and Actual
For the Fiscal Year Ended December 31, 2019
Original and Final Budget Actual
Operating RevenuesCharges for services 22,338,573$ 16,510,511$ Miscellaneous 511,116 1,277,850
Total Operating Revenues 22,849,689 17,788,361
Operating Expenses Excluding DepreciationAdministration 965,718 890,296 Operations
Pumping 2,519,537 2,384,647 Filtration 2,793,244 2,252,784 Distribution 34,862,829 2,883,846 Meter maintenance - 121 Other 1,634,529 853,187
Total Operating Expenses Excluding Depreciation 42,775,857 9,264,881
Operating Income (Loss) Before Depreciation (19,926,168) 8,523,480
Depreciation - 2,648,980
Operating Income (Loss) (19,926,168) 5,874,500
Non-Operating Revenue (Expenses)Investment income 40,000 189,122 Interest expense (2,081,841) (893,274) Gain (loss) on disposal of capital assets - (72,586) Issuance of bonds 2,810,000 - Issuance of loans 20,200,000 -
Total Non-Operating Revenues (Expenses) 20,968,159 (776,738)
Income Before Transfers 1,041,991 5,097,762
TransfersTransfers (out) (3,799,559) (3,799,559)
Total Transfers (3,799,559) (3,799,559)
Net Income (Loss) (2,757,568)$ 1,298,203
Net PositionBeginning of Year 69,160,056
End of Year 70,458,259$
(See independent auditor's report.)- 122 -

CITY OF EVANSTON, ILLINOIS
Water Fund - Operation and Maintenance AccountSchedule of Operating Revenues - Budget and Actual
For the Fiscal Year Ended December 31, 2019
Original and Final Budget Actual
Charges for Services, NetWater Sales
Evanston 8,688,573$ 8,439,964$ Skokie 5,500,000 1,579,064 Northwest Water Commission 6,250,000 5,416,394 Morton Grove Niles Water Commission 1,900,000 1,075,089
Total Charges for Services 22,338,573 16,510,511
MiscellaneousFees and outside work 56,956 54,915 Fees, merchandise, and other 454,160 1,222,935
Total Miscellaneous 511,116 1,277,850
Total Operating Revenues 22,849,689$ 17,788,361$
(See independent auditor's report.)- 123 -

INTERNAL SERVICE FUNDS
Equipment Replacement Fund - To account for the costs associated with the purchase of vehicles and
equipment.
Fleet Services Fund - To account for the cost of operating the municipal service center maintenance
facility for transportation vehicles/equipment used by city departments. Such costs are billed to the user
departments.
Insurance Fund - To account for all costs related to general liability and workers' compensation claims.
Health insurance premiums are also accounted for in this fund. This internal service fund uses “funding
premium” payments from city operating funds to pay claim and premium costs incurred.

CITY OF EVANSTON, ILLINOIS
Internal Service FundsCombining Statement of Net Position
December 31, 2019
EquipmentReplacement Fleet Services Insurance Total
Current AssetsCash and cash equivalents 653,962$ -$ 70,000$ 723,962$ Receivables - other - - - - Inventories - 1,392,594 - 1,392,594 Prepaid items 272,964 - 1,958,508 2,231,472 Due from other governments - - - - Due from other funds - - - -
Total Current Assets 926,926 1,392,594 2,028,508 4,348,028
Capital AssetsCapital assets being depreciated 24,932,463 617,552 - 25,550,015 Accumulated depreciation (17,787,832) (617,447) - (18,405,279)
Total Capital Assets 7,144,631 105 - 7,144,736
Total Assets 8,071,557 1,392,699 2,028,508 11,492,764
Deferred Outflows of ResourcesOPEB items - 14,067 - 14,067
Total Deferred Outflows of Resources - 14,067 - 14,067
Total Assets and Deferred Outflows of Resources 8,071,557 1,406,766 2,028,508 11,506,831
Liabilities and Deferred Inflows of ResourcesCurrent Liabilities
Vouchers payable 6,400 250,971 48,913 306,284 Due to other funds 15,576 834,664 6,118,935 6,969,175 Compensated absences payable - 17,371 5,442 22,813 Total OPEB liability - 4,423 - 4,423 Claims payable - - 1,391,550 1,391,550
Total Current Liabilities 21,976 1,107,429 7,564,840 8,694,245
Long-Term LiabilitiesCompensated absences payable - 69,484 21,766 91,250 Total OPEB liability - 108,891 - 108,891 Claims payable - - 6,035,000 6,035,000
Total Long-Term Liabilities - 178,375 6,056,766 6,235,141
Total Liabilities 21,976 1,285,804 13,621,606 14,929,386
Deferred Inflows of ResourcesOPEB items - 5,384 - 5,384
Total Deferred Inflows of Resources - 5,384 - 5,384
Total Liabilities and Deferred Inflows of Resources 21,976 1,291,188 13,621,606 14,934,770
Net Position (Deficit)Net investment in capital assets 7,144,631 105 - 7,144,736 Unrestricted (deficit) 904,950 115,473 (11,593,098) (10,572,675)
Total Net Position (Deficit) 8,049,581$ 115,578$ (11,593,098)$ (3,427,939)$
(See independent auditor's report.)- 124 -

CITY OF EVANSTON, ILLINOIS
Internal Service FundsCombining Statement of Revenues, Expenses, and Changes in Net Position
For the Fiscal Year Ended December 31, 2019
EquipmentReplacement Fleet Services Insurance Total
Operating RevenuesCharges for services
General Fund 1,272,608$ 2,137,305$ 4,251,601$ 7,661,514$ Sewer Fund - 192,213 282,082 474,295 Solid Waste - 322,362 - 322,362 Water Fund - 132,754 489,481 622,235 Motor Vehicle Parking System Fund 30,900 159,517 333,968 524,385 Library Fund 4,885 5,440 - 10,325 Emergency Telephone System - - 18,229 18,229 Community Development Block Grant 1,340 825 18,229 20,394 HOME - - 894 894
Claims reimbursements - - (25,626) (25,626) Health insurance contributions
Contributions from other funds - - 10,350,014 10,350,014 Employee contributions - - 2,968,983 2,968,983 Other contributions - 17,724 522,563 540,287
Miscellaneous - 45 - 45
Total Operating Revenues 1,309,733 2,968,185 19,210,418 23,488,336
Operating Expenses General support - 1,038,976 505,770 1,544,746 Major maintenance 36,082 2,009,838 - 2,045,920 General liability claims - - 6,762,650 6,762,650 Workers' compensation claims - - 1,090,170 1,090,170 Health insurance premiums - - 13,640,965 13,640,965
Total Operating Expenses 36,082 3,048,814 21,999,555 25,084,451
Operating Income (Loss) Before Depreciation 1,273,651 (80,629) (2,789,137) (1,596,115)
Depreciation 1,490,126 - - 1,490,126
Operating Income (Loss) (216,475) (80,629) (2,789,137) (3,086,241)
Non-Operating Revenue (Expenses)Investment income 3,104 - - 3,104 Gain (loss) on sale of property 31,618 - - 31,618
Total Non-Operating Revenues (Expenses) 34,722 - - 34,722
Income (Loss) Before Transfers (181,753) (80,629) (2,789,137) (3,051,519)
TransfersTransfers (out) - (35,114) (10,114) (45,228)
Total Transfers - (35,114) (10,114) (45,228)
Change in Net Position (181,753) (115,743) (2,799,251) (3,096,747)
Net Position (Deficit) - Beginning 8,231,334 231,321 (8,793,847) (331,192)
Net Position (Deficit) - Ending 8,049,581$ 115,578$ (11,593,098)$ (3,427,939)$
(See independent auditor's report.)- 125 -

CITY OF EVANSTON, ILLINOIS
Internal Service FundsCombining Statement of Cash Flows
For the Fiscal Year Ended December 31, 2019
EquipmentReplacement Fleet Services Insurance Total
Cash Flows from Operating ActivitiesReceipts from customers and users -$ 45$ 2,943,357$ 2,943,402$ Receipts from/(payments for) interfund services provided 1,459,340 3,175,702 17,499,015 22,134,057 Receipts from other agencies - 17,724 522,563 540,287 Payments to suppliers (234,437) (2,107,429) (505,770) (2,847,636) Payments to employees - (1,051,898) (6,763,391) (7,815,289) Payments for insurance premiums - - (13,685,660) (13,685,660)
Net Cash from Operating Activities 1,224,903 34,144 10,114 1,269,161
Cash Flows from Noncapital Financing ActivitiesInterfund transfers - (35,114) (10,114) (45,228)
Net Cash from Noncapital Financing Activities - (35,114) (10,114) (45,228)
Cash Flows from Capital and Related Financing ActivitiesSale of capital assets 31,618 - - 31,618 Acquisition and construction of capital assets (1,414,720) - - (1,414,720)
Net Cash from Capital and Related Financing Activities (1,383,102) - - (1,383,102)
Cash Flows from Investing ActivitiesInterest income 3,104 - - 3,104
Net Cash from Investing Activities 3,104 - - 3,104
Net Increase (Decrease) in Cash and Cash Equivalents (155,095) (970) - (156,065)
Cash and EquivalentsBeginning 809,057 970 70,000 880,027
Ending 653,962$ -$ 70,000$ 723,962$
Reconciliation of Operating Income (Loss) to Net Cash from Operating Activities
Operating Income (loss) (216,475)$ (80,629)$ (2,789,137)$ (3,086,241)$ Adjustments to reconcile operating income (loss) to net cash from operating activities
Depreciation 1,490,126 - - 1,490,126 Changes in assets and liabilities
Increase/decrease in accounts receivable miscellaneous - - - - Interfund receivable 134,031 - - 134,031 Prepaid expenses (95,655) - (1,592,159) (1,687,814) Inventories - (144,965) - (144,965) Compensated absences - (13,562) (741) (14,303) OPEB items - 640 - 640 Vouchers payable (102,700) 47,374 (131,316) (186,642) Interfund payable 15,576 225,286 1,754,517 1,995,379 Claims payable - - 2,768,950 2,768,950
Net Cash from Operating Activities 1,224,903$ 34,144$ 10,114$ 1,269,161$
(See independent auditor's report.)- 126 -

COMPONENT UNIT - PUBLIC LIBRARY

CITY OF EVANSTON LIBRARY COMPONENT UNIT
EVANSTON, ILLINOIS
Combining Balance Sheet/Statement of Net Position
December 31, 2019
CapitalOperating Endowment Improvement
AssetsCash and investments 2,212,227$ 4,447,514$ 1,052,520$ Property taxes receivable 7,252,000 - - Other receivables 95 - - Due from primary government - - 324,908 Due from other funds - - 1,055 Net pension asset - IMRF - - - Capital assets not being depreciated - - - Capital assets net of accumulated depreciation - - -
Total Assets 9,464,322 4,447,514 1,378,483
Deferred Outflows of ResourcesPension items - IMRF - - - OPEB items - - -
Total Deferred Outflows of Resources - - -
Total Assets and Deferred Outflows of Resources 9,464,322$ 4,447,514$ 1,378,483$
Liabilities, Deferred Inflows of Resources, and Fund Balance/Net Position
Current LiabilitiesAccounts payable 141,623$ -$ -$ Accrued interest - - - Due to primary government - - - Due to other funds 1,055 - -
Total Current Liabilities 142,678 - -
Noncurrent LiabilitiesDue within one year - - - Due in more than one year - - -
Total Noncurrent Liabilities - - -
Total Liabilities 142,678 - -
Deferred Inflows of ResourcesPension items - IMRF - - - OPEB items - - - Unavailable property taxes 7,252,000 - -
Total Deferred Inflows of Resources 7,252,000 - -
Total Liabilities and Deferred Inflows of Resources 7,394,678 - -
Fund Balances/Net PositionNet investment in capital assets - - - Restricted for debt service - - - Restricted for capital improvements - - 1,378,483 Restricted for endowment - 4,447,514 - Unassigned/unrestricted 2,069,644 - -
Total Fund Balances/Net Position 2,069,644 4,447,514 1,378,483
Total Liabilities, Deferred Inflows, and Fund Balances/Net Position 9,464,322$ 4,447,514$ 1,378,483$
- 127 -

Statement ofDebt Service Total Adjustments Net Position
1,144$ 7,713,405$ -$ 7,713,405$ 480,145 7,732,145 - 7,732,145
- 95 - 95 - 324,908 - 324,908 - 1,055 (1,055) - - - - - - - 311,380 311,380 - - 11,927,654 11,927,654
481,289 15,771,608 12,237,979 28,009,587
- - 2,389,078 2,389,078 - - 39,483 39,483
- - 2,428,561 2,428,561
481,289$ 15,771,608$ 14,666,540$ 30,438,148$
-$ 141,623$ -$ 141,623$ - - 21,458 21,458 - - - - - 1,055 (1,055) -
- 142,678 20,403 163,081
- - 302,009 302,009 - - 9,696,903 9,696,903
- - 9,998,912 9,998,912
- 142,678 10,019,315 10,161,993
- - 514,884 514,884 - - 15,757 15,757
480,145 7,732,145 - 7,732,145
480,145 7,732,145 530,641 8,262,786
480,145 7,874,823 10,549,956 18,424,779
- - 5,572,371 5,572,371 1,144 1,144 - 1,144
- 1,378,483 (409,934) 968,549 - 4,447,514 - 4,447,514 - 2,069,644 (1,045,853) 1,023,791
1,144 7,896,785 4,116,584 12,013,369
481,289$ 15,771,608$ 14,666,540$ 30,438,148$
(See independent auditor's report.)- 128 -

CITY OF EVANSTON LIBRARY COMPONENT UNIT
EVANSTON, ILLINOIS
Combining Statement of Revenues, Expenditures, and Changes in Fund Balances/Statement of ActivitiesGovernmental Fund
For Fiscal Year Ended December 31, 2019
CapitalOperating Endowment Improvement
RevenuesProperty taxes 6,739,362$ -$ -$ Intergovernmental
Grant revenue 204,769 - - Charges for services 70,959 - - Fines and forfeits 84,204 - - Other
Investment income 108,900 873,903 - Donations 383,085 - - Miscellaneous 169,706 - -
Total Revenues 7,760,985 873,903 -
ExpendituresCurrent
Community services 7,389,495 - - Capital Outlay - - 1,788,877 Debt Service
Payment Primary Government - - - Principal - - - Interest and fiscal charges - - 22,463
Total Expenditures 7,389,495 - 1,811,340
Excess (Deficiency) or Revenues Over Expenditures 371,490 873,903 (1,811,340)
Other Financing Sources (Uses)Issuance of bonds - - 1,835,000 Premium on bond issuances - - 386,274 Transfer in 195,000 - - Transfer (out) - (195,000) -
Total Other Financing Sources (Uses) 195,000 (195,000) 2,221,274
Change in Fund Balance/Net Position 566,490 678,903 409,934
Fund Balances/Net PositionBeginning of Year 1,503,154 3,768,611 968,549
Prior period adjustment - - -
Beginning of Year, Restated 1,503,154 3,768,611 968,549
End of Year 2,069,644$ 4,447,514$ 1,378,483$
- 129 -

Statement ofDebt Service Total Adjustments Activities
350,000$ 7,089,362$ -$ 7,089,362$
- 204,769 - 204,769 - 70,959 - 70,959 - 84,204 - 84,204
- 982,803 - 982,803 - 383,085 - 383,085 - 169,706 - 169,706
350,000 8,984,888 - 8,984,888
- 7,389,495 1,765,916 9,155,411 - 1,788,877 (1,788,877) -
- - - - 182,561 182,561 (182,561) - 170,877 193,340 (17,367) 175,973
353,438 9,554,273 (222,889) 9,331,384
(3,438) (569,385) 222,889 (346,496)
- 1,835,000 (1,835,000) - - 386,274 (386,274) - - 195,000 (195,000) - - (195,000) 195,000 -
- 2,221,274 (2,221,274) -
(3,438) 1,651,889 (1,998,385) (346,496)
4,582 6,244,896 6,362,541 12,607,437
- - (247,572) (247,572)
4,582 6,244,896 6,114,969 12,359,865
1,144$ 7,896,785$ 4,116,584$ 12,013,369$
(See independent auditor's report.)- 130 -

CITY OF EVANSTON LIBRARY COMPONENT UNIT
EVANSTON, ILLINOIS
Library Operating FundSchedule of Revenues, Expenditures, and Changes in Fund Balances - Budget and Actual
For the Fiscal Year Ended December 31, 2019
Original and Final Budget Actual Variance
TaxesProperty taxes 6,810,000$ 6,739,362$ (70,638)$ Intergovernmental
Grant revenue 223,000 204,769 (18,231) Charges for services 88,000 70,959 (17,041) Fines and forfeits 85,000 84,204 (796) Other
Investment income 10,000 108,900 98,900 Donations 383,500 383,085 (415) Miscellaneous 150,000 169,706 19,706
Total Revenues 7,749,500 7,760,985 11,485
General management and support 7,771,945 7,389,495 (382,450)
Total Expenditures 7,771,945 7,389,495 (382,450)
Excess (Deficiency) of Revenues Over Expenditures (22,445) 371,490 393,935
Transfers in 195,771 195,000 (771)
Total Other Financing Sources (Uses) 195,771 195,000 (771)
Net Changes in Fund Balances 173,326$ 566,490 393,164$
Fund Balances Beginning of Year 1,503,154
End of Year 2,069,644$
Revenues
Expenditures
Other Financing Sources (Uses)
(See independent auditor's report.)- 131 -

SUPPLEMENTAL DATA

CITY OF EVANSTON, ILLINOIS
ILLINOIS GRANT ACCOUNTABILITY AND TRANSPARENCY ACTCONSOLIDATED YEAR END FINANCIAL REPORT
For the Fiscal Year Ended December 31, 2019
CSFA Program
Number Name State Federal Other Total
422-11-0970 Open Space Land Acquisition & Development 160,000$ -$ -$ 160,000$
422-50-1655 Historic Preservation Fund Grants-In-Aid 7,000 - 4,115 11,115
444-26-1565 Tobacco Enforcement Program - 3,410 - 3,410
478-00-0251 Medical Assistance Program 148 - - 148
482-00-0258 Environmental Health Beach Grant - 14,857 - 14,857
482-00-0263 Public Health Emergency Preparedness - 62,054 - 62,054
482-00-0265 Cities Readiness Initiative Cooperative Agreement - 43,571 - 43,571
482-00-0277 VFC Compliance - - - -
482-00-0894 EMS Assistance Fund Grant 2,056 38,116 - 40,172
482-00-0901 Local Health Protection Grant 106,221 - - 106,221
482-00-0902 Tanning Program - - - -
482-00-0903 Body Art Establishment Inspection Grant Program - - - -
482-00-0904 Vector Surveillance and Control Grants 10,000 - - 10,000
482-00-0911 Illinois Tobacco-Free Communities 31,250 - - 31,250
482-00-1578 Body Art and Tanning Inspection Program 100 - - 100
482-00-1583 Lead Poisoning Prevention and Response 32,900 - - 32,900
493-60-1652 NG9-1-1 Expenses Grant Program - - - -
494-00-1002 Safe Routes to School Program - - - -
494-00-1003 Congestion Mitigation and Air Quality Improvement Program - - - -
494-00-1005 Local Federal Bridge Program - - - -
494-00-1488 Motor Fuel Tax Program 1,857,807 - - 1,857,807
494-10-0343 State and Community Highway Safety/ National Priority Safety Program - 101,772 - 101,772
494-42-0495 Local Surface Transportation Program - - - -
503-00-0360 Promotion of the Arts - Partnership Agreements 30,200 - - 30,200
586-18-0409 Child Care & Adult Care Program - 62,409 - 62,409
586-18-0410 Summer Food Service Program for Children - 149,333 - 149,333
588-40-0450 Emergency Management Performance Grants - - - -
Other Grants Programs and Activities - 2,990,496 148,741 3,139,237
All other costs not allocated - - 157,300,900 157,300,900
TOTALS 2,237,682$ 3,466,018$ 157,453,756$ 163,157,456$
(See independent auditor's report.)- 132 -

STATISTICAL SECTION
This part of the City of Evanston, Illinois’ comprehensive annual financial report presents
detailed information as a context for understanding what the information in the financial
statements, note disclosures, and required supplementary information displays about the City’s
overall financial health.
Contents Page(s)
Financial Trends
These schedules contain trend information to help the reader understand
how the City’s financial performance and well-being have been changed
over time.
131-140
Revenue Capacity
These schedules contain information to help the reader assess the City’s
most significant local revenue source, the property tax.
141-143
Debt Capacity
These schedules present information to help the reader assess the
affordability of the City’s current levels of outstanding debt and the City’s
ability to issue additional debt in the future.
144-148
Demographic and Economic Information
These schedules offer demographic and economic indicators to help the
reader understand the environment within which the City’s financial
activities take place.
149-150
Operating Information
These schedules contain service and infrastructure data to help the reader
understand how the information in the City’s financial report relates to the
services the City provides and the activities it performs.
151-156
Sources: Unless otherwise noted, the information in these schedules is derived from the
comprehensive annual financial reports for the relevant year.

CITY OF EVANSTON, ILLINOIS
Net Position by Component
Last Ten Fiscal Years(accrual basis of accounting)(amounts expressed in thousands)
2011 2011* 2012 2013 2014
Governmental ActivitiesNet investment in capital assets 49,483$ 57,663$ 60,105$ 47,214$ 46,633$ Restricted 23,187 31,559 31,754 24,720 25,446 Unrestricted 4,072 (24,033) (23,729) (13,846) (11,436)
Total Governmental Activities Net Position 76,742$ 65,189$ 68,130$ 58,088$ 60,643$
Business-Type ActivitiesNet investment in capital assets 207,162$ 215,755$ 228,738$ 239,243$ 246,382$ Restricted 1,624 1,034 710 712 649 Unrestricted 19,141 25,385 26,363 25,484 23,563
Total Business-Type Activities Net Position 227,927$ 242,174$ 255,811$ 265,439$ 270,594$
Primary GovernmentNet investment in capital assets 256,645$ 273,418$ 288,843$ 286,457$ 293,015$ Restricted 24,811 32,593 32,464 25,432 26,095 Unrestricted 23,213 1,352 2,634 11,638 12,127
Total Primary Government Net Position 304,669$ 307,363$ 323,941$ 323,527$ 331,237$
* The City changed its fiscal year end to December 31, 2011.** The City implemented GASB Statement No. 68 which resulted in a decrease in unrestricted net position.*** The City implemented GASB Statement No. 75 which resulted in a decrease in unrestricted net position.
Source: City Finance Division
- 133 -

2015** 2016 2017 2018*** 2019
47,953$ 51,588$ 51,575$ 52,536$ 53,784$ 16,409 18,523 11,990 8,708 15,554
(136,007) (170,270) (164,614) (194,435) (181,451)
(71,645)$ (100,159)$ (101,049)$ (133,191)$ (112,113)$
255,622$ 268,851$ 278,446$ 283,981$ 289,023$ - - - - -
22,785 18,928 14,249 11,896 9,883
278,407$ 287,779$ 292,695$ 295,877$ 298,906$
303,575$ 320,439$ 330,021$ 336,517$ 342,807$ 16,409 18,523 11,990 8,708 15,554
(113,222) (151,342) (150,365) (182,539) (171,568)
206,762$ 187,620$ 191,646$ 162,686$ 186,793$
- 134 -

CITY OF EVANSTON, ILLINOIS
Changes in Net Position
Last Ten Fiscal Years(amounts expressed in thousands)
2011 2011* 2012 2013 2014
ExpensesGovernmental Activities
General management and support 17,517$ 17,911$ 22,508$ 18,892$ 13,811$ Public safety 53,226 43,465 52,740 57,090 58,795 Public works 15,626 12,399 11,099 13,782 25,825 Health and human resource development 4,541 3,547 3,200 3,601 3,837 Recreational and cultural opportunities 20,142 15,607 17,438 16,433 9,358 Housing and economic development 10,857 11,630 19,101 11,123 12,443 Interest 5,595 3,114 1,786 377 3,919
Total Governmental Activities Expenses 127,504 107,673 127,872 121,298 127,988
Business-Type ActivitiesWater 8,713 7,450 10,172 11,193 11,977 Sewer 8,784 7,083 7,872 7,649 7,293 Solid waste - 4,317 4,612 4,732 4,856 Motor vehicle parking system 8,425 6,673 8,297 8,369 7,856
Total Business-Type Activities Expenses 25,922 25,523 30,953 31,943 31,982
Total Primary Government Expenses 153,426$ 133,196$ 158,825$ 153,241$ 159,970$
Program RevenuesGovernmental Activities
Charges for servicesGeneral management and support 12,796$ 9,219$ 9,478$ 8,917$ 9,374$ Culture and recreation 5,265 4,587 9,934 5,236 5,360 Other activities 9,377 8,523 11,349 12,179 15,253
Operating grants and contributions 9,851 9,861 13,453 10,102 7,151 Capital grants and contributions 8,026 3,941 2,017 2,956 501
Total Governmental Activities Program Revenues 45,315 36,131 46,231 39,390 37,639
Business-Type ActivitiesCharges for services
Water 13,738 12,369 14,967 14,658 15,052 Sewer 13,393 11,377 14,115 13,510 12,785 Solid waste - 2,900 3,490 3,651 3,971 Motor vehicle parking system 5,987 4,928 6,663 6,255 6,080
Operating grants and contributions - - 395 939 15 Total Business-Type Activities Program Revenues 33,118 31,574 39,630 39,013 37,903
Total Primary Government Program Revenues 78,433$ 67,705$ 85,861$ 78,403$ 75,542$
- 135 -

2015 2016 2017 2018 2019
12,493$ 18,163$ 20,890$ 20,016$ 19,444$ 57,443 55,625 61,191 80,789 56,755 20,011 13,668 24,793 22,718 26,584
2,911 3,319 3,354 3,455 2,895 14,794 14,380 14,744 14,061 11,081 10,532 21,063 7,023 9,129 6,907
3,757 3,779 3,354 4,683 5,454 121,941 129,997 135,349 154,851 129,120
10,748 11,450 12,239 12,964 12,880 6,608 6,683 6,540 6,735 6,492 5,150 4,967 4,907 4,852 5,079 7,862 8,532 8,575 9,321 9,585
30,368 31,632 32,261 33,872 34,036
152,309$ 161,629$ 167,610$ 188,723$ 163,156$
8,629$ 10,094$ 8,145$ 8,985$ 8,768$ 5,572 5,560 5,669 6,037 6,119
11,268 15,739 12,712 11,945 10,917 5,535 6,809 5,931 5,244 5,775
275 368 325 125 8,630 31,279 38,570 32,782 32,336 40,209
15,722 16,419 17,588 15,642 17,789 12,511 13,049 12,478 11,920 10,780
4,004 4,031 4,061 4,083 4,668 6,164 6,688 6,530 6,621 10,640
- 38,400 - - - 38,401 78,587 40,657 38,266 43,877
69,680$ 117,157$ 73,439$ 70,602$ 84,086$
- 136 -

CITY OF EVANSTON, ILLINOIS
Changes in Net Position
Last Ten Fiscal Years(amounts expressed in thousands)
2011 2011* 2012 2013 2014
Net (Expense)/RevenueGovernmental Activities (82,189)$ (71,542)$ (81,641)$ (81,908)$ (90,349)$ Business-Type Activities 7,196 6,051 8,677 7,070 5,921
Total Primary Government Net Expense (74,993)$ (65,491)$ (72,964)$ (74,838)$ (84,428)$
General Revenues and Other Changes in Net Position
Governmental ActivitiesTaxes
Property taxes 47,040$ 33,399$ 47,874$ 46,349$ 48,579$ Sales taxes 15,577 13,495 15,888 16,965 17,362
Investment earnings 557 32 398 79 (258) Miscellaneous 27,501 21,244 25,348 27,369 26,612 Transfers (99) (8,180) (4,926) (2,586) 610
Total Governmental Activities 90,576 59,990 84,582 88,176 92,905
Business-Type ActivitiesProperty taxes - - - - - Investment earnings 23 16 34 33 (156) Gains on sale of capital assets - - - - - Miscellaneous - - - (61) - Transfers 99 8,180 4,926 2,586 (610)
Total Business-Type Activities 122 8,196 4,960 2,558 (766)
Changes in Net PositionGovernmental Activities 8,387 (11,552) 2,941 6,268 2,556 Business-Type Activities 7,318 14,247 13,637 9,628 5,155
Total Primary Government 15,705$ 2,695$ 16,578$ 15,896$ 7,711$
* The City changed its fiscal year end to December 31, 2011.
Source: City Finance Division
- 137 -
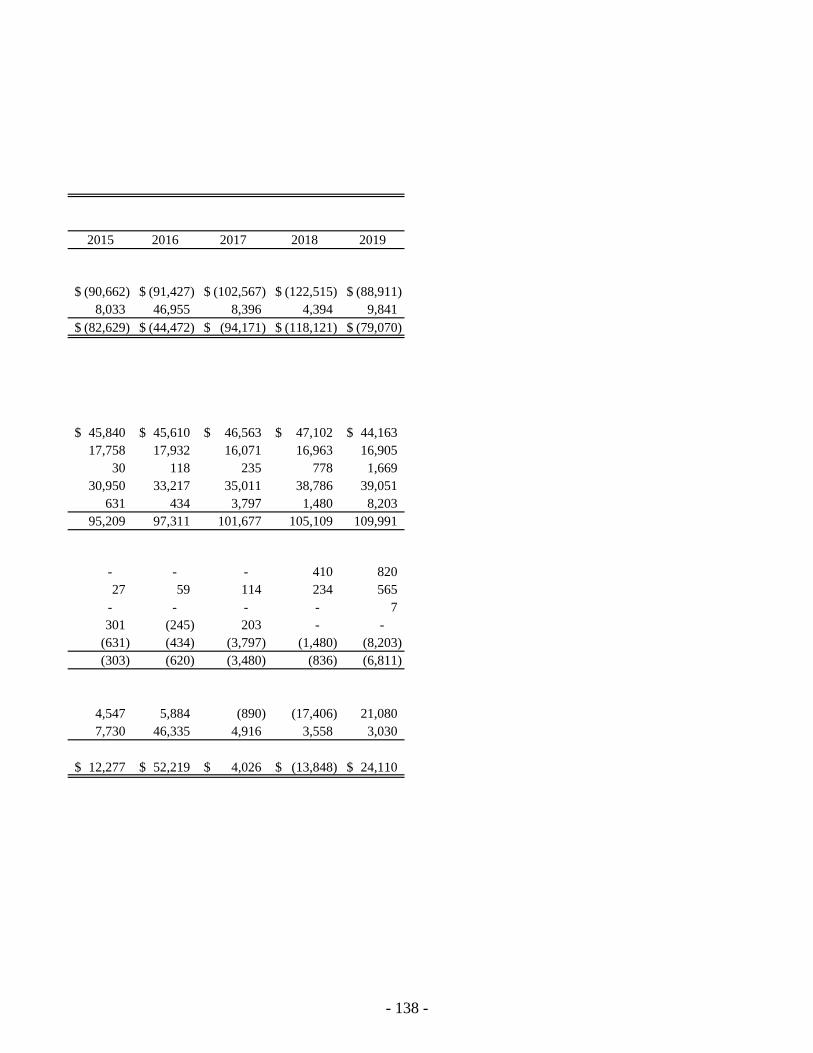
2015 2016 2017 2018 2019
(90,662)$ (91,427)$ (102,567)$ (122,515)$ (88,911)$ 8,033 46,955 8,396 4,394 9,841
(82,629)$ (44,472)$ (94,171)$ (118,121)$ (79,070)$
45,840$ 45,610$ 46,563$ 47,102$ 44,163$ 17,758 17,932 16,071 16,963 16,905
30 118 235 778 1,669 30,950 33,217 35,011 38,786 39,051
631 434 3,797 1,480 8,203 95,209 97,311 101,677 105,109 109,991
- - - 410 820 27 59 114 234 565
- - - - 7 301 (245) 203 - -
(631) (434) (3,797) (1,480) (8,203) (303) (620) (3,480) (836) (6,811)
4,547 5,884 (890) (17,406) 21,080 7,730 46,335 4,916 3,558 3,030
12,277$ 52,219$ 4,026$ (13,848)$ 24,110$
- 138 -

CITY OF EVANSTON, ILLINOIS
Fund Balances, Governmental Funds
Last Ten Fiscal Years(amounts expressed in thousands)
2011 2011* 2012 2013 2014
General FundNonspendable -$ -$ -$ -$ -$ Reserved/Restricted 1,995 - - - - Unreserved/Restricted 20,009 - - - - Assigned - 7,590 6,848 6,362 5,347 Unassigned - 10,803 10,186 10,001 9,636
Total General Fund 22,004$ 18,393$ 17,034$ 16,363$ 14,983$
All Other Governmental FundsReserved 28,738$ -$ -$ -$ -$ Unreserved, reported in Special Revenue Funds 10,907 - - - - Capital Projects Funds 9,665 - - - - Nonspendable - 1,419 - 407 1,430 Restricted - 32,353 32,431 25,359 26,003 Committed - 806 2,150 3,507 3,540 Assigned - 10,074 5,307 8,372 10,467 Unassigned - (175) 1,105 (149) (153)
Total All Other Governmental Funds 49,310$ 44,477$ 40,993$ 37,496$ 41,287$
* The City changed its fiscal year end to December 31, 2011.
Notes:1. Fund balances for debt service have been included in the reserved amounts.2. Starting fiscal year ending December 31, 2011, financials are presented per the new reporting standards of GASB 54.
Source: City Finance Division
- 139 -

2015 2016 2017 2018 2019
118$ -$ 300$ 310$ 415$ - - - - - - - - - -
5,672 5,046 4,180 4,303 4,330 4,914 6,622 8,868 9,242 11,145
10,586$ 11,668$ 13,348$ 13,855$ 15,890$
-$ -$ -$ -$ -$
- - - - - - - - - -
2,158 - - - - 16,409 18,523 11,418 25,651 15,933
2,556 2,996 - - - 5,517 7,668 12,301 17,065 20,306 (221) (252) (204) (227) (226)
26,419$ 28,935$ 23,515$ 42,489$ 36,013$
- 140 -

CITY OF EVANSTON, ILLINOIS
Changes in Fund Balances, Governmental Funds
Last Ten Fiscal Years(amounts expressed in thousands)
2011 2011* 2012 2013 2014 2015
RevenuesTaxes 73,559$ 56,466$ 79,331$ 78,254$ 77,933$ 75,747$ Licenses, fees, and permits 8,661 6,776 10,470 10,617 14,503 12,184 Special assessments 429 235 293 275 167 8,312 Intergovernmental 26,456 23,183 29,252 27,844 24,300 3,554 Charges for services 9,786 6,283 7,763 7,723 7,793 23,834 Fines and penalties 4,003 3,280 3,470 3,449 3,358 148 Investment earnings 555 22 397 94 89 30 Other revenues 6,390 4,133 2,915 1,906 1,791 1,722
Total Revenues 129,839 100,378 133,891 130,162 129,934 125,531
ExpendituresGeneral management and support 23,463 13,594 18,532 17,611 13,314 13,444 Public safety 50,352 42,140 54,611 56,431 59,425 59,654 Public works 14,053 7,574 9,380 11,982 19,821 19,815 Health and human development 4,541 3,588 3,200 3,601 3,837 3,141 Recreation and cultural opportunities 17,399 16,192 14,309 14,775 10,524 11,087 Housing and economic development 11,345 11,999 19,095 11,305 9,348 13,292 Capital outlay 7,112 5,832 8,523 5,948 6,286 9,151 Debt service
Principal 7,650 10,106 13,055 34,259 10,040 20,833 Interest 4,878 4,384 5,175 4,996 4,411 4,413 Fiscal agent fees 12 79 76 127 43 16
Total Governmental Activities Expenditure 140,805 115,488 145,956 161,035 137,049 154,846
Net (Expense)/Revenue Governmental Activities (10,966) (15,110) (12,065) (30,873) (7,115) (29,315)
Other Financing Sources (Uses)Proceeds from borrowing 13,393$ 15,420$ 12,618$ 34,982$ 9,989$ 22,377$ Capitalized interest income 120 - - - - - Transfers in 5,727 5,839 9,271 8,182 9,202 10,308 Transfers (out) (6,184) (14,593) (14,668) (11,879) (9,665) (9,315)
Total Other Financing Sources (Uses) 13,056 6,666 7,221 31,285 9,526 23,370
Net Changes in Fund Balance 2,090$ (8,444)$ (4,844)$ 412$ 2,411$ (5,945)$
Debt Service as a Percentage of Noncapital Expenditures 9.36% 13.29% 13.26% 25.31% 11.05% 17.62%
* The City changed its fiscal year end to December 31, 2011.
Source: City Finance Division
- 141 -

2016 2017 2018 2019
76,047$ 78,157$ 81,281$ 78,645$ 17,933 13,358 11,664 10,012
169 260 199 230 24,886 22,627 23,004 25,278
8,791 8,713 10,053 8,925 3,612 3,468 3,765 5,108
118 235 778 1,669 3,892 3,843 5,220 12,130
135,448 130,661 135,964 141,997
17,064 18,152 18,330 19,206 62,252 64,347 65,533 65,821 13,477 14,041 22,069 15,848
3,021 3,111 3,142 2,989 11,894 12,371 12,789 12,247 10,477 7,225 9,006 6,567
9,953 14,953 11,399 39,796
19,661 24,253 17,557 10,166 4,276 4,040 4,536 5,749
14 2 537 274 152,089 162,495 164,898 178,663
(16,641) (31,834) (28,934) (36,666)
19,652$ 26,558$ 46,892$ 23,976$ - - - -
16,011 17,428 20,698 14,405 (15,542) (15,893) (19,174) (6,156) 20,121 28,093 48,416 32,225
3,480$ (3,741)$ 19,482$ (4,441)$
16.84% 19.18% 14.39% 11.46%
- 142 -

CITY OF EVANSTON, ILLINOIS
Equalized Assessed Value and Actual Value of Taxable Property
Last Ten Levy Years
Levy Total Total Total Year Residential Farm Commercial Industrial Railroad Equalized Actual Tax
Ended Property Property Property Property Property Assessed Value Value Rate
2009 2,564,394,619$ 15,956$ 615,808,511$ 125,104,411$ 665,872$ 3,305,989,369$ 9,917,968,107$ 1.204 2010 2,233,194,054 15,956 623,156,869 184,687,438 829,769 3,041,884,086 9,125,652,258 1.364 2011 2,100,690,657 15,956 513,880,731 111,899,205 881,024 2,727,367,573 8,182,102,719 1.591 2012 1,944,932,067 15,956 462,671,239 106,007,084 995,206 2,514,621,552 7,543,864,656 1.551 2013 1,653,524,481 15,956 452,108,891 94,820,879 1,226,831 2,201,697,038 6,605,091,114 1.760 2014 1,792,383,435 15,467 416,165,953 34,726,327 1,278,793 2,244,569,975 6,733,709,925 1.856 2015 1,751,252,888 15,467 410,670,248 32,549,681 1,533,241 2,196,021,525 6,588,064,575 1.766 2016 2,151,672,082 15,467 483,830,858 33,333,491 1,559,871 2,670,411,769 8,011,235,307 1.762 2017 2,178,182,897 15,467 527,589,667 32,680,857 1,591,232 2,740,060,120 8,220,180,360 1.501 2018 2,150,065,734 15,467 537,739,734 31,050,996 1,708,983 2,720,580,914 8,161,742,742 1.604
Note: Property is reassessed once every three years. Equalized Assessed value is approximately 1/3 of actual value. Tax rates are per $100 of equalizedassessed value.
- 143 -

CITY OF EVANSTON, ILLINOIS
Principal Property Taxpayers
Current Year and Nine Years Ago
2018 Levy 2009 LevyPercentage Percentage
Total of Total City Total of Total CityEqualized Assessed Taxable Equalized Assessed Taxable
Tax Payer Value (EAV) Rank EAV Tax Payer Value (EAV) Rank EAV Orrington TT LLC Golub 27,343,999$ 1 1.01% Church Street Plaza 38,719,188$ 1 1.32%Rotary International 20,205,663 2 0.74% Rotary International 26,605,707 2 0.91%McCaffery Interests 19,976,628 3 0.73% Grubb & Ellis 24,020,467 3 0.82%FSP 909 Davis Street 18,635,861 4 0.68% Omni Orrington Hotel 17,153,477 4 0.58%MB Sherman Highlands 13,073,091 5 0.48% Inland 16,184,339 5 0.55%Evanston LLC 12,644,289 6 0.46% Church & Chicago Ltd Prtn 15,851,793 6 0.54%FDS/ David Alperstein 12,190,066 7 0.45% Evanston Hotel Assoc. 13,665,739 7 0.47%Azurri of Evanston Inc. 12,121,567 8 0.45% NNN Church Street Office Center 13,198,415 8 0.45%MHF Evanston V LLC 11,293,605 9 0.42% Albertson's (Jewel & Osco) 11,742,809 9 0.40%500 Davis Owner LLC 10,183,359 10 0.37% Sanir Cumberland Center 11,601,647 10 0.39%
157,668,128$ 5.80% Total 188,743,581$ 6.42%
Total EAV 2,720,580,914$ Total EAV 2,938,397,892$
Source: Cook County
- 144 -

CITY OF EVANSTON, ILLINOIS
Property Tax Levies and Collections
Last Ten Levy Years
Tax Taxes Levied Collected Receipts Collections Total Collected to DateLevy for the Percentage in Subsequent Percentage Year Fiscal Year Amount of Levy Years Amount of Levy
2009 39,779,364$ 38,018,159$ 95.57% 464,506$ 38,482,665$ 96.74%2010 41,479,398 39,412,004 95.02% 764,463 40,176,467 96.86%2011 43,397,590 42,064,756 96.93% 348,189 42,412,945 97.73%2012 43,330,121 41,776,375 96.41% 559,130 42,335,505 97.70%2013 43,869,798 42,762,685 97.48% 338,420 43,101,105 98.25%2014 45,557,079 44,280,493 97.20% 270,619 44,551,112 97.79%2015 46,394,914 44,974,845 96.94% 205,607 45,180,452 97.38%2016 47,538,529 46,723,672 98.29% 97,249 46,820,921 98.49%2017 48,161,247 46,866,198 97.31% 197,415 47,063,613 97.72%2018 49,712,625 49,032,839 98.63% 217,133 49,249,972 99.07%2019 55,139,563 See Note See Note See Note See Note See Note
Note: Levy Year 2019 is collected through December 31, 2020
Source: City Finance Division
- 145 -

CITY OF EVANSTON, ILLINOIS
Ratio of General Bonded Debt Outstanding
Last Ten Fiscal Years
(2) NetGross (3) Net Net General
(1) General Debt Debt Net Debt to Debt to ObligationFiscal Equalized Obligation Service Payable General Total Equalized Total BondedYear Assessed Bonded Monies From Other Obligation Personal Assessed Personal Debt
Ended Population Valuation Debt Available Revenues Debt Income Valuation Income Per Capita
2010 74,486 3,305,989,369$ 153,535,000$ 5,309,064$ 50,097,260$ 98,128,676$ 3,157,759,484$ 4.64% 4.86% 1,317.41 2011* 74,486 3,041,884,087 157,695,000 2,629,020 47,111,060 107,954,920 3,197,311,550 5.18% 4.93% 1,449.33 2012 74,486 2,727,367,573 154,159,999 16,085,747 44,899,176 93,175,076 3,176,902,386 5.65% 4.85% 1,250.91 2013 74,619 2,514,621,552 147,942,869 12,520,761 40,042,921 95,379,187 3,113,477,775 5.88% 4.75% 1,278.22 2014 75,570 2,201,697,038 146,624,679 12,209,139 34,614,357 99,801,183 3,262,734,750 6.66% 4.49% 1,320.65 2015 75,570 2,244,569,975 145,641,705 438,453 37,651,325 107,551,927 3,124,063,800 6.49% 4.66% 1,423.21 2016 75,603 2,196,021,525 142,009,856 745,997 34,547,933 106,715,926 3,235,052,370 6.47% 4.39% 1,411.53 2017 75,472 2,670,411,769 143,470,868 241,781 37,104,152 106,124,935 3,316,617,040 5.37% 4.33% 1,406.15 2018 75,557 2,740,060,120 170,540,858 417,987 39,701,503 130,421,368 3,472,297,492 6.22% 4.91% 1,726.13 2019 75,557 2,720,580,914 183,563,418 417,431 42,263,176 140,882,811 3,472,297,492 6.75% 5.29% 1,864.59
* The City changed its fiscal year end to December 31, 2011.
Notes: (1)
(2) Excludes limited purpose special service district bonds.
(3)
Source: Cook County and City Finance Division
Equalized assessed values do not include tax increment financing district incremental equalized assessed values.
These amounts include the general obligation bonds that are being repaid from the Water Fund, Solid Waste Fund, Sewer Fund, Motor Vehicle Parking System Fund,Howard Hartrey Tax Increment District, Washington National Tax Increment District, and Special Assessment Fund.
- 146 -

CITY OF EVANSTON, ILLINOIS
Ratio of Outstanding Debt by Type
Last Ten Fiscal Years
Fiscal General Special General Water Total Percentage (1)Year Obligation Service District Obligation Revenue IEPA Primary of Personal Per
Ended Bonds Bonds Capital Lease Bonds Bonds Loans Government Income Capita
2010 109,078,880$ 2,155,000$ 708,552$ 40,236,120$ 1,720,000$ 95,370,544$ 249,269,096$ 8.59% 3,358$ 2011 115,482,439 1,840,000 363,759 36,212,561 1,170,000 87,059,150 242,127,909 7.67% 3,251 2011* 120,739,206 1,840,000 - 35,115,794 1,170,000 79,081,272 237,946,272 7.44% 3,195 2012 119,423,742 1,515,000 - 33,221,257 595,000 70,375,368 225,130,367 7.09% 3,022 2013 119,123,639 1,175,000 - 30,411,358 305,000 64,658,382 215,673,379 6.93% 2,890 2014 119,060,744 795,000 - 30,566,097 - 58,412,659 208,834,500 6.40% 2,763 2015 117,752,440 405,000 - 31,911,608 - 51,901,172 201,970,220 6.69% 2,767 2016 116,091,162 - - 30,926,350 - 45,256,237 192,273,749 5.95% 2,544 2017 122,151,162 - - 26,476,050 - 40,328,108 188,955,320 5.70% 2,504 2018 144,702,821 - - 25,839,037 - 34,921,821 205,463,679 5.92% 2,719 2019 154,954,665 - - 28,608,753 - 40,691,551 224,254,969 6.46% 2,968
* The City changed its fiscal year end to December 31, 2011.
Notes:
Source: City Finance Division
Governmental Activities Business-Type Activities
(1) Details regarding the City's outstanding debt can be found in the notes to the financial statements.(2) See the Schedule of Demographic and Economic Statistics for personal income and population data.
- 147 -
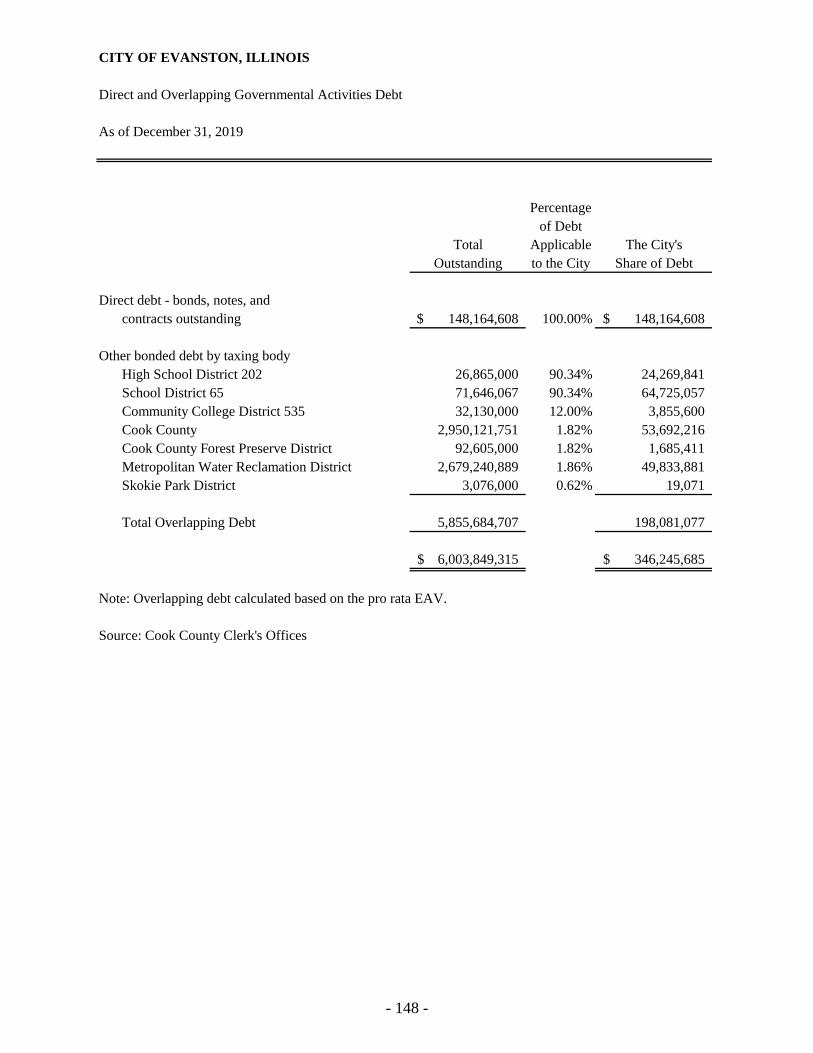
CITY OF EVANSTON, ILLINOIS
Direct and Overlapping Governmental Activities Debt
As of December 31, 2019
Percentageof Debt
Total Applicable The City'sOutstanding to the City Share of Debt
Direct debt - bonds, notes, andcontracts outstanding 148,164,608$ 100.00% 148,164,608$
Other bonded debt by taxing bodyHigh School District 202 26,865,000 90.34% 24,269,841 School District 65 71,646,067 90.34% 64,725,057 Community College District 535 32,130,000 12.00% 3,855,600 Cook County 2,950,121,751 1.82% 53,692,216 Cook County Forest Preserve District 92,605,000 1.82% 1,685,411 Metropolitan Water Reclamation District 2,679,240,889 1.86% 49,833,881 Skokie Park District 3,076,000 0.62% 19,071
Total Overlapping Debt 5,855,684,707 198,081,077
6,003,849,315$ 346,245,685$
Note: Overlapping debt calculated based on the pro rata EAV.
Source: Cook County Clerk's Offices
- 148 -

CITY OF EVANSTON, ILLINOIS
Legal Debt Margin
December 31, 2019
The City is a home rule municipality.
To date, the Illinois General Assembly has set no limits for home rule municipalities.
“The General Assembly may limit by law the amount and require referendum approval of debt to beincurred by home rule municipalities, payable from ad valorem property tax receipts, only in excess of thefollowing percentages of the assessed value of its taxable property...(2) if its population is more than25,000 and less than 500,000 an aggregate of one percent...indebtedness which is outstanding on theeffective date (July 1, 1971) of this constitution or which is thereafter approved by referendum...shall notbe included in the foregoing percentage amounts.”
Chapter 65, Section 5/8-5-1 of the Illinois Compiled Statutes governs computation of the legal debt margin.
- 149 -

CITY OF EVANSTON, ILLINOIS
Pledged-Revenue Coverage
Last Ten Fiscal Years
Water Revenue BondsUtility Less: Net
Fiscal Year Service Operating Available Debt ServiceEnded Charges Expenses Resources Principal Interest Coverage
2011 13,752,681$ 7,191,577$ 6,561,104$ 550,000$ 71,269$ 10.56 2011* 12,368,533 6,146,652 6,221,881 - 24,672 252.18 2012 14,967,204 8,430,599 6,536,605 575,000 37,687 10.67 2013 14,657,748 8,175,707 6,482,041 290,000 19,688 20.93 2014 15,051,732 7,938,838 7,112,894 305,000 6,672 22.82 2015 NA NA NA - - NA2016 NA NA NA - - NA2017 NA NA NA - - NA2018 NA NA NA - - NA2019 NA NA NA - - NA
N/A - The City has no revenue bonds outstanding after December 31, 2014.
* The City changed its fiscal year end to December 31, 2011.
Source: Various city departments
Note: Detail regarding the City's outstanding debt can be found in the notes to the financial statements.Operating expenses do not include interest, depreciation, or amortization expense.
- 150 -

CITY OF EVANSTON, ILLINOIS
Demographic and Economic Statistics
Last Ten Years
Per EducationTotal Capita % of Population
Calendar Personal Personal Median with HS Diploma School Unemployment Year Population Income Income Age or Higher Enrollment Rate
2010 74,486 3,157,759,484$ 42,394$ 34.3 94.0% 9,550 7.9%2011 74,486 3,197,311,550 42,925 34.3 94.0% 11,369 7.3%2012 74,486 3,176,902,386 42,651 35.1 93.6% 11,418 6.8%2013 74,619 3,113,477,775 41,725 34.4 93.9% 10,293 6.7%2014 75,570 3,262,734,750 43,175 34.4 93.9% 10,429 4.2%2015 75,570 3,124,063,800 41,340 34.4 93.9% 11,088 4.5%2016 75,603 3,235,052,370 42,790 35.2 94.0% 12,104 4.3%2017 75,472 3,316,617,040 43,945 35.3 94.0% 12,026 3.9%2018 75,557 3,472,297,492 45,956 36.0 93.4% 10,899 3.1%2019 75,557 3,472,297,492 45,956 36.0 93.4% 10,899 3.1%
Source: Various Government agencies
- 151 -

CITY OF EVANSTON, ILLINOIS
Principal Employers
Current Year and Nine Years Ago
Employer Employees % Rank Employer Employees % Rank
Northshore University Health System 4,641 29% 1 Northwestern University 5,470 36% 1Northwestern University 5,700 35% 2 Evanston Northwestern Healthcare 3,600 24% 2Evanston School District 65 1,482 9% 3 St. Francis Hospital 2,000 13% 3Presence Saint Francis Hospital 1,200 7% 4 Evanston School District 65 1,200 8% 4City of Evanston 792 5% 5 City of Evanston 850 6% 5School District 202 615 3% 6 Presbyterian Homes/McGaw Care 650 4% 6Rotary International 591 2% 7 School District 202 518 3% 7West Minster Pl., McGaw Care Center 455 3% 8 Rotary International 475 3% 8C.E. Neifhoff & Co. 390 2% 9 National Louis University 231 2% 9Whole Foods 328 2% 10 Orrington Hotel 180 1% 10
Total 16,194 Total 15,174
Source: City Economic Development Division
2019 2010
- 152 -

CITY OF EVANSTON, ILLINOIS
Full-Time Equivalent City Government Employees by Function
Last Ten Fiscal Years
2011 2011* 2012 2013 2014 2015 2016 2017 2018 2019
Function/Program
General GovernmentCity Clerk 2.00 3.00 2.80 2.20 2.20 2.00 2.00 2.00 2.00 2.00 City Manager's Office 22.00 8.00 12.00 12.00 14.00 13.00 28.50 32.00 30.00 27.50 Legal 7.00 7.00 7.00 8.00 7.00 8.00 8.00 4.50 4.50 4.50 Administrative Services 50.50 67.00 68.30 59.00 49.00 51.00 57.20 57.70 55.70 53.10 Community Development 28.00 27.00 27.00 24.00 21.00 19.00 21.50 26.25 22.00 23.50 Police 219.00 222.00 225.00 220.00 227.00 227.00 225.50 225.80 220.00 217.00 Fire 107.00 108.00 110.00 106.00 110.00 110.00 110.00 110.00 110.00 110.00 Human and Health Services 15.90 17.00 17.70 20.00 21.10 22.10 21.10 21.10 21.75 17.75 Recreation, Parks, and Forestry 132.00 105.00 105.21 69.00 69.64 74.23 77.13 78.83 76.13 75.46 Public Works 58.80 49.00 49.25 97.00 108.45 107.45 84.25 84.25 72.50 70.00 Total General Government 642.20 613.00 624.26 617.20 629.39 633.78 635.18 642.43 614.58 600.81
Library 52.00 52.00 56.38 63.00 63.13 66.45 66.87 73.88 71.05 69.81 Neighborhood Stabilization Program 1.00 1.00 2.00 1.00 1.31 0.50 0.45 0.30 0.15 - Housing Rehabilitation - - - - - 1.75 1.75 1.75 1.75 1.75 General Assistance Fund - - - - - 4.00 4.00 4.00 4.25 4.25 HOME Fund - - - - - 0.40 0.50 0.50 0.35 0.35 Emergency Telephone System 5.00 5.00 5.00 4.00 5.00 5.00 5.00 5.00 5.00 5.00 CDBG 2.00 3.00 1.53 3.00 2.60 2.60 2.80 2.50 2.75 2.90 Economic Development Fund 5.00 6.00 7.00 5.00 6.25 6.25 - - - - Capital Improvements Fund 1.00 - - - - - - - 4.50 4.50 Maple Ave. Garage - - - - - - - - - - Parking Fund 14.00 15.00 15.50 15.50 15.50 15.50 15.50 15.50 18.00 19.00 Water 42.00 41.00 42.50 40.00 42.50 44.50 44.50 44.50 45.75 45.25 Sewer 12.00 11.00 13.00 11.00 13.33 11.33 11.33 11.33 12.25 12.25 Solid Waste - 6.00 10.00 8.00 9.66 9.66 9.66 9.66 10.50 11.50 Fleet Services 11.00 12.00 12.00 10.00 12.00 12.50 12.50 12.00 9.50 9.90 Insurance Fund 3.00 4.00 4.00 4.00 5.00 5.00 5.00 5.50 5.50 5.50
Total Other Functions 148.00 156.00 168.91 164.50 176.28 185.44 179.86 186.42 191.30 191.96
Total All Funds 790.20 769.00 793.17 781.70 805.67 819.22 815.04 828.85 805.88 792.77
* The City changed its fiscal year end to December 31, 2011.
Source: City of Evanston HR Division
- 153 -

CITY OF EVANSTON, ILLINOIS
Property Tax Rates per $100 - Direct and Overlapping Governments
Last Ten Levy Years
2010 2011 2012 2013 2014 2015 2016 2017 2018 2019
City of Evanston 1.365 1.592 1.551 1.760 1.856 1.766 1.762 1.501 1.604 1.604Consolidated Elections - 0.025 - - - - - - - Cook County 0.423 0.462 0.531 0.560 0.591 0.568 0.552 0.533 0.489 0.489Cook County Forest Preserve District 0.051 0.058 0.063 0.069 0.073 0.069 0.069 0.063 0.060 0.06Metropolitan Water Reclamation District 0.274 0.320 0.370 0.417 0.440 0.430 0.426 0.406 0.396 0.396North Shore Mosquito Abatement District 0.009 0.010 0.010 0.007 0.007 0.011 0.012 0.010 0.010 0.010Evanston Township 0.046 0.011 0.010 0.053 0.056 - - - - - Community College 535 0.160 0.196 0.219 0.256 0.270 0.258 0.271 0.231 0.246 0.246School District 202 1.819 2.061 2.308 2.689 2.836 2.659 2.792 2.332 2.462 2.462School District 65 2.655 2.818 3.149 3.671 3.872 3.686 3.810 3.676 3.891 3.891
Total Tax Rate for Property not in Park Districtor Special Service District 6.802 7.553 8.211 9.482 10.001 9.447 9.694 8.752 9.158 9.158
Percent of Total Tax Rate Levied by the City 20.07% 21.08% 18.89% 18.56% 18.56% 18.69% 18.18% 17.15% 17.51% 17.51%
Source: Cook County Assessor's office
Government Unit
- 154 -

CITY OF EVANSTON, ILLINOIS
Water Sold by Type of Customer
Last Ten Fiscal Years(in 100 cubic feet)
2011 2011* 2012 2013 2014 2015 2016 2017 2018 2019
Type of Customer Residential 2,187,244$ 1,804,433$ 2,276,492$ 2,189,588$ 2,065,980$ 2,098,160$ 1,998,740$ 2,285,759$ 2,344,636$ 2,208,023 Industrial 14,195 11,552 14,758 12,392 11,627 10,772 21,381 12,777 16,405 14,182 Commercial 1,153,949 928,621 1,117,431 1,105,077 1,036,034 1,045,791 2,313,154 1,115,236 1,083,414 1,154,229 Government 75,308 50,129 66,561 61,908 53,732 55,485 82,066 67,547 72,062 69,065
Total 3,430,696$ 2,794,735$ 3,475,242$ 3,368,965$ 3,167,373$ 3,210,208$ 4,415,341$ 3,481,319$ 3,516,517$ 3,445,499$
Total direct rate per 100 cubic feet 1.52$ 1.52$ 1.75$ 1.80$ 1.98$ 2.18$ 2.18$ 2.31$ 2.47$ 2.74$
* The City changed its fiscal year end to December 31, 2011.
Source: City Utilities Department
- 155 -

CITY OF EVANSTON, ILLINOIS
Water Sold by Major Customers
Last Ten Fiscal Years
2011 2011* 2012 2013 2014 2015 2016 2017 2018 2019
Type of Customer Evanston residents/businesses 5,377,297$ 4,719,084$ 6,124,221$ 5,915,560$ 6,301,307$ 6,975,785$ 6,820,350$ 7,280,260$ 7,640,457$ 8,235,089$ Village of Skokie 2,885,096 2,304,066 2,989,109 2,772,424 2,805,425 2,854,684 2,941,912 3,651,338 5,773,487 5,572,511 Northwest Water Commission 4,781,645 3,710,581 5,033,996 5,183,425 5,074,770 5,183,391 5,695,812 5,898,670 5,963,424 5,416,394 Morton Grove and Niles - - - - - - - - 19,830 1,075,089
Total 13,044,038$ 10,733,731$ 14,147,326$ 13,871,409$ 14,181,502$ 15,013,860$ 15,458,074$ 16,830,268$ 19,397,198$ 20,299,083$
* The City changed its fiscal year end to December 31, 2011.
Source: City Utilities Department
- 156 -

CITY OF EVANSTON, ILLINOIS
Operating Indicators by Function/Programs
Last Ten Years
2010 2011 2012 2013 2014 2015 2016 2017 2018 2019
Function/Program
PoliceViolent offenses 214 180 230 131 97 80 130 122 140 73Property offenses 2,119 2,144 2,078 1,980 1,959 1,872 1,681 1,777 1,708 1,979911 calls received 35,991 51,969 44,875 42,551 44,177 46,749 42,763 38,525 36,642 39,357
FireEmergency responses 8,917 9,063 9,330 9,373 9617 9630 10,267 10,058 10,014 10,256Fires extinguished 157 157 154 129 120 99 114 90 111 69Inspections 680 620 640 660 740 760 - 1125 1275 446EMA Responses (reported beginning 2016) - - - - - - 6,441 6,456 6,419 6,678
Other Public WorksStreet resurfacing (estimated miles) 3.4 3.4 3.4 3.4 4.9 2.7 2.9 2.9 2.9 1.9
Parks and RecreationAthletic field usage (hours) 18,966 20,075 16,761 16,367 16,270 15,531 27,426 22,496 24,263 22,054Picnic permits issued 460 437 541 445 448 404 229 371 572 641
Library Volumes in collection 471,262 436,382 426,342 400,034 401,300 481,626 534,533 540,696 514,756 562,567Total volumes borrowed 951,667 891,769 989,638 1,056,243 1,074,972 1,071,401 1,078,653 1,040,580 1,207,419 1,191,600
WaterNew connections 29 16 4 - 18 9 3 5 7 15Water main breaks 38 28 66 51 70 23 28 31 32 28Average daily consumption (millions of gallons) 38.91 38.39 39.85 35.81 36.79 36.63 39.645 40.606 41.122 43.151Peak daily consumption (millions of gallons) 57.02 65.95 69.21 56.95 48.91 50.59 55.084 58.047 55.291 60.248
Note: Indicators are not available for general government functions
- 157 -

CITY OF EVANSTON, ILLINOIS
Capital Assets Statistics by Function
Last Ten Years
2010 2011 2012 2013 2014 2015 2016 2017 2018 2019
Function/Program
PoliceNumber of stations 1 1 1 1 1 1 1 1 1 1Budgeted sworn officers 164 164 164 164 164 164 165 165 165 166
Fire Stations 5 5 5 5 5 5 5 5 5 5Other Public Works
Streets (miles) 147 147 147 147 147 147 147 147 147 147Streetlights 5,641 5,641 5641 5641 5641 5641 5736 5718 5736 5,641
Parks and RecreationAcreage 290 290 290 290 290 290 290 290 290 290Playgrounds 51 51 51 51 51 51 51 51 60 60Baseball/softball diamonds 18 18 18 18 18 18 18 18 13 16Soccer/football fields 27 27 27 27 27 27 27 27 27 27Community centers 5 5 5 5 5 6 6 6 7 7
WaterWater mains (miles) 157 157 157 157 157 156.4 155.6 155.3 155.8 157.5Fire hydrants 1,399 1,399 1,399 1,399 1,477 1,484 1,490 1,502 1508 1511Storage capacity (millions of gallons) 22 22 22 22 22 22 22 22 22 22
Note: No capital asset indicators are available for the general government or library function
Source: Various city departments
- 158 -

COMPLIANCE SECTION

1415 West Diehl Road, Suite 400
Naperville, IL 60563
630.566.8400
INDEPENDENT ACCOUNTANT’S REPORT ON COMPLIANCE WITH
STATE OF ILLINOIS PUBLIC ACT 85-1142
The Honorable Mayor Members of the City Council City of Evanston, Illinois We have examined management’s assertion that the City of Evanston, Illinois (the City) complied with the provisions of subsection (q) of Section 11-74.4-3 of the Illinois Tax Increment Redevelopment Allocation Act (Illinois Public Act 85-1142) during the year ended December 31, 2019. As discussed in that representation letter, management is responsible for the City’s
compliance with those requirements. Our responsibility is to express an opinion on management’s
assertion about the City’s compliance based on our examination. Our examination was conducted in accordance with attestation standards established by the American Institute of Certified Public Accountants. Those standards require that we plan and perform the examination to obtain reasonable assurance about whether management’s assertion
about compliance with the specified requirements is fairly stated, in all material respects. An examination involves performing procedures to obtain evidence about whether management’s
assertion is fairly stated, in all material respects. The nature, timing, and extent of the procedures selected depend on our judgement, including an assessment of the risks of material misstatement of management’s assertion, whether due to fraud or error. We believe the evidence we obtained is sufficient and appropriate to provide a reasonable basis for our opinion. Our examination does not provide a legal determination on the City’s compliance with statutory requirements. In our opinion, management’s assertion that the City of Evanston, Illinois, complied with the aforementioned requirements for the year ended December 31, 2019, is fairly stated in all material respects. Naperville, Illinois July 14, 2020
- 159 -