west kerry gaeltacht tourism survey 2010 - dars na gaeltachta
TRANSCRIPT

West Kerry Gaeltacht Tourism Survey 2010
Report authors | Fiona Tobin and Feargus Dunne
Institute of Technology Tralee, Co. Kerry
Design | Daire Ó Beaglaoich, Graftrónaic. 066-915 5876

Table of Contents
Foreword iii
Introduction iv
Project Brief 1
Research Methodology 2
Population of Interest & Sampling
Data Collection
Questionnaire Design
Data Analysis
Section 1: Research Findings – Profile of Visitors 3
Section 2: Profile of the West Kerry Gaeltacht as a Tourism Destination 7
Section 3: Profile of the Tourist Experience 12
Section 4: Implications of the Research 15
Limitations of the Research 16
Appendix A 17
Appendix B 24

ForewordThe West Kerry Gaeltacht Tourism Survey 2010 isan initiative of Údarás na Gaeltachta, the Gaeltachtauthority responsible for the economic, social andcultural development of the Gaeltacht regions. Thetourism industry is one of the principal economicsectors in the West Kerry Gaeltacht and thecommissioning of this research is in response to a dearth of in-depth information regarding theprofiles, attitudes and perceptions of visitors to the area.
An tÚdarás believe the availability of suchinformation is a key resource in determining futurepolicy in relation to the development of thetourism industry locally. Such information will act as a key influencer in determining investmentpriorities in the future for grant-aid and othergovernment supports which are administered bythose State agencies which have a sharedresponsibility for the development of the sector.
Above all, such information is valuable to the localtourism industry and should assist them in targetingkey markets, providing higher levels of customersatisfaction and developing new products andservices which will form part of the mature tourismoffering of the West Kerry Gaeltacht area.
We would like to thank our colleagues in FáilteIreland for their assistance in compiling thequestionnaire and for providing us with the use of their facilities. We are indebted to the surveycollectors for their diligence and hardwork incompleting the survey enumeration. We aregrateful to the authors of the report, FeargusDunne and Fiona Tobin of the Institute ofTechnology Tralee for their valued advice and fortheir analysis of the survey findings. We would liketo thank Comharchumann Turasóireachta ChorcaDhuibhne, and the local tourist industry, especiallythose businesses or enterprises that providedassistance on a regular basis during the course of the 12 week survey.
Finally, we would like to thank all the tourists whoparticipated in this survey. We hope theinformation gathered here will assist tourismagencies and the local tourism trade in ensuringthat they continue to return to the area again overthe coming years to enjoy the best of what theGaeltacht tourism product has to offer.
Éamonn Ó NeachtainRegional Manager, Údarás na Gaeltachta
DINGLE PENINSULA TOURISM SURVEY 2010 iii|

IntroductionIn June 2010, Údarás na Gaeltachta, undertook asurvey of visitors to the West Kerry Gaeltacht area.Thereafter, An tÚdarás commissioned a report todocument and analyse the findings of the tourismsurvey which was conducted over the course of thesummer 2010.
The rationale for the research was driven by thefact that the tourism industry is one of the principaleconomic sectors in the West Kerry Gaeltacht. Thedevelopment of the sector is a priority for Údarásna Gaeltachta and the agency has investedsignificant funds in developing infrastructure andservices over recent years. Planning for the futuredevelopment of the sector depends on current andrelevant information concerning the profiles,attitudes and perceptions of visitors to the area.
The main objective of the study was to establishsome key information sets in relation to the localtourism industry in the West Kerry Gaeltacht area in2010 including;
V Demographic profile of the visitor
V Reasons for choosing the area for their holiday
V Visitor satisfaction ratings withaccommodation, food and attractions in the area.
The study aimed to provide information whichwould support a comparative analysis of the localsurvey findings and the annual visitor attitudesurveys by Fáilte Ireland. The information compiledalso supports analysis of previous surveys carriedout in the study area, most notably the CountyKerry Tourism Research (2004).
The questionnaire was formulated by Údarás naGaeltachta with technical support from colleaguesfrom Fáilte Ireland and administered by a team ofenumerators recruited by An tÚdarás.
The findings were analysed by Feargus Dunne and Fiona Tobin from the Department of Hotel,Catering and Tourism, at the Institute ofTechnology Tralee, Co. Kerry.
DINGLE PENINSULA TOURISM SURVEY 2010iv |
DINGLE PENINSULA TOURISM SURVEY 2010 1|
Project BriefThe authors of the report were requested to reviewthe County Kerry Tourism Research (2004) andother relevant tourism reports to facilitatecomparisons between findings from this report and previous data sets.
The main informational objectives outlined byÚdarás na Gaeltachta were:
Profile of Visitors – number of visitors, number of repeat visitors, compilation of a demographicprofile
Profile of the Tourism Experience – Levels ofsatisfaction with accommodation, food andfacilities and overall satisfaction includingcomments, activities/pastimes engaged in
Implications of the Research – Conclusion andRecommendations
To address these objectives this report isstructured in the following manner:
Section One – Profile of Visitors to include:Gender, age, occupation, country or county oforigin, method of entry etc.
Section Two – Profile of the West KerryGaeltacht area as a tourism destination to include:Main purpose of visit, frequency of visit, nightsspent in the area, important factors in choosing to visit the area etc.
Section Three – Profile of the Tourism ExperienceOverall satisfaction levels with various sectors,likelihood of repeat visit etc.
Section Four – Implications of the Research

Population of Interest and SamplingIn order to achieve the research objectives, thepopulation of interest was identified as all touriststo Corca Dhuibhne or The West Kerry Gaeltachtarea. A simple random sample of this population ofinterest was selected.
The sampling method employed was theinterruption of the tenth person to pass theinterview location after the completion of theprevious interview. Should this person beinappropriate to the population of interest (alreadysurveyed/a resident) or choose not to respond,then the interviewer was instructed to wait for thenext tenth person.
Completed questionnaires were collected in anumber of venues in Dingle town and west of thetown. The majority were collected around the maintourist areas in Dingle town – in the vicinity of themarina area.
The venues were chosen because they experiencehigh pedestrian traffic levels. There were also anumber of indoor locations selected to allow forinclement weather conditions including the DingleTourist Office, Mara Beo (Dingle Aquarium), Ionadan Bhlascaoid (Blasket Island Centre) in DúnChaoin and the Museum in Baile an Fheirtéaraigh.The survey was conducted across all seven days ofthe week between the times of 9.00am and 9.00pmover a 12 week period.
In total, 577 valid interviews were completed. Thesample size of almost 600 and the type of samplingused is considered to give a broad perspective ofthe range of tourist visiting the area.
Data CollectionÚdarás na Gaeltachta provided training andinstruction to enumerators, prior to thecommencement of the survey. All enumeratorscarried out a number of pilot surveys which wereanalysed and errors identified and addressed.Completed surveys were then examined andvalidated.
Questionnaire DesignÚdarás na Gaeltachta, in consultation with FáilteIreland and other relevant parties, designed a 23question survey in order to achieve the stated aimsof the research project. In order to standardise theresponses and to eliminate the risk ofinterpretational errors at analysis stage, the surveycomprised of mainly ‘closed questions’. Also, avariety of simple, balanced, ordinal scales(sequential/ranking) were employed to measurevarious attitudes among respondents. This styleand structure of questionnaire would best achievethe objectives of the research.
The authors of this report met with Údarás naGaeltachta after the initial design stage of thequestionnaire, to consider potential problems andmake recommendations for the final questionnaire.These meetings resulted in important amendmentsbeing made to the final questionnaire.
A copy of the final questionnaire is available inAppendix A of this report.
Data AnalysisThe authors of the report used the SPSS (StatisticalPackage for Social Sciences) data analysisprogramme in their analysis of the data which hadbeen generated by the survey.
DINGLE PENINSULA TOURISM SURVEY 20102 |
Research Methodology

Of the survey respondents, just over half (52.9%)were male with the remaining female respondentsrepresenting 47.1% of the sample. This gives anequitable gender balance in the sample.
In terms of the age of respondents, 47.7% were inthe 35-54 age bracket, with those visitors of 55+years accounting for the second largest group(30.2%), those between 19-34 years accounted for20.5% of survey participants. Although othernational surveys do not allow for direct comparisonwith these figures, it appears that the West KerryGaeltacht area attracts an older cohort i.e.predominantly from the over 35 age groups. 1.4%of respondents were under 18 years of age*.
Most visitors surveyed were travelling as part of acouple (42.4%), although a significant percentagewas in the region as part of a family group (32.9%)and with other adults (15.4%). Almost 10% ofrespondents were travelling alone. This hasimplications for the industry in the area, in terms of how it accommodates single travellers.
The majority of visitors sampled for the surveystated that the occupation of the chief earner intheir household was from the AssociateProfessional & Technical category (31.5%), with26.2% of respondents in theManagerial/Professional category (See final pageof Appendix One). In total almost 58% were fromthese segments, which has obvious benefits for thestudy area in terms of these groups’ propensity totravel and disposable income available. Figure 3indicates the full range of occupations of thosesampled.
DINGLE PENINSULA TOURISM SURVEY 2010 3|
Section One
Research Findings – Profile of Visitors
Male
Female
47.1% 52.9%
FIGURE 1: GENDER OF RESPONDENTS
47.7%
30.2%
20.5%1.4%
35-54 years
55+ years
19-34 years
Up to 18 years
FIGURE 2: AGE OF RESPONDENTS
26.2%
31.5%
16.1%
15.1%
8.7%
Managerial/Professional
Ass. Professional & Technical
Craft/Manual
Clerical
Other
FIGURE 3: OCCUPATION OF THE CHIEF EARNER IN THE HOUSEHOLD
* The figure of 1.4% for under 18’s does notreflect the number of under 18’s visiting the area.Only under 18’s accompanied by an adult wereinterviewed as part of this study.

In relation to the country of origin of respondents,the majority of visitors were not surprisingly, fromtraditional markets, with Republic of Ireland (ROI)tourists making up the largest visitor group at43.8%, followed by the United States of America(U.S.A.) with 17.6%, Great Britain with 15.1% andGermany with 7.9% of visitors to the study areaduring the sampling period. The top 6 markets,representing 90% of all visitors are shown in figure 4.
It is interesting to consider the figures above withregard to the County Kerry Tourism Research (2004)1.Though that research covered the entire county ofKerry and therefore does not allow for directcomparison, the largest markets (outside domestic)in terms of country of origin in that survey wereBritain (24%), Germany (18.4%) and U.S.A. (14%).
In this most recent survey the British marketaccounts for 15.1% of total visitors, which is adecline of almost 9% when compared with the 2004County Kerry data. Tourism Ireland research from20092, as well as more recent information from theIrish Central Statistics Office (CSO)3 point to aserious decline in the British market at present, witha 15% fall in visitors to this country in 2009 from theprevious year, and continued leakage in the first sixmonths of 2010.
That the U.S.A. is the largest international marketvisiting the West Kerry Gaeltacht area should betaken as a major positive, as Tourism Irelandresearch (2009) clearly indicates that NorthAmerican visitors (predominantly USA), stay forlonger and contribute more in terms of revenue asa proportion of visitors, than other markets.
In this study, the Republic of Ireland and NorthernIreland account for 46.4% of all respondents. In theCounty Kerry Tourism Research (2004) the figure fordomestic (all-island) visitors was 31%. This increasecould be partly explained by a combination of thecurrent economic recession resulting in greaterpropensity for home holidays, as well as possiblythe highly visible marketing campaign undertakenby Fáilte Ireland in spring/summer 2010 to promotethis segment.
DINGLE PENINSULA TOURISM SURVEY 20104 |
FIGURE 4: COUNTRY OF ORIGIN OF RESPONDENTS
17.6%
15.1%
7.9%2.8% 2.6%
Rep. of Ireland
United States
Great Britain
Germany
France
N. Ireland
43.8%
1 County Kerry Tourism Research (February 2004)2 Tourism Ireland Facts & Figures 2009 – Island of IrelandOverseas Visitors3www.cso.ie/releasespublications/...travel/2010/overseastravel_jun2010.pdf (accessed 10/11/’10)

In total, 27 countries were represented amongrespondents to the survey which, other than themarkets mentioned above, included visitors fromJapan, Italy, Australia, Slovakia, Argentina, Israel,Spain, Switzerland, South Africa, Austria, Canada,New Zealand and the Czech Republic. Althoughthe numbers from these countries during thesampling period were in the single digits, it isinteresting to note the broad visitor base attractedto the West Kerry Gaeltacht area.
With regard to the county of origin of respondents,the survey shows that all 32 counties of Ireland arerepresented in the sample, although some countiescontributed visitor numbers in the very low singledigits. The largest groups of respondents were fromcounties Dublin (24%), Cork (19.9%), Limerick(7.4%), Galway (6.6%) and Kildare (5.9%). Countieswith greater than 2% of visitors in the overall surveyare shown in Figure 5.
In relation to international visitors to the area, forjust over 70% of respondents air travel was the most common method of entry used, whichcorresponds exactly to the figure shown in theCounty Kerry Tourism Research of 2004.
Dublin airport was the access point used by almosthalf of visitors to the study area which is notsurprising given;
V the airports large volume of internationalconnections
V the fact that Dublin city is the capital of Irelandand has a profile to match other Europeancapitals
V the Dublin region was visited by 51% ofinternational visitors to Ireland in 2009 as part of their trip (Tourism Ireland 2009)
V Dublin is the number one destination of choicefor respondents to this survey, with Connemarain second place and Dingle in third place (seefigure 7).
DINGLE PENINSULA TOURISM SURVEY 2010 5|
24.0%
19.9%7.4%
6.6%
5.9%
3.3%3.0%
2.6% 2.2%DublinCorkLimerickGalwayKildareKerryAntrimTipperaryDown
FIGURE 5: COUNTY OF ORIGIN OF RESPONDENTS
14.1%
12.6%
8.5%
6.3%5.6%
2.6%0.4%
1.5% 0.4%0.7%
46.7%
Dublin Airport
Shannon Airport
Rosslare Port
Cork Airport
Cork Port
Dublin Port
Kerry Airport
Derry Airport
Larne Airport
Belfast Airport
Crosshaven Port
FIGURE 6:METHOD OF ENTRY

Shannon Airport was the second most importantaccess point, with 14.1% of international visitorssurveyed arriving through this airport. ShannonAirport has experienced well documented issues inrecent years, including an expected decrease of 1million in passenger numbers in 2010 alone4. As aresponse the Dublin Airport Authority (DAA) is nowproposing a change in the business model atShannon airport, moving away from the previouslow cost model. It is important to again highlightthe value of an international air access point in thewest of the country.
The figure of 2.6% for international visitors to thearea who arrived through Kerry airport reflects onlythose visitors from Great Britain on London andManchester routes, and from Germany on theFrankfurt (Hahn) route. The survey does not takeinto account those who availed of domestic flightsto Kerry airport for the purposes of visiting theWest Kerry Gaeltacht area. This could be examinedin more detail in a future study.
Sea travel was also shown in the survey to beimportant in terms of access, with Rosslare portidentified as the third most used entry point forinternational visitors to the area after Dublin andShannon airports, and Cork Port as the fifth mostused entry point. Although beyond the scope ofthis research to confirm, the re-launch of theSwansea to Cork ferry route in spring 2010 after afour year cessation is likely to have provided apositive stimulus for visitor numbers to the area.
Figure 8 below illustrates the method of entry tothe country utilised by visitors from the maininternational markets.
DINGLE PENINSULA TOURISM SURVEY 20106 |
4 Shannon Airport Strategy Announcement, November 2010
Ranking 1 2 3 4 5
1st Destination Choice Dublin Connemara Dingle Kerry Galway
2nd Destination Choice Kerry Connemara Dublin Galway Dingle
3rd Destination Choice Kerry Galway Dublin Connemara Dingle
FIGURE 7: TOP THREE MAIN DESTINATIONS IN IRELAND FOR RESPONDENTS
Totals may not add up to 100% to allow for the small number of respondents who arrived in the area byroad from Northern Ireland.
81.8%66.7%
100.0%
0.0%18.2%
62.0%
0.0%
99.0%
35.6% 33.3%
0.0%
20.0%
40.0%
60.0%
80.0%
100.0%
120.0%
United States Germany Great Britain France Canada
Air
Sea
FIGURE 8:METHOD OF ENTRY BY MARKET

‘Holiday/Leisure and Recreation’ was the primaryreason for over 81.6% of respondents to visit thestudy area, while 10.9% of visitors were there to‘visit friends and relatives’ (VFR), and just 1.1% for‘business purposes’. In the County Kerry TourismResearch (2004), 95% of visitors surveyed werevisiting Kerry for holiday/leisure only. Figures fromthe CSO5 and Fáilte Ireland6 point to ‘holidays’ asthe main reason for visiting Ireland for just under45% of international visitors in 2009.
Figure 10 shows the breakdown of theholiday/leisure market only, by country of origin.
To assess the level of repeat business to the area,respondents were asked to indicate how often theyvisited the Dingle Peninsula. Figure 11 illustratesthat just over half of those who responded were ona first visit. This compares with 65% from the 2004County Kerry Tourism Research. Of the remainingrespondents in this study, 49.2% had visited at leastonce before, with 17.7% on at least their secondvisit this year.
DINGLE PENINSULA TOURISM SURVEY 2010 7|
5 www.cso.ie/releasespublications/...travel/2010/overseastravel_jun2010.pdf (accessed 10/11/’10)6 Fáilte Ireland Tourism Facts 2009
Section Two
Profile of the West Kerry Gaeltachtas a Tourism Destination
FIGURE 9:MAIN PURPOSE OF VISIT
FIGURE 10:METHOD OF ENTRY
82.7%
100.0%
86.4% 85.6%80.0% 76.3%
0.0%
20.0%
40.0%
60.0%
80.0%
100.0%
120.0%
GreatBritain
France Germany UnitedStates
N. Ireland
Visitors whose main purposeof visit was holiday/leisure
Rep. ofIreland
FIGURE 11: FREQUENCY OF VISITS
50.8%
31.5%
13.0%4.7%
First visit
Once a year or less
2-4 times a year
4+ times
10.9%
1.1%
6.4%
81.6%Holiday/Leisure
VFR
Business
Other
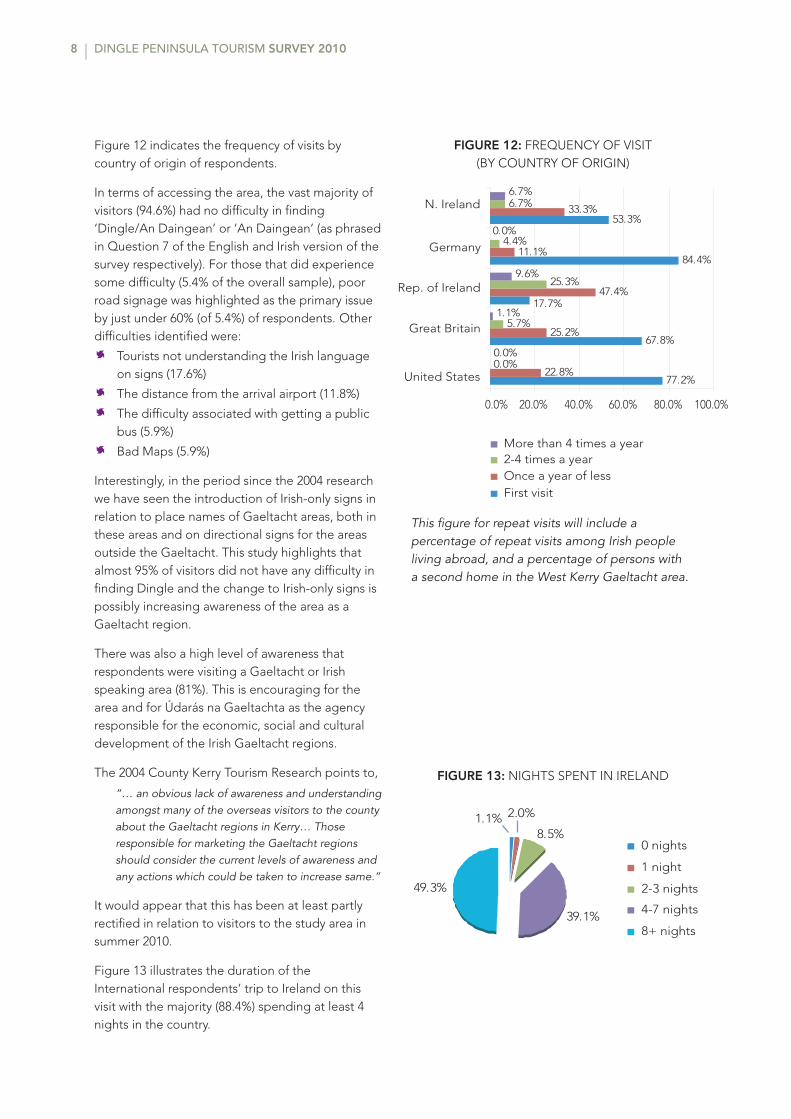
Figure 12 indicates the frequency of visits bycountry of origin of respondents.
In terms of accessing the area, the vast majority ofvisitors (94.6%) had no difficulty in finding‘Dingle/An Daingean’ or ‘An Daingean’ (as phrasedin Question 7 of the English and Irish version of thesurvey respectively). For those that did experiencesome difficulty (5.4% of the overall sample), poorroad signage was highlighted as the primary issueby just under 60% (of 5.4%) of respondents. Otherdifficulties identified were:V Tourists not understanding the Irish language
on signs (17.6%)V The distance from the arrival airport (11.8%)V The difficulty associated with getting a public
bus (5.9%)V Bad Maps (5.9%)
Interestingly, in the period since the 2004 researchwe have seen the introduction of Irish-only signs inrelation to place names of Gaeltacht areas, both inthese areas and on directional signs for the areasoutside the Gaeltacht. This study highlights thatalmost 95% of visitors did not have any difficulty infinding Dingle and the change to Irish-only signs ispossibly increasing awareness of the area as aGaeltacht region.
There was also a high level of awareness thatrespondents were visiting a Gaeltacht or Irishspeaking area (81%). This is encouraging for thearea and for Údarás na Gaeltachta as the agencyresponsible for the economic, social and culturaldevelopment of the Irish Gaeltacht regions.
The 2004 County Kerry Tourism Research points to,
“… an obvious lack of awareness and understandingamongst many of the overseas visitors to the countyabout the Gaeltacht regions in Kerry… Thoseresponsible for marketing the Gaeltacht regionsshould consider the current levels of awareness andany actions which could be taken to increase same.”
It would appear that this has been at least partlyrectified in relation to visitors to the study area insummer 2010.
Figure 13 illustrates the duration of theInternational respondents’ trip to Ireland on thisvisit with the majority (88.4%) spending at least 4nights in the country.
DINGLE PENINSULA TOURISM SURVEY 20108 |
FIGURE 12: FREQUENCY OF VISIT (BY COUNTRY OF ORIGIN)
FIGURE 13: NIGHTS SPENT IN IRELAND
77.2%
67.8%
17.7%
84.4%
53.3%
22.8%
25.2%
47.4%
11.1%
33.3%
0.0%
5.7%
25.3%
4.4%
6.7%
0.0%
1.1%
9.6%
0.0%
6.7%
0.0% 20.0% 40.0% 60.0% 80.0% 100.0%
United States
Great Britain
Rep. of Ireland
Germany
N. Ireland
More than 4 times a year2-4 times a yearOnce a year of lessFirst visit
This figure for repeat visits will include apercentage of repeat visits among Irish peopleliving abroad, and a percentage of persons with a second home in the West Kerry Gaeltacht area.
1.1% 2.0%
8.5%
39.1%
49.3%
0 nights
1 night
2-3 nights
4-7 nights
8+ nights

In terms of length of stay in the area amongstrespondents in this study, a 2-3 night stay on theDingle Peninsula is the most common (31%), withanother 25% staying between 4-7 nights and 12.9%staying more than 8 nights (See figure 14). Thesegroups may include Irish people living abroad butreturning home and those with second homes inthe area. Overall, the average length of stay in thearea was 3.3 nights.
Figure 15 examines the respondents’ length of stayin the study area by country of origin. Domesticvisitors (ROI) are again shown to be a crucialsegment of the market, given they tend to staylonger in the area than any other market. However,it must be cautioned again that the domesticvisitors figure may include respondents eitherreturning home on holidays or staying in a secondhome in the area, meaning their value in terms ofrevenue is diminished in comparison toholidaymakers. The average length of stay fordomestic visitors in the study area is 4.4 nights.
DINGLE PENINSULA TOURISM SURVEY 2010 9|
FIGURE 14: NIGHTS SPENT ON THE DINGLE PENINSULA
12.2%
18.1%
31.0%
25.0%
12.9%
0 nights 1 night 2-3 nights 4-7 nights 8+ nights
FIGURE 15: LENGTH OF STAY (BY COUNTRY OF ORIGIN)
24.1%
35.7%
16.6%
11.9%
25.8%
30.9%
15.5%
8.2%
6.5%
27.8%
37.6%
20.4%
33.3%
37.8%
13.3%
0.0%
0.0% 10.0% 20.0% 30.0% 40.0% 50.0% 60.0%
1 night
2-3 nights
4-7 nights
8+ nights
Germany
Rep. of Ireland
United States
Great Britain
F
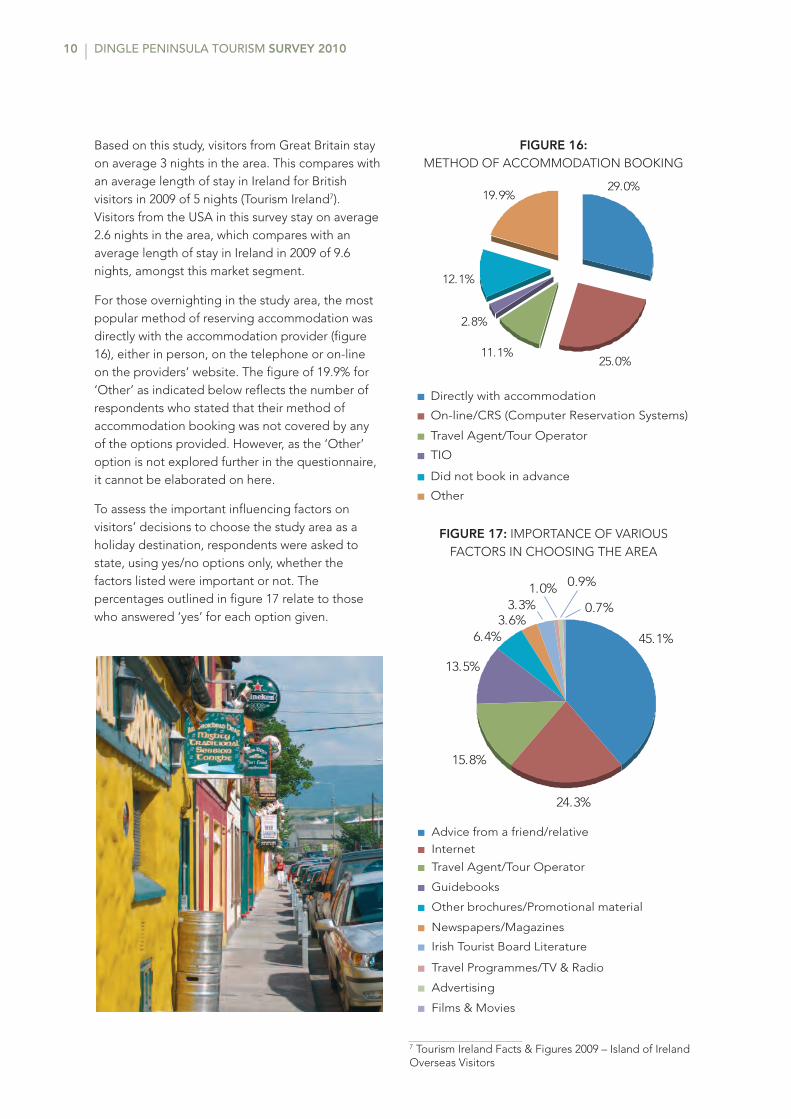
Based on this study, visitors from Great Britain stayon average 3 nights in the area. This compares withan average length of stay in Ireland for Britishvisitors in 2009 of 5 nights (Tourism Ireland7).Visitors from the USA in this survey stay on average2.6 nights in the area, which compares with anaverage length of stay in Ireland in 2009 of 9.6nights, amongst this market segment.
For those overnighting in the study area, the mostpopular method of reserving accommodation wasdirectly with the accommodation provider (figure16), either in person, on the telephone or on-lineon the providers’ website. The figure of 19.9% for‘Other’ as indicated below reflects the number ofrespondents who stated that their method ofaccommodation booking was not covered by anyof the options provided. However, as the ‘Other’option is not explored further in the questionnaire,it cannot be elaborated on here.
To assess the important influencing factors onvisitors’ decisions to choose the study area as aholiday destination, respondents were asked tostate, using yes/no options only, whether thefactors listed were important or not. Thepercentages outlined in figure 17 relate to thosewho answered ‘yes’ for each option given.
DINGLE PENINSULA TOURISM SURVEY 201010 |
FIGURE 16:METHOD OF ACCOMMODATION BOOKING
29.0%
25.0%11.1%
2.8%
12.1%
19.9%
Directly with accommodation
On-line/CRS (Computer Reservation Systems)
Travel Agent/Tour Operator
TIO
Did not book in advance
Other
45.1%
24.3%
15.8%
13.5%
6.4%3.6%
3.3%1.0%
0.7%
0.9%
Advice from a friend/relativeInternet
Travel Agent/Tour Operator
Guidebooks
Other brochures/Promotional material
Newspapers/Magazines
Irish Tourist Board Literature
Travel Programmes/TV & Radio
Advertising
Films & Movies
7 Tourism Ireland Facts & Figures 2009 – Island of IrelandOverseas Visitors
FIGURE 17: IMPORTANCE OF VARIOUSFACTORS IN CHOOSING THE AREA
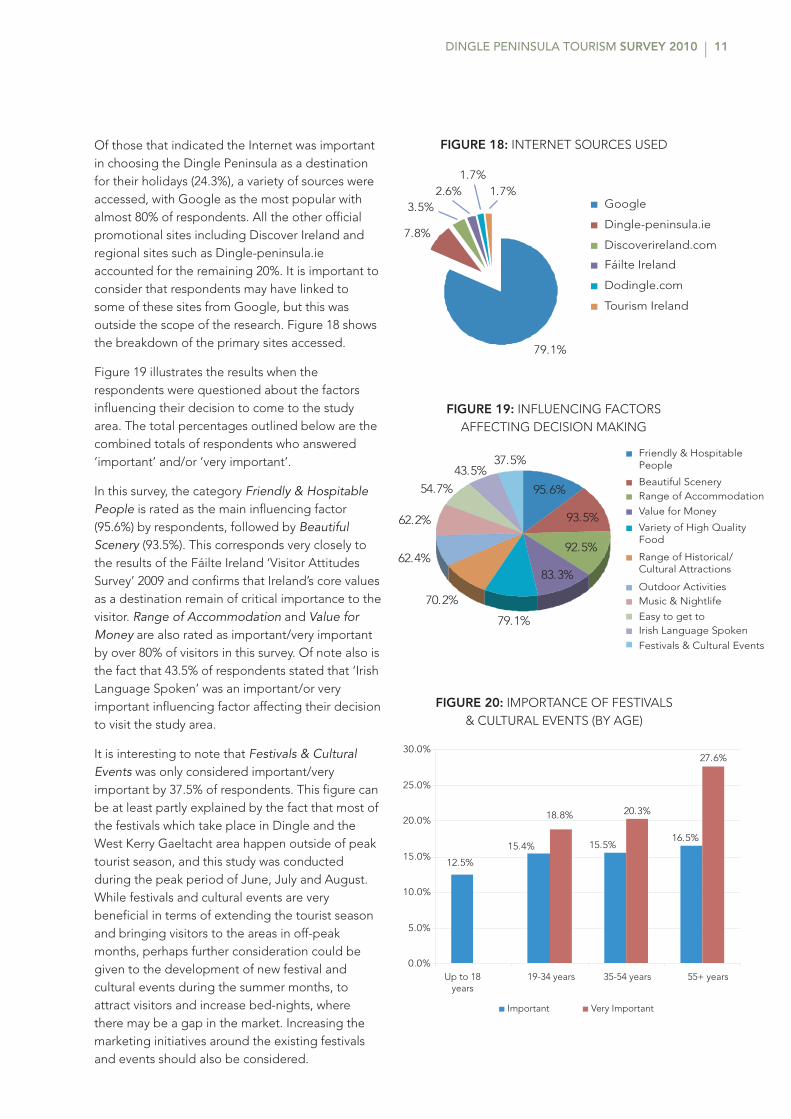
Of those that indicated the Internet was importantin choosing the Dingle Peninsula as a destinationfor their holidays (24.3%), a variety of sources wereaccessed, with Google as the most popular withalmost 80% of respondents. All the other officialpromotional sites including Discover Ireland andregional sites such as Dingle-peninsula.ieaccounted for the remaining 20%. It is important toconsider that respondents may have linked tosome of these sites from Google, but this wasoutside the scope of the research. Figure 18 showsthe breakdown of the primary sites accessed.
Figure 19 illustrates the results when therespondents were questioned about the factorsinfluencing their decision to come to the studyarea. The total percentages outlined below are thecombined totals of respondents who answered‘important’ and/or ‘very important’.
In this survey, the category Friendly & HospitablePeople is rated as the main influencing factor(95.6%) by respondents, followed by BeautifulScenery (93.5%). This corresponds very closely tothe results of the Fáilte Ireland ‘Visitor AttitudesSurvey’ 2009 and confirms that Ireland’s core valuesas a destination remain of critical importance to thevisitor. Range of Accommodation and Value forMoney are also rated as important/very importantby over 80% of visitors in this survey. Of note also isthe fact that 43.5% of respondents stated that ‘IrishLanguage Spoken’ was an important/or veryimportant influencing factor affecting their decisionto visit the study area.
It is interesting to note that Festivals & CulturalEvents was only considered important/veryimportant by 37.5% of respondents. This figure canbe at least partly explained by the fact that most ofthe festivals which take place in Dingle and theWest Kerry Gaeltacht area happen outside of peaktourist season, and this study was conductedduring the peak period of June, July and August.While festivals and cultural events are verybeneficial in terms of extending the tourist seasonand bringing visitors to the areas in off-peakmonths, perhaps further consideration could begiven to the development of new festival andcultural events during the summer months, toattract visitors and increase bed-nights, wherethere may be a gap in the market. Increasing themarketing initiatives around the existing festivalsand events should also be considered.
DINGLE PENINSULA TOURISM SURVEY 2010 11|
FIGURE 18: INTERNET SOURCES USED
FIGURE 19: INFLUENCING FACTORSAFFECTING DECISION MAKING
79.1%
7.8%
3.5%2.6%
1.7%1.7%
Dingle-peninsula.ie
Discoverireland.com
Fáilte Ireland
Dodingle.com
Tourism Ireland
95.6%
93.5%
92.5%
83.3%
79.1%
70.2%
62.4%
62.2%
54.7%
37.5%43.5%
Friendly & Hospitable People
Beautiful SceneryRange of Accommodation
Value for Money
Variety of High Quality Food
Range of Historical/Cultural Attractions
Outdoor ActivitiesMusic & Nightlife
Easy to get toIrish Language Spoken
Festivals & Cultural Events
FIGURE 20: IMPORTANCE OF FESTIVALS & CULTURAL EVENTS (BY AGE)
12.5%
18.8% 20.3%
27.6%
15.4% 15.5%16.5%
0.0%
5.0%
10.0%
15.0%
20.0%
25.0%
30.0%
Up to 18years
19-34 years 35-54 years 55+ years
Important Very Important
F

The survey also evaluated the overall tourismexperience across various categories and testedsatisfaction ratings with basic service provision.
Figure 21 illustrates responses to the question ofwhether visitors intended to engage in a widevariety of activities or interests, over the course oftheir visit to the study area. It also detailsresponses to a further question as to whether theyhad actually engaged in the activity. The figures for‘engaged in’ activities or interests, is perhapsartificially low, as respondents may have just arrivedin the area when they were surveyed. The WestKerry Gaeltacht offers a wide range of experiencesand activities, all of which attract some percentageof visitors, although the more specialised activitieshave a limited niche appeal, as evidenced in figure21. Of note also, is the fact that the ‘engaged in’percentage is higher than the ‘intended to engagein’ figure, highlighting the fact that consumerdecision making in terms of day-to-day activitiesand attractions is on-going and it is important thattourism providers continue their marketing effortswhile visitors are holidaying in the area.
Figure 22 examines overall levels of satisfaction(satisfied or very satisfied in survey) with variousactivities/experiences, from the perspective ofboth price and quality. The results are, in the main,positive with satisfaction levels above 85% on bothcounts across almost all activities and experiences.
DINGLE PENINSULA TOURISM SURVEY 201012 |
Section Three
Profile of the Tourism Experience
FIGURE 21: INTENDED TO/ENGAGED IN ACTIVITIES OR INTERESTS
Boat Tri
p
Cyclin
g
Equestrian
Festiva
l/Eve
nts
Fishing
Golf
Hiking
Music
Wate
rsports
Heritag
e Sites
Muse
ums/Inte
rpre
tative
Centre
sPubs
28.9%
31.2%
4.0%
6.6%
3.6%
4.9%
3.6%
6.4%
4.9%
4.9%
4.2%
6.4%
8.0%
25.8%
8.8%
17.9%
5.4%
13.3%
13.3%
27.4%
11.8%
30.2%
20.3%
58.2%
Engaged inIntend to
F
FIGURE 22: OVERALL LEVELS OF SATISFACTIONWITH ACTIVITIES/EXPERIENCES –
PRICE & QUALITY
97.2%
94.7%
92.9%
86.5%
91.2%
100.0%
99.0%
96.0%
98.1%
96.9%
96.5%
86.7%
96.8%
84.0%
86.5%
87.1%
97.6%
95.1%96.6%
97.0%
86.2%
92.2%
86.3%
91.3%
75.0% 80.0% 85.0% 90.0% 95.0% 100.0%
Boat Trip
Cycling
Equestrian
Festival/Event
Fishing
Golf
Hiking
Music
Water Sports
Heritage Sites
Pubs
Museums/Int. Centres
Price Quality
F
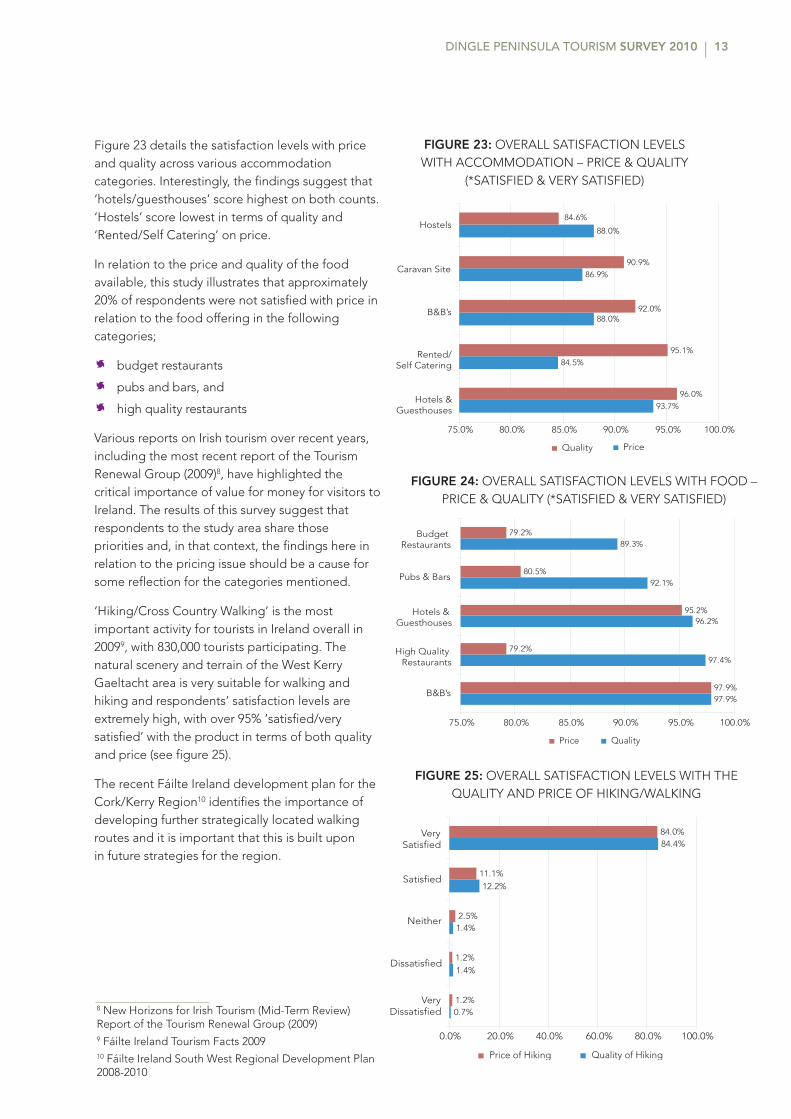
Figure 23 details the satisfaction levels with priceand quality across various accommodationcategories. Interestingly, the findings suggest that‘hotels/guesthouses’ score highest on both counts.‘Hostels’ score lowest in terms of quality and‘Rented/Self Catering’ on price.
In relation to the price and quality of the foodavailable, this study illustrates that approximately20% of respondents were not satisfied with price inrelation to the food offering in the followingcategories;
V budget restaurants
V pubs and bars, and
V high quality restaurants
Various reports on Irish tourism over recent years,including the most recent report of the TourismRenewal Group (2009)8, have highlighted thecritical importance of value for money for visitors toIreland. The results of this survey suggest thatrespondents to the study area share thosepriorities and, in that context, the findings here inrelation to the pricing issue should be a cause forsome reflection for the categories mentioned.
‘Hiking/Cross Country Walking’ is the mostimportant activity for tourists in Ireland overall in20099, with 830,000 tourists participating. Thenatural scenery and terrain of the West KerryGaeltacht area is very suitable for walking andhiking and respondents’ satisfaction levels areextremely high, with over 95% ‘satisfied/verysatisfied’ with the product in terms of both qualityand price (see figure 25).
The recent Fáilte Ireland development plan for theCork/Kerry Region10 identifies the importance ofdeveloping further strategically located walkingroutes and it is important that this is built upon in future strategies for the region.
DINGLE PENINSULA TOURISM SURVEY 2010 13|
8 New Horizons for Irish Tourism (Mid-Term Review)Report of the Tourism Renewal Group (2009)9 Fáilte Ireland Tourism Facts 200910 Fáilte Ireland South West Regional Development Plan2008-2010
FIGURE 23: OVERALL SATISFACTION LEVELSWITH ACCOMMODATION – PRICE & QUALITY
(*SATISFIED & VERY SATISFIED)
FIGURE 24: OVERALL SATISFACTION LEVELS WITH FOOD –PRICE & QUALITY (*SATISFIED & VERY SATISFIED)
93.7%
84.5%
88.0%
86.9%
88.0%
96.0%
95.1%
92.0%
90.9%
84.6%
75.0% 80.0% 85.0% 90.0% 95.0% 100.0%
Hotels &Guesthouses
Rented/Self Catering
B&B’s
Caravan Site
Hostels
Quality Price
F
97.9%
97.4%
96.2%
92.1%
89.3%
97.9%
79.2%
95.2%
80.5%
79.2%
75.0% 80.0% 85.0% 90.0% 95.0% 100.0%
B&B’s
High Quality Restaurants
Hotels & Guesthouses
Pubs & Bars
Budget Restaurants
Price Quality
F
0.7%
1.4%
1.4%
12.2%
84.4%
1.2%
1.2%
2.5%
11.1%
84.0%
0.0% 20.0% 40.0% 60.0% 80.0% 100.0%
VeryDissatisfied
Dissatisfied
Neither
Satisfied
VerySatisfied
Price of Hiking Quality of Hiking
F
FIGURE 25: OVERALL SATISFACTION LEVELS WITH THEQUALITY AND PRICE OF HIKING/WALKING
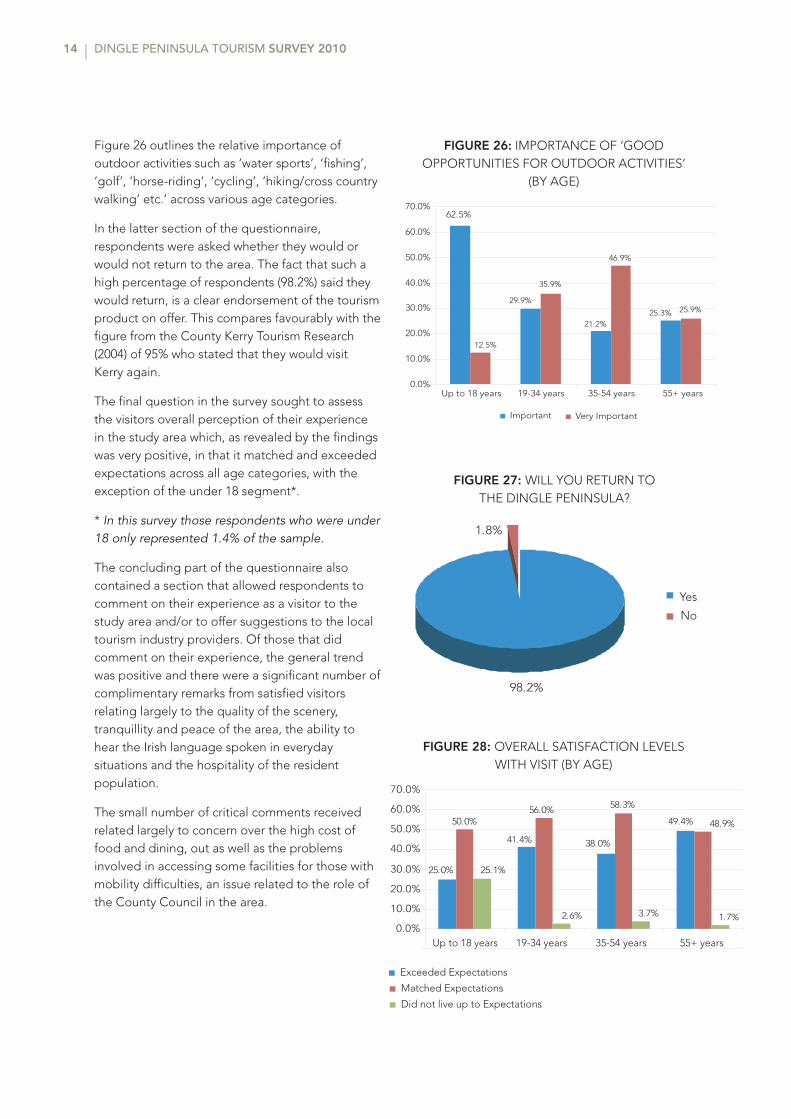
Figure 26 outlines the relative importance ofoutdoor activities such as ‘water sports’, ‘fishing’,‘golf’, ‘horse-riding’, ‘cycling’, ‘hiking/cross countrywalking’ etc.’ across various age categories.
In the latter section of the questionnaire,respondents were asked whether they would orwould not return to the area. The fact that such ahigh percentage of respondents (98.2%) said theywould return, is a clear endorsement of the tourismproduct on offer. This compares favourably with thefigure from the County Kerry Tourism Research(2004) of 95% who stated that they would visit Kerry again.
The final question in the survey sought to assessthe visitors overall perception of their experiencein the study area which, as revealed by the findingswas very positive, in that it matched and exceededexpectations across all age categories, with theexception of the under 18 segment*.
* In this survey those respondents who were under18 only represented 1.4% of the sample.
The concluding part of the questionnaire alsocontained a section that allowed respondents tocomment on their experience as a visitor to thestudy area and/or to offer suggestions to the localtourism industry providers. Of those that didcomment on their experience, the general trendwas positive and there were a significant number ofcomplimentary remarks from satisfied visitorsrelating largely to the quality of the scenery,tranquillity and peace of the area, the ability tohear the Irish language spoken in everydaysituations and the hospitality of the residentpopulation.
The small number of critical comments receivedrelated largely to concern over the high cost offood and dining, out as well as the problemsinvolved in accessing some facilities for those withmobility difficulties, an issue related to the role ofthe County Council in the area.
DINGLE PENINSULA TOURISM SURVEY 201014 |
FIGURE 26: IMPORTANCE OF ‘GOODOPPORTUNITIES FOR OUTDOOR ACTIVITIES’
(BY AGE)
FIGURE 27: WILL YOU RETURN TO THE DINGLE PENINSULA?
FIGURE 28: OVERALL SATISFACTION LEVELSWITH VISIT (BY AGE)
35.9%
46.9%
25.9%
62.5%
29.9%
21.2%25.3%
12.5%
0.0%
10.0%
20.0%
30.0%
40.0%
50.0%
60.0%
70.0%
Up to 18 years 19-34 years 35-54 years 55+ years
Important Very Important
F
98.2%
1.8%
Yes
No
50.0%
58.3%
25.0%
41.4% 38.0%
49.4%56.0%
48.9%
25.1%
2.6% 3.7% 1.7%0.0%
10.0%
20.0%
30.0%
40.0%
50.0%
60.0%
70.0%
Up to 18 years 19-34 years 35-54 years 55+ years
Exceeded Expectations
Matched Expectations
Did not live up to Expectations
F

Some points of interest extracted from the researchinclude:
V When questioned about the factors influencingtheir decision to holiday in the study area,95.6% and 93.5% identified ‘Friendly andHospitable People’ and ‘Beautiful Scenery’respectively as key factors. These core values ofpeople and place are at the heart of the Irishtourism offering, were ranked 1st and 2nd in the2009 Fáilte Ireland Visitor Attitudes Survey andwere identified as the features that deliverhigher satisfaction ratings relative to visitors’expectations.
V The high level of awareness (81%) ofrespondents to the fact they were in an Irishspeaking region is very encouraging for thearea. The 2004 County survey was critical of the‘lack of awareness and understanding’ oftourists about Gaeltacht regions. A strong andunique cultural identity is a desirable asset inthe competitive tourism environment of todayand unusual or distinctive features such as locallanguage can help to differentiate touristdestinations and make experiences morememorable for their visitors.
V National tourism surveys indicate the growinginfluence of the Internet which is cited as theprimary source of information by 48% of visitorsto Ireland (in 2009) compared to 29% in 2005.Figures also suggest that 84% of overseasholidaymakers to Ireland use the Internet tobook, or purchase some element of theirholiday. Although not directly comparable, thisstudy indicated that 24% of all overnightingvisitors used on-line resources to book theiraccommodation. The figure may actually behigher as the majority of respondents (29%)booked directly with the provider, manypresumably on the providers’ own website.Tourists want to be able to communicate
directly with their tourism providers – albeitonline and it is critical that providers respondeffectively by establishing an on-line profilewith an interactive booking facility. The surveyalso highlights the opportunities that may existfor tourism providers to expand their on-linepresence at a relatively low cost, perhaps byembracing social media (Facebook, Twitter,blogs etc.) as a means to communicate moreeffectively with a more technologically literateand enabled consumer.
V Advice from ‘a friend or relative’ was identified asthe most important information/referral sourcefor respondents with 45.1%. Word of mouthadvertising plays a critical role in supporting theformal marketing campaigns undertaken byFáilte Ireland and other organisations. Thefindings also again highlight the importance ofdelivering a quality experience to every visitor toencourage positive feedback and referrals tointending visitors.
V The largest international market to the studyarea is the U.S.A. with 17.6% of all visitors. Thetraditional entry point to the South West forU.S. visitors is Shannon airport, which in 2009experienced an overall decline of 23% intransatlantic arrivals, as carriers reducedcapacity due to the economic downturn11. Thisreduction in arrivals has obvious negativeimplications for West Kerry, so it is imperativethat the new management approach for theairport (new business model) be supported toat least maintain current transatlantic arrivallevels for the present, and to developstrategies to grow that market over time.
V The market from Great Britain (comprisingEngland, Scotland and Wales) is of primaryimportance to Ireland as our largest internationalmarket, contributing over 3m visitors annuallyand adding over €1bn to our economy12. Current
DINGLE PENINSULA TOURISM SURVEY 2010 15|
11 Shannon Airport Press Release, November 200912 Fáilte Ireland Tourism Facts 2009
Section Four
Implications of the Research
DINGLE PENINSULA TOURISM SURVEY 201016 |
statistics however, indicate a significant decline inthe market over the last number of years,culminating in a 15% drop in visitor numbersfrom Great Britain to Ireland in 2009. As the thirdlargest market to the study area, any decline inthe overall market will have serious implicationsfor the regions tourism industry.
V Closely linked to the decline in the market fromGreat Britain is the perceived reduction in valuefor money which British visitors receive whileholidaying in the Republic. In the survey ofVisitor Attitudes to Ireland13, only 41% of Britishvisitors stated they were very satisfied with the‘good all round value for money’ of Ireland,while 32% were dissatisfied. 41% also noted the‘high cost of living’ as a disadvantage toholidaying here. Figures indicate a 20% declinein the value of the euro to sterling in the last 3years, which only compounds the problem.Although exchange rates and currencyfluctuations are outside the control of thetourism industry in the study area, tourismproviders must offer more competitively pricedholiday experiences that give customers thequality they desire and the value for moneythey demand.
V Over half (50.8%) of all respondents were on afirst visit to the study area, exceeding thenational figure of 37%. Generating repeatbusiness in tourism is highly desirable, as themarketing costs of attracting a repeat customer
are lower and repeat custom is an indication ofcustomer satisfaction which could, in turn,generate positive word of mouth. Thechallenge for the industry is to persuade thosevisitors who have already experienced the WestKerry Gaeltacht to return. Supporting that taskis the fact that 97.9% of respondents statedthat they would return to the area again for aholiday, which is very encouraging.
V Finally, The Tourism Renewal Group Report(2009) offered three scenarios for Irish tourismover the medium term and at this point, theWorst Case Scenario (see Appendix B) looksthe most realistic of the three. Given theinternational economic situation at the time ofwriting of this report, it is incumbent on allstakeholders in tourism across the study area toredouble their efforts in relation to quality,price and promotion and to work together tooffer a unique tourism product.
LimitationsThis analysis had the following limitations:
V The format of the questionnaire did not allowfor elaboration when visitors assigned a lowrating to a particular area or issue.
V As this study is related to the Gaeltacht regiononly, it is difficult to make direct comparisonswith county, regional or national data.
13 Fáilte Ireland, Visitor Attitude Survey (VAS) 2009
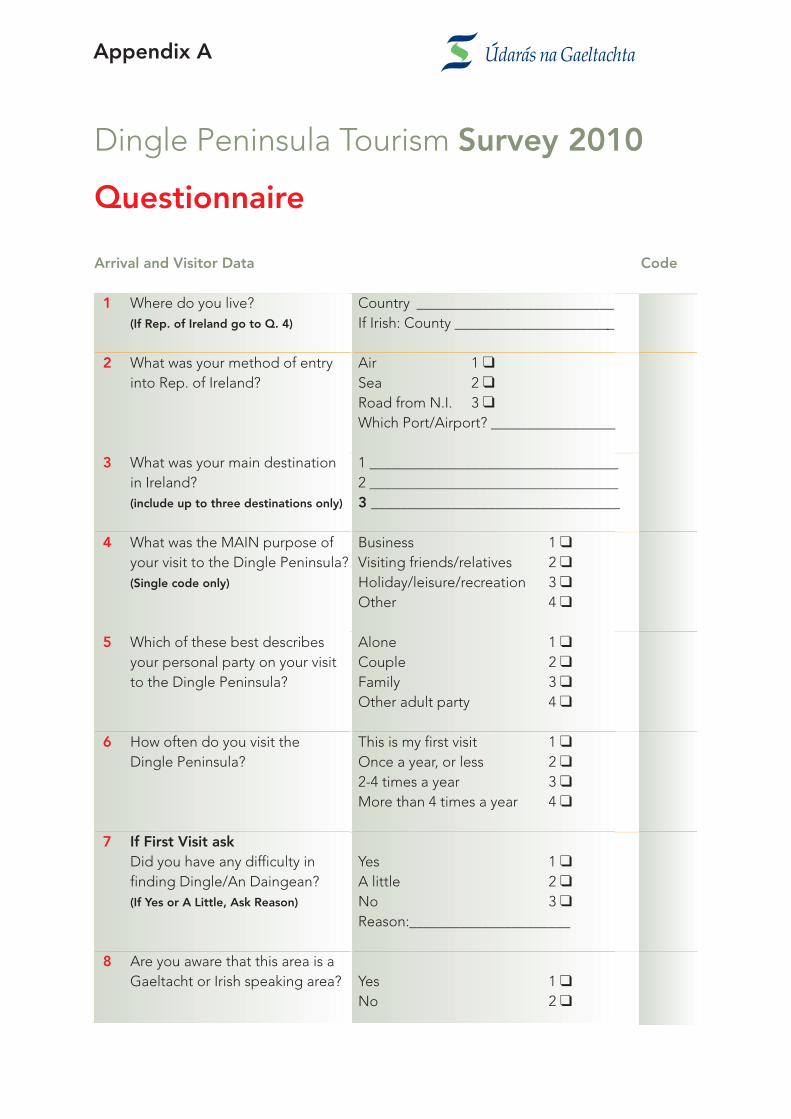
Dingle Peninsula Tourism Survey 2010
Questionnaire
Arrival and Visitor Data Code
1 Where do you live? Country ___________________________(If Rep. of Ireland go to Q. 4) If Irish: County ______________________
2 What was your method of entry Air 1 �into Rep. of Ireland? Sea 2 �
Road from N.I. 3 �Which Port/Airport? _________________
3 What was your main destination 1 __________________________________in Ireland? 2 __________________________________(include up to three destinations only) 3 __________________________________
4 What was the MAIN purpose of Business 1 �your visit to the Dingle Peninsula? Visiting friends/relatives 2 �(Single code only) Holiday/leisure/recreation 3 �
Other 4 �
5 Which of these best describes Alone 1 �your personal party on your visit Couple 2 �to the Dingle Peninsula? Family 3 �
Other adult party 4 �
6 How often do you visit the This is my first visit 1 �Dingle Peninsula? Once a year, or less 2 �
2-4 times a year 3 �More than 4 times a year 4 �
7 If First Visit askDid you have any difficulty in Yes 1 �finding Dingle/An Daingean? A little 2 �(If Yes or A Little, Ask Reason) No 3 �
Reason:______________________
8 Are you aware that this area is a Gaeltacht or Irish speaking area? Yes 1 �
No 2 �
Appendix A

Day/Overnight Patterns Code
9 How many nights will you spend 0 Night 1 �in Ireland? 1 Night 2 �(Skip if Irish) 2-3 Nights 3 �
4-7 Nights 4 �8+ Nights 5 �
10 How many nights will you spend 0 Night 1 �on the Dingle Peninsula? 1 Night 2 �
2-3 Nights 3 �4-7 Nights 4 �8+ Nights 5 �
11 If staying on the Dingle Peninsula – Directly withHow did you book your accommodation provider 1 �accommodation? On-line booking/central (Single colde only) reservations website 2 �
Through travel agent/tour operator 3 �Tourist Information Centre 4 �Didn’t book in advance 5 �Other 6 �
Information/Referral Source Code
12 Which, if any, of the following were important to you in choosing the Dingle Peninsula as a destination for your holiday?
Please Tick (�) Box(es) Below
Q.12Important in Choosing
V Travel Agent/Tour Operator 1 �V Irish Tourist Board literature 2 �V Other brochures/promotional literature on Ireland 3 �V Article(s) in newspaper(s)/magazine(s) 4 �V Advice from friend, relative or business associate 5 �V Guide Books 6 �V The Internet (If ticked – specify source)
___________________________________________ 7 �V Advertising 8 �V Travel programme on TV or radio 9 �V Films or movies 10 �V Other (Please specify) 11 �
DINGLE PENINSULA TOURISM SURVEY 201018 |

DINGLE PENINSULA TOURISM SURVEY 2010 19|
Influencing Factors for decision
13 BEFORE you came to the Dingle Peninsula, how important were the following in influencing your decision to come here?
On a scale of 1 to 5, where 1 is ‘not at all important’ and 5 is ‘very important’; please rate each attribute by putting your score in the box beside the statement.
1 2 3 4 5
Not at all NotNeither Important
VeryImportant Important Important
V Easy to get to �
V A range of good quality accommodation �
V Beautiful scenery �
V Friendly, hospitable people �
V Good range of historical and cultural attractions �
V Irish language still spoken in the area �
V Has good opportunities for outdoor activities such as watersports,
fishing, golf, horse-riding, cycling, hiking/cross-country walking etc �
V Good all round value for money �
V A variety of high quality food �
V Festivals and cultural events �
V Good evening entertainment/music/nightlife �

Activities/Pastimes
14 Which of the following activities did you engage or intend to engage in while on holiday on the Dingle Peninsula? (See Table 1 below)
15 And if you engaged in any of the following activities/pastimes, can you say whether you were satisfied with …(a) The quality(b) The price
1 2 3 4 5
Very Dissatisfied Dissatisfied Neither Satisfied Very Satisfied
Please rate each by putting a score between 1 and 5 inside the box below(1 = Very Dissatisfied and 5 = Very Satisfied). If Don’t Know, please tick (��) the box.
TABLE 1
Q14a Q.14b Q.15a) Q.15b)Intend to Engaged in Satisfaction Satisfaction
with Quality with price
Activities/Pastimes (Tick) (Tick) (Write in score 1-5) (Write in score 1-5)
Boat Trip � � � �
Cycling � � � �
Equestrian pursuits � � � �
Festival event � � � �
Fishing � � � �
Golf � � � �
Hiking/cross country walking � � � �
Music Session � � � �
Water Sports � � � �
Facilities VisitedHeritage Sites/Archaeology � � � �
Museum/Interpretative Centres � � � �
Pubs � � � �
DINGLE PENINSULA TOURISM SURVEY 201020 |

Accommodation and Food Satisfaction
16 Which of the following did you use while on holiday on the Dingle Peninsula?See Table 2 below(Note for Interviewer: If not staying overnight, skip Accommodation)
17 On a scale of 1 to 5, where 1 is ‘very dissatisfied’ and 5 is ‘very satisfied’, please rate(a) The quality on offer/customer service(b) The priceby writing in your score in the box beside each item
1 2 3 4 5
Very Dissatisfied Dissatisfied Neither Satisfied Very Satisfied
Please rate each by putting a score between 1 and 5 inside the box below(1 = Very Dissatisfied and 5 = Very Satisfied). If Don’t Know, don’t score.
TABLE 2
16a 16b Q.17a Q.17bIntend to Used Satisfaction with Satisfaction
Quality/Customer with priceservice
Accommodation (Tick) (Tick) (write in score 1-5) (write in score 1-5)
Hotel/Guesthouses � � � �
Other Accommodation � � � �
(e.g. B&Bs)Rented/Self catering � � � �
Second Home/Visiting Friends � � � �
or relatives (VFR)Hostel � � � �
Serviced caravan/camping site � � � �
FoodFood in hotels � � � �
Food in other accom (B+B) � � � �
Food in high quality restaurants � � � �
Food in budget restaurants � � � �
Food in pubs/bars � � � �
DINGLE PENINSULA TOURISM SURVEY 2010 21|

Overall Satisfaction Code
18a Overall would you say your visit Exceeded your expectations 1 �Please Tick (��) One Box Matched your expectations 2 �
Did not live up to your expectations 3 �
IF EXCEEDED:18b In what way did it exceed your expectations? Write in below
IF DID NOT LIVE UP TO YOUR EXPECTATIONS:18c In what way did it not live up to your expectations? Write in below
19 Will you return to the Dingle Peninsula? Yes 1 � No 2 �
20 Comments
DINGLE PENINSULA TOURISM SURVEY 201022 |

Respondent Data Code
21 Gender Male 1 � Female 2 �
22 What age bracket are you in? Up to 18 years 1 �19 – 34 years 2 �35 – 54 years 3 �55 + 4 �
23 What is the occupation of the chief wage earner in your household? If retired:What was the occupation of the chief wage earner before retirement?
Managerial/Professional 1 �Associate Professional & Technical: 2 �Clerical 3 �Craft/Manual 4 �Other 5 �
Occupation Notes
Managerial/Professional (include company/business manager, solicitor, doctor, accountant,architect, professors) –
High level of knowledge and experience and most occupations in this major group require a degree or equivalent qualification
Associate Professional & Technical: (include web designer, lab technician, medical/dentaltechnician, journalist, taxation expert, broker, teacher, nursa garda)
Covers occupations whose main tasks require experience and knowledge of principles andpractices necessary to assume operational responsibility and to give technical support toprofessionals.
Clerical (include secretarial and admin worker, sales, apprentices)
Craft/Manual (include mechanics, carpenters, brick layers, machine operators, farmers, fishermen)
Normally these are experts in designated trades
Other (include unemployed)
Úsáid OifigiúilDáta _________ Am ________ Ionad bailithe ________________ Ainm an bhailitheora ___________________
Síniú an bhailitheora _______________________________________________________________________________
DINGLE PENINSULA TOURISM SURVEY 2010 23|
|24 DINGLE PENINSULA TOURISM SURVEY 2010
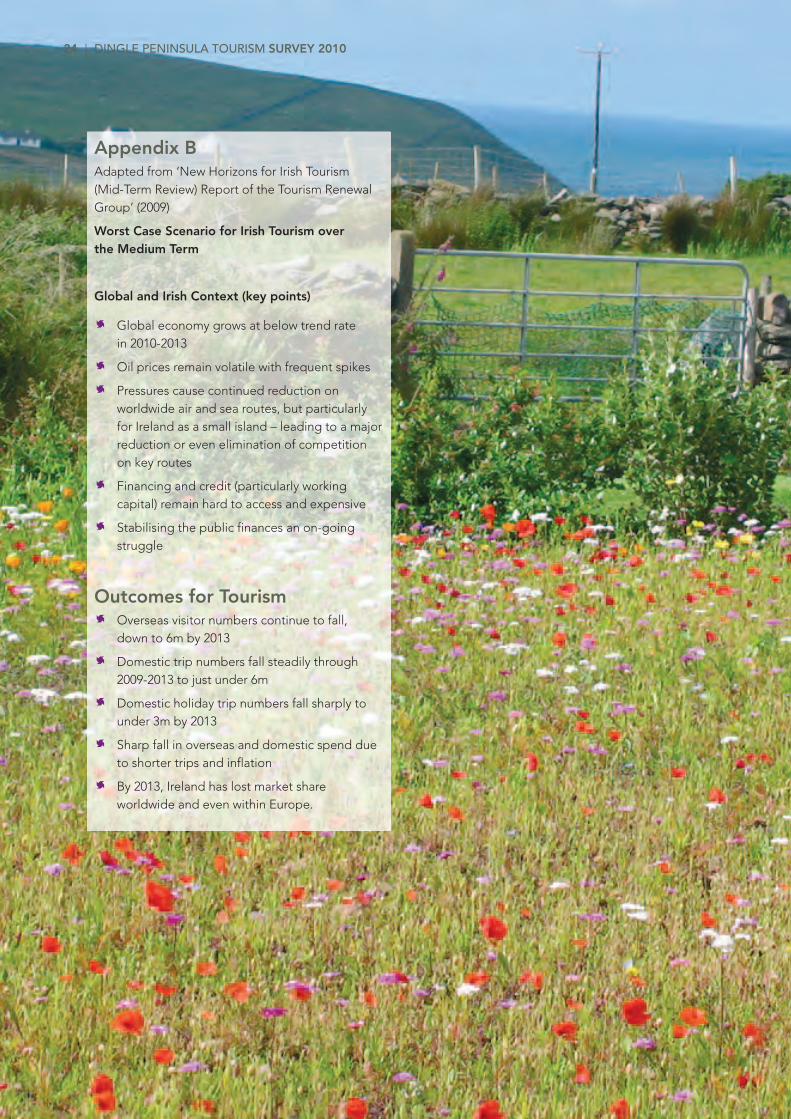
Appendix BAdapted from ‘New Horizons for Irish Tourism(Mid-Term Review) Report of the Tourism RenewalGroup’ (2009)
Worst Case Scenario for Irish Tourism over the Medium Term
Global and Irish Context (key points)
V Global economy grows at below trend rate in 2010-2013
V Oil prices remain volatile with frequent spikes
V Pressures cause continued reduction onworldwide air and sea routes, but particularlyfor Ireland as a small island – leading to a majorreduction or even elimination of competitionon key routes
V Financing and credit (particularly workingcapital) remain hard to access and expensive
V Stabilising the public finances an on-goingstruggle
Outcomes for TourismV Overseas visitor numbers continue to fall,
down to 6m by 2013
V Domestic trip numbers fall steadily through2009-2013 to just under 6m
V Domestic holiday trip numbers fall sharply tounder 3m by 2013
V Sharp fall in overseas and domestic spend dueto shorter trips and inflation
V By 2013, Ireland has lost market shareworldwide and even within Europe.