west loop development opportunity - baum realty
TRANSCRIPT
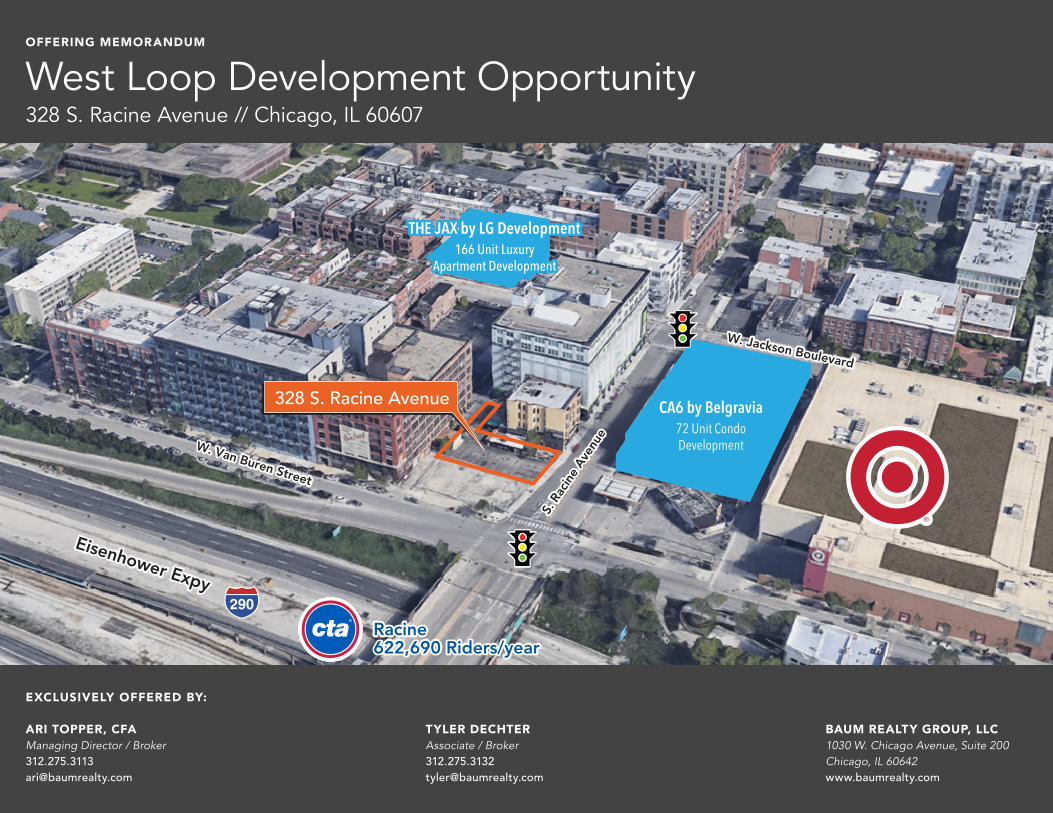
OFFERING MEMORANDUM
West Loop Development Opportunity 328 S. Racine Avenue // Chicago, IL 60607
Eisenhower Expy
Eisenhower Expy
328 S. Racine Avenue
S. R
acin
e Av
enue
W. Jackson Boulevard
W. Van Buren Street
S. R
acin
e Av
enue
W. Jackson Boulevard
W. Van Buren Street
Racine622,690 Riders/yearRacine622,690 Riders/year
290
CA6 by Belgravia72 Unit CondoDevelopment
CA6 by Belgravia72 Unit CondoDevelopment
THE JAX by LG Development166 Unit Luxury
Apartment Development
THE JAX by LG Development166 Unit Luxury
Apartment Development
EXCLUSIVELY OFFERED BY:
ARI TOPPER, CFA Managing Director / Broker 312.275.3113 [email protected]
TYLER DECHTER Associate / Broker 312.275.3132 [email protected]
BAUM REALTY GROUP, LLC 1030 W. Chicago Avenue, Suite 200 Chicago, IL 60642 www.baumrealty.com

2 // OFFERING MEMOR ANDUM
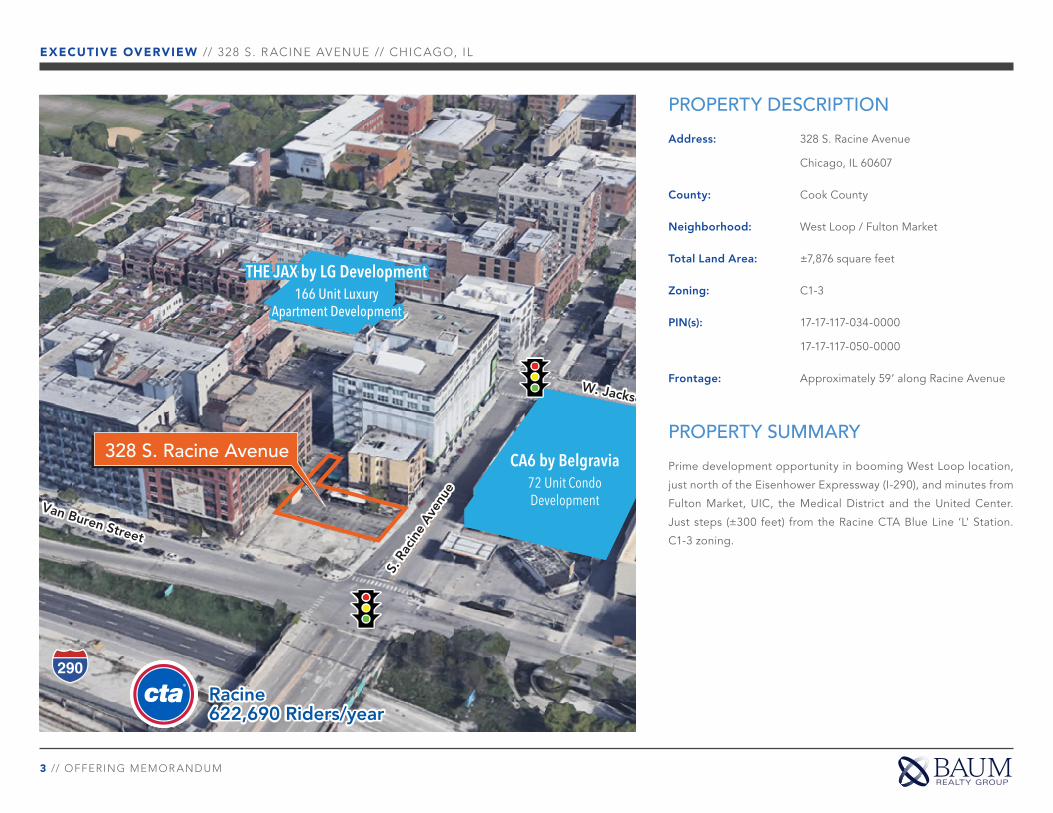
ExEcutivE OvErviEw // 328 S. R ACINE AVENUE // CHICAGO, IL
Offering Summary PROPERTY HIGHLIGHTS Î ±7,876 SF development opportunity in prime West Loop /
Fulton Market location
Î Located ±300 feet from Racine CTA Blue Line ‘L’ Station
(622,690 riders in 2019)
Î West Loop / Fulton Market is one of Chicago’s most desir-
able and densely populated residential neighborhoods
with a median HHI of $120,595 within 0.5 miles
Î C1-3 zoning
ASKING PRICE: SUBJECT TO OFFER
Eisenhower Expy
Eisenhower Expy
290
S. Racine AvenueW. Van Buren Street S. Racine AvenueW. Van Buren Street
328 S. Racine Avenue
Racine622,690 Riders/year
Racine622,690 Riders/year
CA6 by Belgravia72 Unit CondoDevelopment
CA6 by Belgravia72 Unit CondoDevelopment
3 // OFFERING MEMOR ANDUM
ExEcutivE OvErviEw // 328 S. R ACINE AVENUE // CHICAGO, IL
PROPERTY DESCRIPTION
Address: 328 S. Racine Avenue
Chicago, IL 60607
County: Cook County
Neighborhood: West Loop / Fulton Market
Total Land Area: ±7,876 square feet
Zoning: C1-3
PIN(s): 17-17-117-034-0000
17-17-117-050-0000
Frontage: Approximately 59’ along Racine Avenue
PROPERTY SUMMARY
Prime development opportunity in booming West Loop location,
just north of the Eisenhower Expressway (I-290), and minutes from
Fulton Market, UIC, the Medical District and the United Center.
Just steps (±300 feet) from the Racine CTA Blue Line ‘L’ Station.
C1-3 zoning.
Eisenhower Expy
Eisenhower Expy
328 S. Racine Avenue
S. R
acin
e Av
enue
W. Jackson Boulevard
W. Van Buren Street
S. R
acin
e Av
enue
W. Jackson Boulevard
W. Van Buren Street
Racine622,690 Riders/yearRacine622,690 Riders/year
290
CA6 by Belgravia72 Unit CondoDevelopment
CA6 by Belgravia72 Unit CondoDevelopment
THE JAX by LG Development166 Unit Luxury
Apartment Development
THE JAX by LG Development166 Unit Luxury
Apartment Development

4 // OFFERING MEMOR ANDUM
ExEcutivE OvErviEw // 328 S. R ACINE AVENUE // CHICAGO, IL
W. VAN BUREN STREET
FRAMEGARAGE
20’ DrivewayAccess
Easement
EXISTING CURB CUT
Open
Fram
e Po
rch
ENTRY
ENTR
YDO
OREN
TRY
CONCRETE PATIO
ASPHALT PAVEMENT
4-STORY BRICK BUILDING
1-STORY FRAME6-
STOR
Y BRI
CK B
UILD
ING
8-STORY BRICK BUILDING
20’ ALLEY
123.43’
59.00’
128.03’
25.12’34.18’
25.12’34.18’
16’ A
LLEY
S. R
ACI
NE
AVE
NU
E
SURVEY
5 // OFFERING MEMOR ANDUM
ExEcutivE OvErviEw // 328 S. R ACINE AVENUE // CHICAGO, IL

6 // OFFERING MEMOR ANDUM
ExEcutivE OvErviEw // 328 S. R ACINE AVENUE // CHICAGO, IL

7 // OFFERING MEMOR ANDUM
ExEcutivE OvErviEw // 328 S. R ACINE AVENUE // CHICAGO, IL
8 // OFFERING MEMOR ANDUM
thE MarkEt // 328 S. R ACINE AVENUE // CHICAGO, IL
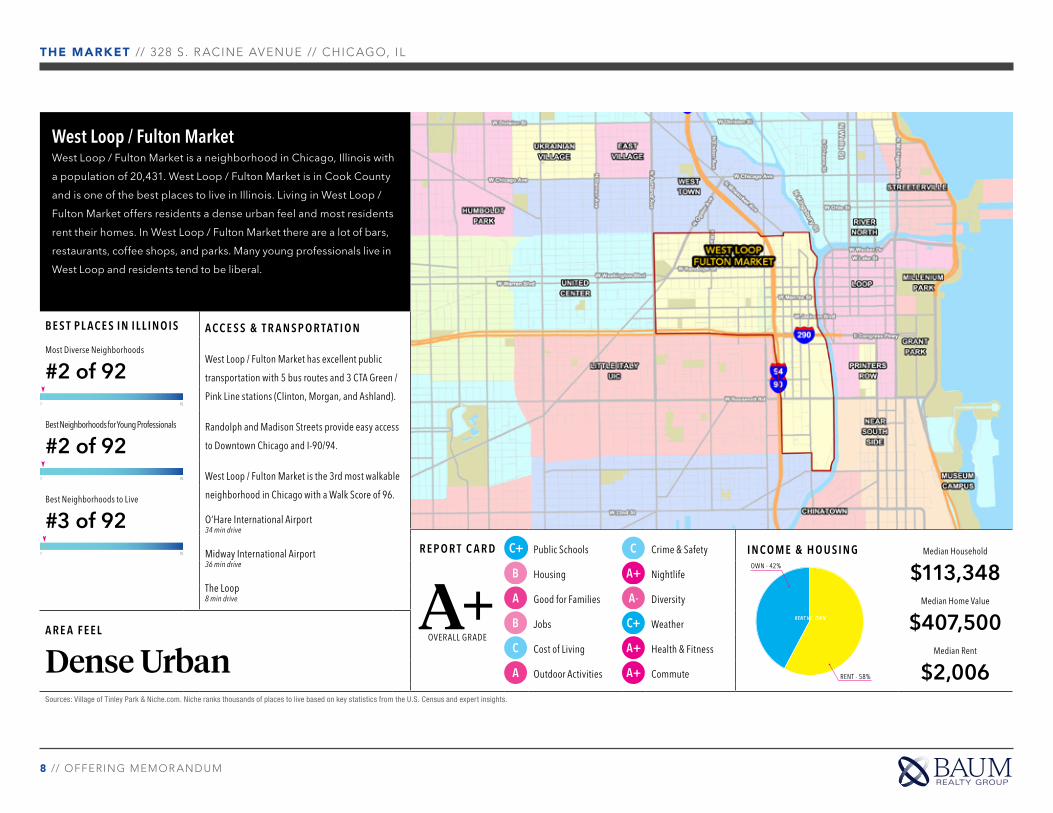
West Loop / Fulton MarketWest Loop / Fulton Market is a neighborhood in Chicago, Illinois with a population of 20,431. West Loop / Fulton Market is in Cook County and is one of the best places to live in Illinois. Living in West Loop / Fulton Market offers residents a dense urban feel and most residents rent their homes. In West Loop / Fulton Market there are a lot of bars, restaurants, coffee shops, and parks. Many young professionals live in West Loop and residents tend to be liberal.
B E S T PL AC E S IN IL L IN O IS A CC E S S & T R A N S P O R TAT I O N
West Loop / Fulton Market has excellent public
transportation with 5 bus routes and 3 CTA Green /
Pink Line stations (Clinton, Morgan, and Ashland).
Randolph and Madison Streets provide easy access
to Downtown Chicago and I-90/94.
West Loop / Fulton Market is the 3rd most walkable
neighborhood in Chicago with a Walk Score of 96.
O’Hare International Airport 34 min drive
Midway International Airport 36 min drive
The Loop 8 min drive
Most Diverse Neighborhoods
#2 of 92921
Best Neighborhoods for Young Professionals
#2 of 92921
Best Neighborhoods to Live
#3 of 92921 R E P O R T C A R D
A+ OVERALL GRADE
Public Schools Crime & Safety I N CO M E & H O U S I N G Median Household
$113,348Housing NightlifeOWN - 42%
RENT - 58%
RENT VS. OWN
Good for Families Diversity Median Home Value
$407,500A R E A F E E L
Dense UrbanJobs Weather
Cost of Living Health & Fitness Median Rent
$2,006Outdoor Activities Commute
Sources: Village of Tinley Park & Niche.com. Niche ranks thousands of places to live based on key statistics from the U.S. Census and expert insights.

9 // OFFERING MEMOR ANDUM
thE MarkEt // 328 S. R ACINE AVENUE // CHICAGO, IL
Chicago Economic OverviewChicago Economic Overview3rD LarGESt MSa iN thE u.S.
The Chicago MSA is home to approximately
9.5 million residents, making it the third most
populous region in the country, encompass-
ing 16 counties across three states: Illinois,
Indiana, and Wisconsin. The city of Chicago
is the economic and cultural capital of the
Midwest, featuring a vibrant downtown dis-
trict that is filled with world class businesses,
restaurants, retail, residences, and enter-
tainment. The strong economic base, skilled
labor pool and diverse background make this
24-hour metropolis one of the most import-
ant and influential in the world.
Source: world population review
GrOwiNG urBaN cOrE
Chicago's urban core and surrounding
neighborhoods has become noticeably
more dense. In the last several years,
according to a report by The New York
Times, between 2010 and 2016, Chicago’s
density has increased by 1.2%.
The report suggests that the city’s popula-
tion is shifting and refocusing with an influx
of younger, more affluent residents moving
into areas like the Loop, West Loop, and
Wicker Park.
10 SAN JOSE
5 PHOENIX
9 DALLAS
4 HOUSTON7 SAN ANTONIO
6 PHILADELPHIA1 NEW YORK3 chicaGO
2 LOS ANGELES
8 SAN DIEGO
Chan
ge In
Den
sity
Change In Population
ChicagoNew York D.C.
Seattle
Tampa
Okalhoma City
San Antionio
Houston
Dallas
Nashville
Raleigh
Austin
0%
-4%
-2%
0%
2%
+5% +10% +15% +20%
Less Dense
More DenseCharlotte
POPuLatiON DENSitY chaNGE iN u.S. MEtrO arEaS (2010-2016)
RANK CITY 2019 POPULATION
1 New York 8,601,186
2 Los Angeles 4,057,841
3 Chicago 2,679,044
4 Houston 2,359,480
5 Phoenix 1,711,356
6 Philadelphia 1,576,596
7 San Antonio 1,565,929
8 San Diego 1,453,775
9 Dallas 1,379,735
10 San Jose 1,033,519
raNk & POPuLatiON BY u.S. citY

10 // OFFERING MEMOR ANDUM
thE MarkEt // 328 S. R ACINE AVENUE // CHICAGO, IL
#1 FOr cOrPOratE rELOcatiON & iNvEStMENt
Chicago remains the #1 ranked metro area for Corporate Relocation and Investment
in the US in Site Selection Magazine, a title it has held for six consecutive years and
Chicago lead all major cities in the Americas except for New York for Foreign Direct
Investment (FDI) Strategy according to fDi Magazine. Since Q1 2018, Canada-based
BMO Financial Group, Italy-based Ferrara Candy, Germany-based navigation com-
pany HERE, and UK based digital agency AmazeRealise have all announced plans
to establish headquarters in Chicago. Additionally, more than 30 corporations
have moved their operations from surrounding suburbs since 2015, to the Chicago
metro area. Most recently, McDonald's moved their global headquarters from
Oak Brook to a new $250M building in the West Loop.
Start uP aND tEch huB
Chicago is home to tech industry giants and is a hotbed for privately held startups
in the Midwest. Chicago has one of the largest venture capital ecosystems in the
US and was ranked the #1 US city for venture capital returns in 2019 by PitchBook,
a leading source for venture capital and private equity data research. In 2018, Chicago
saw $1.86 billion in venture capital investments. Facebook expanded their opera-
tions in Chicago, leasing 263,000 SF downtown and Google signed a lease for over
200,000 SF at 210 N. Carpenter Street in the West Loop, just down the street from
their Midwest HQ at 1K Fulton. Salesforce, a global leader in CRM, announced a they
will occupy 500,000 SF in the new 60-story Salesforce Tower Chicago, in a move that
will significantly expand Salesforce's regional HQ and add 1,000 new tech jobs over
the next five years. Salesforce employees will start moving into the Salesforce Tower
Chicago upon completion which is slated for 2023.
" Reflecting a melding of corporate and entrepreneurial cultures, Chicago has more than 100 startup incubators and accelerators and more than 300 corporate R&D centers."
Site Selection Magazine
Salesforce Tower rendering
McDonald's Global HQ

11 // OFFERING MEMOR ANDUM
thE MarkEt // 328 S. R ACINE AVENUE // CHICAGO, IL
GLOBaL citY
Chicago ranks 8th for the second year in a row on the A.T. Kearney 2019 Global Cities Index,
which examines cities’ performance based metrics spanning five dimensions: business activ-
ity, human capital, information exchange, cultural experience, and political engagement.
Chicago ranks 6th on fDi's American Cities of the Future 2019/20 report, which benchmarks
cities based on five categories: Economic Potential, Business Friendliness, Human Capital
and Lifestyle, Cost Effectiveness and Connectivity. Chicago had the biggest movement in
this year’s top 10, rising nine places to 6th. In 2018, Chicago attracted 49 FDI projects, its
highest such figures since FDI Markets records began in 2003. Most FDI investments were
in sales, marketing and support, business services and headquarters activities (together
accounting for more than three-quarters of Chicago’s inward FDI).
wOrLD cLaSS EDucatiON
The Chicago MSA is home to several world class higher education universities that provide
the area with a constant supply of top job talent and disposable income. On average there
are 145,000 annual graduates from 138 degree-granting colleges and universities.
Top universities in the area include Northwestern University, The University of Chicago,
Illinois Institute of Technology, Loyola University Chicago, De Paul University, Columbia
College Chicago and, University of Illinois at Chicago.
The Global Cities Index examines the current performance of 130 cities based on 27 metrics spanning five dimensions: business activity, human capital, information exchange, cultural experience, and political engagement. The Index provides insights into the global reach, performance, and level of development of the world’s largest cities. Source: A.T. Kearney Global Cities 2019.
218 locations were analyzed for the study under five categories: Economic Potential, Business Friendliness, Human Capital and Lifestyle, Cost Effectiveness and Connectivity, which were weighted by importance to the FDI decision-making process in order to compile both subcategory rankings and the overall ‘American Cities of the Future 2019/20’ ranking.Source: fDi Magazine. Research and data by fDi Intelligence division of the Financial Times, 2019.
"The Windy City, the Second City, the Dark City – call it what you will, Chicago is the economic and cultural capital of the Midwest."Wired Magazine
Global Cities Index American Cites of the Future
Top 10 Global Cities 2019 Top 10 Overall American Cities of the Future 2019/20
CITY RANK CITY RANK
New York 1 New York 1
London 2 San Francisco 2
Paris 3 Toronto 3
Tokyo 4 Montreal 4
Hong Kong 5 Houston 5
Singapore 6 Chicago 6
Los Angeles 7 Boston 7
Chicago 8 Los Angeles 8
Beijing 9 Palo Alto 9
Washington DC 10 Seattle 10
12 // OFFERING MEMOR ANDUM
thE MarkEt // 328 S. R ACINE AVENUE // CHICAGO, IL
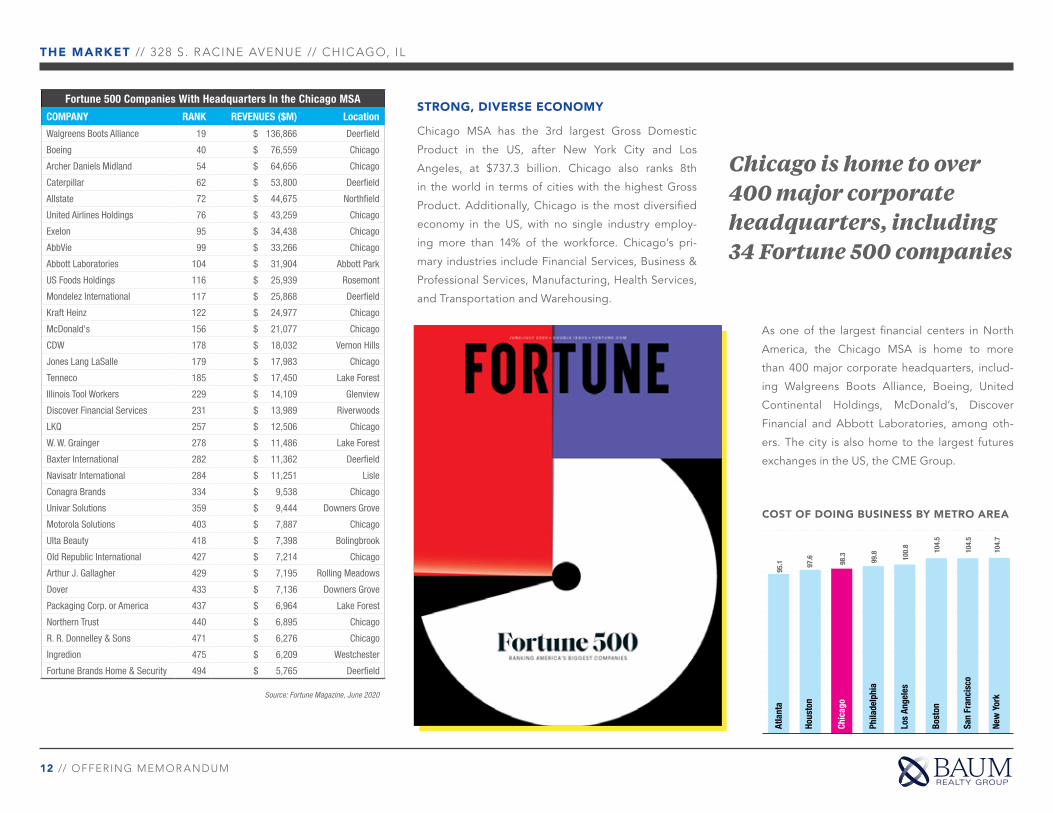
StrONG, DivErSE EcONOMY
Chicago MSA has the 3rd largest Gross Domestic
Product in the US, after New York City and Los
Angeles, at $737.3 billion. Chicago also ranks 8th
in the world in terms of cities with the highest Gross
Product. Additionally, Chicago is the most diversified
economy in the US, with no single industry employ-
ing more than 14% of the workforce. Chicago’s pri-
mary industries include Financial Services, Business &
Professional Services, Manufacturing, Health Services,
and Transportation and Warehousing.
As one of the largest financial centers in North
America, the Chicago MSA is home to more
than 400 major corporate headquarters, includ-
ing Walgreens Boots Alliance, Boeing, United
Continental Holdings, McDonald’s, Discover
Financial and Abbott Laboratories, among oth-
ers. The city is also home to the largest futures
exchanges in the US, the CME Group.
Fortune 500 Companies With Headquarters In the Chicago MSA
COMPANY RANK REVENUES ($M) Location
Walgreens Boots Alliance 19 $ 136,866 Deerfield
Boeing 40 $ 76,559 Chicago
Archer Daniels Midland 54 $ 64,656 Chicago
Caterpillar 62 $ 53,800 Deerfield
Allstate 72 $ 44,675 Northfield
United Airlines Holdings 76 $ 43,259 Chicago
Exelon 95 $ 34,438 Chicago
AbbVie 99 $ 33,266 Chicago
Abbott Laboratories 104 $ 31,904 Abbott Park
US Foods Holdings 116 $ 25,939 Rosemont
Mondelez International 117 $ 25,868 Deerfield
Kraft Heinz 122 $ 24,977 Chicago
McDonald's 156 $ 21,077 Chicago
CDW 178 $ 18,032 Vernon Hills
Jones Lang LaSalle 179 $ 17,983 Chicago
Tenneco 185 $ 17,450 Lake Forest
Illinois Tool Workers 229 $ 14,109 Glenview
Discover Financial Services 231 $ 13,989 Riverwoods
LKQ 257 $ 12,506 Chicago
W. W. Grainger 278 $ 11,486 Lake Forest
Baxter International 282 $ 11,362 Deerfield
Navisatr International 284 $ 11,251 Lisle
Conagra Brands 334 $ 9,538 Chicago
Univar Solutions 359 $ 9,444 Downers Grove
Motorola Solutions 403 $ 7,887 Chicago
Ulta Beauty 418 $ 7,398 Bolingbrook
Old Republic International 427 $ 7,214 Chicago
Arthur J. Gallagher 429 $ 7,195 Rolling Meadows
Dover 433 $ 7,136 Downers Grove
Packaging Corp. or America 437 $ 6,964 Lake Forest
Northern Trust 440 $ 6,895 Chicago
R. R. Donnelley & Sons 471 $ 6,276 Chicago
Ingredion 475 $ 6,209 Westchester
Fortune Brands Home & Security 494 $ 5,765 Deerfield
Source: Fortune Magazine, June 2020
Atla
nta
Hous
ton
Chic
ago
Phila
delp
hia
Los
Ange
les
Bost
on
San
Fran
cisc
o
New
Yor
k
95.1 97
.6
98.3
99.8 100.
8
104.
5
104.
5
104.
7
cOSt OF DOiNG BuSiNESS BY MEtrO arEa
Chicago is home to over 400 major corporate headquarters, including 34 Fortune 500 companies

13 // OFFERING MEMOR ANDUM
thE MarkEt // 328 S. R ACINE AVENUE // CHICAGO, IL
iNtErNatiONaL travEL DEStiNatiON
Chicago’s tourism totals have consistently been on the rise in recent years, growth in 2018
was more substantial than normal. A record 57.6 million people visited chicago in 2018,
nearly a 4.3% increase over 2017's record of 55.2 million. The largest percentage of growth
was domestic travel with a 4.4% increase over 2017. International visitor numbers also
increased 2.9% over 2017.
The record setting numbers were due, in part, to several initiatives that boosted leisure
travel as well as word-of-mouth and high-profile kudos. Condé Nast Traveler readers voted
Chicago the number 1 big city in the US two years in a row, Bon Appétit magazine named
Chicago “restaurant city of the year” in 2017, and the Financial Times called Chicago “the
most architecturally aware city on earth.” Part of the boost also came from the city's aggres-
sive pursuit of big-tourist draws including the NFL Draft, the James Beard Foundation
Awards and the Laver Cup. The city also bolstered tourism-friendly offerings with attractions
like the Riverwalk and, more recently, Art on the Mart. Business travel also contributed to the
bump, with an 3.5% in 2018. 59 new major conventions have committed to meet in Chicago
in future years.
DuaL-huB airPOrt SYStEM
O’Hare International Airport and Midway International Airport, the
only “dual-hub” airport system in North America, handled over
195 million passengers in 2019. Both airports have direct rail access
to Downtown Chicago and modernization projects are happening at
both O’Hare and Midway. Most notably O’Hare’s $8.5 billion plan to
expand over the next decade which includes a new airfield, terminal,
gates, and passenger perks. Midway’s improvements are budgeted
at $400 million and include restaurants, upgraded passenger screen-
ing, and updated parking infrastructure.
O'Hare is the busiest airport in the world for flight operations and is
among the few airports worldwide that rank in the top 20 for both
passenger volume and cargo tonnage - two leading indicators of an
airport's connectivity and economic strength.
57.6 million tOtaL viSitOrS iN 2018
4.4% IncreaseiN viSitOrS 2007-2018
“Dual-hub” airport system with O'Hare International Airport and Midway
International Airport combining for more than 195 million annual passengers.
In the US
MostForeign Direct
Investment(FDI) 2017
BestRestaurant
City
BestConnected
Airport
BestBig City
BestDowntown
among US big cities
MostDiversifedEconomy

14 // OFFERING MEMOR ANDUM
thE MarkEt // 328 S. R ACINE AVENUE // CHICAGO, IL
DEMOGRAPHIC SUMMARY2000-2010 Census, 2020 Estimates with 2025 Projections
.25 mile .5 mile 1 mile
Popu
latio
n
2020 Estimated Population 2,613 13,603 40,000
2025 Projected Population 2,965 15,781 43,489
2010 Population (U.S. Census) 1,735 12,048 35,205
2000 Population (U.S. Census) 954 8,031 26,826
% Projected Growth 2017-2022 13.5% 16.0% 8.7%
% Historical Growth 2000-2017 173.9% 69.4% 49.1%
2020 Median Age 31.6 34.1 33.2
Hous
ehol
ds
2020 Estimated Households 1,265 7,070 20,801
2025 Projected Households 1,451 8,376 22,961
2010 Total Households (U.S. Census) 827 6,195 17,757
2000 Total Households (U.S. Census) 431 3,614 12,442
% HH Projected Growth 2017-2022 14.7% 18.5% 10.4%
% HH Historical Growth 2000-2017 193.5% 95.6% 67.2%
Inco
me 2020 Average Household Income $146,934 $158,382 $135,585
2020 Median Household Income $109,839 $120,595 $101,842
2020 Per Capita Income $75,174 $82,028 $71,618
Busi
ness 2020 Total Businesses 177 1,026 4,413
2020 Total Employees 9,018 27,078 138,225
2020 Estimated Daytime Population 8,981 25,775 107,823
Educ
atio
n (A
ge 2
5+)
2020 Adult Population (Ages 25+) 1,841 10,136 29,630
2020 Elementary (Grade Level 0 to 8) 2.3% 1.7% 1.7%
2020 Some High School (Grade Level 9 to 11) 2.9% 2.3% 3.6%
2020 High School Diploma 5.5% 5.3% 7.0%
2020 Some College/No Degree 5.1% 6.9% 7.9%
2020 Associate Degree 2.2% 1.6% 2.8%
2020 Bachelor Degree 38.3% 39.3% 38.0%
2020 Graduate Degree 43.1% 41.9% 38.0%
% Any College 88.7% 89.7% 86.6%
Race
& E
thni
city
2020 White Population 56.3% 63.3% 53.3%
2020 Black/African American Population 17.8% 11.4% 19.9%
2020 Asian Population 20.2% 20.0% 20.7%
2020 American Indian/Alaska Native Population 0.2% 0.2% 0.2%
2020 Pacific Islander Population 0.0% 0.1% 0.1%
2020 Other Race 2.5% 2.0% 2.4%
2020 Population of Two or More Races 3.1% 3.1% 3.3%
2020 Hispanic Population 59.3% 66.2% 59.4%
Source: Esri, Esri and Infogroup, U.S. Census
DEMOGraPhicS
.25 MileEstimated Population: 2,613
Daytime Population: 8,981
Estimated Households: 1,265
Average Household Income: $146,934
.5 MileEstimated Population: 13,603
Daytime Population: 25,774
Estimated Households: 7,070
Average Household Income: $158,382
1 MileEstimated Population: 40,000
Daytime Population: 107,823
Estimated Households: 20,801
Average Household Income: $135,585
15 // OFFERING MEMOR ANDUM
cONFiDENtiaLit Y DiScLOSurE // 328 S. R ACINE AVENUE // CHICAGO, IL
Confidentiality DisclosureBaum Realty Group, LLC (“Baum”) has been retained as the exclusive broker by the Owner of Record (“the Owner”) of 328 S. Racine Avenue in Chicago, IL in connection with the sale of certain
properties (“the Property”) as described in this Offering Memorandum.
This Offering Memorandum has been prepared by Baum for use by a limited number of parties, and does not purport to provide a necessarily accurate summary of the physical or economic
aspects of the Property or any of the documents related thereto, nor does it purport to be all inclusive or to contain all of the information which prospective investors may need or desire fur-
ther, the Offering Memorandum is limited to the matters set forth therein. All budgets or projections have been developed by Baum and Owner, and are based upon assumptions relating to
the general economy, competition, and other factors beyond the control of the Owner and Baum and therefore are subject to variation. Each of Baum and Owner makes no representation as
to the accuracy or completeness of the information contained herein, and nothing contained herein is, or shall be relied on as a promise or representation as to the future performance of the
Property. Although the information contained herein is believed to be correct, Baum and its employees, and Owner, and its trustees, officers, and employees disclaim any and all liability for
representations and warranties, expressed and implied, contained in, or omissions from the Offering Memorandum or any other written or oral communication transmitted or made available
to the recipient. The Offering Memorandum does not constitute a representation that there has been no change in the business or affairs of the Property Owner as of the date of preparation
of the Offering Memorandum.
Additional information and an opportunity to inspect the Property will be made available upon written request to interested and qualified prospective investors.
Owner expressly reserves the right, at its sole discretion, to reject any or all expressions of interest or offers regarding the property, and/or terminate discussions with any entity at any time
with or without notice. Owner shall have no legal commitment or obligations to any entity reviewing the Offering Memorandum or making an offer to purchase the property unless and until
such offer is approved by Owner and the Board of Trustees of Owner and a written agreement for the purchase of the Property has been fully executed, delivered and approved by Owner and
its legal counsel, and any conditions to Owner’s obligations hereunder have been satisfied or waived.
This Offering Memorandum and the contents, except such information that is a matter of public record or is provided in sources available to the public, are of a confidential nature. By accepting
this Offering Memorandum, you acknowledge that you have executed, and have agreed to be bound by, the Confidentiality Agreement with Baum and Owner.

OFFERING MEMORANDUM
West Loop Development Opportunity 328 S. Racine Avenue // Chicago, IL 60607
Eisenhower Expy
Eisenhower Expy
328 S. Racine Avenue
S. R
acin
e Av
enue
W. Jackson Boulevard
W. Van Buren Street
S. R
acin
e Av
enue
W. Jackson Boulevard
W. Van Buren Street
Racine622,690 Riders/yearRacine622,690 Riders/year
290
CA6 by Belgravia72 Unit CondoDevelopment
CA6 by Belgravia72 Unit CondoDevelopment
THE JAX by LG Development166 Unit Luxury
Apartment Development
THE JAX by LG Development166 Unit Luxury
Apartment Development
EXCLUSIVELY OFFERED BY:
ARI TOPPER, CFA Managing Director / Broker 312.275.3113 [email protected]
TYLER DECHTER Associate / Broker 312.275.3132 [email protected]
BAUM REALTY GROUP, LLC 1030 W. Chicago Avenue, Suite 200 Chicago, IL 60642 www.baumrealty.com