western australia 2016 - transport.wa.gov.au · iron ore accounted for 55 per cent ... highlights...
TRANSCRIPT

Ports Handbook Western Australia 2016
Department ofTransport

CONTENTS
FOREWORD FROM THE MINISTER
INTRODUCTION
Western Australian port authorities 2015/16 trade volumes Western Australian port authorities 2015/16 marine boundaries and State resources
FREMANTLE PORT AUTHORITY Port of Fremantle
KIMBERLEY PORTS AUTHORITY Port of Broome
MID WEST PORTS AUTHORITY Port of Geraldton
PILBARA PORTS AUTHORITY Port of Dampier Port of Port Hedland Port of Ashburton
SOUTHERN PORTS AUTHORITY Port of Albany Port of Bunbury Port of Esperance
OTHER PORTS Port of Wyndham
CONTACTS
Cover: Port of Port Hedland Harbour
Port of Esperance
3
4
5
6
8 8
12 12
15 15
18 19 21 23
24 26 27 28
30 32
34
The Ports Handbook is updated annually, and is available on the Department of Transport website: www.transport.wa.gov.au
22

FOREWORD FROM THE MINISTER
Western Australia’s ports are crucial to the State’s connection with global markets. This connection provides our State with limitless trade opportunities, and is built on the State’s reputation as a safe and reliable trading partner.
As one of the most isolated places in the world, Western Australia relies heavily on shipping for imports and exports. Shipping remains the most cost effective mode of transport, and is especially important for our bulk exports to remain internationally competitive. In 2015/16, mineral and petroleum exports accounted for 92 per cent ($91.6 billion) of Western Australia’s merchandise exports. Iron ore accounted for 55 per cent ($49.4 billion) of Western Australia’s minerals and petroleum sales in 2015/16.1
Western Australia’s ports have demonstrated strong resilience despite challenging global and national economic conditions. As the State adapts to a new phase of the business cycle, many mining projects have moved from construction to production.
Demand for the State’s exports remains strong, with Western Australia exporting more than 876 million tonnes during the 2015/16 financial year. Total trade volumes have increased from 429 million tonnes in 2010/11, to 896 million tonnes in 2015/16. Compared to 2014/15, total trade volume increased by 5 per cent.
The State Government recognises the significance of Western Australia’s port infrastructure, and has allocated funding of $663.2 million over the next four years to all port authorities as part of the State’s Asset Investment Program. This comprises $255.3 million for the Fremantle Port Authority, $16.3 million for Kimberley Ports Authority, $29.1 million for Mid West Ports Authority, $313.1 million for Pilbara Ports Authority and $49.3 million for the Southern Ports Authority.
The State Government continues to pursue initiatives to support Western Australia’s ports, including the implementation of the WA Ports Governance Review, which is progressing well.
The benefits from the first tranche of legislative reforms are being realised, with new arrangements that were introduced in 2014 having strengthened port governance, expanding port authority planning perspectives across their regions and strengthening the involvement of the State’s ports in the planning of future transport corridors.
The second tranche of legislative reforms will provide for the progressive transfer of the State’s Shipping and Pilotage Act 1967 ports to come under the jurisdiction of regional ports authorities.
I am pleased with the progress of port governance initiatives, ports planning and infrastructure development, and am confident that our ports will continue to contribute significantly to the State’s economic and social prosperity enjoyed by Western Australians.
Hon Bill Marmion MLA Minister for Transport
1 Source: Department of State Development Western Australia Economic Profile November 2016.
33

Western Australia has continued to experience substantial growth in seaborne trade, despite considerable challenges posed by fluctuating commodity prices and exchange rates and a softening of the WA economy.
WA’s exports accounted for more than 876 million tonnes in 2015/16. Compared to 2014/15, total trade volume increased by 5 per cent.
Our State accounted for 41 per cent of Australia’s merchandise exports in 2015/16, including large proportions of national exports to China (64 per cent), Japan (40 per cent) and Korea (37 per cent).1
As the main minerals and petroleum exporting state in Australia, our proximity to the growing markets of Asia continues to provide economic benefits.
China continues to be Western Australia’s largest export market, accounting for 52.7 per cent of the State’s total merchandise exports in 2015/16. In the last ten years, goods exported to China increased from $8.7 billion to $54.1 billion.2
In order for our facilities to keep up with the demand and innovations of the global seaborne trade, investment in port infrastructure has continued throughout the State.
Pilbara Ports Authority has commenced development of an Integrated Marine Operations Centre, Channel Risk Optimisation Project and Channel Marker Replacement program. Roy Hill Infrastructure completed the development of its two berths in South West Creek, commencing operations in December 2015.
Kimberley Ports Authority commenced its Wharf Extension of Life Project in November 2015, which included refurbishing the original 50 year old wharf structure. The project was completed in October 2016, ahead of time and on budget.
Fremantle Port Authority’s Inner Harbour deepening project has been completed. A total replacement of the fendering system for D and E berths on Victoria Quay has been completed along with repair and replacement of the wharf substructure at D berth.
These infrastructure upgrades allow our ports to continue to gain efficiency and safety improvements to remain competitive with other ports around the world.
On 31 May 2016 the Minister for Transport approved new Pilotage exemption regulations. These amendments to the Port Authorities Regulations 2001 and Shipping and Pilotage (Ports and Harbours) Regulations 1966 will align vessel pilotage exemptions across all Western Australian ports and with international practice.
Despite some softening in the WA economy, our State ports continue to facilitate extensive amounts of exports and imports providing economic benefits to WA and the rest of Australia.
INTRODUCTION
1 Department of State Development, Western Australian Economic Profile November 2016
2 Department of State Development, China Trade and Investment Profile May 2016
Our State accounted for 41 per cent of Australia’s merchandise exports in 2015/16
44

12 October 2016; Plan No: [email protected]
Department of Transport Western Australian Ports
2015/16 Trade Volumes
Western Australian port authorities 2015/16 trade volumes
Kimberley 26 Ports Authority 168
Wyndham Koolan Is.
Cockatoo Is.
230 James Price Derby
295 Point
Broome
1,673 1,056 458,736Pilbara 171,943
Port Walcott Port HedlandPorts Authority DampierVaranus Is. Balla Balla Barrow Is. Anketell
Airlie Is. Cape Preston East
Thevenard Is. Cape Preston
Onslow
Ashburton
Western Australian Cape Cuvier
Port AuthoritiesWestern Legend
Australia Kimberley Ports Authority
Useless Loop Pilbara Ports Authority
Mid West Mid West Ports Authority Ports Authority
Fremantle Port Authority
Oakajee Southern Ports Authority
Geraldton758 Port Facility managed by others 15,412
Proposed Ports
Exports - tonnes in thousands Fremantle
Imports - tonnes in thousandsPort Authority
14,683 Fremantle
20,225
14,410 1,839 Bunbury Esperance
794
Southern Albany 14,465
Ports Authority 151 4,451
55
[email protected] 12 October 2016; Plan No: 1068-09-07
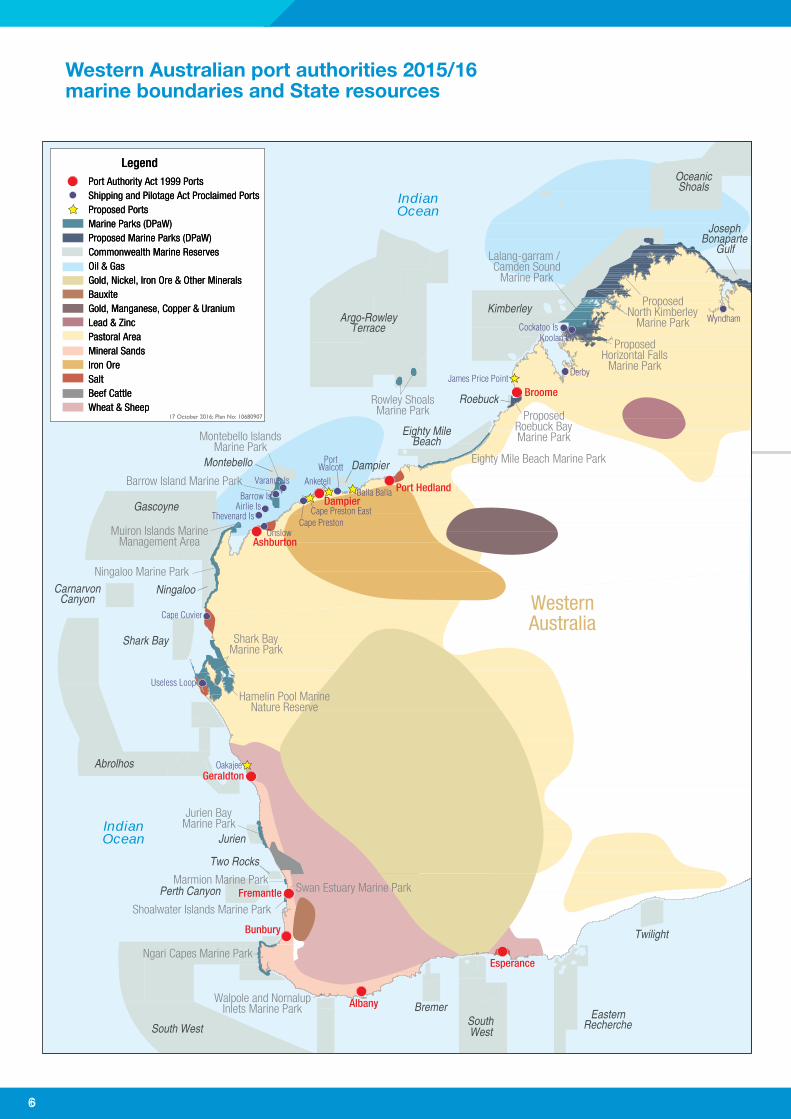
Western Australian port authorities 2015/16 marine boundaries and State resources
Oceanic Shoals
Indian Ocean
JosephBonaparte
Gulf
Argo-RowleyTerrace
Kimberley
Roebuck 17 October 2016; Plan No: 1068090717 October 2016; Plan No: 10680907
Eighty MileBeach
Montebello Dampier
Gascoyne
Carnarvon Canyon
Ningaloo
Shark Bay
Abrolhos
Indian Ocean Jurien
Two Rocks
Perth Canyon
Twilight
South West
Bremer South West
Eastern Recherche
66

WESTERN AUSTRALIA PORT SUMMARY
Port of Albany Dawn Princess at dusk
77

www.fremantleports.com.au
FREMANTLE PORT AUTHORITY
Port of Fremantle 32˚ 03’S 115˚ 44’E
The Port of Fremantle is Western Australia’s largest general cargo port.
From the Inner Harbour at the mouth of the Swan River, the port handles almost all of Western Australia’s container trade as well as non-containerised cargo such as motor vehicles, steel and machinery imports and livestock exports. In recent years there has been an increasing number of cruise ships calling at the Fremantle Passenger Terminal at Victoria Quay.
The Outer Harbour, which is located about 20 kilometres south at Cockburn Sound, Kwinana, plays an important role for the State in the import and export of bulk prod ucts including iron ore, cement clinker, gypsum, granulated slag, grain, petroleum, liquid petroleum gas, alumina, fertilisers and sulphur. Fremantle Ports owns and operates the Kwinana Bulk Terminal (KBT) and the Kwinana Bulk Jetty. The three other port facilities at Kwinana are privately operated by Alcoa, BP Refinery and Cooperative Bulk Handling (CBH).
Trade performance
In 2015/16 the total value of trade through the Port of Fremantle was $26.1 billion, which is approximately $2 billion lower than 2014/15. This is mainly due to the softening economy.
The annual average growth of port throughput since 2011 is 3.4 per cent. As Western Australia’s economy transitions, total port trade decreased by 2.4 per cent to 34.9 million tonnes. Bulk exports, non-containerised and containerised cargo and imports and exports have all decreased from the previous financial year.
Since beginning iron ore exports from the KBT in November 2011, 20 million tonnes have been loaded for Mineral Resources Ltd. This milestone was reached during the loading of bulk carrier Themistocles on 18 June 2016. Annual bulk commodity tonnages at KBT have increased from 2.1 million tonnes in 2010/11 to 6.2 million tonnes in 2015/16.
Cruise ship visits
The 2015/16 cruise season was the busiest since the early 1970s, with 58 ship visits (compared with 43 last year). The vessels transported a total of 152,743 passengers. Highlights were the maiden visits of Legend of the Seas, Explorer of the Seas, Costa Luminosa and Pacific Eden. Both the Pacific Eden and Astor home ported from Fremantle for the season, together totalling 27 calls. The Port of Fremantle is expecting another busy cruise season for 2016/17, with 60 vessel visits scheduled.
Achievements for 2015/16
Key achievements for the Fremantle Port Authority include:
à Positive commercial outcomes were achieved despite the softening port trade.
à Fremantle Port Authority’s annual survey of shipping lines and agents showed that respondents were 100 per cent satisfied or very satisfied with port services.
à A continuing strong focus on safety contributed to a 60 per cent reduction in lost time injuries and the lost time injury frequency rate was 5.1, a reduction of 53 per cent on the previous year.
88

à The development of land at Rous Head reclaimed through the Inner Harbour deepening has been completed and is now fully operational, except for one site. Development of the remaining site is expected to be completed in 2017.
à The Inner Harbour freight rail services carried 104,000 TEU (twenty foot equivalent unit containers) in 2015/16, the first time rail has exceeded the 100,000 mark. This represents a market share for rail of 14.5 per cent, up from 13.2 per cent last year.
à Fremantle Port Authority was recertified for international safety, environmental and quality standards, following an independent audit in May. This rigorous recertification audit occurs every three years.
à Fremantle Port Authority purchased a ShoreTension mooring system in September 2015, which has been effective in keeping mooring lines under constant tension in storm conditions, increasing ship stability and reducing the risk of lines breaking.
Ovation of the Seas turned to berth in the Fremantle Inner Harbour on arrival. The ship is 348 metres long and the Inner Harbour is 420 metres wide.
à A project for total replacement of the fendering system for D and E berths on Victoria Quay has been completed, along with repair and replacement of the wharf substructure at D berth.
à The Victoria Quay Commercial Precinct Enabling Plan was endorsed by the WA Planning Commission. The plan, in combination with the Fremantle Station Precinct Plan, received a Planning Institute of Australia national award for urban design.
à Fremantle Port Authority was named the top State Government agency for waste management at the Waste Authority WA Infinity Awards.
à Fremantle Port Authority’s annual Maritime Day, made possible through the strong support of the port community, showcased the working port and drew crowds to Victoria Quay.
99

10
Exports Imports
13,9
09
14,6
,030
83
10 09
14
545
103
02 3,63
3
12,0
13,0
12,
12,
13,1 1
43 43
13,0
13,1
22
14,0
14,0
13,0
14,5
17,9
19,5
20,7
20,2
65 43 79
50
97
64
25
Port of Fremantle throughput Strategic directions 2006/07 to 2015/16
The Port of Fremantle is a critically important 40,000
15,0
00
trading gateway for Western Australia. As its
Trad
e Th
roug
hput
(tho
usan
ds to
nnes
)
strategic port manager, the Fremantle Port Authority will continue to focus on the provision of reliable and efficient services, meeting the needs
35,000
30,000
25,000
of customers and facilitating trade and business 20,000
growth opportunities. In seeking to add value for 15,000
port users and service providers, Fremantle Port 10,000
Authority will continue to liaise with customers, 5,000
industry bodies and relevant government agencies. 0 2007 2008 2009 2010 2011 2012 2013 2014 2015 2016 Financial Year ended 30 June Fremantle Port Authority will maintain a strong
focus on working with industry and government agencies to achieve improvements in landside logistics, building on the significant progress made
Port of Fremantle percentage in recent years in achieving greater integration in throughput by cargo class 2015/16
the supply chain.
The North Quay and Rous Head areas are important for managing traffic and logistics associated with the container trade. As well as providing additional capacity, the development of 27 hectares of land reclaimed at Rous Head in the 2010 harbour deepening is contributing to improved efficiency. All sites have been designed to be of sufficient size, with the right shape and layout to support efficient operations currently and to provide capacity for future trade growth.
Further improvement in the efficiency and capability of Fremantle Port Authority noncontainerised (break-bulk) and bulk operations will be another key strategic target.
The Port of Fremantle is expecting another busy cruise season for 2016/17, with 60 vessel visits scheduled
Containerised – Exports 10% Liquid Bulk – Imports 22%
Containerised – Imports 10% Liquid Bulk – Exports 7%
Non Containerised Dry Bulk – Imports 9% – Exports 1%
Non Containerised – Imports 1%
Dry Bulk – Exports 40%
Port of Fremantle percentage throughput by commodity 2015/16
Grain – Exports Exports and Imports 26% Petroleum Products –
and Imports 17%
Iron Ore – Exports 15%
Other Commodities – Alumina – ExportsExports and Imports 33%
and Imports 9%
The Other Commodities (33%) category includes:
Imports - cement clinker, sulphur, ammonia, gypsum, granulated slag, iron and steel, industrial/agricultural vehicles and new motor vehicles
Exports - livestock and scrap metal Imports and exports - fertilisers, caustic soda, chemicals and related products, animal feeds, LPG, and agricultural/industrial machinery
10

Port capacity
BERTHS LENGTH OF BERTH (M)
DEPTH AT BERTH (M)
MAX. DRAUGHT OF VESSEL (M)*
North Quay
1 Common user 207.0 11.0 10.5
2 Common user 175.0 11.0 10.5
4/5/6 Container terminal 564.5 14.7 DUKC1
7/8/9/10 Container terminal 717.6 14.7 DUKC1
11 Common user 196.0 11.0 10.5
12 Common user 233.0 11.0 10.5
Victoria Quay
C Common user 198.0 11.0 10.5
D Common user 176.0 11.0 10.5
E Common user 230.0 11.0 10.5
F Common user 204.0 11.0 10.5
G Common user 206.0 11.0 10.5
H Common user 275.0 11.0 10.5
Cockburn Sound – Kwinana
Alumina Refinery Jetty 326.0 11.6 DUKC1
Kwinana Bulk Berth No. 1 195.0 11.0 (not in use)
Kwinana Bulk Berth No. 2 268.0 12.2 DUKC1
Kwinana Bulk Berth No. 3 259.0 13.4 DUKC1
Kwinana Bulk Berth No. 4 221.0 13.4 DUKC1
Kwinana Grain Loading Jetty 291.02 16.8 DUKC1
Oil Refinery Jetty No. 1 291.02 14.7 DUKC1
Oil Refinery Jetty No. 2 291.02 14.7 DUKC1
Oil Refinery Jetty No. 3 262.0 14.7 DUKC1
* Indicates design depth at berth. Actual depth available may vary and will be noted as declared depths through the promulgation of Notices to Mariners.
1 Maximal arrival and/or sailing draught is managed in accordance with the Dynamic Under Keel (DUKC) system, which takes into account current tidal, tidal trend, meteorological and depth information to ensure safe passage while not exceeding a minimum under-keel clearance value for each area. This enables vessels to maximise cargo loading.
2 ”T” head provided. Denoted length refers to maximum length of tanker.
1111

www.kimberleyports.wa.gov.au
KIMBERLEY PORTS AUTHORITY
Port of Broome 17˚ 58’S 122˚ 14’E
Kimberley Ports Authority (KPA) manages and operates the Port of Broome, which is located in the south-west Kimberley region, 2,237 kilometres north-east of Perth. KPA is responsible for the development of the Kimberley logistics maritime gateway, which services a range of industries including oil and gas exploration.
Trade performance
The Port of Broome is the only deep water port in the West Kimberley, and is the maritime gateway for petroleum products, construction materials, break bulk cargoes, livestock exports, cruise liners and expeditionary cruise vessels. The port provides support for the regional pearling, fishing, and tourism industries.
During 2015/16, KPA achieved a total port throughput of 525,691 tonnes of cargo involving 1,151 vessel visits. At 156,480 tonnes, petroleum products were the dominant import along with transhipment cargo. Drilling equipment and fluids, at 157,987 tonnes, represents 30 per cent of total trade.
Total imports during 2015/16 decreased by 6.4 per cent compared to the previous financial year. Total exports increased by 12.7 per cent mainly due to livestock and fuel bunker exports.
Achievements for 2015/16
KPA’s key achievements for 2015/16 include:
à KPA received an Industrial Foundation for Accident Prevention Safeway Platinum Award. To achieve this, KPA maintained Gold Status for five consecutive years and received audit confirmation for the effectiveness of their safety systems in July 2015.
à Compiling a Strategic Asset Management Plan (SAMP) for 2015-2025 which is to be updated annually. The SAMP will assist KPA in identifying critical assets, and the replacement or repair works required post the finalisation of the Wharf Extension of Life (WEOL) Project.
à The WEOL Project construction commenced in November 2015 and was completed in October 2016. The project included refurbishing the original 50 year old wharf structure plus upgrading the load carrying capacity of the wharf for heavier vehicle and crane loads.
à Development of approximately 7,500 square metres of hard stand, within two kilometres of the wharf. This land is currently being used to support the WEOL project, and is likely to be hired out in the future by KPA for short term storage.
à A new waste water servicing plant was designed to treat waste water on port lands, replacing the existing septic tank and leach drain systems, with stage one of construction having commenced.
à New and upgraded lighting was installed on the wharf to improve safety during nightshift work.
à The wharf access road was re-aligned and a new intersection installed at Kabbarli Road to improve traffic flow.
1212

Strategic directions services and infrastructure needed to meet ongoing trade demand.
During the past year, KPA’s strategic focus has The Broome Master Plan will form the template been undertaking due diligence on the Ports of for the broader Kimberley Ports Master Plan. This Derby, Wyndham and Yampi Sound, to inform will ensure that maritime logistics and transport the KPA Board, DoT and port managers of the capabilities are optimised across the Kimberley potential change management issues to be and improve productivity for the benefit of local addressed during the WA Ports Governance communities and port stakeholders. Review implementation process.
KPA has engaged consultants, GHD, to assist in developing a Port of Broome Master Plan which will provide direction to KPA on the suitability of assets and capability, in addition to external
Port of Broome
1313

Port of Broome
Port of Broome throughput Port of Broome percentage 2006/07 to 2015/16 throughput by commodity 2015/16
600 Exports Imports 27
2
250
246 23
0
200
15 7
183 2 16 187
193
147
151
191
187
156
143
257
267
262
295
Fuel Bunkers – Exports 16% Freshwater – Exports 14%
500 Livestock – Exports 7%Drilling Equipment
and Mud – Exports Building Materials and Imports 30%
400 – Imports 2%
300 Other – Exports and Imports 1%
200 Petroleum – Imports 30%
100
0 2007 2008 2009 2010 2011 2012 2013 2014 2015 2016 Financial Year ended 30 June
Port capacity
Trad
e Th
roug
hput
(tho
usan
ds to
nnes
)
BERTHS LENGTH OF BERTH (M)
DEPTH AT BERTH (M)
MAX. DRAUGHT OF VESSEL (M)*
Port Authority facilities
Outer Common user 331.0 10.0 9.0
Inner 1 Common user 170.0 8.0 7.1
Inner 2 Common user 96.0 6.2 5.2
* This is an indicative figure only. The maximum sailing draught of a vessel is variable, depending on the limitations of the tides and should be confirmed with the Port Harbour Master, prior to the vessel’s entry into the port.
Port of Broome
1414

www.midwestports.com.au
MID WEST PORTS AUTHORITY
Port of Geraldton 28˚ 46’S 114˚ 35’E
The Port of Geraldton is located 424 kilometres north of Perth and is the gateway to Western Australia’s diverse Mid West region.
Trade performance
The Port of Geraldton recorded a total throughput of 16.17 million tonnes during 2015/16, the third highest trade performance ever. Iron ore continues to dominate trade through the Port of Geraldton, representing 74 per cent of total trade. Other significant contributors to the overall trade result include grain (12 per cent), mineral sands (4 per cent) and concentrates (4 per cent), and have resulted in exports of these four key products comprising 94 per cent of total Mid West Ports Authority (MWPA) trade. Imports comprised predominately of fuel and mineral sands (both accounting for approximately 2 per cent of total trade each).
Achievements for 2015/16
MWPA’s key achievements include:
à A total of 425 vessels visited the Port of Geraldton during 2016, comprising of 409 cargo ships, two rig tenders and 14 cruise vessels. These visits resulted in a total of 1,012 pilot assisted ship movements.
à Cargo either originated from, or was exported to, a total of 23 different countries during 2015/16. China accounted for 76 per cent of total trade. Other significant trading markets include Indonesia (2.8 per cent), Singapore (1.8 per cent), and Japan (1.6 per cent).
à MWPA’s management system was re-certified by an independent audit as being compliant with the Occupational Health and Safety (AS/NZS4801), Environmental Management System (ISO 14001) and Quality Management System (ISO 9001) standards.
à The Office of Rail Safety (WA) re-accredited MWPA as a Rail Infrastructure Manager and Limited Rail Operator.
à MWPA officially launched its Reflect Reconciliation Action Plan on 28 May 2015, committing to build relationships with local communities and identify how to best contribute to the reconciliation effort.
à The performance targets set for MWPA’s bulk handling facilities (BHF) at Berths 4 and 5 have been exceeded. The 2015/2016 reliability figures for Berth 4, Berth 5 and the train unloader remain at exceptionally high levels.
1515
Strategic directions
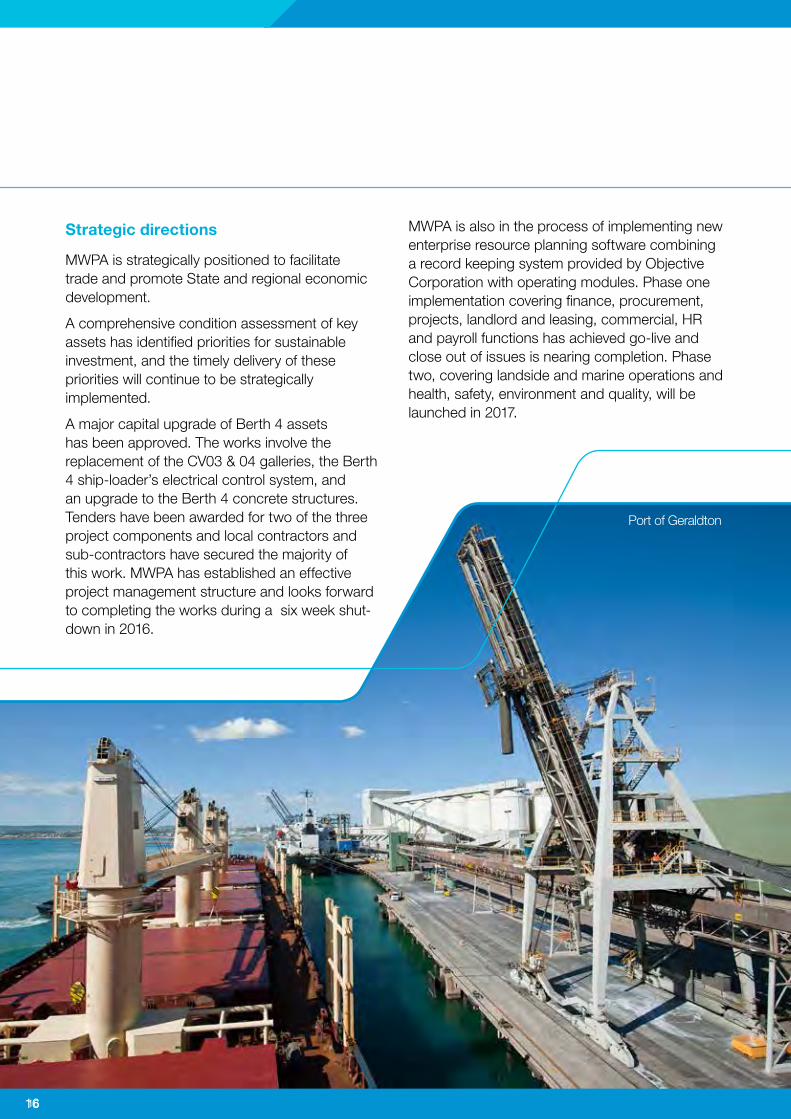
MWPA is strategically positioned to facilitate trade and promote State and regional economic development.
A comprehensive condition assessment of key assets has identified priorities for sustainable investment, and the timely delivery of these priorities will continue to be strategically implemented.
A major capital upgrade of Berth 4 assets has been approved. The works involve the replacement of the CV03 & 04 galleries, the Berth 4 ship-loader’s electrical control system, and an upgrade to the Berth 4 concrete structures. Tenders have been awarded for two of the three project components and local contractors and sub-contractors have secured the majority of this work. MWPA has established an effective project management structure and looks forward to completing the works during a six week shut-down in 2016.
MWPA is also in the process of implementing new enterprise resource planning software combining a record keeping system provided by Objective Corporation with operating modules. Phase one implementation covering finance, procurement, projects, landlord and leasing, commercial, HR and payroll functions has achieved go-live and close out of issues is nearing completion. Phase two, covering landside and marine operations and health, safety, environment and quality, will be launched in 2017.
Port of Geraldton
1616

Other – Exports 1%
Grain – Exports 12%
Other – Imports 5%
– Exports 4% Metals Cons
– Exports 4% Mineral Sands
.1 31o tide at zer.1 31
Port of Geraldton throughput Port of Geraldton percentage 2006/07 to 2015/16 throughput by commodity 2015/16
Trad
e Th
roug
hput
(tho
usan
ds to
nnes
)
20,000
17,500
15,000
Exports Imports
771
640
8
632 75
8
1,14
0
1,20
2
289 47
12 54
2 2
66,
22
6,43
6
7,36
9
8,53
4
8,86
4
9,21
9
14,8
13
17,7
24
16,2
94
15,4
12
Iron Ore – Exports 74%12,500
10,000
7,500
5,000
2, 500
0 2007 2008 2009 2010 2011 2012 2013 2014 2015 2016 Financial Year ended 30 June
Port capacity
BERTHS LENGTH OF BERTH (M)
DEPTH AT BERTH (M)
MAX. DRAUGHT OF VESSEL (M)*
Port facilities
1. Small vessel layup 50 9.1 at zero tide 8.5
2. Multi-purpose berth (handles general and break-bulk cargoes)
225 9.7 at zero tide 9.1
3. Grain and break-bulk cargoes 225 12.9 at zero tide 12.4
4. Copper and zinc concentrate, talc, garnet & other mineral sands
225 12.8 at zero tide 12.8
5. Multi-user iron ore export berth 225 13.3 at zero tide 13.0
6. A general cargo berth incorporating an underground pipeline for importing fuel
190 12.4 at zero tide 12.2
7. An iron ore berth used exclusively to transfer products produced by Karara Mining Ltd
250
* Vessels with a draught exceeding 10m will be subject to assessment of draught through the DUKC program. This system will calculate the maximum draught dependent on tide and swell conditions. Swells exceeding 2.5m or a 15s period may limit available draught. All parties are cautioned against making unrealistic commercial commitments that may prove impossible to keep in certain weather conditions.
It is most important to understand that swell is the greatest issue affecting draughts and that even quite small swells can cause some ships to roll heavily as they clear the breakwater. Larger longer period swells can cause ships to fall between troughs at the channel entrance. Both scenarios reduce under keel clearance.
Contracts calling for a draught of 11.6m plus or minus 10 per cent by cargo weight are possible in most swell conditions. Draughts cannot be deeper than the berth depth.
The DUKC system is designed to provide certainty with regard to sailing draughts and as such is conservative when based on forecast weather inputs. This is to avoid the risk of ships being unable to sail if loaded too deep. As sailing times draw closer DUKC changes over from forecasts to measured tide and swell and becomes progressively more accurate, generally offering deeper draughts.
MWPA recommends that parties seeking to maximise departure draughts plan to complete cargo 1.5 hours prior to sailing, if necessary returning with loading labour to complete the final two or three thousand tonnes.
1717

www.pilbaraports.com.au
Port of Dampier 20˚ 37’S 116˚ 38’E
Port of Port Hedland 20˚ 20’S 118˚ 37’E
Port of Ashburton 21˚ 30’S 115˚ 00’E
Pilbara Ports Authority (PPA) encompasses the ports of Dampier, Port Hedland and Ashburton, and future ports of Anketell, Balla Balla and Cape Preston East.
PPA will over time also assume legislative responsibility for a number of Shipping and Pilotage Act 1967 ports, including Airlie Island, Barrow Island, Cape Preston, Onslow, Port Walcott and Varanus Island.
The ports of Port Hedland and Dampier are two of the world’s largest bulk export ports, responsible for approximately 75 per cent of the State’s and approximately 50 per cent of the world’s seaborne iron ore exports. Another major export commodity for PPA is Liquefied Natural Gas (LNG), which is currently exported through the Port of Dampier and accounts for approximately eight per cent of the world’s LNG exports.
PILBARA PORTS AUTHORITY
In 2015/16, PPA achieved a record annual throughput of 633.5 million tonnes, with more than 21,122 vessel movements across its ports. PPA’s profit before income tax for the financial year was $171.1 million, and total dividend payments of $100.5 million were paid to the State.
The ports of Port Hedland and Dampier are two of the world’s largest bulk export ports.
Achievements for 2015/16
Highlights for 2015/16 included:
à A record total annual throughput of 633.5 million tonnes.
à A Port of Port Hedland monthly throughput record of 42.2 million tonnes (June 2016).
à A record 24 hour Port of Port Hedland throughput of 2,174,533 tonnes on 12 vessels (22 June 2016).
à Port monitoring and communications services at the Port of Ashburton commenced on a permanent basis, well in advance of the expected handover from Chevron Australia in mid-2017.
0
10
20
30
40
50
60 2014/15 (620 million tonnes) 2015/16 (634 million tonnes)
Jul Aug Sep Oct Nov Dec Jan
Trad
e Th
roug
hput
(milli
on to
nnes
)
Feb Mar Apr May Jun
Comparative trade statistics 2014/15 vs 2015/16 (Port Hedland, Dampier and Ashburton)
1818

à Awarded a Premier’s Award in October 2015 The Port of Dampier includes private port (Developing the Economy Category for PPA’s terminals owned and operated by Rio Tinto and Tidal Model Project). Woodside Energy. Patrick and Qube stevedores
also operate private facilities in the port, adjacent à Awarded the Lloyd’s List Australian Shipping to the Dampier Cargo Wharf. Marine assets & Maritime Industry Awards (Logistics Supply owned and operated by PPA include the Bulk Chain award for Tidal Model Project). Liquids Berth and the Dampier Cargo Wharf that provides up to seven berths.
Port of Dampier During 2015/16, the port delivered an annual
The Port of Dampier is located on the west throughput of 173 million tonnes, of which 82 per Pilbara coastline in the Burrup Peninsula, cent was iron ore and 12 per cent was LNG. The about 200 kilometres west of Port Hedland remaining commodities include salt, condensate, and services both the rich iron ore reserves of liquified petroleum gas, ammonia and general the west Pilbara hinterland and the offshore cargo. The annual throughput increased slightly by gas fields of the Carnarvon Basin. 198,000 tonnes, compared to the previous year.
Port of Dampier
1919

Port of Dampier throughput Port of Dampier percentage 2006/07 to 2015/16 throughput by commodity 2015/16
Trad
e Th
roug
hput
(tho
usan
ds to
nnes
)
200,000
160,000
Exports Imports 69
1
819 80
7 509
831
1,00
3
1,05
6
498 55
1 702
125,
627
133,
398
140,
122
170,
041
164,
206
171,
037
179,
857
176,
696
171,
798
171,
943
LNG – Exports 12% Iron Ore – Exports 82%120,000
Salt – Exports 2%
General Cargo and Other – 4%
80,000
40,000
0 2007 2008 2009 2010 2011 2012 2013 2014 2015 2016
Financial Year ended 30 June
Port capacity - Port of Dampier
BERTHS / PRIVATE FACILITIES LENGTH OF WHARF (M) DECLARED DEPTH AT BERTH (M) Patrick Marine Facility (West) 100.0 7.8 Patrick Marine Facility (East) 100.0 6.7 Floating Deck Transhipment System 45.0 5.1 King Bay Supply Base 230.0 7.2* Mermaid Marine 1
Combined 175 7.6
Mermaid Marine 2 7.2/6.6 Mermaid Marine 3 108 5.1 Mermaid Marine 4 65 4.6 Mermaid Marine 5
Combined 95 5.2
Mermaid Marine 6 5.0 LCT (Landing Craft) Barge Ramp - 4.0
Minimum - Maximum Vessel Length × Beam
Berthing Displacement (T) East Intercourse Island (EII) 340 × 50 150,000 T 20.8* East Intercourse Island Lay By Berth 340 × 50 150,000 T 19.7* Dampier Fuel Berth 229 × 35 46,000 T 11.4 Parker Point Berth 2 300 × 47 142,000 T 19.2* Parker Point Berth 3 300 × 47 142,000 T 19.4* Parker Point Berth 4 330 × 55 142,000 T 19.3* Parker Point Berth 5 300 × 50 142,000 T 18.8* Mistaken Island 225 × 35 74,000 T 12.2* Pluto Jetty – LNG and Condensate 180 – 315 110,000 T 13.5 Withnell Bay - LNG 1 190 – 300 90,000 T 12.8* Withnell Bay – LNG 2 270 – 310 110,000 T 12.8* Withnell Bay – LPG and Condensate 190 – 300 90,000 T 13.3* Port Authority facilities Dampier Cargo Wharf (West) 209.6 9.1* Dampier Cargo Wharf (East) 143.0 6.9* Heavy Load Out facility 50.0 5.9 Dampier Bulk Liquids Berth 228.0 55,000 T 12.4
* Denotes changes in depth.
2020

Port of Port Hedland
The Port of Port Hedland is the world’s largest bulk export port and is located in the east Pilbara region, about 1,650 kilometres north of Perth. The port is unique in that the main 42 kilometres shipping channel is a tidally constrained, uni-directional channel.
The port achieved a record annual throughput of 460.4 million tonnes in 2015/16, an increase of 13.5 million tonnes or three per cent from the previous year. A record 454.2 million tonnes of iron ore exports comprised 98 per cent of total trade.
There are 19 operational berths within the Inner Harbour, four of which are owned and operated by PPA. Eight are owned and operated by BHP Billiton Iron Ore and five are owned and operated by the Pilbara Infrastructure Group (a subsidiary of Fortescue Metals Group). During the reporting year, Roy Hill Infrastructure Pty Ltd completed the construction of two berths in South West Creek, bringing the total number of berths to 19. Roy Hill’s first shipment of iron ore departed the port on board the MV Anangel Explorer for South Korea on 7 December 2015.
PPA also progressed three key capital infrastructure projects funded by a Port Improvement Rate, comprising the Integrated Marine Operations Centre, Channel Risk and Optimisation Project and Channel Marker Replacement Program.
Pindan Contracting Pty Ltd was announced as the successful tenderer to design and construct the $70.7 million Integrated Marine Operations Centre, an operations facility with best-in-class vessel traffic service systems and state-of-theart equipment. The new facility will oversee the increasing number of vessels through the world’s largest bulk export port, with works on-site expected to begin in 2017.
The $120 million Channel Risk and Optimisation Project will reduce the risk of an obstruction in the Port Hedland shipping channel and allow port users to further optimise tonnages on their vessels. The two-year development involves a new emergency passing lane, extension of a deep water refuge zone and improved use of existing deeper depths along the tidally constrained 42 kilometre channel.
A detailed scope of works and construction methodology for the Channel Marker Replacement Program is due to be finalised in 2016/17.
Port of Port Hedland
2121

Exports Imports
2,24
0
81,
93
56
1,6
701,
2
09 ,160
794
2
1,0 1
81
,913
,466
,732
,997
,382
110
129
158
177
197
245
286
370
444
458,0
16
,200
,061
,786
,736
Port of Port Hedland throughput Port of Port Hedland percentage 2006/07 to 2015/16 throughput by commodity 2015/16
2,13
5
1,67
3
500,000
450,000
400,000
350,000 Iron Ore – Exports 98% Salt – Exports 1%
Other – Exports and Imports 1%
Trad
e Th
roug
hput
(tho
usan
ds to
nnes
)
300,000
250,000
200,000
150,000
100,000
50,000
0 2007 2008 2009 2010 2011 2012 2013 2014 2015 2016
Financial Year ended 30 June
Port capacity - Port of Port Hedland
Nelson Point Berth A (NPA) 660.0
19.2 CD
Nelson Point Berth B (NPB) 19.0 CD
Nelson Point Berth C (NPC) 838.0
19.1 CD
Nelson Point Berth D (NPD) 19.0 CD
Finucane Island Berth A (FIA) 843.0
19.2 CD
Finucane Island Berth B (FIB) 19.2 CD*
Finucane Island Berth C (FIC) 680.0
18.4 CD*
Finucane Island Berth D (FID) 19.2 CD*
Anderson Point AP1 (AP1)
1190.0
19.8 CD*
Anderson Point AP2 (AP2) 19.7 CD
Anderson Point AP3 (AP3) 19.8 CD
Anderson Point AP4 (AP4) 845.0
19.6 CD*
Anderson Point AP5 (AP5) 18.8 CD*
BERTHS LENGTH OF BERTH (M) DEPTH AT BERTH (M)
Iron ore loading facilities
Port Authority facilities
PHPA No. 1 Berth 213.0 13.1 CD*
PHPA No. 2 Berth 131.0 13.2 CD*
PHPA No. 3 Berth 183.0 13.5 CD
PHPA No. 4 Berth (Utah Point) 272.0 14.5 CD*
Stanley Point Berth 1 730.0
19.5 CD
Stanley Point Berth 2 19.5 CD
* Denotes changes in depth. * Under keel clearance of less than 1m alongside requires Harbour Master approval.
Max. draught of vessel alongside (m): 1m Under Keel Clearance at all times. Max. draught of vessel underway (m): based on Dynamic Under Keel Clearance.
2222

BERTHS LENGTH OF BERTH (M)
DEPTH AT BERTH (M)
Port Authority facilities
MOF East Quay 170.0 7.9
MOF Heavy Lift Facility 170.0 7.7
MOF West Ro-Ro 140.0 7.1
Wheatstone Marine Terminal** TBC 13.5
** Under Construction
on Australia
Port of Ashburton
The Port of Ashburton, located 12 kilometres south west of Onslow, is a strategic industrial area and will ultimately be a multi-user port. The port will fall under PPA’s management upon completion of port infrastructure for the Chevron-operated Wheatstone project.
Under contractual agreements relating to the Wheatstone project, port infrastructure to be handed over to PPA will include access channels, a materials offloading facility (Ashburton Cargo Wharf), tug and working vessel moorings, breakwater and navigational aids. PPA will also be responsible for additional leasable land.
Additional infrastructure will be established by PPA including an administration building and car park, security fencing for the Common User Coastal Area, power and water infrastructure, a gatehouse facility and oil spill equipment sheds. The port will accommodate LNG and other hydrocarbon-based and natural gas processing for WA’s domestic gas supply, with first shipment of LNG expected in mid-2017. During 2015/16, Ashburton delivered an annual throughput of 129,000 tonnes, of which 96 per cent was general cargo imports and four per cent was general cargo exports. The annual throughput increased by 25 per cent compared to the previous year.
Port capacity - Port of Ashburton
Port of Ashburton percentage throughput by commodity 2015/16
General Cargo – General Cargo – Imports 96% Exports 4%
Port of Ashburton Image courtesy of Chevr
2323

SOUTHERN PORTS AUTHORITY
www.southernports.com.au
Port of Albany35˚ 02’S 117˚ 55’E
Port of Bunbury33˚ 19’S 115˚ 38’E
Port of Esperance 33˚ 51’S 121˚ 53’E
The Southern Ports Authority (SPA) was established on 1 October 2014, offices are located in Albany, Bunbury, Esperance and Perth.
SPA plays an integral role in facilitating trade for the Great Southern, South West and Goldfields-Esperance regions of Western Australia.
Both the Port of Albany and Port of Bunbury operate under a landlord model by leasing land to port-related industries and by providing access to port infrastructure and facilities. Port services such as towage and stevedoring are outsourced to the private sector. The Port of Esperance operates under a model with a blend of landlord and in-house stevedoring where most of the product handling equipment is owned and operated by SPA.
Strategic direction
SPA’s primary objective is to facilitate trade and development by providing safe, sustainable, innovative and efficient ports for clients, employees and the community.
In the past year, SPA has continued to make strong progress on all aspects of the integration of its three ports. This includes improving commercial arrangements with customers, developing new trade and business opportunities and planning for future facilities and infrastructure. SPA has continued to work towards regional trade development and better aligning port planning, state and regional transport and freight and infrastructure development.
New trade
Total combined trade for SPA’s three ports in the 2015/16 financial year was 36 million tonnes. SPA continues to negotiate with existing and new port customers to further develop and provide opportunities for new trade going forward. SPA is working closely with a number of customers looking to invest in infrastructure, including new storage sheds and ship loading facilities.
Achievements for 2015/16
SPA has invested significantly in maintenance during the last 12 months, including dredging, navigational beacon repairs, access road upgrades, berths, mobile ship loader and security systems. Key achievements and projects include:
à Iron ore loading rates at Esperance increased by an average of 5.7 per cent per annum.
à Exports of alumina continue to reach record throughput with a total of 10.72 million tonnes.
à The Port of Bunbury serviced 417 ship visits during 2015/16, including two cruise ships and one naval vessel.
à A total of 209 ships visited the Port of Esperance during the 2015/16 Financial Year, including a record 14 cruise ships.
2424
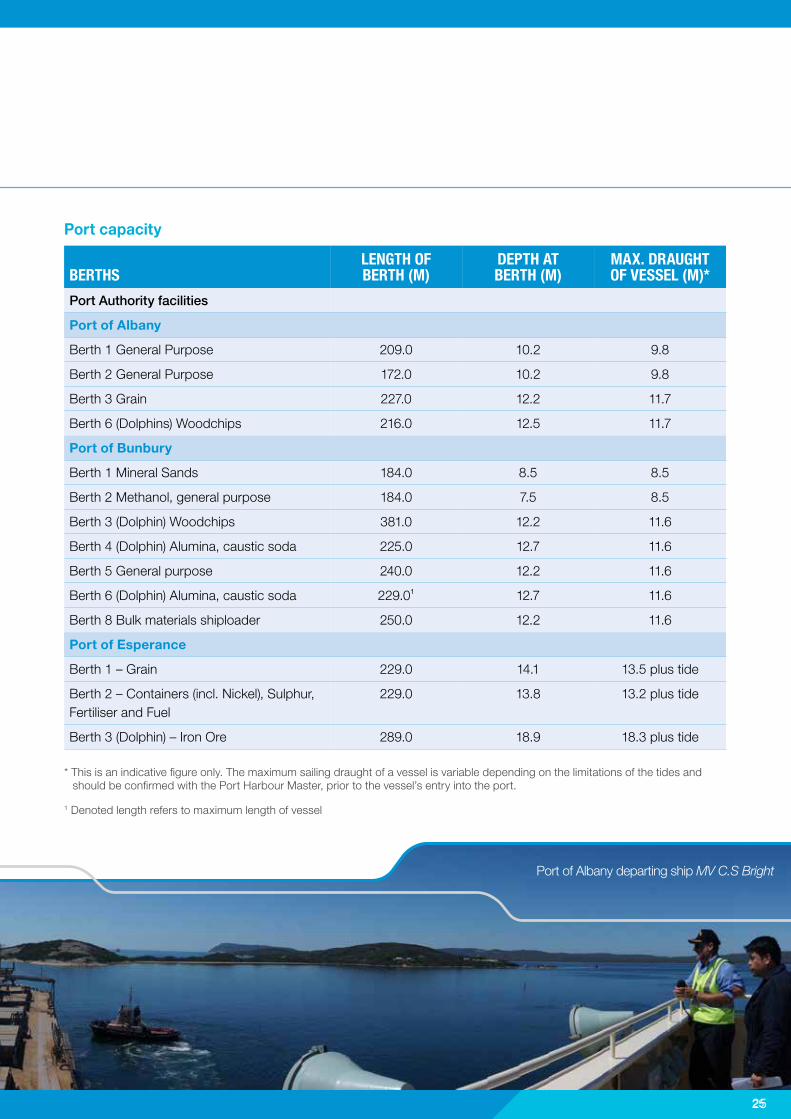
Port capacity
BERTHS LENGTH OF BERTH (M)
DEPTH AT BERTH (M)
MAX. DRAUGHT OF VESSEL (M)*
Port Authority facilities
Port of Albany
Berth 1 General Purpose 209.0 10.2 9.8
Berth 2 General Purpose 172.0 10.2 9.8
Berth 3 Grain 227.0 12.2 11.7
Berth 6 (Dolphins) Woodchips 216.0 12.5 11.7
Port of Bunbury
Berth 1 Mineral Sands 184.0 8.5 8.5
Berth 2 Methanol, general purpose 184.0 7.5 8.5
Berth 3 (Dolphin) Woodchips 381.0 12.2 11.6
Berth 4 (Dolphin) Alumina, caustic soda 225.0 12.7 11.6
Berth 5 General purpose 240.0 12.2 11.6
Berth 6 (Dolphin) Alumina, caustic soda 229.0¹ 12.7 11.6
Berth 8 Bulk materials shiploader 250.0 12.2 11.6
Port of Esperance
Berth 1 – Grain 229.0 14.1 13.5 plus tide
Berth 2 – Containers (incl. Nickel), Sulphur, Fertiliser and Fuel
229.0 13.8 13.2 plus tide
Berth 3 (Dolphin) – Iron Ore 289.0 18.9 18.3 plus tide
* This is an indicative figure only. The maximum sailing draught of a vessel is variable depending on the limitations of the tides and should be confirmed with the Port Harbour Master, prior to the vessel’s entry into the port.
1 Denoted length refers to maximum length of vessel
Port of Albany departing ship MV C.S Bright
2525

Port of Albany throughput 2006/07 to 2015/16
0
1,000
2,000
3,000
4,000
5,000
Financial Year ended 30 June
Exports Imports
2007 2008 2009 2010 2011 2012
Trad
e Th
roug
hput
(tho
usan
ds to
nnes
)
93 112
144
130
115 10
7
3,40
8
3,55
4
4,02
4
3,29
3
2,95
5
3,34
9
2013 2014
122
3,90
5
101
4,45
5
151
4,72
5
2015
151
4,45
1
2016
Port of Albany percentage throughput by commodity 2015/16
Woodchips – Exports 31%
Silica Sand – Exports 5%
Logs – Exports 1%
Fertiliser – Imports 2%
Grain – Exports 60%
Petroleum – Imports 1%
26
Port of Albany
Located in the Great Southern region of Western Australia, about 400 kilometres south east of Perth. Prior to the construction of improved harbour facilities at the turn of the 20th century, the Port of Albany was the State’s principal commercial port. The port services the agricultural region, with the main trades being the export of grain and woodchips.
Trade performance
The Port of Albany’s throughput reached 4.6 million tonnes for 2015/16, and approximately 97 per cent of the port’s tonnage consists of woodchips, grain (wheat, canola, barley and oats) and silica sand exports, while the import of petroleum products and fertiliser accounts for the remaining three per cent.
Trade through the Port of Albany was 5.6 per cent below the port record set in 2014/15 due to a 18 per cent reduction in grain trade partially offset by a 22 per cent increase in woodchip trade and 40 per cent increase in silica sand exports.
The proponents of the new grain export trade at Albany have completed in-loading and storage infrastructure upgrades.
Vessel movements
During 2015/16 the Port of Albany was visited by 158 vessels, including 11 cruise ships, providing economic and social benefits to Albany, the South West region and Western Australia.
Port of Albany
26

Port of Bunbury throughput 2006/07 to 2015/16
0
3,000
6,000
9,000
12,000
15,000
18,000
Financial Year ended 30 June
Exports Imports
2007 2008 2009 2010 2011 2012
Trad
e Th
roug
hput
(tho
usan
ds to
nnes
)
1,36
2
1,49
3
1,53
8
1,45
7
1,62
9
1,64
4
12,1
61
12,1
66
11,7
39
12,4
10
12,3
69
12,6
30
2013 2014
1,71
613
,616
1,78
713
,818
2015
1,86
014
,400
2016
1,83
914
,410
Vessel movement
The Port of Bunbury serviced 417 ship visits during 2015/16, including two cruise ships and one naval vessel.
Port of Bunbury percentage throughput by commodity 2015/16
Caustic Soda – Imports 8%
Alumina – Exports 66%
Mineral Sands – Exports 4%
Other – Exports 9%
Other – Imports 3%
Woodchips – Exports 10%
Port of Bunbury
Bunbury is the centre for the South West region as an industrial, agriculture, tourism and commercial base. The Port of Bunbury has seven berths divided between the Outer and Inner Harbours. Berths 1 and 2 are located at the Outer Harbour servicing methanol imports and general cargo. The Inner Harbour comprises Berth 3, which provides for the export of woodchips and grain; and the multi-user Berths 5 and 8, which are both utilised for multiple products including mineral sands, woodchips and copper concentrate. Berths 4 and 6, which are privately owned and operated, provide for the export of alumina and import of caustic soda. The Port of Bunbury owns product handling equipment only on Berth 8 and has outsourced stevedoring operation on the berth.
Trade performance
Approximately 89 per cent of the Port of Bunbury’s trade is via exports of products such as alumina, woodchips, mineral sands, and grain, with the import of products such as caustic soda, petroleum products, mineral sands and fertilisers accounting for the remaining 11 per cent.
Western Australian mineral sands company MZI Resources officially opened its flagship Keysbrook Mineral Sand project in April 2016. It is designed to produce over 95,000 tonnes of high value mineral sands products annually for export to global customers. In March 2016, the first shipment of leucoxene, used in creating titanium, was exported from the Port of Bunbury to major customer Chemours, in the United States. Further shipments are planned for 2016/17.
Exports of alumina continue to reach record throughput with a total of 10.72 million tonnes, representing 66 per cent of total port trade.
Port of Bunbury
2727

Port of Esperance
Esperance is located in the mineral rich Goldfields-Esperance Region, about 700 kilometres south east of Perth. The Port of Esperance is one of the deepest ports in Australia and provides infrastructure for exporting iron ore, grain and nickel as well as imports such as fuel, sulphur and fertilisers. The port also has the capacity to handle bulk as well as containerised trade.
Trade performance
The Port of Esperance achieved another record tonnage exceeding 15.2 million tonnes for 2015/16, an increase of one per cent from the previous year.
Approximately 93 per cent of the Port of Esperance’s tonnage consists of iron ore and grain exports while the import of sulphur, petroleum products and fertilisers account for most of the remaining trade.
Stevedoring services at the Port of Esperance have improved substantially over the years.
New trade
The Port of Esperance has attracted new trade in 2015/16 with 15,185 tonnes of woodchip exported to China. The new trade opportunity is expected to grow to 400,000 tonnes per annum. The new cargo export operation commenced with two woodchip carriers the La Richardais and the Aventicum visiting the Port.
Other achievements include:
à The Port of Esperance is working with potential new customers to export spodumene, additional iron ore and metal concentrates.
à In December 2015, MV Kalliopi arrived at the Port of Esperance. At 295 metres it is the largest container ship to visit the port and was part of a trial container liner service.
2828

Port of Esperance throughput 2006/07 to 2015/16
0
4,000
8,000
12,000
16,000
Financial Year ended 30 June
Exports Imports
2007 2008 2009 2010 2011 2012
Trad
e Th
roug
hput
(tho
usan
ds to
nnes
)
499
706
497 37
2
414 76
8
9,45
1
9,22
4
9,45
2
10,8
95
10,7
06
10,9
83
841
13,0
34
2013 2014
829
14,1
10
2015
830
14,2
27
2016
14,4
65
794
Port of Esperance percentage throughput by commodity 2015/16
Iron Ore – Exports 77%
Other – Exports 2%
Grain – Exports 16 %
Other – Imports 3%
Sulphur – Imports 2%
Port of Esperance
2929
Port of Esperance

.
OTHER PORTS
There are nine other non-port authority trading ports in WA, which have been declared under the Shipping and Pilotage Act 1967. In general, these ports and related export facilities are operated by resource companies with limited guidance from the State Government. Most of these ports handle raw bulk commodity exports such as iron ore, crude oil and salt.
The largest of these ports is Port Walcott, one of three major iron ore exporting ports in the Pilbara region. Port Walcott is in the top five ports in Australia by volume (exports reached nearly 184 million tonnes in 2015/16). Details of WA’s non-port authority ports are summarised in the following table.
PROCLAIMED PORT
ASSOCIATED FACILITY OPERATOR COMMODITY
OPERATION STATUS
Wyndham Cambridge Gulf Ltd General cargo, iron ore
Active
Yampi Sound Cockatoo Island
Koolan Island
Pluton (under administration)
Mt Gibson Iron Ltd
Iron ore
Iron ore
Currently inactive
Currently inactive
Derby Shire of Derby-West Kimberley Currently inactive
Port Walcott Cape Lambert Robe River Mining Co Pty Ltd (Rio Tinto Ltd)
Iron ore Active
Port of Cape Preston
CITIC Pacific Ltd / Mineralogy Pty Ltd
Iron ore Active
Varanus Island Quadrant Energy Crude oil Active
Barrow Island Chevron Australia Pty Ltd Crude oil Active
Onslow
Airlie Island
Thevenard Island
Onslow
Quadrant Energy
Chevron Australia Pty Ltd
Onslow Salt Pty Ltd
Oil and Gas
Oil and Gas
Salt
Currently inactive
Currently inactive
Active
Carnarvon Cape Cuvier
Useless Loop
Dampier Salt Ltd (Rio Tinto Ltd)
Shark Bay Salt Pty Ltd
Salt
Salt
Active
Active
Details for the Port of Wyndham are provided separately at page 32
3030

Financial Year ended 30 June
Tonnes (Million) Value ($ Billion)
2007 2008 2009 2010 2011 2012 2013
Valu
e ($
Billi
on)
0
100
200
300
400
500
600
700
800
900
1,000
2014
Volu
me
(Milli
on T
onne
s)
2015 2016 0
25
50
75
100
125
150
175
200
1 Port volumes include all Port Authorities Act and Shipping and Pilotage Act ports. Data sourced from the Bureau of Infrastructure, Transport and Regional Economics (April 2015 - March 2016). 2016 figures have been extrapolitated.
International seaborne trade through all Western Australian ports 2006/07 to 2015/161
Port of Wyndham
3131

www.transport.wa.gov.au
Department of Transport
Port of Wyndham 15˚ 27’S 128˚ 06’E
The Port of Wyndham is located on the Kimberley coastline at the southern end of Cambridge Gulf. It is the only port located between Broome and Darwin which offers deep water access, and is managed and operated by Cambridge Gulf Ltd (CGL) under a Port Operating Agreement with the Minister for Transport. CGL employs the stevedoring workforce for all shipping movements through the port.
Trade performance
The Port of Wyndham commenced operations in 1886 as an export facility for the cattle industry and remains the closest Western Australian port to major Asian markets such as Indonesia, Papua New Guinea and Vietnam.
The softening of mineral and crude oil prices has meant a reduction in trade through the Port of Wyndham.
Of particular impact was the closure of the Kimberley Metal Group’s Ridges Iron Ore Project during the 2014/15 financial year. The last shipment of iron ore occurred in February 2015 and final shipment of nickel concentrate through the port occurred in July 2016. Crude oil exports also ceased in January 2016, following the decline in world crude oil prices.
The export infrastructure, including the barges and tugs, are still located in Wyndham providing the capacity for the trade to recommence when demand increases.
The downturn in the region’s mining industry has also resulted in a reduction in fuel (diesel) imports for the 2015/16 financial year, with further reduction anticipated during 2016/17.
The live export trade continues to be an important trade for the port, with more than 29,163 head of cattle being exported during the year, which totalled more than 8,500 tonnes.
A second shipment of mahogany logs from the Ord River Irrigation Area was exported to China during 2015/16 and the final shipment is expected in 2016/17.
The Port of Wyndham also handles small tourist vessels and boutique cruise ships which operate in the north west, along with occasional shipments of explosives. The Port of Wyndham continues to provide a valuable service to the region, despite diminishing trade. The port continues to pursue new trade opportunities as they become available.
Achievements for 2015/16
à The first shipment of bulk fertiliser into the port for over a decade occurred in 2016.
à The first shipment of corn from the Ord Irrigation Scheme was exported to South Korea in late 2016, with the potential to become an annual shipment.
Strategic directions
The development of 8,000 hectares of irrigated farmland released under the Ord-East Kimberley Development Plan commenced in 2014/15, which is expected to generate exports and imports through the Port of Wyndham.
As part of the Ord-East Kimberley Development Plan, $10 million has been allocated to upgrade the Port of Wyndham, to improve the efficiency and capacity of the port through the construction of better storage facilities, improved access and upgrades to maintenance buildings, and repairs to the existing jetty structure. The Port of Wyndham is a critical transport hub for the East Kimberley
PORT OF WYNDHAM
3232

Port capacity
LENGTH OF DEPTH AT MAX. DRAUGHT BERTHS BERTH (M) BERTH (M) OF VESSEL (M)*
Product specific loading facilities 314 8.0 Tide dependent
North and South Berth combined – general purpose
* The maximum sailing draught of a vessel is variable depending on the limitations of the tides and should be confirmed with the Harbour Master, prior to the vessel’s entry into the port.
Port of Wyndham throughput 2006/07 to 2015/16
Trad
e Th
roug
hput
(tho
usan
ds to
nnes
)
2,500
2,000
Exports Imports 5468
60
34
2,12
7
2,08
8
1,63
5
1,16
4 26
168
1,500
1,000
500
0 2007 2008 2009 2010 2011 2012 2013 2014 2015 2016
Financial Year ended 30 June
Port of Wyndham
region and a primary point of access for a range of commodities including fuel oil, fertiliser and ammonium nitrate.
The scale of agricultural processing and export through the Port of Wyndham is largely dependent on the development of additional agricultural land in Western Australia and the Northern Territory.
Port of Wyndham percentage throughput by commodity 2015/16
Nickel Concentrate – Exports 70%
Diesel – Imports 12%
Live Cattle – Exports 4%
Crude Oil – Export 10%
Other – Imports and Exports 4%
3333

CONTACTS
Fremantle Port Authority Southern Ports Authority Chair: Jim Limerick Chair: Robert Cole Chief Executive Officer: Chris Leatt-Hayter Chief Executive Officer: Nicolas Fertin
Address: 1 Cliff Street E: [email protected] Fremantle WA 6160 Postal address: PO Box 95 Port of Albany Fremantle WA 6959 Address: 85 Brunswick Road T: +61 8 9430 3555 Albany WA 6330 F: +61 8 9336 1391 Postal address: PO Box 175
E: [email protected] Albany WA 6331
W: www.fremantleports.com.au T: +61 8 9892 9000 F: +61 8 9841 7566
Kimberley Ports Authority E: [email protected] W: www.southernports.com.au Chair: Laurie Shervington
Chief Executive Officer: Kevin Schellack Port of Bunbury
E: [email protected] Address: 54 Casuarina Drive W: www.kimberleyports.wa.gov.au Bunbury WA 6230 Postal address:Port of Broome PO Box 4 Bunbury WA 6231
Address: 401 Port Drive T: +61 8 9729 6500 Broome WA 6725 F: +61 8 9721 8253 Postal address: PO Box 46
Broome WA 6725 E: [email protected] W: www.southernports.com.au T: +61 8 9194 3100
F: +61 8 9194 3188 (Operations) Port of Esperance
Mid West Ports Authority Address: The Esplanade Esperance WA 6450 Chair: Ian King Postal address: PO Box 35 Chief Executive Officer: Peter Klein Esperance WA 6450
Port of Geraldton T: +61 8 9072 3333 F: +61 8 9071 1312 Address: 298 Marine Terrace
Geraldton WA 6530 E: [email protected] Postal address: PO Box 1856 W: www.southernports.com.au Geraldton WA 6531
Pilbara Ports Authority T: +61 8 9964 0520 F: +61 8 9964 0555 Chair: Ken Pettit
Chief Executive Officer: Roger Johnston E: [email protected] W: www.midwestports.com.au
Port of Dampier Address: Mof Road Burrup Penisula, Dampier WA 6713 Postal address: Locked Bag 5006 Karratha WA 6714
T: +61 8 9159 6555 F: +61 8 9159 6557
E: [email protected] W: www.pilbaraports.com.au
3434

Port of Port Hedland Postal address: PO Box 402 Fremantle WA 6959 Address: The Esplanade
Port Hedland WA 6721 T: +61 8 9435 7692 Postal address: Locked Bag 2 F: +61 8 9435 7807 Port Hedland WA 6721 E: [email protected] T: +61 8 9173 9000 W: www.transport.wa.gov.au F: +61 8 9173 9060
Department of Transport E: [email protected] Marine Safety W: www.pilbaraports.com.au General Manager: Ray Buchholz
Ports WA Address: Marine House Secretary: Eugenie Ong 1 Essex Street Fremantle WA 6160
Postal Address: PO Box 402 Postal address: PO Box 95 Perth WA 6959 Fremantle WA 6959 T: +61 8 9435 7555 T: +61 8 9430 3555 F: +61 8 9435 7807 F: +61 8 9336 1391 E: [email protected] E: [email protected] W: www.transport.wa.gov.au
Freight and Logistics Council Department of Transport of Western Australia Coastal Infrastructure
Executive Officer: Mark Brownell General Manager: Steve Jenkins
T: +61 417 962 360 Address: 1 Essex Street
E: [email protected] Fremantle WA 6160 W: www.freightandlogisticscouncil.wa.gov.au Postal Address: PO Box 402
Fremantle WA 6959 Port of Wyndham Cambridge Gulf Limited T: +61 8 435 7661
F: +61 8 435 7805 Harbour Master: Brian Tod
E: [email protected] Port Manager: Steve Forrest W: www.transport.wa.gov.au
Postal Address: PO Box 185 Meatworks Road Wyndham WA 6740 Department of Transport T: +61 8 9161 1203 Ports and Maritime F: +61 8 9161 1244 Executive Director: Catherine Wallace E: [email protected] Address: 140 William Street Chief Executive Officer: Tony Chafer Perth WA 6000 Address: PO Box 238 Postal Address: GPO Box C102 Kununurra WA 6743 Perth WA 6839 T: +61 8 9168 2900 T: +61 8 6551 6208 F: +61 8 9168 2899 F: +61 8 6551 6948 E: [email protected] E: [email protected]
W: www.transport.wa.gov.au Department of Transport Marine Safety Harbour Master: Steven Wenban
Address: Marine House 1 Essex Street Fremantle WA 6160
3535

CONTACT Department of Transport 140 William Street Perth WA 6000 Telephone: (08) 6551 6000 Website: www.transport.wa.gov.au
The information contained in this publication is provided in good faith and believed to be accurate at time of publication. The State shall in no way be liable for any loss sustained or incurred by anyone relying on the information.122016
DoT
148
6200
1