western australia rail access regime independent ... bank... · western australia rail access...
TRANSCRIPT

Macquarie Bank Limited
Final Report
Western Australia Rail Access RegimeIndependent Assessment of Maximum Rate of
Return on Rail Infrastructure
Macquarie Bank LimitedProject and Structured Finance
23 August 1999
Independent Assessment of Maximum Rate of Return on Rail Infrastructure - Final Page i
Macquarie Bank Limited
Table of Contents
Important Notice........................................................................................................iii
Glossary of Terms.....................................................................................................iv
Submissions Received ..............................................................................................1
1. Executive Summary ...............................................................................................2
2. Introduction ............................................................................................................42.1 Scope of Work............................................................................................................42.2 Specific Issues ...........................................................................................................42.3 Role ............................................................................................................................42.4 Methodology...............................................................................................................52.5 Regulatory Objectives ................................................................................................62.6 Risk Assessment........................................................................................................62.7 Separating Urban and Freight Infrastructure .............................................................72.8 Separating Below Rail and Above Rail Assets ..........................................................72.9 Impact of Open Access Regime.................................................................................92.10 Relationship Between the Maximum Rate of Return and Average Return..............9
3. Methodology.........................................................................................................123.1 Capital Asset Pricing Model .....................................................................................123.2 CAPM and WACC Methodology ..............................................................................133.3 Input Variables .........................................................................................................133.4 The Risk Free Rate and the Real Risk Free Rate ...................................................143.5 Inflation.....................................................................................................................143.6 Cost of Debt .............................................................................................................153.7 Cost of Debt Margin .................................................................................................153.8 Market Risk Premium...............................................................................................163.9 Level of Debt Funding ..............................................................................................163.10 The Corporate Tax Rate ........................................................................................193.11 The Impact of Dividend Imputation ........................................................................193.12 Cost of Equity .........................................................................................................203.13 Beta Determination.................................................................................................20
4. Systematic Risk....................................................................................................234.1 Freight Infrastructure................................................................................................23
4.1.1 Economic Conditions ............................................................................................... 244.1.2 Market Risk Impact on Freight Volumes .................................................................. 244.1.3 Conclusion............................................................................................................... 25
4.2 Urban Infrastructure .................................................................................................254.2.1 Economic Conditions ............................................................................................... 254.2.2 Market Risk.............................................................................................................. 264.2.3 Conclusion............................................................................................................... 26
Independent Assessment of Maximum Rate of Return on Rail Infrastructure - Final Page ii
Macquarie Bank Limited
5 Specific (Non Systematic) Risk ...........................................................................275.1 Specific Risks Facing Freight Infrastructure ............................................................27
5.1.1 Customer Base........................................................................................................ 275.1.2 Intermodal Contestability ......................................................................................... 285.1.3 Regulatory ............................................................................................................... 285.1.4 Technology Risk ...................................................................................................... 295.1.5 Grain Freight Task................................................................................................... 295.1.6 Conclusion............................................................................................................... 31
5.2 Specific Risks Facing Urban Infrastructure..............................................................325.2.1 Ridership Volatility ................................................................................................... 325.2.2 Legislative Changes ................................................................................................ 325.2.3 Regulation of Competition ....................................................................................... 325.2.4 Technology Risk ...................................................................................................... 335.2.5 Level of Government Funding ................................................................................. 335.2.6 Public Relations and Service Enhancements .......................................................... 335.2.7 Availability of Rolling Stock and New Infrastructure Capacity .................................. 335.2.8 Conclusion............................................................................................................... 33
6. Results ..................................................................................................................346.1 Table of Component Values.....................................................................................346.2 Transformation of Nominal post tax WACC to a real pre tax WACC.......................346.3 Maximum Rate of Return on Rail Infrastructure.......................................................35
7. Review of the maximum rate of return...............................................................377.1 Mechanism and Frequency......................................................................................377.2 Management of Deviations Beyond the Ceiling and Floor Tests.............................38
Appendix 1 - Definition of Infrastructure ...............................................................40 Freight Infrastructure ............................................................................................40
Standard Gauge Routes................................................................................................... 40Narrow Gauge Routes ...................................................................................................... 40Urban Infrastructure.......................................................................................................... 41

Independent Assessment of Maximum Rate of Return on Rail Infrastructure - Final Page iii
Macquarie Bank Limited
Important NoticeThis report has been prepared by Macquarie on behalf of the Department of Transport,following discussion with stakeholders and consideration of submissions lodged withMacquarie following publication of the Draft Report dated 9 July 1999. Macquarie has alsoutilised various information sources in its calculations.
Macquarie has not independently verified the accuracy of this information and has relied uponit in its judgement and calculations undertaken in the report.
No representation or warranty is made that the information relied upon is without fault.
Independent Assessment of Maximum Rate of Return on Rail Infrastructure - Final Page iv
Macquarie Bank Limited
Glossary of TermsACCC Australian Competition and Consumer Commission
AWB Australian Wheat Board
CAPM Capital Asset Pricing Model
CBH Co-Operative Bulk Handling
CSO Community Service Obligation
GLC Grain Logistics Committee
GRV Gross Replacement Value
IPART Independent Pricing and Regulatory Tribunal (NSW)
NCC National Competition Council
NRC National Rail Corporation
ORG Office of the Regulator General (Victoria)
PGA Pastoralists and Graziers Association
RAC Rail Access Corporation (NSW)
the Code Government Railways Access Code 1999 (WA)
the Department Department of Transport (WA)
the Regulator Rail Access Regulator (WA)
WACC Weighted Average Cost of Capital
WAFF Western Australian Farmers Federation
Independent Assessment of Maximum Rate of Return on Rail Infrastructure - Final Page 1
Macquarie Bank Limited
Submissions Received
Submissions were received from the following organisations in response to the Draft Reporton 9 July 1999:
• Toll Holdings
• Mr Neville Smith
• Western Mining Corporation
• The Department of Transport
• Westrail Network Group
• The WA Treasury Department
• National Rail Corporation
• Meyrick & Associates (on behalf of National Rail Corporation)
• National Competition Council Each of these submissions has been considered in preparation of this Final Report.
Independent Assessment of Maximum Rate of Return on Rail Infrastructure - Final Page 2
Macquarie Bank Limited
1. Executive Summary This report has been prepared as part of an independent assessment process to determine themaximum rate of return on Westrail’s rail infrastructure (the “Infrastructure”). The report hasfinalised the appropriate maximum value for the rate of return following review andconsideration of submissions received in relation to the Draft Report dated 9 July 1999. This report discusses the assessment task, Macquarie’s role, methodology and the assessmentprocess undertaken to date. Results are presented as a range of values, from which amaximum value for the rate of return has been determined. Macquarie has determined a range for the maximum rate of return by using capital assetpricing model (“CAPM”) theory to calculate the rate of return, and this is expressed as a realpre tax weighted average cost of capital (“WACC”). Macquarie has researched theInfrastructure’s market environment to assess its key operating risks, and in turn, hascalculated an appropriate maximum rate of return considering market expectations of returnsfor investments of similar risk. Through this process, Macquarie has determined that it is appropriate to provide separatemaximum rates of return for the Urban infrastructure (“Urban”) and the Freight infrastructure(“Freight”). Macquarie has concluded that these two components of the Infrastructure aresufficiently independent, both geographically and in terms of operating environment and risk.The Freight infrastructure is defined to include all rail infrastructure assets excluding theUrban infrastructure. Both networks are defined in Appendix 1 to this report. The two components of the Infrastructure - Urban and Freight - are not publicly listed andhave therefore been compared with a range of Australian and international rail, transport andinfrastructure assets in relation to which data on the volatility of returns is available. Thiscomparison relies upon evidence suggested by the CAPM that there is a linear positiverelationship between risk and return, represented as the security market line. This processadequately accounts for these systematic risks, such as changes in the business cycle, that arefaced by all investments. Non systematic risks, or “specific risks”, are risks specific to individual investments. CAPMtheory assumes that investors manage these risks through diversification. Risks specific tothe Infrastructure have been assessed by Macquarie independently of the CAPM calculations,and careful judgment has been made as to their impact on the total set of risks faced by theInfrastructure. It is imperative that these risks be assessed only when they prevail on theInfrastructure and not on some other part of the Westrail business, namely the “above rail”business. This issue is discussed as part of the specific issues in Section 2.6. The pricing methodology that will be enforced by the WA Government Railways (Access)Code 1999 (the “Code”) contains a limit on the revenue any section of the Infrastructure canearn. The maximum rate of return is one variable used to calculate what this maximum levelof revenue can be. The limit on revenue is referred to as the ceiling test, or the CombinatorialTest. The Combinatorial Test has been considered by Macquarie in its determination of theappropriate maximum as it will potentially limit returns to the Infrastructure on average byconstraining total revenue.

Independent Assessment of Maximum Rate of Return on Rail Infrastructure - Final Page 3
Macquarie Bank Limited
Macquarie received a number of submissions during the public consultation process which ithas considered in determining the final values for the appropriate maximum rates of return.The content of those submissions is referred to throughout this report. Macquarie’sassessment of both systematic and specific risks facing the Infrastructure and theCombinatorial Test has resulted in the following conclusions: The Draft Report suggested appropriate maximum values for the Freight infrastructure of8.9%, and 6.0% for the Urban infrastructure, both real pre tax. These values have beenrevised downwards after consideration of submissions and review of previous analysis. The revised range of WACC values for the Freight infrastructure is 6.2% to 8.2% real pretax. After assessment of the specific risks facing the Freight infrastructure, and considerationof the range, Macquarie has determined an appropriate maximum rate of return value of8.2%. The revised range of WACC values for the Urban infrastructure is 4.6% to 5.5% real pretax. After assessment of the specific risks facing the Urban infrastructure, and considerationof the range, Macquarie has determined an appropriate maximum rate of return value of5.1%.

Independent Assessment of Maximum Rate of Return on Rail Infrastructure - Final Page 4
Macquarie Bank Limited
2. Introduction 2.1 Scope of Work
The Report is to: • Determine an appropriate methodology to calculate the WACC and using the
methodology, calculate the maximum WACC value for the Western Australian rail tracknetwork, having regard to Westrail’s commercial and operating environment.
This should be a risk-adjusted rate of return to Westrail that is consistent with the returnscurrently being sought by investors in commercial enterprises operating in competitivemarkets and facing similar business risks to those faced by Westrail in the provision of thenetwork service.
• Recommend a frequency for formal reviews to revise the maximum WACC value and amechanism to review the WACC annually between formal reviews.
2.2 Specific Issues Macquarie has been asked to consider the following issues, derived from the WA Rail AccessRegime, as part of determining the appropriate risk adjustment for the long term targetWACC: • Whether or not the risk for Westrail’s rail infrastructure business can and should be
assessed separately to the risk of Westrail’s business as a whole, having regard totheoretical arguments supporting one approach over another and the availability ofsuitable market data. (refer to sections 2.7 and 2.8)
• How risk is assessed, the methodology employed and the sources of data used. (refer tosection 2.6)
• How the risk assessment relates to the rate of return to be applied in the ceiling in theRegime, in particular, the appropriateness or otherwise of translating “average” returnsobserved for particular companies into the “maximum” return to be applied to any onegroup of operators under the Regime. (refer to section 2.10)
2.3 Role Macquarie’s independence in this process is paramount. In its role, Macquarie has consultedextensively with stakeholders, some of which have competing interests with regard to themaximum rate of return. Macquarie has completed a Draft Report and sought publiccomment in the form of written submissions. Macquarie has assessed submissions andarguments provided by the stakeholders in view of the objectives of the report. Discussion ofthese submissions is provided throughout this report.
Independent Assessment of Maximum Rate of Return on Rail Infrastructure - Final Page 5
Macquarie Bank Limited
There are certain inconsistencies between the definition and application of the WACC asdescribed by Draft 9 of the Code and as described by the scope of work supplied toMacquarie for this assignment. In particular, the Code does not provide for the application ofa maximum WACC as such and also states that the WACC is to be “the WACC to theCommission”, which may imply that the Code is seeking an actual WACC figure, not an“appropriate” WACC figure. The Code’s definition of the WACC is not consistent with thedefinition contained in the scope of work and applied by Macquarie in this report. Macquariehas been advised that the Code is to be amended to provide for the application of a maximumWACC Macquarie has completed this final report on the understanding that the Department has made(or will make) various changes to the Code to reflect the specific issues detailed in the scopeof work. A summary of the necessary changes are provided below:
• provision for the application of a maximum WACC;
• clarification that the WACC is a risk adjusted WACC, appropriate to theInfrastructure of Westrail;
• clarification of the Regulator’s review process and timing of reviews of theWACC; and
• provision for a management process for breaches of the ceiling test and thefloor test.
A discussion of the last two changes is provided in Section 7 of this report.
2.4 Methodology Macquarie has utilised CAPM theory to determine the Infrastructure’s long term targetWACC. CAPM theory is the most widely endorsed method for calculating WACC and hasreceived extensive discussion during the privatisation of the Victorian gas industry, NSW railaccess pricing and continues to be debated as regulation of public and privatised assetsevolves. Macquarie believes that the significant momentum of the CAPM methodologydebate in the broader regulatory context will continue to refine its performance and provideongoing improvements to its application. Macquarie notes that the Australian Competition and Consumer Commission (“ACCC”) hasrecently proposed a change from applying a real pre tax WACC as an appropriate measure ofa rate of return on an asset base for the purposes of regulating transmission revenues in theelectricity industry. This change proposes using the nominal after tax return on equity as thekey target rate of return variable to achieve regulatory outcomes. This approach represents achange in regulation methodology, however, its application to rail access regulation has yetto be sufficiently debated. In the context of this report, Macquarie has no scope to debate therelevance or preference of this approach to the one prescribed in the access legislation.
Independent Assessment of Maximum Rate of Return on Rail Infrastructure - Final Page 6
Macquarie Bank Limited
CAPM theory is founded on the relationship between investors’ preferences for risk andreturn. Investors expect similar returns from investments of similar risk. Therefore, anyentity’s capacity to attract capital should depend on its returns being comparable withinvestments of similar risk. Portfolio theory describes how rates of return for investments ofsimilar risk are comparable in their covariance with the market portfolio. This isdemonstrated by the security market line, which displays a positive linear relationshipbetween risk and return. Once an entity or investment’s risk is understood relative to themarket portfolio, and expressed using the variable beta, the CAPM delivers a value for themarket’s expectations on the returns to equity necessary for the investment to be sustainable.Determination of beta is the most subjective aspect of the WACC methodology. Macquarie has sought to clearly identify the risks facing the Infrastructure so as to enablecomparison with similar businesses for which relevant empirical data is available. From thisdata it is possible to apply CAPM theory in the derivation of the appropriate rate of return onthe Infrastructure. Macquarie’s analytical approach is broadly consistent with that taken bythe Independent Pricing and Regulatory Tribunal (“IPART”) in its determination of themaximum rate of return for Rail Access Corporation (“RAC”) in NSW. Macquarie has alsoconsidered several of the statements made by the ACCC in its document, “Draft Statement ofPrinciples for the Regulation of Transmission Revenues”. The CAPM and WACC formulae components and derivation methods are discussed ingreater detail in Section 3.
2.5 Regulatory Objectives The required rate of return to encourage investment over the long term is equal to an entity’sactual WACC. In the presence of a natural monopoly, rates of return on assets are notregulated by competition and may lead to inefficient outcomes in respect of the pricescharged for services or access, excessive investment in assets (“gold plating”) or thecontinuance of inefficient cost structures. Regulation seeks to imitate competitive outcomes.Effective regulation requires that a target WACC be set which generates sufficient revenue tocompensate the investor for its investment. At this WACC, the Infrastructure owner will beable to achieve a reasonable rate of return while charging efficient prices for access and willbe motivated and able to maintain long term investment in the Infrastructure sufficient toprovide services at levels required by the market. However, calculation and application of an appropriate WACC is a necessary but notsufficient basis for pricing access. To be effective, all elements of the proposed regime mustoperate to achieve the desired outcomes. Such analysis is beyond the scope of this report.
2.6 Risk Assessment Determination of the WACC for the Infrastructure using CAPM is an empirical and partiallysubjective process. Many of the variables applied by CAPM theory can be observedempirically, however, the calculation of an appropriate return to equity is dependent uponassumptions made concerning the Infrastructure’s risk relative to the market portfolio, asmeasured by the Infrastructure’s beta. Beta measures the covariance of returns between an individual investment and the marketportfolio. Beta is therefore a measure of systematic, non investment-specific risk. Beta datafor the Infrastructure is not available as Westrail is presently an unlisted, government ownedentity. Assessing comparable investments that have published beta data is accepted as the

Independent Assessment of Maximum Rate of Return on Rail Infrastructure - Final Page 7
Macquarie Bank Limited
most viable approach to estimating an appropriate beta for the Infrastructure. However,scarcity of comparable data can introduce subjectivity to the process.
2.7 Separating Urban and Freight Infrastructure Assessment of the types of risk facing the Infrastructure, made after gaining an understandingof the prevailing operating environment, has led to a clear distinction being made byMacquarie between the Urban and Freight components of the Infrastructure. This distinctionhas been made in consideration of the following facts: • Urban Passenger Services are conducted by Westrail on behalf of the Department. The
Department reimburses Westrail the agreed costs incurred in providing the UrbanPassenger Services under a formal arrangement, regardless of the operating profitability ofthe service. These reimbursement payments are tied to pre-negotiated service levels.Operating risks associated with the Urban infrastructure are therefore borne by theDepartment. There are no foreseeable changes to these arrangements or correspondinggovernment policies that will increase the risks facing the Urban infrastructure.
• As the Urban infrastructure serves the population of the Perth metropolitan region,ownership risk is ameliorated by the low prospects of asset stranding, asset obsolescence,unfavourable changes in the regulatory environment, decreasing use of the infrastructure,or volatility in forecast demand. The set of risks facing the Urban infrastructure arediscussed in more detail in Sections 4.2 and 5.2.
• Westrail Freight does not operate at a loss and does not receive community serviceobligation (“CSO”) payments from the Department. Approximately 90% of WestrailFreight’s revenue comes from commercial agreements with private entities.
• Because none of Westrail Freight’s rail freight task is directly regulated, road transportoperators are able to bid for the majority of Westrail’s freight task.
Based on the above facts, the market risk facing the Freight infrastructure is considered to begreater than that of the Urban infrastructure. Further, the lack of regulation of Freightcompared to Urban introduces road contestability as a potential risk to Freight infrastructure.Asset stranding risk is also more prevalent in the Freight infrastructure. On the basis of thesefundamental differences, Macquarie has proceeded in its analysis by considering the twocomponents of Infrastructure separately. This approach is considered appropriate until suchtime as there is a significant change in the operating environment, e.g. a policy shift awayfrom Government support of the metropolitan passenger network.
2.8 Separating Below Rail and Above Rail AssetsA key consideration is whether the risks associated with the below rail assets are able to bemeaningfully assessed independently of the above rail operations. Whilst this is atheoretically correct approach, there are practical difficulties associated with availability ofrelevant market data. In particular, much available data is related to vertically integrated railoperations with little data available in respect of “pure” below rail assets and risks.

Independent Assessment of Maximum Rate of Return on Rail Infrastructure - Final Page 8
Macquarie Bank Limited
Macquarie has sought to overcome this information asymmetry by firstly assessing pure railinfrastructure data (NSW Rail Access Corporation, Railtrack of the UK) and thereafteridentifying the differences in operations and therefore risks, between other observedcompanies and the Infrastructure.
There are distinguishable differences in the risk profiles of the Infrastructure assets and the“above rail” assets. How well these differences can be captured by available market data is aseparate issue. Scarcity of data does not prevent rational discussion and judgement on whatimpact these risks should have on the Infrastructure’s WACC based on extensiveconsultation.
Submissions received by Macquarie generally endorsed this approach. Westrail argued thatdue to shortages in available data it is appropriate that Macquarie derive beta values for theentire Westrail business. Macquarie recognises that there are shortages in observable data inregard to pure rail infrastructure. Consequently Macquarie has applied judgement indetermination of what the appropriate beta values are that best reflect the risk profiles of bothtypes of infrastructure. Macquarie has concluded that to consider the risks facing the entireWestrail Freight business would potentially lead to inappropriate outcomes with regard to therate of return. These are discussed below.
With open access to rail infrastructure, the above rail assets of Westrail Freight are incompetition with other rail operators as well as road and sea transport. By contrast, the railinfrastructure is in competition only with non-rail forms of transport, as it is a naturalmonopoly. Market risk is therefore greater for the “above rail” assets of Westrail, due to theincreased contestability of revenues. For example, an existing rail customer could chooseanother operator or could choose to undertake the task itself. Whilst the above rail assetsmay be displaced, it is possible (indeed likely in many cases) that the below rail assets willcontinue to be used. In Westrail’s case (as discussed below) many of the commodities ittransports are unlikely to be economically transportable by road. Consequently, whilstWestrail Freight may run the risk of losing certain customers, the risk that those customerswill chose other forms of transport is considered low. Accordingly, the risk of theInfrastructure is considered, prima facie, to be lower than the risk of the above rail business.
In an open access environment, to determine the target long term WACC on the basis ofWestrail Freight’s entire risk profile is considered inappropriate and could potentially lead tothe perverse situation where third party rail operators are expected to pay access prices whichfactor in the risk of their own potential entry into the rail freight market. This would imposean inequitable cost on third party operators who would be charged via higher access rates toinfrastructure. This is one example that displays the potentially inequitable outcomes ifWestrail’s entire risk profile is considered when determining the long term target WACC.
The rail infrastructure investment decision is influenced significantly by the rate of returnapplied by the Rail Access Regulator (the “Regulator”). Westrail has proposed that the rateof return (WACC) applicable to the Infrastructure is equivalent to that of the verticallyintegrated business because it is the integrated railway that makes the investment decision. Ifthis argument was accepted by the Regulator, it could potentially lead to inefficient outcomessuch as over capitalisation of the Infrastructure where the rate of return did not reflect themarket’s value of the Infrastructure.

Independent Assessment of Maximum Rate of Return on Rail Infrastructure - Final Page 9
Macquarie Bank Limited
The risks facing the Infrastructure are arguably lower than those facing the integratedbusiness by reason of the fact that above rail activities are contestable. This implies that thediscount rates used for investment analysis by the Freight operating business should behigher than that of the Infrastructure in isolation, assuming the typical relationship betweenrisk and return.
It is possible that another above rail freight operator may have a hurdle rate that is lower thanthat of Westrail’s above rail business. This operator may be prepared to undertake freighttasks at lower costs than Westrail or when it is uneconomic for Westrail to do so. Thisoperator may be able to operate viably whilst paying efficient access charges to the Freightinfrastructure owner. This is an example of an efficient pricing outcome advocated by theCode and is one of the key regulatory objectives. This outcome potentially increases railinfrastructure utilisation while delivering efficient pricing outcomes to freight operators andtheir customers. To apply a higher discount rate than the one appropriate for theInfrastructure may restrict competition between freight operators and may decrease theviability of sections of the Infrastructure if efficient outcomes achievable by other Freightoperators are restricted.
2.9 Impact of Open Access RegimeMacquarie recognises that the risks facing rail infrastructure are changed when an openaccess regime is introduced. These include factors such as:
• incentives to invest in new infrastructure;
• exposure to larger number of freight operators and associated risks; and
• loss of pricing efficiency outcomes. Macquarie has considered these factors in determination of an appropriate beta. On balanceMacquarie has concluded that the risks facing the Freight infrastructure in a ringfencedenvironment due to open access should not impact on the equity beta range applied as theimpact of the open access regime is a diversifiable (specific) risk facing the Infrastructure.As a specific risk, Macquarie considers that the impact on the maximum WACC valueselected is minimal, given the majority of the risk (due to open access) is borne by the Freightbusiness (ie. the above rail assets), and not the Freight infrastructure.
2.10 Relationship Between the Maximum Rate of Return and Average Return As part of this review Macquarie is required to consider the appropriateness or otherwise oftranslating “average” returns observed for comparable companies into the “maximum” returnto be applied to any one group of operators under the Regime. Due to the imprecise nature of using comparable entity data to derive beta values, Macquarieconsiders it prudent to determine a range of beta values rather than a point estimate. Thehigh point of this range represents the maximum level of systematic risk applicable tocomparable infrastructure (i.e. below rail infrastructure investments generally).

Independent Assessment of Maximum Rate of Return on Rail Infrastructure - Final Page 10
Macquarie Bank Limited
Assessment of the impact of specific risks on the appropriate maximum rate of return occursindependently of the assessment via CAPM. Given that specific risks are diversifiable, itwould be inappropriate to go outside the range specified by CAPM. Specific risks areconsidered to achieve the objective of determining a risk adjusted rate of return that isconsistent with returns being sought by investors in commercial enterprises operating incompetitive markets and facing similar business risks to those faced by Westrail in theprovision of the network service. Macquarie has examined the relationship between the maximum rate of return and the rangederived from the CAPM methodology. First, Macquarie would make the following comments regarding the Baumol pricingmethodology as outlined by the Code: • The ceiling test constrains the maximum revenue receivable by any section of the
Infrastructure to total cost. This is known as the Combinatorial Test.
• Total cost includes a return on capital described by the Code as “the WACC to theCommission”. This WACC is described by the Department in its scope of work as anappropriate risk adjusted WACC having regard to Westrail’s commercial and operatingenvironment. Macquarie understands that the Code will be changed to reflect this.
• As the ceiling test applies the WACC to the gross replacement value (“GRV”) of theinfrastructure, it is not possible to cross subsidise under-performing infrastructure byover-recovery of costs on well utilised sections of track.
• Commercial constraints on poorly utilised sections of the infrastructure mean that thesesections may not earn their total cost in terms of GRV.
• Therefore, if total costs are not achieved on certain sections of the network, the entirenetwork cannot earn its total cost on average.
• The apparent purpose of the maximum rate of return concept is to permit access pricingflexibility so that a degree of discriminatory pricing can occur in order for the network toearn an appropriate return on average.
• Understanding what this maximum rate of return should be in view of efficientdiscriminatory pricing outcomes is a complex task that requires significant scenarioanalysis of the Infrastructure’s operating environment and asset valuations. Further,modeling of the impact of the Combinatorial Test on average network returns is complexand potentially inexact.
Undertaking such an analysis is beyond the scope of this assignment given the level ofinformation and time available. Macquarie notes that IPART in its selection of a maximum rate of return for RAC in NSWchose a value from a range calculated by the CAPM framework and chose not to fully modelthe possible scenarios which incorporated variations in tonnages and resulting revenue andcost results and in turn the access pricing outcomes. Instead it sought a consensus betweenmajor stakeholders about the “reasonableness” of the maximum rate on the basis of otherrecent regulatory outcomes and the set of risks facing the business.
Independent Assessment of Maximum Rate of Return on Rail Infrastructure - Final Page 11
Macquarie Bank Limited
Macquarie has adopted a similar approach given the analytical complexity of modelingpricing outcomes. In Macquarie’s view, the selection of the maximum point in the range isappropriate having regard to objectives of the Combinatorial Test and the fact that goingoutside of the range derived by CAPM is inappropriate from an economic efficiencyperspective (i.e. that specific risk is diversifiable so should not be rewarded). Macquarie has received submissions requesting that Macquarie apply an uplift factor to themaximum value (Westrail) and that Macquarie adopt the midpoint of this range as being theappropriate maximum value (NRC). Macquarie considers the likelihood of certain tracksections not earning an appropriate average rate of return to be real given the GRV valuationmethodology contained in the Code. Consequently the role of the maximum rate of return isto allow sufficient scope for the Infrastructure owner to achieve an appropriate average rateof return, whilst not permitting monopoly pricing. In practice, defining this maximum toachieve the necessary accuracy required is difficult in light of regulatory objectives. Returnsare influenced by a number of unpredictable outcomes that impact revenue and costs, such asload fluctuations, and therefore impact on actual returns to the Infrastructure. As such, it isdifficult to forecast and apply a maximum rate in practice that will not permit monopolyrents, but which also allows the Infrastructure owner to receive an appropriate rate of returnwith equitable access pricing outcomes for a variety of Freight operators. Alternative approaches to achieve the desired economic and social outcomes may involvereconsideration of:
• asset rationalisation (i.e. closure of uneconomic lines);
• CSO payments; and
• asset valuations (i.e. some basis other than GRV). Macquarie has used its judgement in the assessment of an appropriate maximum. Furtherdiscussion is provided in section 6.3. The Regulator under the current provisions of the Codewill be required to review this WACC annually. The review process is discussed further inSection 7.
Independent Assessment of Maximum Rate of Return on Rail Infrastructure - Final Page 12
Macquarie Bank Limited
3. Methodology This section outlines the methodology applied in calculating the Infrastructure’s target longterm WACC and the associated maximum rate of return. It includes discussion of thecomponents of the CAPM and WACC formulae and explanation of their derivation. Theresults are summarised in a table at the end of this section.
3.1 Capital Asset Pricing Model The classical CAPM uses the following formula to estimate the after tax cost of equity:
( )( )k r re f m = + × β Where: ke = after tax cost of equity
rf = the nominal risk free rate
rm = the Australian market risk premium (of equities over the risk free rate)
β(beta) = the systematic risk of equity The CAPM theory is an imprecise measure of returns to equity and is best applied bydetermining a range of values for each component. This avoids reliance upon one set ofvalues that may be inaccurate. CAPM theory is very straightforward to apply, but several ofthe key inputs offer scope for subjectivity and have received significant attention duringevolution of Australia’s regulatory debate. Potential difficulties encountered when applying the CAPM methodology, as quoted inIPART’s1 assessment of RAC’s maximum rate of return include: • CAPM is not reliable for accurately predicting actual equity returns over time. It is
argued that if market risk is not identical to systematic risk, beta cannot adequately reflectmarket risk.
• Some of the economic assumptions underlying CAPM may be questionable, e.g. risk freereturns, mean variance analysis, and fully informed investors.
• Measuring the market portfolio is difficult.
• Whether to measure the risk free rate using a historical average rate of return on bonds, aforecast rate, or the prevailing market rate. The relationship between the term structure ofthe bond chosen, the regulatory period, and the average asset life are also issues.
• Estimation of the market risk premium on equity and the equity beta.
• Treatment of firm specific and systematic risk.
• A number of different methods of converting between nominal and real WACC andbetween post and pre tax WACC are used in the market. The method selected cansignificantly alter the results of CAPM.
1 Final Aspects of the NSW Rail Access Regime, Final Report, 28 April 1999

Independent Assessment of Maximum Rate of Return on Rail Infrastructure - Final Page 13
Macquarie Bank Limited
• Whether the effective or the statutory (36 percent) tax rate should be used in grossing upthe post tax cost of equity to a pre tax figure.
• The optimal gearing level, i.e. the profit maximising mix of debt and equity.
Maintaining integrity of data in the presence of these issues leads to a range of values thatform the basis for determining the maximum rate of return. Assessment of specific riskissues beyond the CAPM methodology will lead to refinement of the maximum WACC. A discussion of each of the components of the CAPM and WACC formulae follows. Thecomponents have been derived following significant independent research and keystakeholder consultation. Research has focussed on empirical data sources and currentacademic debate, while stakeholder consultation has included the Department, Westrail, WAState Treasury, major customers of Westrail, Freight operators and various industryrepresentatives.
3.2 CAPM and WACC Methodology The nominal after tax Weighted Average Cost of Capital (“WACC”) formula is:
( )WACC kt
tEV
k tDVe
c
cd c=
−− −
× + −( )
( )1
1 11
γ Where ke = after tax cost of equity
kd = nominal pre tax debt rate
tc = corporate tax rate
D = market value of interest bearing debt
E = the market value of equity
V = the market value of the entity (V = D + E)
γ = franking credit utilisation (“gamma”)
3.3 Input Variables As the Infrastructure is not a listed stock, the beta is unable to be calculated through empiricalobservation of market data. Other components of the formula are readily observable. Theapproach to determining beta is discussed in Section 3.3.12. This section considers the derivation of the following variables: • the risk free rate;
• the expected inflation rate;
• the Australian market risk premium;
• the debt to equity ratio;
Independent Assessment of Maximum Rate of Return on Rail Infrastructure - Final Page 14
Macquarie Bank Limited
• the corporate debt rate;
• the corporate debt margin;
• the corporate tax rate; and
• the degree of franking credit utilisation, expressed as a gamma value.
3.4 The Risk Free Rate and the Real Risk Free Rate CAPM methodology requires that the risk free rate should equate to returns currentlyavailable in the market and be set on a forward-looking basis. The yield on Government Bonds provides an estimate of the risk free rate. As the majority ofthe Infrastructure assets have lives in excess of ten years, the most appropriate bond rate toapply is a rate which matches asset lives. However, very long term bond markets are illiquidand consequently pricing is volatile. For this reason, Macquarie has derived the risk free ratefrom the yield on 10 year CPI Indexed Commonwealth bonds. In its determination for RAC, IPART applied a twenty day (calendar day) average of the 10year Commonwealth Bond rate calculated at the date of its decision. Macquarie accepts thisapproach as being appropriate and has applied the same averaging calculation. From thisapproach Macquarie has calculated a nominal risk free rate of 6.32% To calculate the real risk free rate IPART applied a twenty day (calendar day) average of theAugust 2010 Capital Indexed Bond rate calculated at the date of its decision. This avoidedusing the Fisher equation to adjust for inflation from the 10 year Commonwealth bond rate. Macquarie has calculated the real risk free rate from the same twenty day average as 3.68%. Source: Bloomberg, 13 August 1999
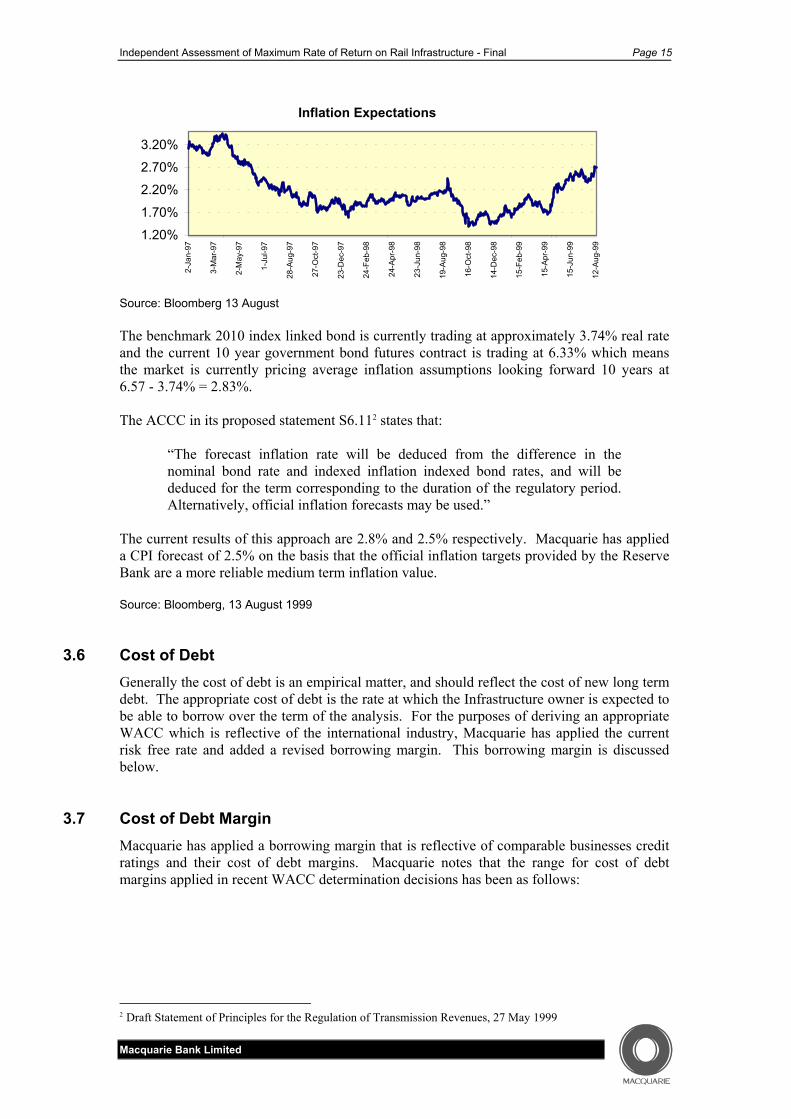
3.5 Inflation The Reserve Bank of Australia sets the inflation target, implements monetary policy and isthe most dominant influence on Australia’s future inflation rate. The RBA’s current longterm target for inflation is between 2.0% and 3.0%. For RAC’s maximum rate of return determination, in April 1999 IPART applied an inflationforecast of 1.79%. Inflationary expectations have increased since that decision was made.This is reflected in the chart below.
Independent Assessment of Maximum Rate of Return on Rail Infrastructure - Final Page 15
Macquarie Bank Limited
Inflation Expectations
1.20%1.70%
2.20%2.70%3.20%
2-Ja
n-97
3-M
ar-9
7
2-M
ay-9
7
1-Ju
l-97
28-A
ug-9
7
27-O
ct-9
7
23-D
ec-9
7
24-F
eb-9
8
24-A
pr-9
8
23-J
un-9
8
19-A
ug-9
8
16-O
ct-9
8
14-D
ec-9
8
15-F
eb-9
9
15-A
pr-9
9
15-J
un-9
9
12-A
ug-9
9
Source: Bloomberg 13 August The benchmark 2010 index linked bond is currently trading at approximately 3.74% real rateand the current 10 year government bond futures contract is trading at 6.33% which meansthe market is currently pricing average inflation assumptions looking forward 10 years at6.57 - 3.74% = 2.83%. The ACCC in its proposed statement S6.112 states that:
“The forecast inflation rate will be deduced from the difference in thenominal bond rate and indexed inflation indexed bond rates, and will bededuced for the term corresponding to the duration of the regulatory period.Alternatively, official inflation forecasts may be used.”
The current results of this approach are 2.8% and 2.5% respectively. Macquarie has applieda CPI forecast of 2.5% on the basis that the official inflation targets provided by the ReserveBank are a more reliable medium term inflation value. Source: Bloomberg, 13 August 1999
3.6 Cost of Debt Generally the cost of debt is an empirical matter, and should reflect the cost of new long termdebt. The appropriate cost of debt is the rate at which the Infrastructure owner is expected tobe able to borrow over the term of the analysis. For the purposes of deriving an appropriateWACC which is reflective of the international industry, Macquarie has applied the currentrisk free rate and added a revised borrowing margin. This borrowing margin is discussedbelow.
3.7 Cost of Debt Margin Macquarie has applied a borrowing margin that is reflective of comparable businesses creditratings and their cost of debt margins. Macquarie notes that the range for cost of debtmargins applied in recent WACC determination decisions has been as follows:
2 Draft Statement of Principles for the Regulation of Transmission Revenues, 27 May 1999
Independent Assessment of Maximum Rate of Return on Rail Infrastructure - Final Page 16
Macquarie Bank Limited
CAPM Parameter IPART Final Decision
Wagga Gas (Mar 1999) IPART NSW Rail Access
Final Report on NSWRail Access (April 1999)
ACCC Victorian GasTransmission FinalDecision (Dec 1998)
Debt margin 1.20% 1.0% 1.20% Macquarie has applied a 1.3% lending margin for Freight infrastructure, and in accordancewith a lower risk profile for the Urban infrastructure, a 1.1% lending margin. This margin is derived from the following assumptions: • 20bp for the typical margin between the 10 year Commonwealth Government bond rate
and a “bank” rate against which credit margins would be levied;
• 90bp for the credit margin on debt funding for Freight infrastructure, and 70bp creditmargin for the Urban infrastructure; and
• 20bp margin for swap costs.
3.8 Market Risk Premium Traditionally, Australian studies have suggested the long term market risk premium to be inthe range of 6% to 7%. In a submission to the ACCC, Davis suggests that applying thistraditional market risk premium may not be in keeping with a forward looking CAPMframework (Davis K, The Weighted Average Cost of Capital for the Gas Industry, March1998). The more stable inflationary environment and impact of dividend imputation maymean that the relevant market risk premium is less than has been observed over recent years. More recent studies have shown the range to be between 5% and 7.5%. A value of 6% wasbeen applied by the ACCC in its Victorian Gas Access Arrangements Decision, and 6% wasalso applied by the Office of the Regulator General (“ORG”). The ACCC has sinceconfirmed in its Draft Statement of Principles for the Regulation of Transmission Revenues(May 1999) that a value of 5% may be more appropriate in view of the ongoing debate andevidence from financial markets. As the market risk premium is a historically derived measure applied on a prospective basis,it can be argued that the market risk premium should be lower than what empirical evidencedemonstrates. Macquarie has accepted the current approach to the market risk premiumvalue proposed by the ACCC. Submissions generally accepted the range proposed byMacquarie in the draft report. On this basis, Macquarie has applied a market risk premium value range of 5% - 6%.
3.9 Level of Debt Funding The appropriate level of gearing to be assumed for the purpose of calculating Infrastructure’scost of capital should reflect the level of gearing which is expected to exist for the periodcapital is being amortised.
Independent Assessment of Maximum Rate of Return on Rail Infrastructure - Final Page 17
Macquarie Bank Limited
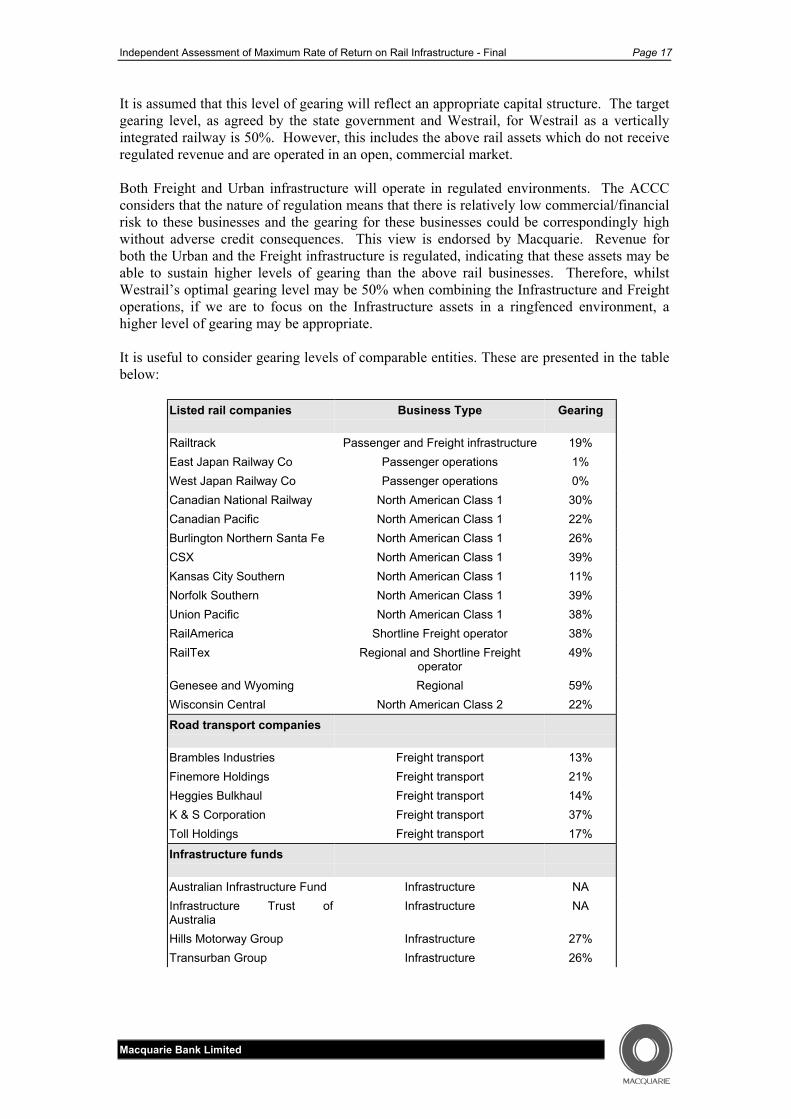
It is assumed that this level of gearing will reflect an appropriate capital structure. The targetgearing level, as agreed by the state government and Westrail, for Westrail as a verticallyintegrated railway is 50%. However, this includes the above rail assets which do not receiveregulated revenue and are operated in an open, commercial market. Both Freight and Urban infrastructure will operate in regulated environments. The ACCCconsiders that the nature of regulation means that there is relatively low commercial/financialrisk to these businesses and the gearing for these businesses could be correspondingly highwithout adverse credit consequences. This view is endorsed by Macquarie. Revenue forboth the Urban and the Freight infrastructure is regulated, indicating that these assets may beable to sustain higher levels of gearing than the above rail businesses. Therefore, whilstWestrail’s optimal gearing level may be 50% when combining the Infrastructure and Freightoperations, if we are to focus on the Infrastructure assets in a ringfenced environment, ahigher level of gearing may be appropriate. It is useful to consider gearing levels of comparable entities. These are presented in the tablebelow:
Listed rail companies Business Type Gearing
Railtrack Passenger and Freight infrastructure 19% East Japan Railway Co Passenger operations 1% West Japan Railway Co Passenger operations 0% Canadian National Railway North American Class 1 30% Canadian Pacific North American Class 1 22% Burlington Northern Santa Fe North American Class 1 26% CSX North American Class 1 39% Kansas City Southern North American Class 1 11% Norfolk Southern North American Class 1 39% Union Pacific North American Class 1 38% RailAmerica Shortline Freight operator 38% RailTex Regional and Shortline Freight
operator 49%
Genesee and Wyoming Regional 59% Wisconsin Central North American Class 2 22%
Road transport companies
Brambles Industries Freight transport 13% Finemore Holdings Freight transport 21% Heggies Bulkhaul Freight transport 14% K & S Corporation Freight transport 37% Toll Holdings Freight transport 17%
Infrastructure funds
Australian Infrastructure Fund Infrastructure NA Infrastructure Trust ofAustralia
Infrastructure NA
Hills Motorway Group Infrastructure 27% Transurban Group Infrastructure 26%

Independent Assessment of Maximum Rate of Return on Rail Infrastructure - Final Page 18
Macquarie Bank Limited
Regulated Infrastructure
RAC Rail Infrastructure Final Decision (April 1999) 50% - 60% ACCC Victorian Gas Transmission Final Decision (December 1999) 60% IPART Albury Gas Company Draft Decision (May 1999) 60% ACCC NSW & ACT Transmission Network Draft Decision (May 1999) 60%
Source: Bloomberg, 29 June 1999 Applying gearing data from other listed rail companies is potentially inaccurate due to datameasurement inconsistencies. Debt like instruments such as long term leases may not beconsidered in the gearing data, therefore gearing values are potentially understated. Westrail’s submission raised the issue that the Freight infrastructure does not have the same“market power” as other regulated Australian infrastructure. Westrail did not elaborate as towhy the Infrastructure has less “market power” than other types of infrastructure. Macquariehas assumed that this refers to the revenue received by the Infrastructure being in partdetermined by the marketplace within the price tests provided by the Code. It is true that railoperators are not consigned to use its infrastructure through regulation of transport tasks torail. Macquarie has concluded, through examination of Westrail Freight’s customer base, that themajority of revenue received by Westrail is provided by customers who have no practicableor efficient options other than to use Westrail’s Freight infrastructure. Westrail contends that the gearing data of observed listed rail companies should prevail,despite having a nominal gearing target of 50% agreed with the WA Government. Thiswould indicate that Westrail favours a gearing level somewhere in the range of 25% to 40%. Macquarie considers that previous Australian regulatory decisions are a more appropriateguide to gearing levels given the scarcity of pure rail infrastructure data and the potentialdifficulties in using vertically integrated US rail company data. This approach reflects aconsistency with other regulated infrastructure assets competing for investment funds inAustralia. To use a lower target gearing level would increase the infrastructure’s cost ofcapital. If the gearing level is not reflective of the risks facing the infrastructure, the rate ofreturn will exceed the appropriate rate necessary to attract investment funds. This willpotentially lead to a suboptimal capital structure being achieved and potentially inefficientaccess charges. Macquarie’s experience with regulated assets indicates that these assets have a robust debtcapacity under most circumstances. IPART endorsed a range for gearing ratios of between 50% and 60% for RAC. Otherregulators have used a gearing ratio assumption of 60%. Due to the divergence in market riskbetween Urban and Freight infrastructure, Macquarie has used a gearing ratio range of 60%to 70% for Urban, and a range of 50% to 60% for Freight infrastructure.

Independent Assessment of Maximum Rate of Return on Rail Infrastructure - Final Page 19
Macquarie Bank Limited
3.10 The Corporate Tax Rate Macquarie has assumed that the Infrastructure’s effective tax rate equates to the Australiancorporate tax rate of 36%. This presumes that the owner of the infrastructure is not in taxloss or otherwise subject to a reduced effective tax rate. Debate continues over whether thestatutory tax rate of 36% should be applied in preference to an effective tax rate. It isgenerally accepted that application of the statutory rate is appropriate when deriving a realpre-tax WACC. Macquarie notes that the ACCC’s recent proposal to use a nominal after taxreturn on equity as a benchmark for regulation has implications for this approach. TheACCC’s proposal is as follows:
“The revenue will be calculated on the basis of the cash flows associatedwith the regulatory accounts necessary to deliver this return after takingaccount of tax liabilities and the assessed value of imputation credits basedon existing tax provisions and foreshadowed tax changes due to occur in theregulatory period”.
This post tax approach explicitly models taxation effects in the cash flows and, from this,derivation of the WACC is a relatively straightforward exercise. This approach is proposedfor pricing regulation in the electricity transmission industry. It is beyond the scope of thisreport to consider whether this approach could be adopted to rail. Indeed, the Codeprescribes a real pre tax real rate. Reverting to the real pre tax methodology, taxation isincorporated by means of an assumption, and has been set at the statutory tax rate of 36%.
3.11 The Impact of Dividend Imputation In the case of previous Australian access charge determinations, a required rate of return hasbeen levied on a capital cost base before tax and dividend imputation. Macquarie advocatesno adjustment for dividend imputation where cashflows can include imputation expressly.However, the present calculation requires the application of a rate of return to a cost base, soimputation must be modelled implicitly through the WACC. Recent studies (Hathaway &Officer, 1996) have concluded that an average of about 45% of the tax collected fromcompanies is redeemed as franking credits on personal tax. This reduces the private sector’scost of capital. The value of imputation credits is expressed as a percentage value, γ (gamma). Recentregulatory decisions have applied this value as follows: CAPM Parameter ORG Victorian Gas Final
Decision (Oct 1998) IPART NSW Rail Access
Final Report on NSWRail Access (April 1999)
ACCC Victorian GasTransmission FinalDecision (Dec 1998)
Gamma 50% 30-50% 50% Submissions received by Macquarie suggested further examination of the gamma valueappropriate to the specific circumstances of Westrail. This would necessarily consider theownership status of Westrail, which may change during the next twelve months. In itssubmission the National Competition Council (“NCC”) stated that investigation of levels offranking credit redemption according to company size and industry may be relevant. Thisapproach requires examination of the tax positions of investors who invest in companies ofparticular size and from within particular industry sectors.
Independent Assessment of Maximum Rate of Return on Rail Infrastructure - Final Page 20
Macquarie Bank Limited
In the interest of competitive neutrality and regulatory consistency Macquarie believes it tobe inappropriate to consider the utilisation of franking credits on a specific case basis. Thismay lead to outcomes that are inconsistent with the objectives of the Code, given that the rateof return is ultimately influenced by the gamma value selected. Further, the ACCC stated in is Draft Statement of Principles for the Regulation ofTransmission Revenues, May 1999:
“if the regulatory framework is adjusted to take account of disadvantagesfaced by one group of investors, it should also take account of advantagesthat those investors may have over others. Thus, the Commission remains ofthe view that the relevant benchmark for regulatory purposes should be basedon an assumption of private Australian ownership. It is left to the capitalmarkets to transfer ownership to those who have the greatest competitiveadvantage in investing in Australian based utilities.”
Macquarie considers that industry type and ownership status are irrelevant for the purposes ofestimating gamma. The variance in value of imputation credits to government and privateowners of assets should not impact the rate of return required on assets. Macquarie notes thatIPART applied a range for gamma due to uncertainty over its value. Macquarie has chosento review its a range of 30% to 50% for the gamma value for the Infrastructure, and hasapplied a range of 40% to 50% for its final decision. The reduction in range reflects theACCC’s view that the most appropriate value for franking credits is approximately 50%, aswell as considering academic studies and ranges applied in other recent regulatory decisionsnoted above.
3.12 Cost of Equity The appropriate rates of return to equity have been determined by observation of comparablebusinesses using the following approach: • constructing the cost of equity from first principles using the CAPM. This method relies
upon observation of the components of the formula. The most subjective part of thisprocess is determining an appropriate “equity beta” (βe);
• removing the effect of the comparable entity’s gearing and tax regime by “un-levering”the equity beta to obtain the “asset beta” (βa); and.
• adjusting (“re-levering”) the asset beta to reflect the gearing and tax rate applicable to theInfrastructure.
Whilst theoretical in many respects, the above approach is consistently applied in practiceand is arguably the best available method in the present case.
3.13 Beta Determination Determining an appropriate asset beta is dependent upon selecting comparable private sector,exchange-listed businesses which have sufficient reliable empirical data available for anequity beta calculation. As reliable published beta information is available only in relation tocertain markets, a number of listed rail, infrastructure and transport businesses have beenidentified according to comparable business characteristics.
Independent Assessment of Maximum Rate of Return on Rail Infrastructure - Final Page 21
Macquarie Bank Limited
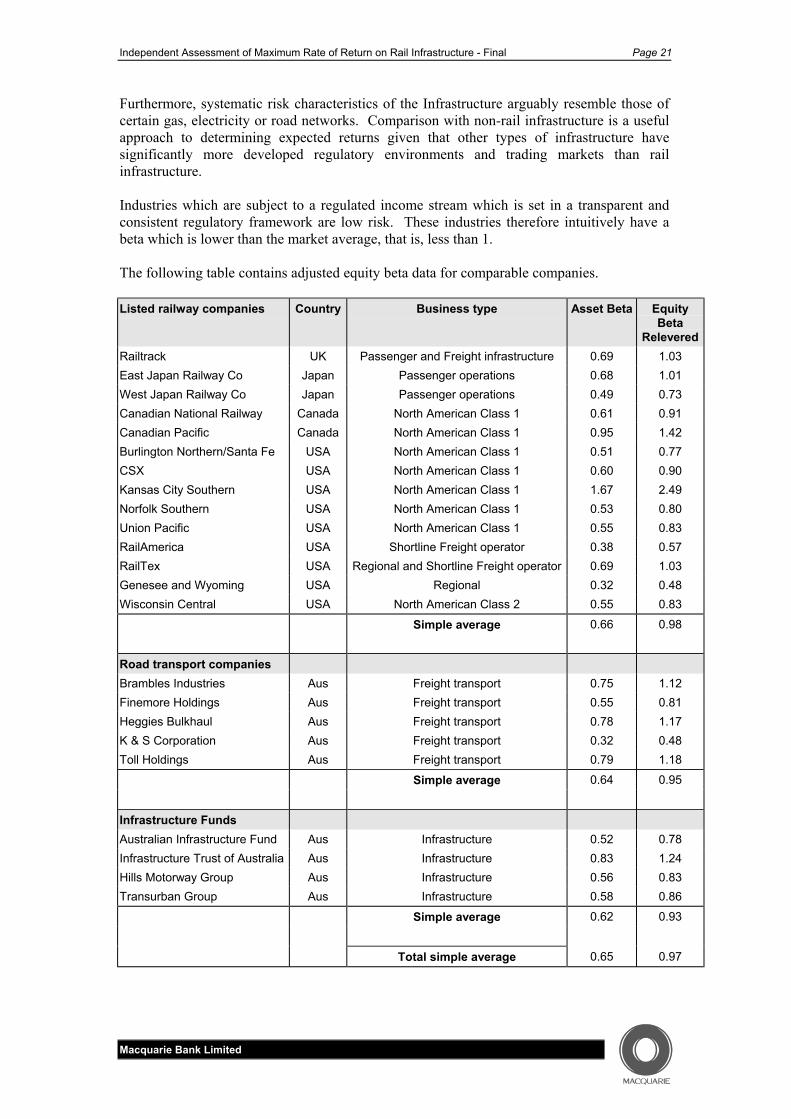
Furthermore, systematic risk characteristics of the Infrastructure arguably resemble those ofcertain gas, electricity or road networks. Comparison with non-rail infrastructure is a usefulapproach to determining expected returns given that other types of infrastructure havesignificantly more developed regulatory environments and trading markets than railinfrastructure. Industries which are subject to a regulated income stream which is set in a transparent andconsistent regulatory framework are low risk. These industries therefore intuitively have abeta which is lower than the market average, that is, less than 1. The following table contains adjusted equity beta data for comparable companies. Listed railway companies Country Business type Asset Beta Equity
BetaRelevered
Railtrack UK Passenger and Freight infrastructure 0.69 1.03 East Japan Railway Co Japan Passenger operations 0.68 1.01 West Japan Railway Co Japan Passenger operations 0.49 0.73 Canadian National Railway Canada North American Class 1 0.61 0.91 Canadian Pacific Canada North American Class 1 0.95 1.42 Burlington Northern/Santa Fe USA North American Class 1 0.51 0.77 CSX USA North American Class 1 0.60 0.90 Kansas City Southern USA North American Class 1 1.67 2.49 Norfolk Southern USA North American Class 1 0.53 0.80 Union Pacific USA North American Class 1 0.55 0.83 RailAmerica USA Shortline Freight operator 0.38 0.57 RailTex USA Regional and Shortline Freight operator 0.69 1.03 Genesee and Wyoming USA Regional 0.32 0.48 Wisconsin Central USA North American Class 2 0.55 0.83
Simple average 0.66 0.98
Road transport companies Brambles Industries Aus Freight transport 0.75 1.12 Finemore Holdings Aus Freight transport 0.55 0.81 Heggies Bulkhaul Aus Freight transport 0.78 1.17 K & S Corporation Aus Freight transport 0.32 0.48 Toll Holdings Aus Freight transport 0.79 1.18
Simple average 0.64 0.95
Infrastructure Funds Australian Infrastructure Fund Aus Infrastructure 0.52 0.78 Infrastructure Trust of Australia Aus Infrastructure 0.83 1.24 Hills Motorway Group Aus Infrastructure 0.56 0.83 Transurban Group Aus Infrastructure 0.58 0.86
Simple average 0.62 0.93 Total simple average 0.65 0.97

Independent Assessment of Maximum Rate of Return on Rail Infrastructure - Final Page 22
Macquarie Bank Limited
Regulated Infrastructure RAC Rail Infrastructure Final Decision (April 1999) 0.7 - 1.0 ACCC Victorian Gas Transmission Final Decision (December 1999) 1.2 IPART Albury Gas Company Draft Decision (May 1999) 0.9 - 1.1 ACCC NSW & ACT Transmission Network Draft Decision (May 1999) 0.93 Source: Bloomberg, 11 August 1999 This information is the basis for the assessment of target gearing and beta. Adjustment ofthese variables to account for capital structure has been undertaken using the formulaendorsed by the ACCC in its Draft Statement of Principles for the Regulation ofTransmission Revenues:
( )( )[ ]β β γ βe a c dT D E D V= + − − −1 1 1 / / The relevered beta simple averages reflect a relatively consistent systematic risk profileacross rail, transport, and regulated infrastructure which approximates the market averageequity beta of 1.0. Macquarie concludes its assessment of appropriate beta values for theInfrastructure following discussion of systematic risk.
Independent Assessment of Maximum Rate of Return on Rail Infrastructure - Final Page 23
Macquarie Bank Limited
4. Systematic Risk 4.1 Freight Infrastructure
Assessment of systematic risks facing the Freight infrastructure enables comparison with thelisted companies identified in section 3. Systematic risk, also known as market risk, iscommon to all investments and hence it cannot be eliminated by holding a diversifiedportfolio. In the maximum WACC determination for RAC, IPART3 described four typical systematicrisks as follows: • Technology: customers switching to alternate modes such as road, conveyor or pipeline.
• Market: market is mature and rail customers may lose export supply contracts.
• Political and regulatory: imposition of new operating, safety, or regulatory requirements.
• Other risks (reliance on electricity motive power, environmental risks, etc). In the Draft Report Macquarie assessed these risks as systematic risks. Various submissionsquestioned this treatment. In particular, NRC questioned the inclusion of certain risks facedby the infrastructure which it believed to be specific diverisfiable risks, which are beyond theCAPM framework. Macquarie has reviewed these issues and has reconsidered the set ofrisks as defined as systematic and specifc risk. NRC submitted that:
The ACCC defines systematic risk as ‘the risk applicable to the market as awhole, such as economic activity, inflation, tax rises and interest rates’, andspecific risks as ‘the residual risk unique to an individual firm or a smallgroups of companies that form a subset of the market.’ The Commissionreflects the weight of professional opinion when it states that ‘consistencywith the WACC/CAPM framework requires that the net impact on earningsof specific risks be factored into projected cash-flows and not the cost ofcapital’. Beta values should reflect only systematic risks.
Macquarie agrees that specific risks should not be considered in the selection of anappropriate beta value. Specific risks faced by the Infrastructure should be considered as partof determining what this appropriate maximum rate of return should be, as it is defined as arisk adjusted rate of return by the scope of work supplied to Macquarie. NRC’s submissionthat a midpoint of the range should be used does not consider the impact of the CombinatorialTest on the average rate of return. The impact of specific risks are discussed in section 5. In summary, systematic risks have been considered in assessing the appropriate range of betavalues. Specific risks have been considered in determining an appropriate maximum withinthat range. Systematic risks have been reexamined and are discussed below.
3 Aspects of the NSW Rail Access Regime, Final Report, 28 April 1999
Independent Assessment of Maximum Rate of Return on Rail Infrastructure - Final Page 24
Macquarie Bank Limited
4.1.1 Economic Conditions Market wide influences on returns to the Infrastructure will have an effect in the longer termas these effects are factored in the contractual arrangements the Freight infrastructureundertakes. The long term contractual nature of the majority of costs and revenues to theInfrastructure means that short term influences will not be factored into contracts or operatingarrangements. This inflexibility, whilst in some cases penalising the Infrastructure owner,generally causes returns to be involatile relative to those received by the market. Macquarie has concluded that the rail freight task is generally stable over the medium term inface of the risks faced by the entire market. As such, influences like inflation, interest rates,tax rises and economic activity generally will impact the returns to Freight infrastructure atlevels below the market average. Volatility of returns to Freight infrastructure are morelikely to be underpinned by specific risk factors.
4.1.2 Market Risk Impact on Freight Volumes Freight volume volatility has been considered in the medium term. The proposed period forthe appropriate maximum WACC to be applied by the Regulator is initially three years, andthen five. The expected volatility of freight volumes has been considered in view of theseperiods, given that the Regulator will have the option to adjust the WACC in response tosignificant changes in the market environment. Major resource industry customers have indicated that they consider the corresponding railtask for their output should not be impacted upon by project/mine closures or outputreductions in the foreseeable future. Macquarie has assessed historical tonnage data suppliedby Westrail in concluding the view that the large scale rail task freight volumes have beenrelatively consistent over the medium term. The long term grain production forecast supplied by CBH reflects solid growth, withoutconsidering the likelihood of adverse climatic conditions. The historical trend in the grainfreight task supports this future growth forecast. Macquarie has also considered forecast data supplied by Westrail to 2004/05. This data isbased on the following assumptions: 1. No loss of business or price reductions as a result of third party access;
2. An early recovery from the Asian economic downturn; and
3. Contract freight prices assumed to be maintained at current levels. The Westrail forecast data are relatively flat and are inconsistent with historical growth rateswhich were evident in data dating back to 1987/88, with the exception of the grain task. Thismay reflect a conservative forecast supplied by Westrail. This potentially underestimates thelevel of returns to rail infrastructure, and would not reflect the potential upside in the futurerail freight task. Financial risks associated with volatility in commodity prices are significant, and this isreflected by declining rates of return to minerals companies over the past decade. Macquariehas consulted widely to assess the extent to which market risks facing the six major resourcecustomers are directly transferred to the Freight infrastructure. As part of this assessmentMacquarie has considered the relative competitive position of the six customers in globalcommodity markets.

Independent Assessment of Maximum Rate of Return on Rail Infrastructure - Final Page 25
Macquarie Bank Limited
4.1.3 Conclusion Macquarie has presented discussion of the systematic risks facing the Freight infrastructure inorder to present the issues it has considered in determining an appropriate beta value. IPART selected a range of 0.7 to 1.0 for the equity beta for RAC on the basis that itconsidered RAC risk to be below the market average. Westrail Freight’s exposure to agreater systematic risks due to the nature of contractual relationships and customer base leadsto the level of systematic risks faced by the Freight infrastructure to be greater than thosefaced by RAC in NSW. However, Macquarie does not consider a direct comparison with theIPART decision appropriate in view of the different treatment of risks undertaken by IPART.IPART’s inclusion of specific risks in its assessment of an appropriate beta value for RACmay have led to a slightly higher beta value being selected. The simple average of US and Canadian rail companies equity beta values has beencalculated as 0.98. The selected Australian transport companies’ equity beta simple averageis 0.97, and listed infrastructure companies equity beta simple average is 0.92. Macquarierecognises that several of these companies have above rail freight operations in addition toowning rail infrastructure. Submissions argued for equity beta ranges to be changed on the basis of differentperspectives on the degree of risks the Freight infrastructure faces. Suggestions ranged from0.8 to 1.0 and from 1.1 to 1.3. After reconsideration of systematic risks in the CAPM framework information Macquarie haschosen to lower its selected equity beta range to 0.8 to 1.0 for the Freight infrastructure.
4.2 Urban Infrastructure Urban infrastructure is simpler to analyse in terms of systematic risk. The relationshipbetween the Department and Westrail could imply that the operation is essentially “risk free”,given that the operations and costs are underwritten by the Department which acts as ownerand customer. Simplistically, this would imply a beta value of zero. However, this would be a particulalry aggressive approach to take because there areidentifiable risks which increase the risk profile of the Urban infrastructure above the riskfree rate. These include the typical systematic risks discussed in reference to the Freightinfrastructure such as market risk and general economic conditions. Accordingly, the ownerof the Urban infrastructure requires a rate of return above that of the risk free rate. Risk ofUrban infrastructure may be considered comparable to that of government sponsored watersupply, electricity transmission, or electricity distribution.
4.2.1 Economic Conditions Macquarie has concluded that the Urban infrastructure is similarly exposed to changes ineconomic conditions as the Freight infrastructure. Further, due to the relationship that theUrban Passenger Services division of Westrail has with its owner, many of the systematicrisks are not passed on to the Infrastructure itself, but borne by the ultimate sponsor of UrbanPassenger Services, the Department. Correspondingly, influences on returns to the Urbaninfrastructure by factors like economic activity, inflation, tax increases and interest rates willbe lower than the market average.

Independent Assessment of Maximum Rate of Return on Rail Infrastructure - Final Page 26
Macquarie Bank Limited
4.2.2 Market Risk Demand for Urban rail infrastructure is expected to increase, primarily driven by Perth’spopulation increasing, which is forecast to grow from its current 1.33 million to 2.0 millionby 2029 (Source: “Metropolitan Transport Strategy” 1995). Initiatives that are discussed inthe specific risk section further underpin expected demand increases for urban passengertrains. Macquarie considers that the demand, and consequently returns for Urban infrastructure to beinvolatile. Market wide influences on urban rail demand will not have a large impact on thedegree of returns to Westrail as, again the contractual relationship with the Departmentlargely insulates Westrail from marketwide influences on returns. The Department ultimately underwrites the shortfall between revenue recovered from thepublic and the total cost of provision of the Urban Passenger Services. In the context of therelationship between the Department and Urban Passenger Services it would be inappropriateto impose a beta that ignored the fact that systematic risk is largely transferred to theDepartment. Macquarie considers that an inappropriately high equity beta would potentiallyincrease the shortfall between revenue recovered and the total cost of providing UrbanPassenger Services, on the assumption that there is a political threshold for fare increases. Ifrevenue recovered from the public did not increase to reflect a higher rate of return calculatedusing a higher than appropriate equity beta this would thereby increase the CSO payments tobe met by the Department. This would be inappropriate as it is ultimately the Department,through its contractual relationship, that is exposed to the majority of the systematic risksfaced by the Urban infrastructure.
4.2.3 Conclusion After consulation with the Department on these issues, Macquarie has applied an equity betarange of 0.3 to 0.4 for the Urban infrastructure.

Independent Assessment of Maximum Rate of Return on Rail Infrastructure - Final Page 27
Macquarie Bank Limited
5 Specific (Non Systematic) Risk Specific risk is assessed outside the CAPM framework and is comprised of a number of riskfactors considered to be unique and non diversifiable. Qualifying the impact of these specificrisks on potential volatility of returns furthers the process for estimating the appropriate riskadjusted maximum rate of return on the Infrastructure. In regulatory processes elsewhere,these specific risks have influenced the selection of the maximum rate of return from therange derived by the CAPM methodology.
5.1 Specific Risks Facing Freight Infrastructure The specific risks facing Westrail’s Freight infrastructure include its exposure to a smallnumber of large customers, level of competition and other factors such as the regulatoryenvironment, track failures and derailments etc. These risks are not considered within theCAPM analysis.
5.1.1 Customer Base One of the key specific risks for Westrail Freight is its exposure to a small number of largecustomers who operate in competitive, volatile, commodity markets. These customers andtheir contracts with Westrail Freight, have been assessed to determine the degree of specificrisk facing the Freight infrastructure. This is essentially a subjective process and is reliant onfactual information and Westrail’s own forecasts for future rail task demand. Macquarie hasconsulted with major customers and independent minerals and resources industryorganisations as part of its assessment process. Westrail’s seven major customers generally have long term, large scale investments ininfrastructure, reserves and operating assets. These dominate Westrail Freight’s revenuebase. Typically the output from these operations are price inelastic in the short to mediumterm. Consequently, volumes tend to be relatively stable with producers (Westrail Freight’scustomers) bearing price risk to absorb any volatility in demand. Decisions to decrease thelevel of output from these investments are not made without significant changes to thefundamentals of the markets in which they operate. Macquarie has consulted Westrail Freight’s major customers in order to assess the futureprospects for those businesses that demand rail freight services utilising the Freightinfrastructure in view of global market conditions. The risks associated with these customers are borne directly by the (above rail) Freightoperator. Macquarie has assessed the extent to which these risks are passed onto theInfrastructure via the relationship it has with the Freight operators who pay regulated accesscharges. It cannot be assumed that if a customer’s business fails, the operations of thecustomer will not be undertaken by another entity and the rail freight task maintained alongwith use of the Infrastructure. Macquarie has concluded that the specific risk associated withthe customer base is largely borne by the above rail business, given the prospects and longterm investments undertaken by Westrail’s major customers.

Independent Assessment of Maximum Rate of Return on Rail Infrastructure - Final Page 28
Macquarie Bank Limited
5.1.2 Intermodal Contestability Assessing the degree of road contestability for Westrail’s rail freight task is a complex issue.Westrail has stated that:
“The State Government has progressively repealed regulations whichrestricted the choice of transport modes beginning in the early 1980’s withthe last restrictions removed in 1995. All of Westrail’s freight business istherefore open to competition from road transport and to a lesser extent seatransport.”
Westrail has stated further that 90% of its rail freight task is potentially contestable by road.Australia has low levels of restriction on the capacity of road transport, with road trains beingable to achieve relatively high scale economies comapred to some other states and countries.Furthermore, Western Australia has no regulated rail freight tasks. The issue of roadcontestability goes beyond regulation however. Analysis has been undertaken of historical data supplied by Westrail which details tonnescarried by commodity since 1987/88. It is clear that while smaller loads have been reduced(presumably due to increased road competition), the large scale tasks have grown steadily.Macquarie has determined that the volatility of the freight task is relatively low whenconsidering the total scale of Westrail’s freight task. The nature of rail tasks for Westrail’sseven major customers are, broadly, six high volume/load resource commodities and a largescale seasonal grain task. As such, there are several issues which restrict the ability of roadtransport operators to effectively contest Westrail’s rail freight task. These include: • Rail offers significant scale economies and cost advantages relative to road transport when
dealing with consistent, large volume loads such as those carried on the Freightinfrastructure. A relatively high cost of service is therefore an effective barrier to entryfor road transport.
• There are arguably “latent” barriers to entry with regard to road transport. Stakeholderconsulation has indicated that if the majority of the seven major rail freight tasks wereconverted to road, significant environmental and social issues would arise due to the highvolume nature of the task. This potentially restricts the viability of road transport as analternative mode.
5.1.3 Regulatory Westrail has stated that the repeal of regulations restrictings alternative forms of transportover the past fifteen years has increased the road contestability of its freight task. Recent Federal Government initiatives have been designed to help rail freight become morecompetitive with road transport. The Western Australian State Government is consideringprivatisation to arrest the underinvestment levels in rail infrastructure. On this basis, it isexpected that the regulatory environment will generally promote rather than restrict growth inrail freight transport. Macquarie has assessed the “Transform WA” program in the context of increasing the abilityof the WA road network to compete with rail freight transport.

Independent Assessment of Maximum Rate of Return on Rail Infrastructure - Final Page 29
Macquarie Bank Limited
The recent changes to the diesel fuel rebate scheme have been assessed in light of railtransport’s relative competitiveness. Macquarie is not aware of any State Government initiative that will potentially restrict thegrowth of rail freight transport in Western Australia.
5.1.4 Technology Risk Changes in the technology applied in Freight infrastructure and to competing modes oftransport are not likely to create a significant risk to the Freight infrastructure in the nearfuture. Current network construction methods are not expected to change in the foreseeablefuture, beyond the introduction of concrete sleepers. Westrail submitted that Macquarie dismissed technology as a significant risk. Westrail statedthat changing technologies in the road transport industry have continued to provide intensecompetitive pressure and will continue to do so. Westrail did not provide examples of thesetechnologies. Macquarie assumes these technologies have increased the capacity of roadtransport by, for example, enabling a larger number of trailers to be hauled. Macquarie’s assessment of the revenue base of Westrail Freight has concluded that themajority of freight revenue is not exposed to technological risk.
5.1.5 Grain Freight Task Westrail is a party to the WA Export Grain Agreement, which includes the Australian WheatBoard (“AWB”), the Grain Pool, Co-operative Bulk Handling (“CBH”), the WesternAustralian Farmers Federation (“WAFF”) and the Pastoralists and Graziers Association(“PGA”). The grain freight task is generally undertaken by rail due to economies of scaleand other logistical advantages that rail enjoys. There is, however, a degree of penetration byroad transport (reflected in the table below) and this typically represents the transportation ofgrain from farms where it is uneconomic to operate rail transport to rail heads.
Grain Logistics Committee Production and Receivals Data
Port 1997/1998 2005/2006 Zone Production Receivals Road Rail Production Receivals Road Rail
GER 2.5m 2.25m 0.4m 1.1m 3.1m 2.8m 0.5m 1.3m KWI 5.9m 5.4m 0.03m 5.1m 7.3m 6.7m 0.04m 6.6m ALB 2.2m 2.0m 0.6m 1.1m 2.7m 2.4m 0.75m 1.3m ESP 1.35m 1.2m 0.7m 0.1m 1.7m 1.5m 0.8m 0.2m TOTAL 11.95m 10.85m 1.73m 7.4m 14.8m 13.4m 2.1m 9.4m Source: Overview of Consultants Report for the Grains Logistics Committee, June 1998 While rail enjoys a competitive advantage over road, freight rates are broadly in line withroad transport rates. Grain freight pricing is influenced by grain producers interests beingpromoted by representative bodies who are signatories to the WA Export Grain Agreement.Unlike Westrail’s other major customers, the WA Export Grain Agreement represents a muchlarger number of smaller customers.

Independent Assessment of Maximum Rate of Return on Rail Infrastructure - Final Page 30
Macquarie Bank Limited
The WA Export Grain Agreement expires in October this year and is yet to be renewed. The new agreement will be required to have competitive characteristics so as to not precludeother rail and road freight operators from contesting the grain freight task. As this agreementis yet to be renewed, Macquarie has proceeded on the basis that this will be the eventualoutcome when the agreement is renewed. Grain forecasts suggest strong growth in the rail freight task. The following independentforecasts have been compiled by Co-operative Bulk Handling (“CBH”) the Grain LogisticsCommittee (“GLC”).
Year 2005 Predictions (Tonnes) Received Into CBH Storages By Zone
CBH GLC Port Zone Tonnes Tonnes Geraldton 2,914,680 2,800,000 Kwinana 7,458,971 6,700,000 Albany 2,987,424 2,400,000
Esperance 1,962,938 1,500,000 Total 15,324,013 13,400,000
Source: CBH, GLC Based on this data, and historical growth trends in grain production in Western Australia, thelong term market risk for the grain freight task is considered to be low. Fluctuations in globaldemand are reflected much more in price movements than in tonnes transported. Flexibilityin cropping programs is limited to certain farming regions in Western Australia and as aconsequence, the grain freight task is relatively stable. Climatic change has a much greater impact on production than demand volatility. Theimpact of climatic change over the past fifteen years was most significant in the years1983/84, 1987/88 and 1994/95. Average annual growth of CBH receivals has been in excessof 8% since 1979/80.
Total All Grains (tonnes) Received into CBH Storages by Season Commencing 1979/80
0
2,000,000
4,000,000
6,000,000
8,000,000
10,000,000
12,000,000
1979
/80
1980
/81
1981
/82
1982
/83
1983
/84
1984
/85
1985
/86
1986
/87
1987
/88
1988
/89
1989
/90
1990
/91
1991
/92
1992
/93
1993
/94
1994
/95
1995
/96
1996
/97
1997
/98
1998
/99
Source: CBH
Independent Assessment of Maximum Rate of Return on Rail Infrastructure - Final Page 31
Macquarie Bank Limited
The grain freight task is divided between road and rail, with rail handling approximately 70%of grain received. Road transport is primarily used to take grain from farms which are not located near railheads to receival points for rail transport. Road enjoys a competitive advantage over rail inthese areas because it is not economic for rail to maintain Infrastructure and operations inareas such as these which have low tonnages. A key outcome of the Grain Logistics Committee report was to rationalise receival points onthe rail network to form a set of Strategic Receival Points (“SRP’s”). These points wereselected to increase economies of scale in the WA rail transport system and to reduce theimminent capital expenditure requirements associated with maintaining the existingInfrastructure. These initiatives are expected to increase the efficiency of the grain network,as well as providing: • improved sampling and weighing facilities;
• extended hours of service;
• fast outloading to rail and road; and
• storage capacity for a range of grain varieties. The grain task for road transport is likely to increase in areas where outlying rail routes areclosed. On balance, the improvement in operating efficiency of the rail transport system resultingfrom the SRP strategy should improve the remaining network’s overall competitive positionwith regard to road transport.
5.1.6 Conclusion While Westrail’s exposure to seven large customers may suggest significant risk, the majorityof that risk is in fact borne by the above rail assets because there is a low risk of modesubstitution. Macquarie has therefore concluded that this risk is limited to the likelihood thatthese operations will significantly decrease their freight requirements. In other words, theprincipal specific risk is that one or more of Westrail’s major customers will reduce or lose itsfreight task (e.g. by losing export contracts). The risk of mode substitution is considered lowand the risk that the loads will reduce or cease is also low in view of historical data andstakeholder consultation. Macquarie recognises that a certain amount of general freight carried by interstate carriers inthe standard gauge route between Perth and Kalgoorlie is very contestable by road and tosome extent sea, which is contrary to the other major commodities carried on this route. After assessment of specific risks, it has been concluded that they do not justify an explicitupwards revision of the appropriate maximum rate of return on infrastructure i.e. beyond thetop of the CAPM range value of 8.2%, which would imply an “uplift” factor. Westrailrequested that Macquarie address the issue of an uplift factor. Macquarie endorses the viewtaken by IPART that applying an uplift factor to a maximum rate of return would potentiallypermit monopoly pricing to occur.

Independent Assessment of Maximum Rate of Return on Rail Infrastructure - Final Page 32
Macquarie Bank Limited
5.2 Specific Risks Facing Urban Infrastructure
5.2.1 Ridership Volatility Historical data has shown that growth in ridership is most significantly impacted upon by theavailability of rolling stock capacity at peak usage periods. Currently, approximately 38% ofdaily ridership occurs during the period 7.30am to 8.30am. Previously, when the system hasbeen at full capacity during these periods, ridership has declined in response to perceivedcapacity shortages. Traditionally, annual growth in ridership has fluctuated between 2.5% to 5%, subject toavailability during peak periods. Extensions to the northern line and the South West railwaysystem will underpin further usage of the existing Infrastructure. There are currently a number of initiatives being developed by the Department, Transperthand Westrail to improve ridership during non peak periods. These are designed to increaseutilisation of excess capacity and recover a higher proportion of the fixed costs of the UrbanNetwork and operations. On balance, Macquarie has concluded that factors increasing risks associated with ridershipvolatility are being reduced by the current expansion program and initiatives designed toincrease non peak period usage.
5.2.2 Legislative Changes The introduction of open access to rail infrastructure could arguably increase the demand forUrban infrastructure because operators other than Westrail will be able to offer alternativeservices. It is therefore unlikely that these policy changes will impact negatively on theutilisation of the Urban infrastructure. Because the Department has not signalled an intentionto allow the private sector to participate in urban rail services, Macquarie has concluded thatthe proposed legislative changes will have little positive or negative impact on the risksfacing the Urban infrastructure.
5.2.3 Regulation of Competition The prohibition in relation to Transperth buses operating on the Mitchell Freeway is a keyincentive for the utilisation of the Northern rail network. Buses are primarily used as“feeder” vehicles to the rail system, increasing the utilisation of the Northern rail systemduring peak periods. Studies have shown that the usage of buses along the Mitchell Freewayduring peak periods to supplement rail transport is not practical, as the road traffic congestionlimits the contribution buses can make to the Urban passenger task. As such, rail enjoysadvantages over road transport in high usage periods. This has also been borne out ofsurveys undertaken with the Urban network’s customer base for whom reliability, frequencyand speed of services are the major concern. Macquarie has concluded that competition for the Urban network will remain low in theabsence of any policy changes that permit passenger buses to compete with the NorthernUrban rail network.

Independent Assessment of Maximum Rate of Return on Rail Infrastructure - Final Page 33
Macquarie Bank Limited
5.2.4 Technology Risk Changes in technology applied in rail infrastructure and competing modes of transport are notlikely to create a significant risk of obsolescence in the near future. Current networkconstruction methods are not expected to change in the foreseeable future. Technologicalchanges to the Urban Passenger System have increased its service capacity.
5.2.5 Level of Government Funding New train capacity was supplied last year to satisfy peak period demand on the Northern line.Further, extensions to the Northern line beyond Currambine and the South West rail line toMandurah are planned. Funding options for this Infrastructure expansion are currently beingdeveloped by the State. On this evidence there is clear governmental support for theincreased investment in Urban infrastructure to meet increased passenger demand. 5.2.6 Public Relations and Service Enhancements Public relations are playing an increasingly pro-active role in promoting passenger trainusage. As mentioned previously, there are a number of initiatives currently being developedto improve the economics and cost recovery of Urban rail transport during non peak periods.These initiatives include alternative pricing approaches and improved security. This morecommercial approach to improving cost recoupment through increased ticket revenue isexpected to continue as a means of decreasing the current dependence on funding from theDepartment.
5.2.7 Availability of Rolling Stock and New Infrastructure Capacity Extensions to the Northern line and South West railway represent significant infrastructuregrowth, with the length of track being increased by over 70% in total. Historical evidence shows that as new capacity has been provided, demand has utilised itquickly. This is likely to continue provided service standards are maintained. TheGovernment and the Department have responded postively to capacity shortfalls previously.Current expansion plans reflect a commitment to continue to support the Urban rail passengersystem.
5.2.8 Conclusion Macquarie has resolved that the specific risks facing the Urban infrastructure are notsufficient to warrant a change from the range calculated by the CAPM analysis. Macquarieconsiders that because of the relatively low prospect for variation in returns via accesscharges selection of the midpoint of the range is appropriate.
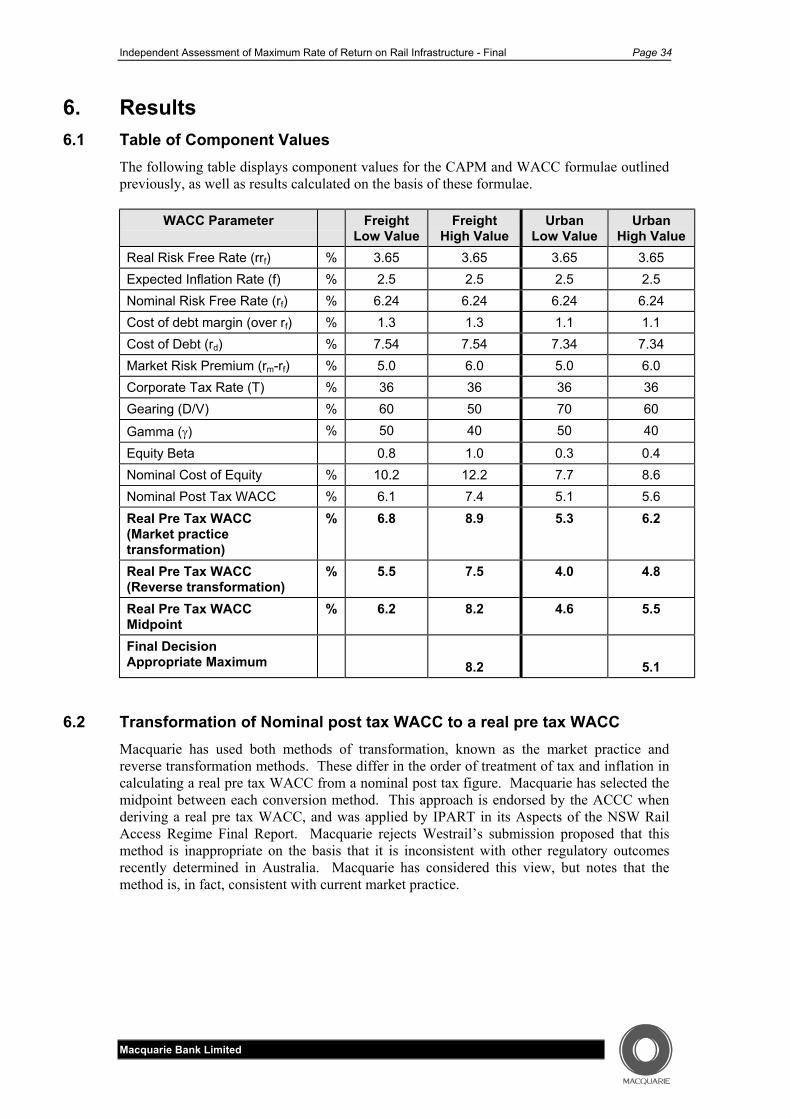
Independent Assessment of Maximum Rate of Return on Rail Infrastructure - Final Page 34
Macquarie Bank Limited
6. Results 6.1 Table of Component Values
The following table displays component values for the CAPM and WACC formulae outlinedpreviously, as well as results calculated on the basis of these formulae.
WACC Parameter FreightLow Value
FreightHigh Value
UrbanLow Value
UrbanHigh Value
Real Risk Free Rate (rrf) % 3.65 3.65 3.65 3.65 Expected Inflation Rate (f) % 2.5 2.5 2.5 2.5 Nominal Risk Free Rate (rf) % 6.24 6.24 6.24 6.24 Cost of debt margin (over rf) % 1.3 1.3 1.1 1.1 Cost of Debt (rd) % 7.54 7.54 7.34 7.34 Market Risk Premium (rm-rf) % 5.0 6.0 5.0 6.0 Corporate Tax Rate (T) % 36 36 36 36 Gearing (D/V) % 60 50 70 60 Gamma (γ) % 50 40 50 40 Equity Beta 0.8 1.0 0.3 0.4 Nominal Cost of Equity % 10.2 12.2 7.7 8.6 Nominal Post Tax WACC % 6.1 7.4 5.1 5.6 Real Pre Tax WACC (Market practicetransformation)
% 6.8 8.9 5.3 6.2
Real Pre Tax WACC (Reverse transformation)
% 5.5 7.5 4.0 4.8
Real Pre Tax WACCMidpoint
% 6.2 8.2 4.6 5.5
Final DecisionAppropriate Maximum
8.2
5.1
6.2 Transformation of Nominal post tax WACC to a real pre tax WACC Macquarie has used both methods of transformation, known as the market practice andreverse transformation methods. These differ in the order of treatment of tax and inflation incalculating a real pre tax WACC from a nominal post tax figure. Macquarie has selected themidpoint between each conversion method. This approach is endorsed by the ACCC whenderiving a real pre tax WACC, and was applied by IPART in its Aspects of the NSW RailAccess Regime Final Report. Macquarie rejects Westrail’s submission proposed that thismethod is inappropriate on the basis that it is inconsistent with other regulatory outcomesrecently determined in Australia. Macquarie has considered this view, but notes that themethod is, in fact, consistent with current market practice.

Independent Assessment of Maximum Rate of Return on Rail Infrastructure - Final Page 35
Macquarie Bank Limited
The combination of the two transformation methods leads to a range being calculated fromwhich a mid point is selected. These two midpoints represent each end of the rangecalculated by the high and low variable sets. The validity of this method has been questionedby both Westrail and WA Treasury. Macquarie would refer Westrail and WA Treasury to theACCC’s Final Decision on the access arrangements for the Victorian gas networks (Section3.5 Rate of Return page 61). Contained in this decision is an extensive discussion on themerits of applying both transformation methods that cannot be fully reproduced in this report.Suffice to say that the two methods of transformation when used in combination overcomethe data transformation inaccuracies that result from applying only the market practicemethod of transformation. The ACCC when simulating cashflows derived from revenues calculated using a real pre taxWACC figure showed that the implicit nominal post tax return on equity was different fromthat used originally to derive the real pre tax WACC using the market practice method. Thatis, there was an inconsistency in the calculations when demonstrated in practice. Modellingof the two transformation methods via the simulation of cash flows using real pre tax WACCvalues to set revenues has shown that each method produces results that reduce the level ofinconsistency. This averaging approach has become the generally adopted method whenderiving real pre tax WACC values.
6.3 Maximum Rate of Return on Rail Infrastructure The selection of the maximum WACC becomes a judgement call on the reasonableness of themaximum WACC after considering the entire set of risks facing the infrastructure, theCombinatorial Test, other regulatory decisions and submissions from stakeholders and thepublic alike. There is no straightforward process or “science” of deduction of the maximumrate from the range provided by CAPM. Modeling the Combinatorial Test to examine theimpact of the maximum rate on the average rate is a complex and potentially inexact taskwhich has not been undertaken in this instance. Macquarie’s conclusion regarding theaccuracy of the Code’s pricing methodology is that the maximum rate of return may onlylead to an appropriate average rate of return by coincidence and not by design. The decision to select a maximum above the midpoint of each range recognises that differentsections of the network will earn different rates of return, and that on average these returnsare appropriate. There is greater scope for divergence in returns across the Freightinfrastructure as there will be higher volatility in access revenues in the short term comparedto the revenue received by the Urban infrastructure. This is a valid argument for having ahigher maximum WACC for the Freight infrastructure to avoid short term average returnsbeing lower than appropriate. Assessing the potential impact of the Combinatorial Test on average returns forms the basisfor selection of a maximum rate. This is combined with consideration of specific risks thatmay clearly increase the volatility of returns to the Infrastructure. This approach is definedby the scope of work where Macquarie is required to:
Independent Assessment of Maximum Rate of Return on Rail Infrastructure - Final Page 36
Macquarie Bank Limited
… calculate the maximum WACC value for the Western Australian rail tracknetwork, having regard to Westrail’s commercial and operating environment.
This should be a risk-adjusted rate of return to Westrail that is consistentwith the returns currently being sought by investors in commercialenterprises operating in competitive markets and facing similar business risksto those faced by Westrail in the provision of the network service.
Risk adjustment of the WACC appropriate to both the Freight and Urban infrastructure due tospecific risks considered by Macquarie has not increased the WACC beyond the rangecalculated by the CAPM analysis. Selection of the WACC within the range has been madeafter considering the proposed regulatory environment, the likely impact of theCombinatorial Test on total revenues and consideration of submissions on what themaximum rate should be. Again, Macquarie would emphasise that this selection process is founded in judgement onhow the divergence in returns across the infrastructure will impact the average rate of return.The appropriateness of the maximum will be evident in the commercial outcomes and theactual average rate of return received by the Freight infrastructure. The appropriateness of the concept of a maximum rate of return used to derive averagereturns is yet to be fully understood, given the newness of the pricing methodology in theAustralian rail industry. Long term effects of the approach on investment and competitionlevels will take time to emerge, and as such the methodology needs to be closely monitoredconsidering the reform objectives of the State Government and National Competition Policy. Treasury questioned whether Macquarie should consider the costs of setting the rate too highor too low, in view of the competing objectives of increasing investment and increasing railon rail competition and the general competitiveness of the Freight business. Macquarie in itsscope of work is required to independently assess the maximum rate of return on railinfrastructure. Assessing the relative merits of competing policy issues like investment andcompetition is beyond the scope of work and falls into the confines of the Regulator. Westrail has submitted that the maximum rate of return should be 10.5%. Conversely, NRChas submitted that it considers the appropriate maximum rate of return should be 7.0%.Macquarie’s application of CAPM methodology has delivered a range of 6.2% to 8.2% forthe Freight Infrastructure. From this, and careful consideration of the role of the maximumWACC in view of the Combinatorial Test, Macquarie has determined that the maximumvalue for the rate of return on Freight Infrastructure to be 8.2%. Macquarie’s view , in theabsence of detailed financial information, is that the high point of the range calculated by theCAPM methodology is justified and offers the “best hope” to achieve an “average return onaverage” (by maximising negotiating flexibility). Macquarie’s application of CAPM methodology has delivered a range of 4.6% to 5.5% forthe Urban infrastructure. Macquarie has determined the maximum rate of return on Urbaninfrastructure to be 5.1% (which is essentially the midpoint).
Independent Assessment of Maximum Rate of Return on Rail Infrastructure - Final Page 37
Macquarie Bank Limited
7. Review of the maximum rate of return 7.1 Mechanism and Frequency
Macquarie proposes that the maximum rate of return be reviewed in three years time.Thereafter, the maximum rate of return should be reviewed every five years. Uncertainty associated with the proposed privatisation of Westrail Freight, and the continuedevolution of open access regimes in Australia over the next two to three years are likely tosee increased volatility in the rates of return attributable to the Infrastructure. Beyond thisinitial period, the effects of competition and market efficiency are likely to deliver morepredictable returns on investment. Both rail operators and infrastructure owners will beexposed to the risks associated with these market environment changes and the regulatorshould retain a degree of flexibility to both respond and influence this environment. The Regulator will need to change the WACC for a number of reasons in accordance with theset of objectives of the State’s rail reform process. The Regulator is the best judge of whenchanges to the WACC are appropriate as it sets and monitors the achievement of thoseobjectives, of which the maximum WACC as a rate of return is one influence. The WACC isone component of the determination of access prices, which are key to promotingcompetition and growth in the rail freight transport industry. The scope of work requested discussion of a review mechanism. Macquarie has interpretedthis request as referring to the appropriate methodological review process of the maximumWACC value required over time, i.e. price paths or regulatory periods. This process, aspresented by the request for tender documents and the Code is to be undertaken by theRegulator. This process is described in the Code as follows:
3. Regulator to determine weighted average cost of capital For the purposes of clause 2(4)(b), the Regulator is to - (a) determine, as at 30 June in each year, the weighted average
cost of capital to the Commission expressed on a real beforetax basis; and
(b) publish notice of the determination in the Gazette. This implies that the WACC be recalculated and applied annually regardless of themateriality or significance of any movements in component variables. The annual reviewperiod seems short when considering the potential impact changes in the maximum WACCvalue might have on the competitive positions and commercial strategies of freight operators.It would also require, in addition to the management of deviations beyond the ceiling andfloor tests, further administrative resources.

Independent Assessment of Maximum Rate of Return on Rail Infrastructure - Final Page 38
Macquarie Bank Limited
The review period for the WACC should be supported in the interim by an annual revisionprocess, as outlined in the Code, in order to monitor material changes in the WACC valueresulting from changes in economic conditions. Judgement as to the materiality of thechanges in the WACC value to access pricing will be required in light of the correspondingimpacts on price volatility. This judgement by the Regulator will be on the basis of theperceivable cost-benefit of the administration of changes to the ceiling test relative tomaintaining potentially inappropriate total revenue levels to the infrastructure. Macquarie considers that changes in the following WACC components will have the mostpronounced impact on the appropriate maximum rate of return on the Infrastructure: • the risk free rate;
• inflation forecasts;
• market estimation and empirical evidence on the value of the market risk premium and theproportion of franking credits utilisation (gamma);
• significant changes to long term borrowing margins; and
• significant changes to market expectations of rates of return on Infrastructure.
In view of the potential volatility of these variables in the medium term, the suggested reviewfrequency will enable the regulator to implement a new WACC value. This flexibility is alsonecessary to maintain influence over policy outcomes.
Macquarie believes that the future review mechanism should reflect current regulatoryapproaches that are deemed appropriate at the time of review. As the regulatory debatecontinues, the methodology underpinning access pricing practices will evolve, and theperformance of regulatory instruments is expected to improve. Therefore, it is prudent toconsider current empirical evidence and policy outcomes when deciding upon whatmechanism to apply at any future point in time.
As mentioned earlier, the ACCC is proposing changes to the way in which electricitytransmission is priced. This is one example of the evolving nature of regulatory pricing ofInfrastructure access. The Code’s pricing methodology is relatively immature whencompared to other infrastructure industries and will benefit from the investigation andapplication of outcomes in other regulatory settings.
There are significant risks associated with the introduction of a third party access regime asthe policy objectives and the regulatory process are untried in WA. The review mechanismobjectives must benefit from both the evolving national regulatory debate and the emergenceof unique empirical evidence in WA.
7.2 Management of Deviations Beyond the Ceiling and Floor TestsManagement of breaches of the price tests on an individual route basis is a necessary task inview of the objectives of the Code. The underlying objectives of the ceiling and floor testsare restriction on monopoly rents being achieved and ensuring operators at least pay theincremental cost of their access to that Infrastructure. The reality of the commercialenvironment means that on occasion these price tests will be breached.
Independent Assessment of Maximum Rate of Return on Rail Infrastructure - Final Page 39
Macquarie Bank Limited
Access pricing is negotiated on the basis that these tests will not be breached. Commercialcircumstances, e.g. lower or greater than forecast tonnages may change the economics ofaccess pricing so that access prices charged to operators are not cost reflective or, inaggregate, contain monopoly rents (ie. breach the ceiling test).
IPART proposed reconciliation of deviations from the price tests on an ex-post basis using an“Unders and Overs” account, the management of which is to be the responsibility of RACand its customers. This process was based on a similar process undertaken by IPART in theregulation of the NSW electricity industry. As the arbiter of the NSW Rail Access Regime,and not the Regulator, it is not IPART’s role to administer this process.
The Code does not currently have provision for a process of review or management ofdeviations in rates of return which exceed the maximum rate of return. This is one area of theCode that appears to require further refinement.
Macquarie suggests that the Regulator in conjunction with Westrail Infrastructure develop anefficient and effective system of managing deviations from the maximum rate of return.Macquarie is not positioned to recommend a process that will ideally suit the interests of theRegulator, Westrail Infrastructure and customers alike. Macquarie would recommend thatthe Regulator seek evidence from RAC on the performance and administration of the Undersand Overs account in order to adopt or refine that approach. Macquarie would alsorecommend that the Regulator seek other guidance from the national regulatory bodies,(ACCC, NCC) on other potential precedents for the management of deviations beyond thefloor and ceiling tests.
Independent Assessment of Maximum Rate of Return on Rail Infrastructure - Final Page 40
Macquarie Bank Limited
Appendix 1 - Definition of Infrastructure
Freight Infrastructure
Standard Gauge Routes1. The mainline track between Kalgoorlie and Kwinana, including
a. the spur line from the mainline to the private sidings at West Kalgoorlie; and
b. the diagonal line from the mainline at Forrestfield to the north spur and the north spurservice line at Kewdale.
2. The dual gauge track between Midland and East Perth, including the south leg of theWoodbridge Triangle.
3. The mainline track between Kalgoorlie and Leonora.
4. The mainline track between West Kalgoorlie and Esperance, including the spur line toRedmine.
5. The mainline track between Cockburn and Robb Jetty, the dual gauge track between RobbJetty and Leighton and the spur line between Leighton and North Fremantle.
Narrow Gauge Routes6. The mainline track between Midland and Mundijong via Forrestfield and Kwinana.
7. The mainline track between Cockburn and Robb Jetty.
8. The South-West mainline track between Armadale and Picton.
9. The mainline track between Picton and Lambert, including the spur line from Boyanup toCapel.
10.The track between Pinjarra and Alumina Junction and between Alumina Junction andPinjarra South.
11.The mainline track between Brunswick Junction and East Collie Junction and the spur lineto Premier.
12.The dual gauge mainline track between Midland and Avon.
13.The Great Southern Railway between Avon and Albany, including the following spurlines:
a. from York to Quairading;
b. from Narrogin to Merredin;
c. from Narrogin to Kulin via Yilliminning;
d. from Wagin to Lake Grace, from Lake Grace to Hyden and from Lake Grace toNewdegate;
e. from Katanning to Nyabing;

Independent Assessment of Maximum Rate of Return on Rail Infrastructure - Final Page 41
Macquarie Bank Limited
f. from Tambellup to Gnowangerup;
g. from Merredin to Kondinin; and
h. from Merredin to Trayning.
14.The mainline tracks between Avon Yard and
a. McLevie via Goomalling;
b. Beacon via Goomalling and Amery, including the spur line from Burakin to Kalannie;and
c. Mukinbudin via Goomalling and Wyalkatchem.
15.The mainline track between Millendon Junction and Geraldton, including the spur linefrom Dongara to Eneabba.
16.The mainline track between Toodyay West and Miling. The mainline track betweenGeraldton and Maya via Mullewa.
Urban Infrastructure18.The narrow gauge double tracks between Perth and
a. Currambine;
b. Fremantle;
c. Armadale; and
d. Midland.
Source: WA Government Railways (Access) Code 1999 Draft 9