western australian beef commentary - department of ... number: 12 date: august 2016 western...
TRANSCRIPT

Issue Number: 12
Date: August 2016
Western Australian Beef Commentary Prepared by the Department of Agriculture and Food, Western Australia
Summary
The Western Australian (WA) beef cattle herd increased 14% year on year to 2.24 million
head in 2014/15
Total turn-off fell 6% from 717 000 in 2013/14 to 675 000 in 2014/15
Between 2012 and 2015 there was an increase of 10% for WA cattle slaughter and beef
production, with 2% more male cattle than female cattle slaughtered in 2015.
Between 2012 and 2015 WA beef exports increased 72% in volume to 43 million
kilograms and 170% in value to A$184 million. Korea was WA’s largest market for boxed
beef by volume in 2015 and the United States of America (USA) was the largest by value.
Vietnam was the largest market by volume and value for WA live cattle exports in 2015,
accounting for 28% of the volume and 29% of the value of live cattle exported.
During 2016 WA cattle market indicators have been very strong compared to previous
years. In July 2016:
o The feeder yearling indicator averaged 329 cents/kilogram (c/kg)
o The heavy cow indicator averaged 242c/kg
o The pastoral cow indicator averaged 210c/kg
o The light bull sale yard indicator averaged 307c/kg

2
Contents Current herd situation in WA ............................................................................................................ 3
Cattle turn-off and beef production ................................................................................................... 3
Cattle slaughter ............................................................................................................................ 4
Beef production ............................................................................................................................ 6
Boxed beef exports .......................................................................................................................... 7
Volume ......................................................................................................................................... 7
Value ............................................................................................................................................ 8
Live exports .................................................................................................................................... 10
Volume ....................................................................................................................................... 10
Value .......................................................................................................................................... 12
Market indicators ............................................................................................................................ 13
Competitor analysis - New Zealand ............................................................................................... 15
Market analysis - Korea ................................................................................................................. 17
Weather watch ............................................................................................................................... 19
Appendix ........................................................................................................................................ 21
Sources
Australian Bureau of Statistics (ABS)
Meat and Livestock Australia’s National Livestock Reporting Service (NLRS)
Statistics New Zealand
Meat and Livestock Australia (MLA)
Beef & Lamb New Zealand
Wagyu International
Statistics Korea
The Bureau of Meteorology
Contact
Kate Pritchett Research Officer, Grains and Livestock Industries, Department of Agriculture and Food, WA +61 (0)8 9821 3252 +61 (0)429 700 317
Important disclaimer
The Chief Executive Officer of the Department of Agriculture and Food and the State of Western Australia
accept no liability whatsoever by reason of negligence or otherwise arising from the use or release of this
information or any part of it.
Copyright © Western Australian Agricultural Authority, 2016
3
Current herd situation in WA
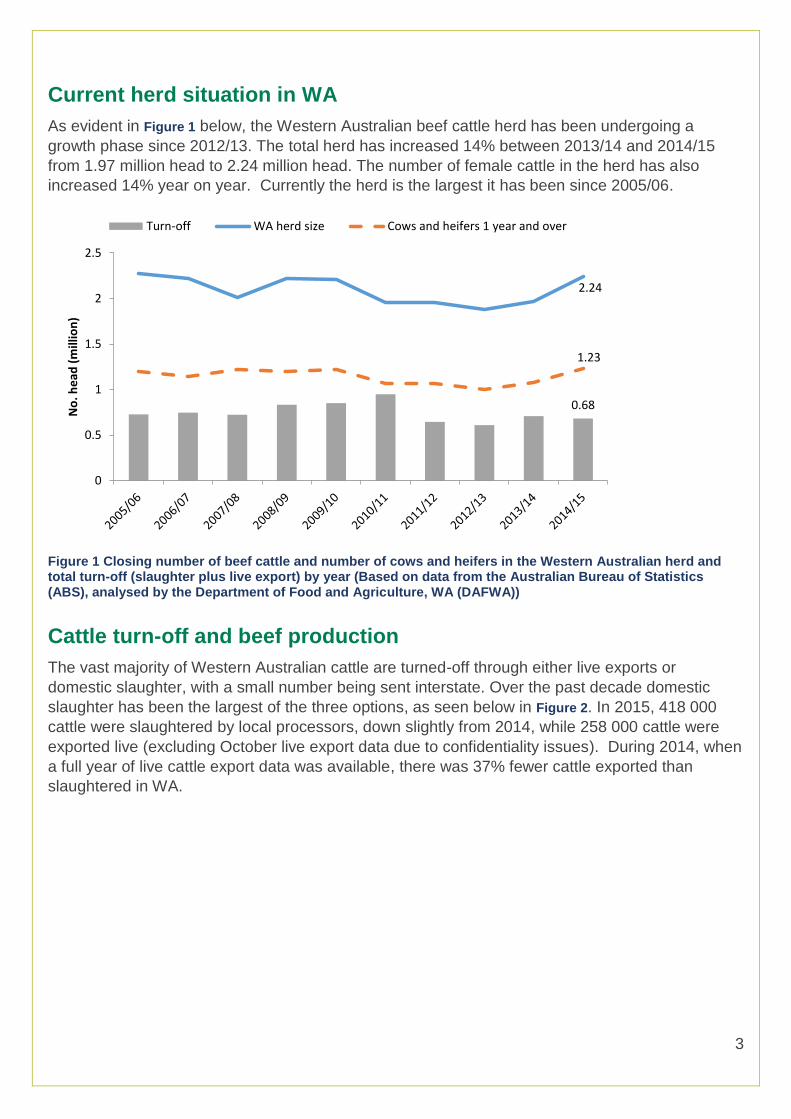
As evident in Figure 1 below, the Western Australian beef cattle herd has been undergoing a
growth phase since 2012/13. The total herd has increased 14% between 2013/14 and 2014/15
from 1.97 million head to 2.24 million head. The number of female cattle in the herd has also
increased 14% year on year. Currently the herd is the largest it has been since 2005/06.
Figure 1 Closing number of beef cattle and number of cows and heifers in the Western Australian herd and total turn-off (slaughter plus live export) by year (Based on data from the Australian Bureau of Statistics (ABS), analysed by the Department of Food and Agriculture, WA (DAFWA))
Cattle turn-off and beef production
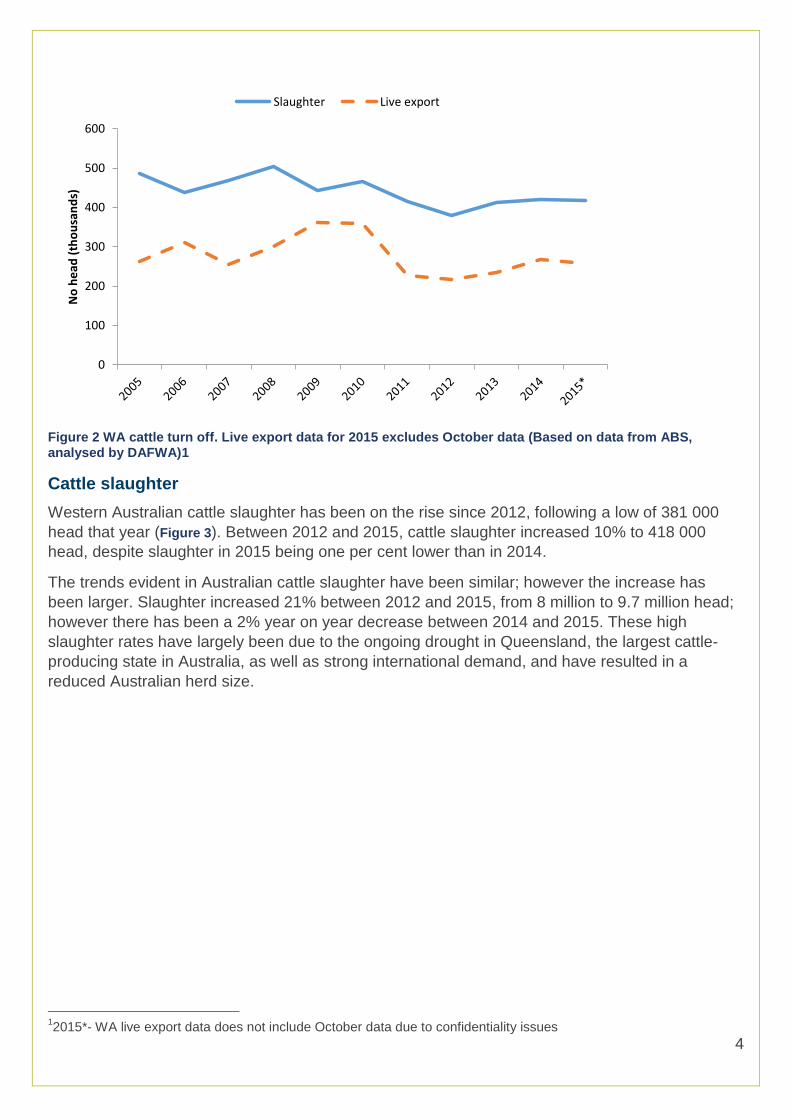
The vast majority of Western Australian cattle are turned-off through either live exports or
domestic slaughter, with a small number being sent interstate. Over the past decade domestic
slaughter has been the largest of the three options, as seen below in Figure 2. In 2015, 418 000
cattle were slaughtered by local processors, down slightly from 2014, while 258 000 cattle were
exported live (excluding October live export data due to confidentiality issues). During 2014, when
a full year of live cattle export data was available, there was 37% fewer cattle exported than
slaughtered in WA.
0.68
2.24
1.23
0
0.5
1
1.5
2
2.5
No
. he
ad (
mill
ion
)
Turn-off WA herd size Cows and heifers 1 year and over
4
Figure 2 WA cattle turn off. Live export data for 2015 excludes October data (Based on data from ABS, analysed by DAFWA)1
Cattle slaughter
Western Australian cattle slaughter has been on the rise since 2012, following a low of 381 000
head that year (Figure 3). Between 2012 and 2015, cattle slaughter increased 10% to 418 000
head, despite slaughter in 2015 being one per cent lower than in 2014.
The trends evident in Australian cattle slaughter have been similar; however the increase has
been larger. Slaughter increased 21% between 2012 and 2015, from 8 million to 9.7 million head;
however there has been a 2% year on year decrease between 2014 and 2015. These high
slaughter rates have largely been due to the ongoing drought in Queensland, the largest cattle-
producing state in Australia, as well as strong international demand, and have resulted in a
reduced Australian herd size.
12015*- WA live export data does not include October data due to confidentiality issues
0
100
200
300
400
500
600
No
he
ad (
tho
usa
nd
s)
Slaughter Live export

5
Figure 3 Annual cattle slaughter for Australia (Left Hand Side (LHS)) and WA (Right Hand Side (RHS)) excluding calves (Based on data from ABS, analysed by DAFWA)
Prior to 2012, a much larger proportion of cows and heifers were slaughtered in WA compared to
bulls, bullocks and steers. However, as demonstrated in Figure 4 below, the numbers began to
converge in recent years. In 2014 the situation was reversed when slightly more male cattle were
slaughtered than female cattle (211 000 males and 209 000 females). This difference edged
higher during 2015, with 2% more male cattle slaughtered than females (210 000 compared to
205 000). The 33% fall in the number of female cattle slaughtered between 2010 and 2015 is likely
contributing to the expansion of the WA herd.
Figure 4 WA cattle slaughter by animal type (Based on data from ABS, analysed by DAFWA)
0
100
200
300
400
500
600
0
2000
4000
6000
8000
10000
12000
WA
cat
tle
an
d c
alf
slau
ghte
r (h
ead
)
Au
stra
lian
cat
tle
an
d c
alf
slau
ghte
r (h
ead
)
AU WA
0
50
100
150
200
250
300
350
Nu
mb
er
of
anim
als
slau
ghte
red
(h
ead
)
Bulls, bullocks & steers Cows & heifers

6
Beef production
As seen below in Figure 5, the volume of beef produced follows the same pattern as seen for
slaughter in Figure 3. Between 2010 and 2012, the volume of beef produced in WA fell by 17%,
from 118 million kilograms to 99 million kilograms. Since 2012, the volume of beef produced has
increased to 108 million kilograms, an increase of 10%, but is yet to reach the volumes reported
prior to 2010.
Figure 5 Volume of beef produced (million kilogram carcase equivalent weight) by Australia (LHS) and WA (RHS) (Based on data from ABS, analysed by DAFWA)
The majority of WA beef is consumed on the domestic market as seen in Figure 6 (domestic
consumption is estimated as total production minus export volume); however the proportion of
beef exported has been increasing in recent years. Between 2012 and 2015, the proportion of
beef exported has increased from 25% to 40%. When beef production was low in 2012, the
proportion of beef consumed on the domestic market was at its highest due to a limited capacity to
service overseas markets. However in recent years, due to heightened global demand, the
proportion of beef exported has increased.
0
20
40
60
80
100
120
140
0
500
1000
1500
2000
2500
3000
WA
be
ef
pro
du
ctio
n (
mill
ion
kg
ceq
)
Au
stra
lian
be
ef
pro
du
ctio
n (
mill
ion
kg
ceq
)
AU WA

7
Figure 6 Western Australian beef consumption by market (Based on ABS data, analysed by DAFWA)
Boxed beef exports
Volume
The volume of beef exported from WA fell from 47 million kilograms (carcase equivalents (ceq)) in
2008 to 25 million kilograms (ceq) in 2012; however between 2012 and 2015 WA beef exports
have increased 72% to 43 million kilograms (ceq). The volume exported in 2015 was just 9% less
than the highest volume exported over the last decade, recorded in 2008.
Beef exports from Australia as a whole prior to 2012 were relatively stable; however since then
exports have been rapidly increasing. Between 2012 and 2015 beef exports increased 31% from
1.47 billion kilograms (ceq) to 1.93 billion kilograms (ceq). This increase was partly due to the
opening up of markets such as China, Malaysia and Vietnam and the sell-down of the herd due to
sustained dry periods in Queensland and New South Wales.
0%
10%
20%
30%
40%
50%
60%
70%
80%
90%
100%
export
domestic

8
Figure 7 Volume of beef exported (million kilograms carcase equivalent weight) by Australia (LHS) and WA (RHS) (Based on ABS data, DAFWA analysis)
During 2014 the largest market by volume for WA beef was Japan, which accounted for 27% of all
beef exported (Figure 8). During 2015 however, the Japanese market only accounted for 16% of
WA beef exports.
China, which imported just 6% of beef exports in 2014, doubled its share to 12% in 2015 and the
USA increased its beef imports from 8% of WA exports in 2014 to 15% in 2015.
Figure 8 Proportion of WA beef exported to major markets by volume (ceq) during 2014 and 2015 (Based on ABS data, DAFWA analysis)
Value
The value of WA beef exports, while displaying a trend similar to that of volume, has been even
more dramatic. As seen below in Figure 9, the value of WA beef exports hit a low point in 2012 of
0
5
10
15
20
25
30
35
40
45
50
0
500
1000
1500
2000
2500
Vo
lum
e o
f W
A b
ee
f e
xpo
rts
(mill
ion
kg
ceq
)
Vo
lum
e o
f A
ust
ralia
n b
ee
f e
xpo
rts
(mill
ion
kg
ceq
) AU WA
Japan 27%
Indonesia 17%
Korea 17%
USA 8%
China 6%
Other (n=27)
25%
2014 Korea 18%
Japan 16%
USA 15%
Indonesia 15%
China 12%
Other (n=28)
24%
2015

9
$68 million, but has since increased 170% to $184 million in 2015. This is the highest beef export
value reached to date.
There has been a similar increase in that timeframe in the value of Australian beef exports. In
2012 the value of Australian beef exports was $4.8 billion, but that figure has risen 96% to $9.3
billion in 2015. This also, is the highest beef export value achieved in history.
Figure 9 Value (A$ million) of beef exported from Australia (LHS) and WA (RHS) (Based on ABS data, DAFWA analysis)
Due to the different cuts preferred by individual countries, the proportion of value attributed to
international markets can be different to that attributed to them based on volume.
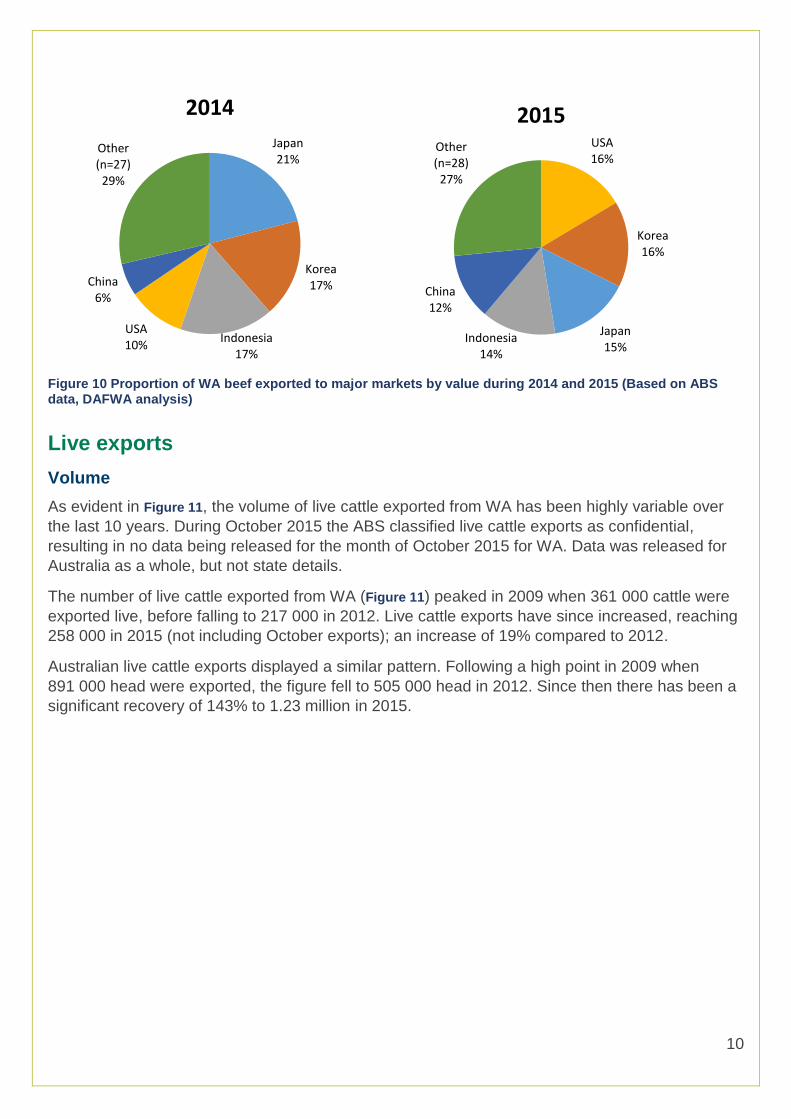
In 2014 the largest market by value for WA beef was Japan which accounted for 21% of the value
of WA beef exports. This was followed by Korea and Indonesia with 17% each, the USA with 10%
and China with 6%. In 2015 the USA became the largest market by value for WA beef, accounting
for 16% of the value of WA beef exports, just slightly higher than Korea which also took 16%.
Japan slipped back to third largest market accounting for 15% of the value of WA beef exports,
Indonesia fell to 14% and China grew to 12%.
0
20
40
60
80
100
120
140
160
180
200
0
1000
2000
3000
4000
5000
6000
7000
8000
9000
10000
WA
be
ef
exp
ort
val
ue
(A
$ m
illio
n)
Au
stra
lian
be
ef
exp
ort
val
ue
(A
$ m
illio
n)
AU WA
10
Figure 10 Proportion of WA beef exported to major markets by value during 2014 and 2015 (Based on ABS data, DAFWA analysis)
Live exports
Volume
As evident in Figure 11, the volume of live cattle exported from WA has been highly variable over
the last 10 years. During October 2015 the ABS classified live cattle exports as confidential,
resulting in no data being released for the month of October 2015 for WA. Data was released for
Australia as a whole, but not state details.
The number of live cattle exported from WA (Figure 11) peaked in 2009 when 361 000 cattle were
exported live, before falling to 217 000 in 2012. Live cattle exports have since increased, reaching
258 000 in 2015 (not including October exports); an increase of 19% compared to 2012.
Australian live cattle exports displayed a similar pattern. Following a high point in 2009 when
891 000 head were exported, the figure fell to 505 000 head in 2012. Since then there has been a
significant recovery of 143% to 1.23 million in 2015.
Japan 21%
Korea 17%
Indonesia 17%
USA 10%
China 6%
Other (n=27)
29%
2014
USA 16%
Korea 16%
Japan 15%
Indonesia 14%
China 12%
Other (n=28)
27%
2015

11
Figure 11 Number of cattle exported live from Australia (LHS) and WA (RHS) (Based on ABS data, DAFWA analysis) 2
During 2014 the largest market for WA’s live cattle exports was Indonesia, accounting for 43% of
cattle, followed by Israel with 27%, Malaysia with 11%, Egypt with 9% and Vietnam with 4%.
During 2015 (October exports excluded), while the destinations were the same, the proportion of
live cattle exported to each market changed dramatically. The proportion of cattle exported to
Vietnam increased from 4% in 2014 to 28% in 2015, making it the largest market by volume for
WA live cattle exports. Live cattle exports to Indonesia fell from 43% to 26%, Israel fell to 22%,
Malaysia remained at 11% and Egypt took 7% of WA’s live cattle exports (Figure 12).
Figure 12 Proportion of cattle exported live to major markets from WA by volume in 2014 and 2015* (Based on ABS data, DAFWA analysis)2
2 2015* -WA data does not include October exports due to confidentiality issues.
0
50
100
150
200
250
300
350
400
0
200
400
600
800
1000
1200
1400
Nu
mb
er
of
WA
live
exp
ort
s (t
ho
usa
nd
he
ad)
Nu
mb
er
of
Au
sltr
alia
n li
ve e
xpo
rts
(th
ou
san
d
he
ad)
AU WA
Indonesia 43%
Israel 27%
Malaysia 11%
Egypt 9%
Vietnam 4%
Other (n=6)
6%
2014
Vietnam 28%
Indonesia 26%
Israel 22%
Malaysia 11%
Egypt 7%
Other (n=7)
6%
2015*

12
Value
The value of WA live cattle exports has also been quite variable over the last decade, as seen
below in Figure 13.
In 2010 WA live cattle exports were worth $233.1 million before falling to $154.2 million in 2012.
Since then, it recovered to $253.3 million in 2015, up 64% from 2012 and the highest value
reached over the last decade, despite October data not being included.
The value of Australian live cattle exports reached $551.5 million in 2009 before falling to $353
million in 2012. Since then there has been significant recovery, with the value of live cattle exports
reaching $994.1 million in 2014 and $1.2 billion in 2015, an increase of 249% since 2012.
Figure 13 Value (A$ million) of cattle exported live from Australia (LHS) and WA (RHS) (Based on ABS data, DAFWA analysis)2
In 2014, the largest market by value for live cattle exports from WA was Indonesia which
accounted for 44% of the total value of live cattle exports. This was followed by Israel worth 26%,
Malaysia valued at 11%, Egypt worth 8% and Vietnam at 4%.
During 2015 (October data excluded), the largest market by value was Vietnam which accounted
for 29% of the value of live cattle exported from WA, as seen in Figure 14. The second largest
market by value was Israel with 24%, followed by Indonesia with 23%, Malaysia with 12% and
Egypt with 7%.
-
50
100
150
200
250
300
-
200
400
600
800
1,000
1,200
1,400
Val
ue
of
WA
live
exp
ort
s (A
$ m
illio
n)
Val
ue
of
Au
stra
lian
live
exp
ort
s (A
$ m
illio
n)
AU WA

13
Figure 14 Proportion of WA cattle exported live to major markets by value in 2014 and 2015 (Based on ABS data, DAFWA analysis)2
Market indicators
Between January and July 2016, cattle market indicators across the board in WA have been very
strong.
As seen below in Figure 15, the WA feeder yearling saleyard indicator has been well above that
reported for the corresponding months in the previous three years and the prices quoted have
been 10% to 21% higher than the corresponding months in 2015, which was also a well-priced
year. As of July 2016, the feeder yearling indicator was 329c/kg compared to 289c/kg at the same
time in 2015.
Figure 15 Trend in WA feeder yearling saleyard indicator (c/kg liveweight) (Based on data from MLA/NLRS, analysed by DAFWA)
Indonesia 44%
Israel 26%
Malaysia 11%
Egypt 8%
Vietnam 4%
Other (n=6)
7%
2014 Vietnam
29%
Israel 24%
Indonesia 23%
Malaysia 12%
Egypt 7%
Other (n=7)
5%
2015*
0
50
100
150
200
250
300
350
2013
2014
2015
2016
14
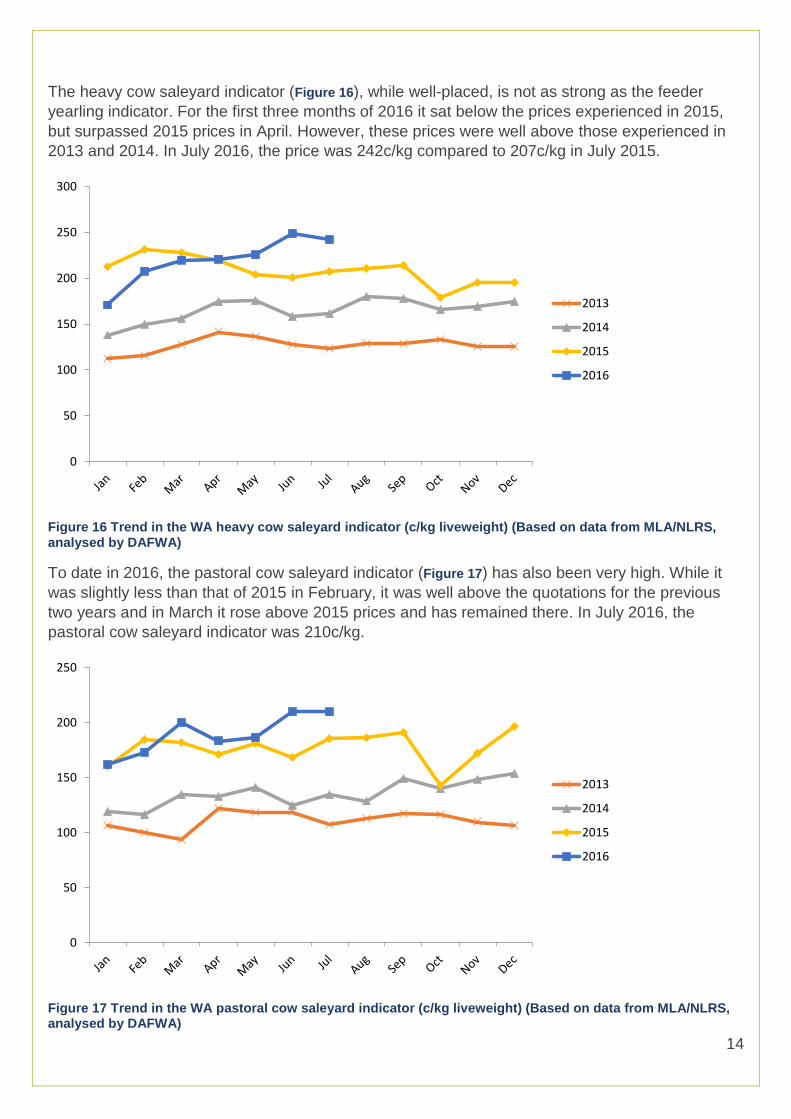
The heavy cow saleyard indicator (Figure 16), while well-placed, is not as strong as the feeder
yearling indicator. For the first three months of 2016 it sat below the prices experienced in 2015,
but surpassed 2015 prices in April. However, these prices were well above those experienced in
2013 and 2014. In July 2016, the price was 242c/kg compared to 207c/kg in July 2015.
Figure 16 Trend in the WA heavy cow saleyard indicator (c/kg liveweight) (Based on data from MLA/NLRS, analysed by DAFWA)
To date in 2016, the pastoral cow saleyard indicator (Figure 17) has also been very high. While it
was slightly less than that of 2015 in February, it was well above the quotations for the previous
two years and in March it rose above 2015 prices and has remained there. In July 2016, the
pastoral cow saleyard indicator was 210c/kg.
Figure 17 Trend in the WA pastoral cow saleyard indicator (c/kg liveweight) (Based on data from MLA/NLRS, analysed by DAFWA)
0
50
100
150
200
250
300
2013
2014
2015
2016
0
50
100
150
200
250
2013
2014
2015
2016

15
The light bull saleyard indicator (Figure 18) has been well above the prices experienced during the
previous three years and has been between 11% and 40% stronger than the corresponding times
in 2015. In July, the light bull saleyard indicator was averaging 307c/kg.
Figure 18 Trend in the WA light bull saleyard indicator (c/kg liveweight) (Based on data from MLA/NLRS, analysed by DAFWA)
Competitor analysis - New Zealand
The New Zealand cattle industry is comprised of beef cattle and a large dairy cattle component.
The total cattle population in New Zealand during 2015 was 10 million head, down from 10.4
million in 2014, as seen in Figure 19. This consisted of 3.5 million beef cattle and 6.5 million dairy
cattle (Statistics New Zealand).
Due to recent growth in the New Zealand dairy industry, which has caused displacement of beef
cattle and other animals, there has been a downward trend in the number of beef cattle. The
proportion of dairy cattle has grown from 53% in 2005 to 65% in 2015, as illustrated in Figure 19
(Statistics New Zealand).
0
50
100
150
200
250
300
350
2013
2014
2015
2016

16
Figure 19 Total cattle population of New Zealand (Based on Statistics New Zealand data, DAFWA analysis)
New Zealand beef production generally peaks during late autumn or early winter when dry
conditions and low feed availability cause producers to sell down. Calf slaughter generally occurs
in August and September when the dairy herds are calving (MLA). Around 70% of beef is
produced in the North Island, as seen in Figure 20.
New Zealand has a relatively small beef industry compared to Australia. In 2015, New Zealand’s
beef production totalled 656 million kilograms of beef compared to Australia’s 2547 million
kilograms. Despite this, New Zealand is a major international competitor, exporting about 95% of
production (MLA). Between 2013 and 2015, beef production increased 11% from 589 million
kilograms to 656 million kilograms, due in part to the growth of the dairy sector as excess animals
were turned off for meat (Figure 20).
0
2
4
6
8
10
12
No
he
ad (
mill
ion
)
Beef cattle Dairy cattle

17
Figure 20 New Zealand beef production (million kilograms cwt) (Based on data from MLA, DAFWA analysis)
Most of the beef exported from New Zealand is manufacturing beef from cull cows, a by-product of
the dairy industry. The largest export destination by volume is North America which took over 150
million kilograms during 2014/15, followed by North Asia which took over 60 million kilograms.
North Asia is a quickly-growing market and so far in 2015/16 has grown to 80 million kilograms,
due largely to growth in the Chinese market (Beef & Lamb NZ).
Market analysis - Korea
In 2015 Korea was Western Australia’s largest market for boxed beef by volume, accounting for
18% of the market or 7.8 million kilograms, an increase of 7% year on year (Figure 8). Korea was
the second largest market in value terms, worth $29.2 million during 2015, an increase of 17%
year on year (Figure 10).
Between 2012 and 2015 there has been remarkable growth in beef exports to Korea, both in value
and volume, as seen below in Figure 21. In that period there has been a 141% increase in volume
from 3.2 million kilograms to 7.8 million kilograms, and a 244% increase in value from $8.5 million
to $29.2 million.
0
100
200
300
400
500
600
700
Be
ef
pro
du
ctio
n (
mill
ion
kilo
gram
s cw
t)
South Island North Island
18
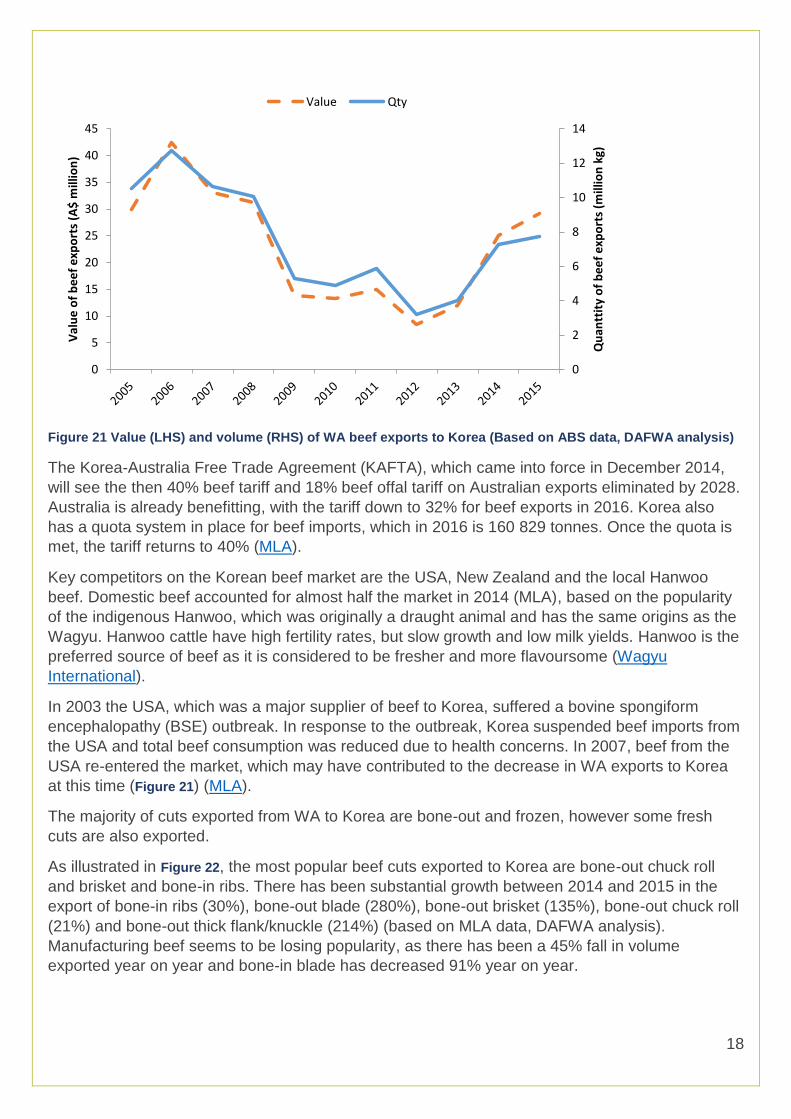
Figure 21 Value (LHS) and volume (RHS) of WA beef exports to Korea (Based on ABS data, DAFWA analysis)
The Korea-Australia Free Trade Agreement (KAFTA), which came into force in December 2014,
will see the then 40% beef tariff and 18% beef offal tariff on Australian exports eliminated by 2028.
Australia is already benefitting, with the tariff down to 32% for beef exports in 2016. Korea also
has a quota system in place for beef imports, which in 2016 is 160 829 tonnes. Once the quota is
met, the tariff returns to 40% (MLA).
Key competitors on the Korean beef market are the USA, New Zealand and the local Hanwoo
beef. Domestic beef accounted for almost half the market in 2014 (MLA), based on the popularity
of the indigenous Hanwoo, which was originally a draught animal and has the same origins as the
Wagyu. Hanwoo cattle have high fertility rates, but slow growth and low milk yields. Hanwoo is the
preferred source of beef as it is considered to be fresher and more flavoursome (Wagyu
International).
In 2003 the USA, which was a major supplier of beef to Korea, suffered a bovine spongiform
encephalopathy (BSE) outbreak. In response to the outbreak, Korea suspended beef imports from
the USA and total beef consumption was reduced due to health concerns. In 2007, beef from the
USA re-entered the market, which may have contributed to the decrease in WA exports to Korea
at this time (Figure 21) (MLA).
The majority of cuts exported from WA to Korea are bone-out and frozen, however some fresh
cuts are also exported.
As illustrated in Figure 22, the most popular beef cuts exported to Korea are bone-out chuck roll
and brisket and bone-in ribs. There has been substantial growth between 2014 and 2015 in the
export of bone-in ribs (30%), bone-out blade (280%), bone-out brisket (135%), bone-out chuck roll
(21%) and bone-out thick flank/knuckle (214%) (based on MLA data, DAFWA analysis).
Manufacturing beef seems to be losing popularity, as there has been a 45% fall in volume
exported year on year and bone-in blade has decreased 91% year on year.
0
2
4
6
8
10
12
14
0
5
10
15
20
25
30
35
40
45
Qu
antt
ity
of
be
ef
exp
ort
s (m
illio
n k
g)
Val
ue
of
be
ef
exp
ort
s (A
$ m
illio
n)
Value Qty

19
Figure 22 Major meat cuts exported from WA to Korea (Based on MLA data, DAFWA analysis)
In 2015 the Korean population was estimated to be approximately 50 million and beef
consumption was approximately 11 kilograms per capita per year (MLA).
The Korean national cattle herd (including dairy cattle) peaked in 2012 at 3.5 million head but was
down to 3 million in March 2016 (Statistics Korea).
The number of Korean cattle farms has been in a state of decline over the last 30 years. About
17% of the national cattle herd comes from cattle farms that have less than 20 head, and these
small farms comprise more than 65% of cattle farms in Korea. The proportion of larger farms has
been increasing over recent years and as of 2014, a third of cattle were contained on farms with
over 100 head (MLA).
Weather watch
In Western Australia, and Australia as a whole, the period from November 2015 to August 2016
provided a mixed season as far as rainfall was concerned, as seen in Figure 23. Much of the
southern half of WA has experienced a relatively wet first half of 2016, reporting rainfall in deciles
eight and above. The amount of rainfall received between 1 November 2015 and 31 July 2016
was above average or very much above average. This was welcome news as the previous winter
had been very dry in parts, resulting in low stock water levels.
The situation has not been as favourable in the northern parts of the State, with the wettest part of
the year providing average to very much below average rainfall levels. Parts of the Kimberley and
Pilbara reported rainfall deciles between one and three. Conditions in many parts of these regions
led to producers commencing mustering earlier than usual and selling a large number of cattle in
the first trimester of 2016. Significant rainfall in May resulted in useful pasture growth in parts of
the Kimberley and Pilbara, which produced much-needed additional feed. However, lower than
average rainfall may result in a difficult season and excess cattle may come onto markets, either
for live export or come south for slaughter due to a lack of feed availability in the north.
0
100
200
300
400
500
600
700
800
900
Bla
de
Rib
s
Sho
rt R
ibs
Bla
de
Bri
sket
Ch
uck
Ro
ll
Man
ufa
ctu
rin
g
Silv
ers
ide
/Ou
tsid
e
Thic
k Fl
ank/
Kn
uck
le
BONE IN BONE OUT
Be
ef
exp
ort
in t
on
ne
s
2014
2015

20
Over the last nine months, the majority of Queensland and NSW have also received variable
rainfall, varying from very much below average to very much above average in parts. In June the
Eastern States experienced widespread rain. While still drought-declared, the rain has been
welcomed by producers and may lead to the start of herd rebuilding.
Figure 23 Rainfall deciles from November 2015 to August 2016 (Source: The Bureau of Meteorology)

Appendix