western cape government provincial treasury · 2015-11-20 · western cape government provincial...
TRANSCRIPT

Western Cape Government Provincial Treasury
Medium Term Budget Policy Statement 2016 - 2019

Provincial Treasury Business Information and Data Management Private Bag X9165 7 Wale Street Cape Town tel: +27 21 483 5618 fax: +27 21 483 6601 www.westerncape.gov.za Afrikaans and isiXhosa versions of this publication are available on request. Email: [email protected]
PR371/2015 ISBN 978-0-621-44144-4

Foreword
The Western Cape Medium Term Budget Policy Statement (MTBPS) 2016 – 2019 provides the economic, fiscal and policy context within which next year’s budget is being formulated. The MTBPS provides the budget policy framework to support service delivery and drive the policy imperatives of the Western Cape Government within a constrained economic and fiscal environment.
The higher than anticipated public sector wage agreement and the weaker economic performance which is associated with a series of interrelated structural challenges has called for a more integrated approach to policy, planning and budgeting which is aimed toward attaining fiscal sustainability. The budget policy objectives as outlined in the MTBPS are in support of inclusive growth which captures the importance of structural transformation for economic diversification, socio-economic conditions and competition. It puts the emphasis on policies that remove constraints to growth and inequality and creates a level playing field for investment and access to economic opportunity.
The Provincial Strategic Plan 2014 - 2019 and related Game Changers are the main policy considerations of the Western Cape Government and provide a roadmap to deliver on the vision of the WCG and key objectives of the National Development Plan 2030 and United Nation’s Sustainable Development Goals. To give effect to the main thrusts of these policy imperatives, the MTBPS outlines the budget priorities which impact on the supply side factors to economic growth (health, education and infrastructure) and also has a distribution impact to reduce poverty and inequality.
Widespread challenges around the global and domestic environment underpin the substantive budget policy choices. These choices will drive innovation, capitalise on competitive advantages and create opportunities for choice architecture to achieve behavioural change. The MTBPS therefore showcases the WCG’s deliberate attempt at achieving the overarching goal of fiscal stability, irreversible change and ultimately creating public value through improving the lives of citizens in an impactful manner.
Dr Ivan Meyer Minister of Finance 20 November 2015


i
Contents Chapter 1 Economic outlook 1 Introduction 1
Developments in the global economy 2
Developments in the national economy 3
Structure, performance and outlook for the Western Cape economy
4
Labour market trends 7
Socio-economic developments 9
Policy implications of socio-economic outlook 15
Conclusion 15
Chapter 2 The fiscal framework 17 Fiscal outlook 17
Provisional fiscal framework 18
Provincial own receipts 25
Conclusion 29
Chapter 3 Budget policy priorities 31 The Policy Context 31
Budget Policy Framework 34
Medium term provincial budget policy priorities 37
Conclusion 52
Chapter 4 Infrastructure 53 Overview 53
Improving capital budgeting and performance 53
Medium-term spending priorities 55
Conclusion 61
Chapter 5 Expenditure 63 Introduction 63
Provincial government expenditure 63
2015/16 mid-year estimates 64
2015 Adjusted Estimates 65
Efficiency in spending 67
Conclusion 68
Annexure 69
Glossary 71

Medium Term Budget Policy Statement 2016 - 2019
ii
Tables Chapter 1: Economic outlook
1.1 Global economic outlook, 2015 - 2016 2
1.2 South African economic performance and outlook 2013 - 2018 4
1.3 Labour market aggregates, 2010Q3 and 2015Q3 8
1.4 Percentage of population living in poverty, 2006, 2009 and 2011 10
1.5 Western Cape systemic test results, 2013 - 2014 12 Chapter 2: The fiscal framework
2.1 Summary of PES data updates 19
2.2 Impact on PES component shares between 2015 and 2016 MTEF 20
2.3 Revisions to the 2016 equitable share 22
2.4 Conditional grant baseline allocations for the 2016 MTEF 23
2.5 Summary of estimated provincial own receipts by vote 26
2.6 Estimated Western Cape own receipts by source 2015/16 - 2018/19 28
2.7 Fiscal framework of the Western Cape 2015/16 - 2018/19 29 Chapter 5: Expenditure
5.1 Estimated provincial expenditure by votes from 2014/15 - 2018/19 64
Figures Chapter 1: Economic outlook
1.1 Structure of the Western Cape economy, 2013 5
1.2 Western Cape growth rates per district, 2000 – 2013 and Gross Value Add per district, 2013 (%)
6
1.3 Western Cape population by district, 2014 9
1.4 Western Cape Gini coefficient and GDPR growth rates, 2001 - 2013 10
1.5 Growth in primary and high school learner numbers, 2011/12 - 2014/15 11
1.6 Average life expectancy for males and females in Western Cape: 2001 - 2006, 2006 - 2011 and 2011 - 2016
13
1.7 Infant and under-5 child mortality rates, Western Cape, 2008 - 2012 13 Chapter 4: Infrastructure
4.1 Growth in maintenance 54

iii
Acronyms AAGR Annual average growth rate
AIDS Acquired Immune Deficiency Syndrome
APL Approved post list
BESP Built Environment Support Programme
Casidra Cape Agency for Sustainable Integrated Development in Rural Areas
CASP Comprehensive Agriculture Support Programme
COE Compensation of employees
CPS Construction Procurement Strategy
CSIP Community Safety Improvement Plan
DAFF Department of Agriculture, Forestry and Fisheries
DoRA Division of Revenue Act
ECD Early Childhood Development
EDB Ease of Doing Business
EEDBS Enhanced Extended Discount Benefit Scheme
EIG Education Infrastructure Grant
EPWP Expanded Public Works Programme
FET Further Education and Training
GBS General Budget Support
GDP Gross Domestic Product
GDPR Gross Domestic Product per Region
GIPTN George Integrated Public Transport Network
GSAs Geographic Service Areas
HIV Human Immunodeficiency Virus
HSPs Human Settlement Plans
ICT Information Communication Technology
IDMS Infrastructure Delivery Management System
IMF International Monetary Fund
IMR Infant mortality rate
IPMPs Infrastructure Programme Management Plans
LPMs Limited Payout Machines
LREAD Land Reform Advisory Desk

Medium Term Budget Policy Statement 2016 - 2019
iv
MOD Mass Opportunity and Development
MTBPS Medium Term Budget Policy Statement
MTEF Medium Term Expenditure Framework
MTSF Medium Term Strategic Framework
MVL Motor Vehicle Licence
NDP National Development Plan
NEETs Not in Education, Employment or Training
NGOs Non-Governmental Organisations
NSNP National School Nutrition Programme
NSC National Senior Certificate
PES Provincial Equitable Share
PER Property Efficiency Report
PILIR Policy on Incapacity Leave and Ill-Health Retirement
PPTIF Provincial Public Transport Institutional Framework
PSDF Provincial Spatial Development Framework
PSF Provincial Skills Forum
PSGs Provincial Strategic Goals
PSP Provincial Strategic Plan
RSEP Regional Socio-Economic Projects
SAPS South African Police Service
SDFs Spatial Development Frameworks
SDGs Sustainable Development Goals
SIPs School Improvement Plans
TB Tuberculosis
TVET Technical Vocational Education and Training
U5MR Under-5 mortality rate
U-AMP User-Asset Management Plan
VPUU Violence Prevention through Urban Upgrading
WC Western Cape
WCED Western Cape Education Department
WCG Western Cape Government
WCIF Western Cape Infrastructure Framework
WoW Western Cape on Wellness

1
1
Economic outlook
In summary
Global economic growth is expected to deteriorate from 3.4 per cent in 2014 to 3.1 per cent in 2015. A slowdown in China is of most concern to the global economy.
South African economic growth is expected to remain muted at 1.5 per cent for 2015. Growth in consumer spending and gross capital investment is to remain subdued.
Western Cape economic growth outlook is expected to be weaker, in line with the deteriorated global and national economic outlook.
There has been an improvement in the socio-economic conditions within the Province. However, remaining challenges of high unemployment, poverty and inequality reiterate the need for inclusive growth.
Introduction
Since exiting the global recession of 2008/09, global economic growth has been under significant pressure. Although advanced economies continued the higher output growth of 2013 into 2014, emerging and developing economies, led by China, experienced moderating growth. The trend of divergent growth between advanced and emerging and developing economies continued into 2015. The slow growth has become an enduring feature of global growth characterised by weak global trade, weak investment and low commodity prices.
The economic outlook anticipates relatively low economic growth for South Africa and consequently the Western Cape. The domestic environment comprises of low investment, low levels of business confidence and weak domestic demand as well as electricity constraints and depressed commodity prices. These will have a negative impact on fiscal revenue raising capacity and pose constraints on the resource envelope of government.

Medium Term Budget Policy Statement 2016 - 2019
2
Developments in the global economy
Global growth disappointed in the first half of 2015 and was below forecast in both advanced and emerging economies. As a result, the International Monetary Fund (IMF) estimates that global growth will moderate to 3.1 per cent in 2015 from 3.4 per cent in 2014 (Table 1.1). The 2015 forecast is lower than the 3.3 per cent predicted in July 2015.
In advanced economies, growth in the Eurozone was broadly in line with expectations for the first half of 2015. However, harsh weather conditions and port closures, lower capital spending in the oil sector and a stronger dollar resulted in growth in the United States underperforming. Consequently, the IMF downgraded its outlook for advanced economies to 2.0 per cent in 2015 and 2.2 per cent in 2016.
In emerging economies, lower oil and other commodity prices and lacklustre domestic demand have weighed on growth. This is particularly true of emerging Asia, Sub-Saharan Africa and the Middle East economies which are under increasing pressure. However, the slowdown in China is of most concern to the global economy. Economic conditions in emerging markets are expected to remain difficult over the medium term owing to persistently low global commodity prices, the start of the US monetary policy tightening cycle, weak exports and unavoidable domestic economic reforms. The IMF has therefore also downgraded its forecast for emerging market growth for both 2015 and 2016 by 0.2 percentage points compared to July.
Table 1.1 Global economic outlook, 2015 - 2016
2013 2014 2015 2016 2015 2016
Forecast Difference from
July 2015 forecast
World output 3.3 3.4 3.1 3.6 -0.2 -0.2
Advanced economies 1.3 1.8 2 2.2 -0.1 -0.2
Emerging and developing economies 4.7 4.6 4 4.5 -0.2 -0.2
Source: International Monetary Fund, World Economic Outlook, October 2015
More positively, the IMF expects a noticeable acceleration in global growth in 2016 to 3.6 per cent, reflecting a stronger performance in both emerging and advanced economies. However, downside risks to growth for emerging markets have increased. This is due to rising concerns about China’s growth transition (from investment-led growth to consumption) and the resulting rebalancing in the global commodity markets as well as the possibility of capital flow reversals in light of pending US
Global growth disappointed in the first half of 2015
Slowdown in China is of most concern to the global economy
Downside risks to growth for emerging economies have increased

Chapter 1: Economic outlook
3
interest rate hikes. In advanced economies, contagion risks from Greece-related events to other Eurozone economies are lower than earlier in the year, but remain present.
Developments in the national economy
South Africa’s economic performance has been weaker, in line with the global economy, relative to expectations at the time of tabling the February 2015 National Budget. South Africa’s economy expanded by only 1.8 per cent in the first half of 2015 compared to last year.
Growth in consumer spending has been losing momentum due to subdued growth in real disposable income and lower consumer confidence. The National Treasury foresees only a mild improvement in consumer spending growth from 1.5 per cent in 2015 to 1.7 in 2016, before accelerating more meaningfully to 2.5 and 2.8 per cent in 2017 and 2018, respectively (see Table 1.2).
Gross fixed capital formation, particularly in the private sector, is expected to remain subdued in 2015, albeit an improvement from the contraction in 2014. Fixed investment by general government, in contrast, has provided some boost to overall investment, while capital formation by public corporations slowed due to, among other things, construction delays on the Medupi and Kusile power plants. Growth in gross fixed capital formation beyond 2016 is predicted to improve more substantially.
In contrast, exports have fared well so far in 2015 boosted by stable – albeit still moderate – growth in Europe, coupled with the sustained weak rand exchange rate. Overall, exports are expected to rise by 8.3 per cent in 2015 (see Table 1.2) before slowing thereafter. Higher exports, along with lower international oil prices (which will help to limit the import bill) should see the current account deficit, as a percentage of GDP, narrow somewhat in 2015.
The deterioration in the global and domestic GDP growth outlook since February has resulted in downgrades to the National Treasury’s macroeconomic assumptions. The forecast for GDP growth is now lower than what was expected in February 2015.
Consumer spending growth is subdued at 1.5 per cent in 2015
Gross capital formation, in the private sector is to remain subdued in 2015
Downward revision of national growth forecast
Medium Term Budget Policy Statement 2016 - 2019
4
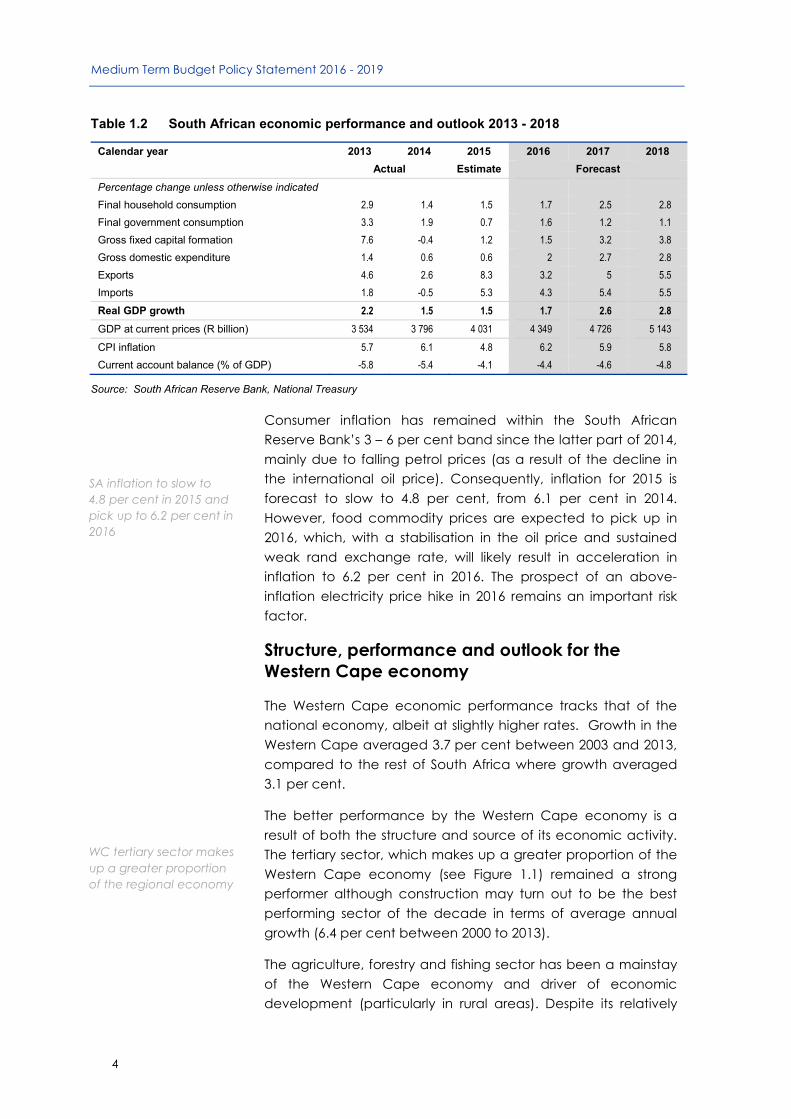
Table 1.2 South African economic performance and outlook 2013 - 2018
Calendar year 2013 2014 2015 2016 2017 2018
Actual Estimate Forecast
Percentage change unless otherwise indicated
Final household consumption 2.9 1.4 1.5 1.7 2.5 2.8
Final government consumption 3.3 1.9 0.7 1.6 1.2 1.1
Gross fixed capital formation 7.6 -0.4 1.2 1.5 3.2 3.8
Gross domestic expenditure 1.4 0.6 0.6 2 2.7 2.8
Exports 4.6 2.6 8.3 3.2 5 5.5
Imports 1.8 -0.5 5.3 4.3 5.4 5.5
Real GDP growth 2.2 1.5 1.5 1.7 2.6 2.8
GDP at current prices (R billion) 3 534 3 796 4 031 4 349 4 726 5 143
CPI inflation 5.7 6.1 4.8 6.2 5.9 5.8
Current account balance (% of GDP) -5.8 -5.4 -4.1 -4.4 -4.6 -4.8
Source: South African Reserve Bank, National Treasury
Consumer inflation has remained within the South African Reserve Bank’s 3 – 6 per cent band since the latter part of 2014, mainly due to falling petrol prices (as a result of the decline in the international oil price). Consequently, inflation for 2015 is forecast to slow to 4.8 per cent, from 6.1 per cent in 2014. However, food commodity prices are expected to pick up in 2016, which, with a stabilisation in the oil price and sustained weak rand exchange rate, will likely result in acceleration in inflation to 6.2 per cent in 2016. The prospect of an above-inflation electricity price hike in 2016 remains an important risk factor.
Structure, performance and outlook for the Western Cape economy
The Western Cape economic performance tracks that of the national economy, albeit at slightly higher rates. Growth in the Western Cape averaged 3.7 per cent between 2003 and 2013, compared to the rest of South Africa where growth averaged 3.1 per cent.
The better performance by the Western Cape economy is a result of both the structure and source of its economic activity. The tertiary sector, which makes up a greater proportion of the Western Cape economy (see Figure 1.1) remained a strong performer although construction may turn out to be the best performing sector of the decade in terms of average annual growth (6.4 per cent between 2000 to 2013).
The agriculture, forestry and fishing sector has been a mainstay of the Western Cape economy and driver of economic development (particularly in rural areas). Despite its relatively
SA inflation to slow to 4.8 per cent in 2015 and pick up to 6.2 per cent in 2016
WC tertiary sector makes up a greater proportion of the regional economy

Chapter 1: Economic outlook
5
small direct contribution to GDPR, the Province’s revealed comparative advantage in agriculture is manifested in agri-processing (agriculture, forestry, fishing, food, beverages and tobacco) accounting for 38.6 per cent of the Province’s exports.
Tourism is also one of the sectors in which the Province has a comparative advantage. Tourist spending has a strong, positive and sustainable impact on employment in many sectors (including the catering, accommodation, transport and retail) and districts of the Western Cape economy.
Figure 1.1 Structure of the Western Cape economy, 2013
Source: Statistics South Africa, Own calculations
The pace of growth in the Western Cape is less than half of what it was at the start of the recession in 2007. Economic growth in the Western Cape moderated from 2.7 per cent in 2012 to 2.4 per cent in 2013 (at basic prices). In line with the slowdown in the national economy, regional growth is expected to have slowed to 1.8 per cent in 2014.
Over the forecast horizon (2015 - 2020) economic growth in the Western Cape is expected to average 2.7 per cent per year (July 2015 forecast). The tertiary sector is likely to be the biggest driver of this growth, as has been the case over the past few years. However, the Western Cape economic growth outlook is expected to be weaker, in line with the deteriorated global and national economic outlook.
Agriculture, forestry and
fishing, 4%
Mining and quarrying,
0%
Manufacturing, 16%
Electricity, gas and water,
2%
Construction, 4%
Wholesale, retail and motor trade;
catering and accommodation,
16%Transport,
storage and communication,
10%
Finance, real estate and business services,
30%
Personal services,
7%
General government
services,11%
WC economy has comparative advantage in the agriculture and tourism sectors
WC growth slowed to 1.8 per cent in 2014
WC outlook is expected to be lower given the worsening global and national outlooks

Medium Term Budget Policy Statement 2016 - 2019
6
There are a number of risks to the economic outlook, these include:
The expected recovery in consumer spending could be weaker than anticipated as prospects for large-scale private sector job losses remain, amid limited scope for job creation in the public sector. This would be particularly important for the Western Cape as its economy is more sensitive to fluctuations in income than the national economy due to the services-orientated structure of the Provincial economy.
Higher than anticipated exchange rate pass-through effects could see inflation accelerate by more than what was expected, which could weigh on the purchasing power of consumers and their ability to spend.
Additionally, the World Economic Forum Global Risks 2015 report has identified water crises as one of the top ten global risks and has raised a concern that little tangible action has been taken to address it.
Spatial aspects of the Western Cape economy
An analysis of the spatial aspects of the regional economy has to start with the geographical concentration of its economic activities. The bulk (73.1 per cent) of economic activity in the Province takes place in the City of Cape Town Metropolitan Municipality (i.e. the City of Cape Town). By implication, the central dynamic of agglomeration forces is immediately evident.
Figure 1.2 Western Cape growth rates per district, 2000 – 2013 and Gross Value Add per district, 2013 (%)
Source: Department of Environmental Affairs and Development Planning, Quantec Research, Own calculations
City of Cape Town contributes 73.1 per cent to the WC economy

Chapter 1: Economic outlook
7
As depicted in Figure 1.2, over the 2000 – 2013 period, the Eden and Overberg districts were the fastest growing regions within the Province with an average annual growth rate of 4.9 per cent and 4.8 per cent, respectively.
The City of Cape Town Metropolitan Municipality is the second largest metro economy in the country and also the second largest contributor to national employment. Also, when viewed in terms of regions, in 2013 the Cape Winelands (11.3 per cent of GDPR) and Eden (7.7 per cent), combined with the City of Cape Town, generated 92.1 per cent of the Western Cape value added and employed close to 90 per cent of the provincial work force.
Located at the south-western tip of the Province, economic development ripples outwards from the City of Cape Town into the interior. While agricultural activities (including forestry and fishing) have been dwarfed by the manufacturing and services activities in the City of Cape Town, a consistent economic development theme in the outlying regions is the agricultural origins of these areas upon which much of the secondary and services activities in each area have been leveraged. On the other hand, the outlying municipal economies, integrated with the City of Cape Town economy, benefit from their proximity to Cape Town and all its infrastructural and logistical attributes. It seems the further into the interior the weaker the economic linkages and the more different the economic drivers, with the Central Karoo region’s municipalities defining the extreme on this spectrum.
Labour market trends
The past five-year period has been characterised by a slow and uneven recovery in labour market conditions in the post-recession period.
Eden and Overberg are the fastest growing regions within WC
City of Cape Town, Cape Winelands and Eden contribute 92.1 per cent to WC economy
Medium Term Budget Policy Statement 2016 - 2019
8
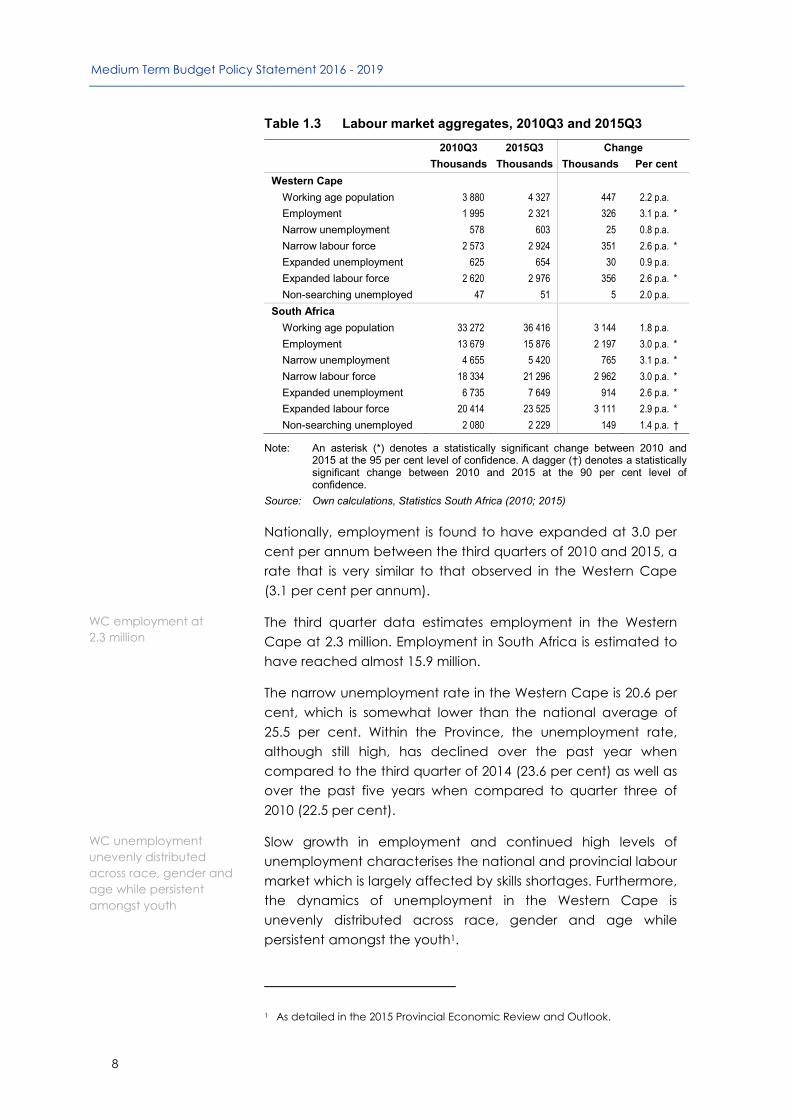
Table 1.3 Labour market aggregates, 2010Q3 and 2015Q3
2010Q3 2015Q3 Change
Thousands Thousands Thousands Per cent
Western Cape
Working age population 3 880 4 327 447 2.2 p.a.
Employment 1 995 2 321 326 3.1 p.a. *
Narrow unemployment 578 603 25 0.8 p.a.
Narrow labour force 2 573 2 924 351 2.6 p.a. *
Expanded unemployment 625 654 30 0.9 p.a.
Expanded labour force 2 620 2 976 356 2.6 p.a. *
Non-searching unemployed 47 51 5 2.0 p.a.
South Africa
Working age population 33 272 36 416 3 144 1.8 p.a.
Employment 13 679 15 876 2 197 3.0 p.a. *
Narrow unemployment 4 655 5 420 765 3.1 p.a. *
Narrow labour force 18 334 21 296 2 962 3.0 p.a. *
Expanded unemployment 6 735 7 649 914 2.6 p.a. *
Expanded labour force 20 414 23 525 3 111 2.9 p.a. *
Non-searching unemployed 2 080 2 229 149 1.4 p.a. †
Note: An asterisk (*) denotes a statistically significant change between 2010 and 2015 at the 95 per cent level of confidence. A dagger (†) denotes a statistically significant change between 2010 and 2015 at the 90 per cent level of confidence.
Source: Own calculations, Statistics South Africa (2010; 2015)
Nationally, employment is found to have expanded at 3.0 per cent per annum between the third quarters of 2010 and 2015, a rate that is very similar to that observed in the Western Cape (3.1 per cent per annum).
The third quarter data estimates employment in the Western Cape at 2.3 million. Employment in South Africa is estimated to have reached almost 15.9 million.
The narrow unemployment rate in the Western Cape is 20.6 per cent, which is somewhat lower than the national average of 25.5 per cent. Within the Province, the unemployment rate, although still high, has declined over the past year when compared to the third quarter of 2014 (23.6 per cent) as well as over the past five years when compared to quarter three of 2010 (22.5 per cent).
Slow growth in employment and continued high levels of unemployment characterises the national and provincial labour market which is largely affected by skills shortages. Furthermore, the dynamics of unemployment in the Western Cape is unevenly distributed across race, gender and age while persistent amongst the youth1.
1 As detailed in the 2015 Provincial Economic Review and Outlook.
WC employment at 2.3 million
WC unemployment unevenly distributed across race, gender and age while persistent amongst youth

Chapter 1: Economic outlook
9
Socio-economic developments
In terms of development indicators, such as measures of health status, education and population trends, socio-economic conditions vary across the Province, with some regions benefiting more from inclusive growth than others. While a positive trend is observed in respect of most socio-economic development measures, the Province, like the rest of South Africa, continues to grapple with the challenges of high levels of poverty, inequality, crime and substance abuse.
Population dynamics, poverty and inequality trends
The Western Cape has a population of 6.2 million people and accounts for 11.3 per cent of the national population. Migration and fertility are key determinants of population growth. The relatively low level of fertility experienced in the Province, coupled with the continuing net in-migration trend implies that future population growth in the Province would likely be as a result of net in-migration.
According to the most recent estimates the majority of the population in the Province (64.1 per cent) reside in the City of Cape Town. The Cape Winelands District is home to the second largest population (13.7 per cent) in the Province, followed by the Eden District (9.7 per cent). The Central Karoo District remains the least populated district with 1.2 per cent of residents.
Figure 1.3 Western Cape population by district, 2014
Source: Statistics South Africa, 2014 Mid-Year population estimates
According to Statistics South Africa, poverty has declined in the Western Cape. Using an inflation-adjusted per capita poverty line of R431 per month for 2006 and R620 for 2011, the share of the provincial population living under the poverty line declined
West Coast District 6.8%
Cape Winelands District 13.7%
Overberg District 4.5%
Eden District 9.7%
Central Karoo District 1.2%
City of Cape Town 64.1%
Medium Term Budget Policy Statement 2016 - 2019
10
to 24.7 per cent in 2011 from 36.9 per cent in 2006. The decline in poverty was driven by a number of factors including a growing social safety net, income growth, above inflation wage increases, decelerating inflationary pressure and an expansion of credit.
Table 1.4 Percentage of population living in poverty, 2006, 2009 and 2011
Province 2006 2009 2011
Western Cape 36.9 35.4 24.7
South Africa 57.2 56.8 45.5
Source: Statistics South Africa, Poverty trends in South Africa: An examination of absolute poverty between 2006 and 2011
A similar trend is noted when considering the depth and severity of poverty. The poverty gap measures the depth of poverty, i.e. distance of the population from the poverty line. The smaller the gap the easier it is for individuals/households to graduate out of poverty as they are closer to the poverty line. The poverty gap has decreased from 13.8 per cent in 2006 to 8.5 per cent in 2011. Similarly, the severity of poverty has declined from 7.0 per cent in 2006 to 3.9 per cent in 2011. The severity of poverty measures the level of inequality amongst the population living below the poverty line.
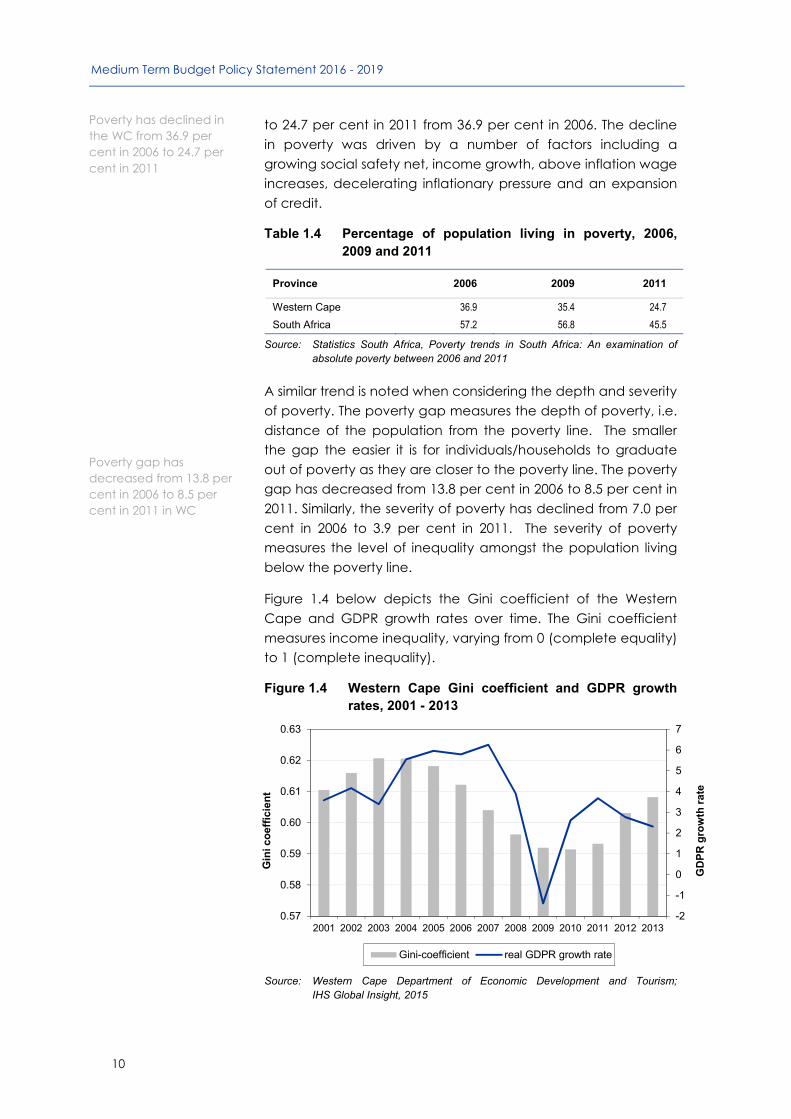
Figure 1.4 below depicts the Gini coefficient of the Western Cape and GDPR growth rates over time. The Gini coefficient measures income inequality, varying from 0 (complete equality) to 1 (complete inequality).
Figure 1.4 Western Cape Gini coefficient and GDPR growth rates, 2001 - 2013
Source: Western Cape Department of Economic Development and Tourism;
IHS Global Insight, 2015
-2
-1
0
1
2
3
4
5
6
7
0.57
0.58
0.59
0.60
0.61
0.62
0.63
2001 2002 2003 2004 2005 2006 2007 2008 2009 2010 2011 2012 2013
GD
PR
gro
wth
rat
e
Gin
i co
effi
cien
t
Gini-coefficient real GDPR growth rate
Poverty has declined in the WC from 36.9 per cent in 2006 to 24.7 per cent in 2011
Poverty gap has decreased from 13.8 per cent in 2006 to 8.5 per cent in 2011 in WC
Chapter 1: Economic outlook
11
The Gini coefficient improved between 2004 and 2010, before the trend reverses. The Gini coefficient seems to lag economic growth trends. A period of accelerated growth between 2003 and 2007 was accompanied by higher employment; credit expansion and an expanding safety net. The recession in 2009 and subsequent slow economic recovery, in contrast saw increasing unemployment and the tightening of credit by financial institutions. Importantly, the Gini coefficient has not worsened to pre-2005 levels. The slow pace of economic growth and constrained economic outlook may, however, impact negatively on the Gini coefficient going forward, especially if growth is not inclusive.
Education
Improving education outcomes is at the core of the National Development Plan reforms to eliminate poverty and address the inequalities that still persist.
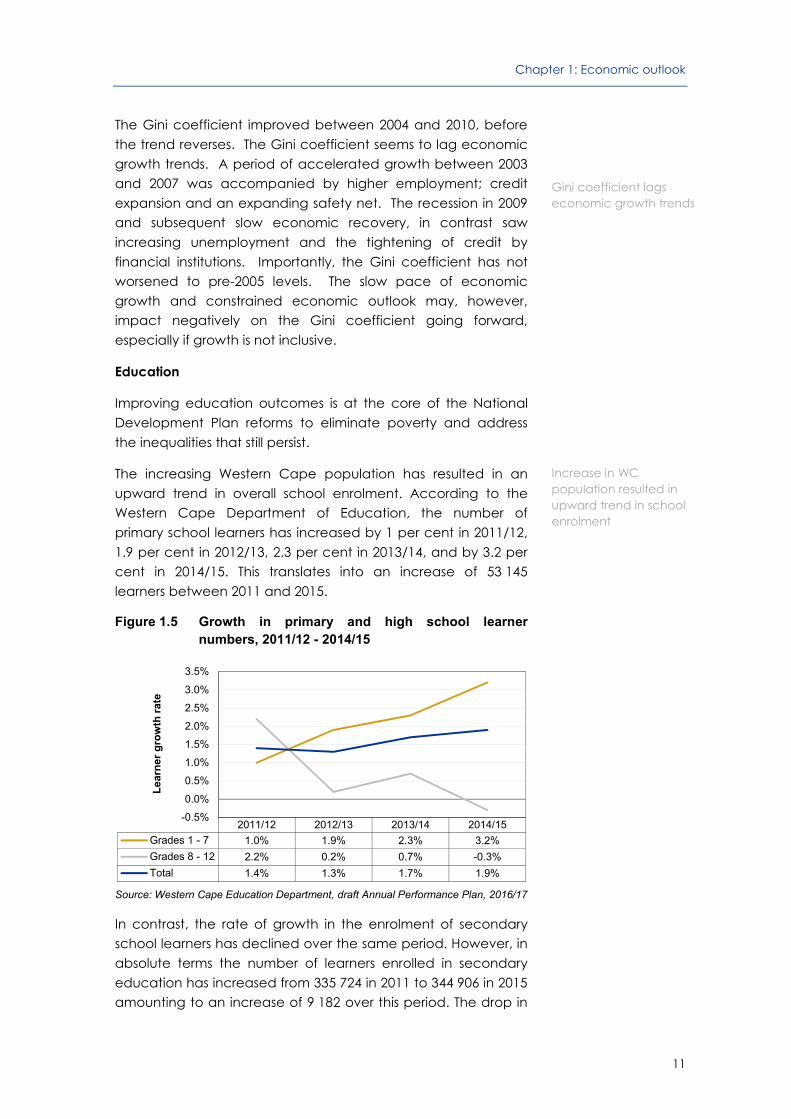
The increasing Western Cape population has resulted in an upward trend in overall school enrolment. According to the Western Cape Department of Education, the number of primary school learners has increased by 1 per cent in 2011/12, 1.9 per cent in 2012/13, 2.3 per cent in 2013/14, and by 3.2 per cent in 2014/15. This translates into an increase of 53 145 learners between 2011 and 2015.
Figure 1.5 Growth in primary and high school learner numbers, 2011/12 - 2014/15
Source: Western Cape Education Department, draft Annual Performance Plan, 2016/17
In contrast, the rate of growth in the enrolment of secondary school learners has declined over the same period. However, in absolute terms the number of learners enrolled in secondary education has increased from 335 724 in 2011 to 344 906 in 2015 amounting to an increase of 9 182 over this period. The drop in
2011/12 2012/13 2013/14 2014/15
Grades 1 - 7 1.0% 1.9% 2.3% 3.2%
Grades 8 - 12 2.2% 0.2% 0.7% -0.3%
Total 1.4% 1.3% 1.7% 1.9%
-0.5%
0.0%
0.5%
1.0%
1.5%
2.0%
2.5%
3.0%
3.5%
Lea
rner
gro
wth
rat
e
Gini coefficient lags economic growth trends
Increase in WC population resulted in upward trend in school enrolment

Medium Term Budget Policy Statement 2016 - 2019
12
the rate of growth of enrolment numbers can on the one hand be linked to the policy decision to subsidise certain learners in secondary schools who are challenged by the curriculum to enrol at FET/TVET colleges to ease the process toward becoming active labour market participants. On the other hand, it is influenced by factors such as the natural population growth patterns associated with this age cohort, which is currently experiencing a slowdown as well as learners who are seeking alternative paths such as early full-time employment rather than remaining in the formal education system. Drop-outs are also more common at these grades but through targeted interventions, the retention rate has significantly improved.
Table 1.5 Western Cape systemic test results, 2013 - 2014
Grade 3 Grade 6 Grade 9
2013 2014 2013 2014 2013 2014
Maths Language Maths Language Maths Language Maths Language Maths Language Maths Language
Wrote 81 883 81 888 85 623 85 610 73 908 73 900 72 214 72 198 79 699 74 534 71 345 71 266
Pass 45 036 30 299 46 263 36 299 20916 21 800 21953 27 363 10 682 35 627 10 630 33 923
Pass % 55 37 54 42.4 28 30 30.4 37.9 14 48 14.9 48
Source: Western Cape Education Department; Annual Performance Plan, 2014/15 and 2015/16
Improvements to the quality of education has been tracked via the programme of systemic testing of Grades 3, 6 and 9 Language and Mathematics in the Western Cape over the past 13 years. The systemic test scores for 2014 show modest improvements compared to 2013 with the exception of Grade 3 Mathematics. These improvements in education outcomes are critical to reducing poverty and supporting economic growth.
The National Senior Certificate (NSC) results between 2009 and 2014 reveal that the number of learners in the Western Cape which had access to a B Degree has increased from 14 324 in 2009 to 18 524 in 2014, a 29.3 per cent increase. The percentage of learners which passed the NSC exam has also improved from 75.7 per cent to 82.2 per cent over the same period. Initiatives implemented to support Grade 12 learners to pass the NSC examinations has seen the number of schools with a pass rate of less than 60 per cent in the NSC exam decline from 85 in 2009 to 31 in 2014.
Health
Despite the persistent high levels of unemployment and inequality, key health indicators illustrate improvement in certain development outcomes. Life expectancy continues to
In 2014, 82.2 per cent of learners in the WC passed the NSC exams

Chapter 1: Economic outlook
13
increase over time. The Western Cape population has the highest life expectancies in the country with male life expectancy increasing from 58.3 to 63.7 years and female life expectancy from 61.9 to 66.0 years, over the 2001 to 2016 period.
Figure 1.6 Average life expectancy for males and females in Western Cape: 2001 - 2006, 2006 - 2011 and 2011 - 2016
Source: Statistics South Africa, 2015 Mid-Year population estimates
The infant mortality rate (IMR) for the Western Cape in 2008 was 22.8, declining to 18.6 per 1 000 live births in 2012, as can be seen in Figure 1.7. The under-5 mortality rate (U5MR) for the Western Cape has followed the same declining trend over time, estimated at 28.0 per 1 000 live births in 2008 decreasing to 23.0 in 2012.
Figure 1.7 Infant and under-5 child mortality rates, Western Cape, 2008 - 2012
Source: Groenewald, Evans, Morden, et al (2015)
61.9
63.7
66.0
58.3
61.4
63.7
50
52
54
56
58
60
62
64
66
68
2001 - 2006 2006 - 2011 2011 - 2016
Females Males
0.0
5.0
10.0
15.0
20.0
25.0
30.0
35.0
2008 2009 2010 2011 2012
Under 5 Mortality Rate per 1000 live births
Infant Mortality rate per 1000 live births
WC life expectancy for both males and females have improved over time
WC infant and under-5 mortality rates improved over time

Medium Term Budget Policy Statement 2016 - 2019
14
Socio-economic challenges
According to the 2012 Western Cape Mortality Profile, Ischaemic heart disease was the leading cause of death for all persons in the Western Cape followed by HIV and AIDS and cerebrovascular disease. However, HIV andAIDS remained the single leading cause of premature mortality (years of life lost) for all persons in 2012. Injuries accounted for a larger proportion of male compared to female deaths, peaking between 15 and 35 years of age. Interpersonal violence accounted for over half of all violent injuries in the Western Cape. HIV andAIDS deaths accounted for a higher proportion of deaths in younger females (20 - 29 years of age) compared to men of the same age. This reiterates some of the challenges that require urgent responses by government in partnership with active citizens.
Crime touches and affects nearly everyone to some degree in the Province. The impact on society includes both financial costs and a lack of quality of life. The types of costs and effects vary widely and can include medical costs, property losses, and loss of income. Considerable money is also spent to avoid being victimised. Some costs are less tangible which can include pain and suffering, leading to a lower quality of life.
Alcohol and drug abuse remain pertinent and noteworthy issues in the Western Cape. Substance abuse (drug and alcohol abuse) is a major contributor to crime in the Province. According to the Policing Needs and Priorities (PNP) Report (2013/14), substance abuse accounted for more than a third of the causes of crime in the Western Cape in 2012/13. The Western Cape also accounted for 47 per cent of national drug related crime in 2010/11 and 40 per cent in 2012/13.
Crime statistics for the Western Cape revealed an increase in drug-related crime in the Western Cape between 2010/11 and 2014/15. Furthermore, the 2014 Victim Survey reveals that an overwhelming majority (85 per cent) of sampled households in the Western Cape singled out drug related needs as the reason for crime. Murder and burglaries at residential premises were among the other crime categories which has increased between 2010/11 and 2014/15 in the Western Cape.
HIV and AIDS is the single leading cause of premature mortality in 2012
Substance abuse is a major contributor towards crime in the WC
Chapter 1: Economic outlook
15
Policy implications of socio-economic outlook
Inclusive growth captures the importance of structural transformation for economic diversification, socio-economic development and competition. It puts the emphasis on policies that remove constraints to growth and inequality and creates a level playing field for investment and access to opportunity.
The Province aims to capitalise on its relative comparative advantages while simultaneously considering interventions which encourage an economic structure that is more labour intensive to increase employment and economic opportunities. Actions include strengthening value chains within and across promising sectors, to acknowledge and build on good business results, and systematically develop skills and infrastructure where it will have the greatest impact.
Skills development initiatives remain critical. By improving education outcomes, the (future) employability of young people already in the education system are increased, thereby increasing the future skills profile of the Provincial labour force.
Infrastructure investment is an important prerequisite for poverty relief and economic growth, and represents a significant portion of government budgets. As an economic enabler, road infrastructure plays a particularly important role in connecting local economies to each other. It is therefore critical that the actions taken by all spheres of government maximise their returns to their respective infrastructure investments.
Conclusion
The economic outlook anticipates relatively low economic growth for South Africa and consequently the Western Cape, which negatively impacts on the fiscal resources of government. The context of the current economic outlook has reinforced South Africa’s fiscal policy stance of stabilising debt levels to maintain healthy public finances and improve the effectiveness of spending in current priority areas. The Western Cape Government is responsive to the socio-economic challenges faced by the Province such as unemployment, poverty and inequality - by committing to ‘inclusive growth’ - growing the economy and creating jobs. Outcomes related to education, health and broader social ills associated with crime, substance abuse; impact on economic development, and are thus focus areas of the Western Cape Government.


17
2
The fiscal framework
In summary
The impact of persisting weak economic conditions continue to constrain the available fiscal envelope.
Funding the higher than anticipated 2015 Wage Agreement is a key provincial budget challenge.
Adjustments to the Provincial Equitable Share include allocations from the National Contingency Reserve to cushion the shortfalls from the 2015 Wage Agreement.
National transfers, comprising of the Provincial Equitable Share and Conditional Grants, are the main source of provincial receipts over the 2016 MTEF (94.5 per cent).
Although a relatively small portion of provincial receipts is collected from own revenue, the importance of Provincial revenue enhancement strategies remains a priority.
Fiscal outlook
Available fiscal resources depend directly on revenues generated by the economy. South Africa is experiencing a sustained period of low growth which is placing a curb on the expansion of government revenue to meet the country’s development requirements. The ability of government to place the economy on a sustainable fiscal path and reduce the national budget deficit has been hindered by slower than forecast economic growth and the higher than anticipated 2015 Wage Agreement thereby placing more pressure on the public finances. The 2015 National Medium Term Budget Policy Statement (MTBPS) builds on previous commitments to stabilise public debt as a share of GDP and improve the effectiveness of government spending.
National Treasury remains committed to fiscal policy based on principles of counter-cyclicality, debt sustainability and intergeneration fairness. To assist with achieving these objectives, the National MTBPS proposes a new long-term fiscal guideline to align the spending ceiling to the long-run path of economic growth, in other words spending is to remain stable as a share of GDP, unless financed by permanent increases in revenue.

Medium Term Budget Policy Statement 2016 - 2019
18
Key points from the National Medium Term Budget Policy Statement
Government’s central fiscal objective over the medium term is to stabilise the growth of debt as a share of GDP by continued revenue growth and strict adherence to the planned expenditure ceiling.
The proposed long-term fiscal policy guideline is to link expenditure and GDP growth.
Over the long term, the guideline maintains spending as a stable share of national income. However, where structural improvements in revenue are apparent, through tax policy changes, improved administration or economic shifts, a corresponding increase in the spending ceiling will be considered.
Expenditure on core social and economic programmes will be maintained, while spending on non-essential goods and services continue to decline in real terms.
The expenditure ceiling set in the 2015 National Budget remains in place. Indicative allocations in the third year of the budget framework have been restrained growing at 2.5 per cent above inflation.
A capital budgeting framework that addresses the planning, skills and capacity shortfalls across the public sector is being developed. Over the medium term this aims to improve spending efficiency within existing budgets, with a greater share of funds directed to improving asset management and maintenance. Spending reforms include improving capacity to appraise, select, plan and build capital projects, with capital projects being subject to cost-benefit analyses.
Spending pressures, including the higher 2015 Wage Agreement, have been accommodated within the contingency reserve and departmental baselines.
Source: National Treasury, Medium Term Budget Policy Statement 2015
Provisional fiscal framework
National transfers comprised of equitable share and conditional grants are the main source of revenue for meeting provincial expenditure responsibilities, and account for 75.46 per cent and 19.04 per cent respectively of available funding over the 2016 MTEF. Provinces have limited revenue raising options, with the result that own revenue accounts for less than 5 per cent of the available fiscal envelope over the 2016 MTEF period.
Provincial Equitable Share
The Constitution requires that an equitable share of nationally raised revenue be allocated to provincial government to enable it to provide basic services and perform its allocated functions. The formula is designed to divide the national revenue in an appropriate, consistent, transparent, efficient and unbiased manner.
To safeguard that allocations are fair, the equitable share is allocated through a formula using objective and verifiable data linked to the demand for services as well as taking into account specific provincial circumstances.
Data sets used in the formula are aimed at minimising data risks by keeping the model simple yet robust; avoiding the creation of incentives in the data reporting process; and using official and verifiable data sets.

Chapter 2: The fiscal framework
19
Data updates
To ensure that the formula is reflective of inter-provincial changes, the data used in the formula is updated on an annual basis to safeguard that a province’s share of national funding reflects population and service delivery changes. Statistics South Africa data, mid-year population estimates, as well as data relevant to a particular sector are used on an annual basis to update the formula.
The National Treasury and Provinces will review the Provincial Equitable Share formula (PES) over the MTEF period. The review is intended to ensure that the formula responds fairly to the spending pressures faced by all provinces.
Table 2.1 summarises the data sources used to update the various components of the PES formula. The impact of these data updates on the PES will be phased-in over the three year MTEF period (2016/17 to 2018/19), so as to smooth the impact of data changes on any one province.
The weighting allocated to each of the components is not indicative of how much a province should allocate to a specific area. Provinces, through their budget allocation procedures, determine allocations based on their own prioritisation process and specific circumstances, within the available fiscal envelope.
Table 2.1 Summary of PES data updates
PES component Key determinants or variables Data source
Education (48%)
School age cohort 5 - 17 years from Census 2011
School preliminary enrolment data 2015 data from School Realities Survey, Department of Basic Education
Health (27%) Uses a risk adjusted capitation index based on the Risk Equalisation Fund and output data from public hospitals
2015 Mid-year Population Estimates
Medical Aid Insured population data from the 2014 General Household Survey
Risk adjusted index
Data from the District Health Information System (average of 2013/14 and 2014/15 data)
Poverty (3%) Share of households in the lowest two quintiles
2015 Mid-year Population Estimates
2010/11 Income and Expenditure Survey
Economic Activity (1%) Provincial share of remuneration GDPR 2013
Basic (16%) Provincial share of population 2015 Mid-year Population Estimates
Institutional (5%) Equal proportions of operational costs for provincial government
Data not used - Distributed equally
The Provincial Equitable Share formula will be reviewed over the MTEF
Medium Term Budget Policy Statement 2016 - 2019
20
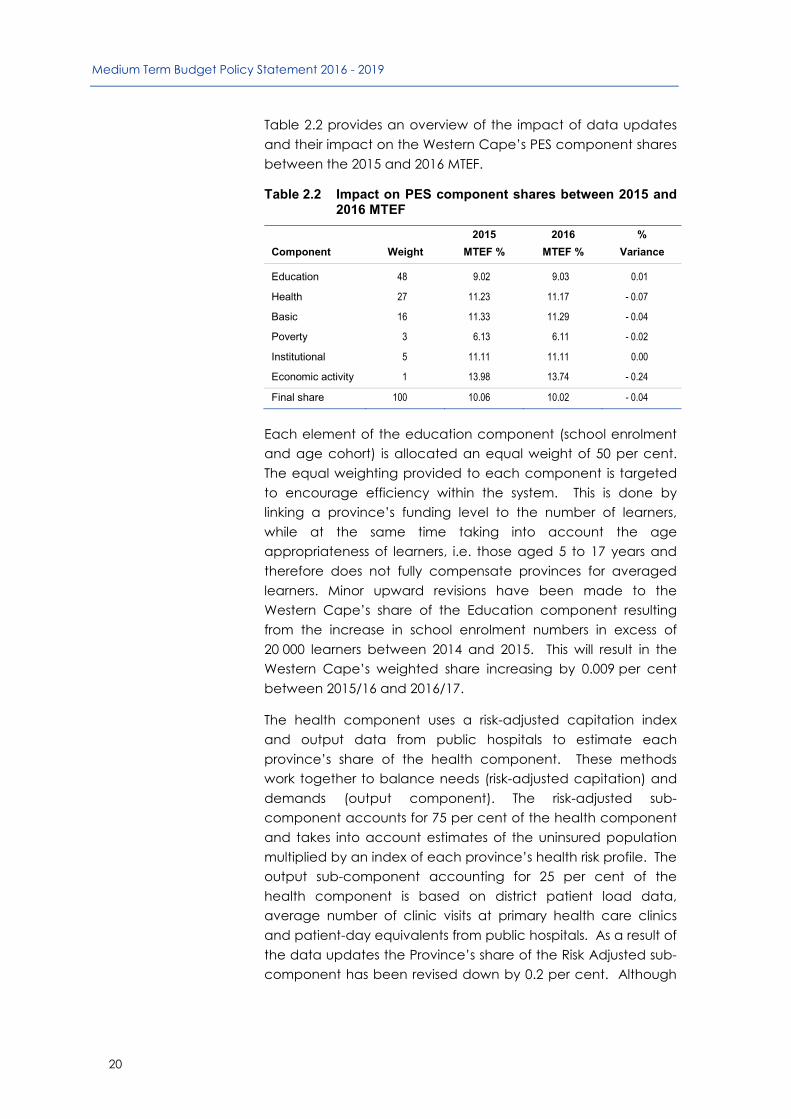
Table 2.2 provides an overview of the impact of data updates and their impact on the Western Cape’s PES component shares between the 2015 and 2016 MTEF.
Table 2.2 Impact on PES component shares between 2015 and 2016 MTEF
Component Weight
2015 2016 %
MTEF % MTEF % Variance
Education 48 9.02 9.03 0.01
Health 27 11.23 11.17 - 0.07
Basic 16 11.33 11.29 - 0.04
Poverty 3 6.13 6.11 - 0.02
Institutional 5 11.11 11.11 0.00
Economic activity 1 13.98 13.74 - 0.24
Final share 100 10.06 10.02 - 0.04
Each element of the education component (school enrolment and age cohort) is allocated an equal weight of 50 per cent. The equal weighting provided to each component is targeted to encourage efficiency within the system. This is done by linking a province’s funding level to the number of learners, while at the same time taking into account the age appropriateness of learners, i.e. those aged 5 to 17 years and therefore does not fully compensate provinces for averaged learners. Minor upward revisions have been made to the Western Cape’s share of the Education component resulting from the increase in school enrolment numbers in excess of 20 000 learners between 2014 and 2015. This will result in the Western Cape’s weighted share increasing by 0.009 per cent between 2015/16 and 2016/17.
The health component uses a risk-adjusted capitation index and output data from public hospitals to estimate each province’s share of the health component. These methods work together to balance needs (risk-adjusted capitation) and demands (output component). The risk-adjusted sub-component accounts for 75 per cent of the health component and takes into account estimates of the uninsured population multiplied by an index of each province’s health risk profile. The output sub-component accounting for 25 per cent of the health component is based on district patient load data, average number of clinic visits at primary health care clinics and patient-day equivalents from public hospitals. As a result of the data updates the Province’s share of the Risk Adjusted sub-component has been revised down by 0.2 per cent. Although

Chapter 2: The fiscal framework
21
the Province experienced an increase in Hospital Workload Patient Day Equivalents, Primary Health Care visits showed a year-on-year decline. The net effect of the data updates is a decline of 0.065 per cent to the Western Capes share of the Health Component.
The Economic Activity component is based on Regional Gross Domestic Product (GDPR). The Western Cape’s share has decreased marginally from 13.98 per cent to 13.74 per cent as a result of a relative decline in its share of economic activity as measured between the GDPR for 2012 and GDPR for 2013.
The Western Cape’s per cent share of the Basic component declined marginally by 0.04 per cent. The Basic component is derived from the proportion of each province’s share of the total population in the country. Although the Western Cape’s estimated population has increased from 6.1 million (2014 Mid-year population estimates) to 6.2 million (2015 Mid-year population estimates), its relative share declined.
Minor downward revisions have been made to the Province’s share of the Poverty component. The Western Cape’s relative share of the national population defined as poor, i.e. persons who fall in national quintiles 1 and 2 (bottom 40 per cent of household incomes) drawn from the 2010/11 Income and Expenditure Survey and updated 2015 Mid-year population estimates, declined marginally from 6.13 per cent to 6.11 per cent.
Revisions to the Provincial Equitable Share
The National Cabinet approved increases to the PES of R6.9 billion in 2016/17, R18.7 billion in 2017/18 and R22.9 billion in 2018/19. Data updates to the PES formula, and the phasing-in of the revisions over the 2016 MTEF were also approved.
Table 2.3 shows the preliminary revisions to the Western Cape’s PES over the 2016 MTEF, including statistical updates and phasing-in, cushioning and function shifts. The net effect of these changes result in additions to the PES over the MTEF for the Province of R711.551 million in 2016/17, R1.691 billion in 2017/18 and R2.117 billion in 2018/19.

Medium Term Budget Policy Statement 2016 - 2019
22
Table 2.3 Revisions to the 2016 equitable share
Rand thousand
2016 Medium-term expenditure framework
Total Revisions2016/17 2017/18 2018/19
Provincial equitable share (PES)
Provincial equitable share (PES) (as per final 2015 MTEF allocation letter)
40 501 046 43 307 975 45 652 373 129 461 394
Adjustments to baseline due to impact of new data updates in the PES formula and phase-in
17 411 -185 684 -175 647 -343 920
Total Adjustments 694 140 1 876 663 2 292 689 4 863 492
Improvement of Conditions of Service: 2015 Wage Agreement
714 161 1 896 693 2 312 728 4 923 582
Human Papillomavirus Vaccine Grant Reduction -20 021 -20 030 -20 039 -60 090
Total: Preliminary Provincial Equitable Share for 2016 MTEF
41 212 597 44 998 954 47 769 415 133 980 966
Variance: 2016 MTEF vs. 2015 MTEF 711 551 1 690 979 2 117 042 4 519 572
The extension of the human papilomavirus component of the indirect National Health Grant for a further 3 years has resulted in the Province’s share of the PES being reduced by R60.090 million over the 2016 MTEF.
Provincial conditional grants
This section provides an overview of the indicative conditional grant baselines for the Western Cape provincial departments.
National departments must still, after consultation with relevant stakeholders, finalise their respective decisions. Hence, allocations for conditional grants to the Province will only be certain once this process has been finalised.
Table 2.4 below presents the indicative baseline allocations to the conditional grant baseline for the 2016 MTEF.

Chapter 2: The fiscal framework
23
Table 2.4 Conditional grant baseline allocations for the 2016 MTEF
R'000 2016/17 2017/18 2018/19 Total MTEF
Agriculture 224 082 239 710 253 613 717 405
Comprehensive Agricultural Support Programme 169 411 179 981 190 420 539 812
Ilima/Letsema Projects 50 593 55 349 58 559 164 501
Land Care Programme: Poverty Relief and Infrastructure Development
4 078 4 380 4 634 13 092
Education 1 236 138 1 243 763 1 315 901 3 795 802
Maths, Science and Technology Grant 27 842 32 439 34 320 94 601
Education Infrastructure 874 263 860 226 910 119 2 644 608
HIV and AIDS (Life Skills Education) 18 728 20 028 21 190 59 946
National School Nutrition Programme 315 305 331 070 350 272 996 647
Health 5 096 508 5 459 977 5 776 656 16 333 141
Comprehensive HIV, AIDS and TB 1 281 795 1 445 369 1 529 200 4 256 364
Health Facility Revitalisation 589 566 587 460 621 533 1 798 559
Health Professions Training and Development 510 716 542 703 574 180 1 627 599
National Tertiary Services 2 706 888 2 876 429 3 043 262 8 626 579
National Health Insurance 7 543 8 016 8 481 24 040
Human Settlements 2 186 668 2 325 713 2 460 604 6 972 985
Human Settlements Development 2 186 668 2 325 713 2 460 604 6 972 985
Cultural Affairs and Sport 227 691 241 070 255 052 723 813
Mass Participation and Sport Development 62 418 66 163 70 000 198 581
Community Library Services 165 273 174 907 185 052 525 232
Transport and Public Works 1 687 358 1 738 442 1 839 272 5 265 072
Provincial Roads Maintenance 856 776 855 838 905 477 2 618 091
Public Transport Operations 830 582 882 604 933 795 2 646 981
2016 MTEF Baseline 10 658 445 11 248 675 11 901 098 33 808 218
Proposed baseline conditional grant allocation for the Province amounts to R33.808 billion over the 2016 MTEF with R10.658 billion in 2016/17, R11.249 billion in 2017/18 and R11.901 billion in 2018/19. Two conditional grants, namely: the National Tertiary Services Grant and Human Settlements Development Grant are the largest allocations over the MTEF period in the Western Cape at R8.627 billion and R6.973 billion, respectively.
The following changes to conditional grants are proposed in the National MTBPS:
Agriculture
To assist the Department of Agriculture, Forestry and Fisheries (DAFF) with capacitation to improve the monitoring of grants and the performance of the sector, a small amount will be reprioritised from the provincial conditional grant of the Comprehensive Agricultural Support Programme (CASP) to DAFF over the 2016 MTEF.

Medium Term Budget Policy Statement 2016 - 2019
24
Health
A new TB investment case study has indicated that between 2017/18 and 2018/19, additional resources are required to ameliorate the cost burden of TB in conjunction with the HIV virus and the progressive failure of the immune system (AIDS). It is agreed that the scope of the Comprehensive HIV and AIDS grant funding shall be expanded to cover TB both for relevant testing and programme intervention purposes. The name of the Comprehensive HIV and AIDS grant is also amended accordingly to Comprehensive HIV, AIDS and TB grant to reflect this.
In addition, it is proposed that funds will be added through the augmentation window in 2017/18 and 2018/19 to support expanded treatment of these diseases. This allocation will go towards funding, amongst other things, the compensation of employees as a result of the recent Wage Agreement as well as the ideal initiative clinic and extension of the Comprehensive HIV, AIDS and TB grant to achieve its added purpose.
The human papillomavirus component of the indirect national health grant, which was scheduled to end in 2015/16, will now be extended over the 2016 MTEF period. It will remain an indirect grant for the first two years of the period before becoming a direct grant from 2018/19.
Transport
It is proposed that funds will be added to the Public Transport Operations Grant over the 2016 MTEF period nationally to help alleviate the rising cost pressures that provinces face with providing subsidised road based public transport to the citizens. Provinces are also expected to contribute from their own budgets towards the costs of providing public transport.
Furthermore, according to the 2015 national MTBPS, additional funds will be added to the Provincial Roads Maintenance Grant to allow for the collection of data for measuring performance, maintaining roads and to create an incentive component to reward good performance in managing provincial roads infrastructure among provinces.
The name and scope of the Comprehensive HIV and AIDS grant has been expanded to include TB testing and treatments
The national indirect human papillomavirus component of the national health grant will be extended until 2018/19
It is proposed that funds will be added to both the Public Transport Operations Grant and the Provincial Roads Maintenance Grant

Chapter 2: The fiscal framework
25
Education
It is proposed that in 2017/18, the national School Infrastructure Backlog Grant (indirect grant) be merged with the provincial Education Infrastructure Grant (EIG) for better planning requirements and performance-based financing and monitoring of the EIG. It is still in discussion whether some of the converted funds be ring-fenced within the EIG for addressing infrastructure backlogs at Public Special Schools.
Infrastructure incentive grant reforms
Funding allocations for the Education Infrastructure Grant and the Health Facility Revitalisation Grant are determined based on the consolidated performance scores. National Treasury together with National Departments of Basic Education and Health conducted assessments of provincial infrastructure plans and found that maintenance activities were not always being sufficiently prioritised.
The current constrained fiscal environment will impact on budgets not growing significantly over the MTEF, adding pressure to the concern that the maintenance backlogs remain large and will continue to grow if not properly addressed. This issue is compounded by the fact that new facilities are being constructed but under-utilised due to lack of operational budgets (compensation and equipment budgets).
To elevate the prioritisation of infrastructure maintenance proposals, there is a need to include reforms around the composition of infrastructure funding. This would include relevant operational factors as part of the assessment process and to give precedence to maintenance and related activities in the composition of budgets.
Provincial own receipts
Total provincial own receipts as depicted in Table 2.5 are projected to increase at an annual average growth rate of 1.3 per cent from R2.475 billion in the 2015/16 Adjusted Budget to R2.576 billion in 2018/19.
The Departments of Transport and Public Works (motor vehicle licence fees), Provincial Treasury (gambling taxes), and Health (hospital patient fees) are responsible for the largest own revenue receipts in the Western Cape.
The national School Infrastructure Backlog Grant will be merged with the provincial direct Education Infrastructure Grant

Medium Term Budget Policy Statement 2016 - 2019
26
The increasing trend in the own receipts budget over the 2016 MTEF are due to increases in the budgets of the Department of Transport and Public Works and the Provincial Treasury. The increasing trend over the 2016 MTEF is, however, moderated by a decline in the budget of the Department of Health which was reduced due to the expiration of the agreement with the Global Fund as a donor. Furthermore, the own revenue budgets for the Departments of Community Safety and Cultural Affairs and Sport are projected to fall over the 2016 MTEF due to the ending of the General Budget Support (GBS) funding received from the National Treasury.
Table 2.5 Summary of estimated provincial own receipts by vote
Provincial Department 2015/16 2016/17 2017/18 2018/19
R'000 Adjusted Budget Medium Term Estimate
Department of the Premier 4 416 718 754 798
Provincial Parliament 54 57 60 64
Provincial Treasury 474 856 486 029 493 904 522 550
Community Safety 11 824 14 164 487 515
Education 29 106 30 648 32 180 34 046
Health 476 650 404 400 404 400 427 855
Social Development 915 963 1 011 1 070
Human Settlements 62 760 30 158 22 128 20 098
Environmental Affairs and Development Planning 2 050 2 280 2 500 2 645
Transport and Public Works 1 309 368 1 365 472 1 421 983 1 504 458
Agriculture 28 201 26 659 27 313 28 202
Economic Development and Tourism 33 123 28 715 30 151 31 899
Cultural Affairs and Sport 41 430 45 506 1 581 1 673
Local Government 50 50 53 56
Total 2 474 803 2 435 819 2 438 505 2 575 929
Motor vehicle licence fees
Revenues collected from motor vehicle licence (MVL) fees are projected to increase from a 2015/16 Adjusted Budget of R1.220 billion to R1.406 billion in 2018/19 which represents an average annual growth of 4.8 per cent. In total it is projected that MVL fees will increase by R185.804 million over the 2016 MTEF period. Motor vehicle licence fees as a percentage of total own revenue is expected to increase from 49.3 per cent in the 2015/16 Adjusted Budget to 54.6 per cent in 2018/19.
Motor vehicle licence fee tariffs were increased by an average of 3 per cent over the various vehicle tare categories effective from the 1st of July 2015 which is expected to result in an increase in MVL revenue in 2015/16 and over the 2016 MTEF.
Motor vehicle licence (MVL) fee revenue is expected to increase over the MTEF by an average annual growth rate of 4.8 per cent

Chapter 2: The fiscal framework
27
Health own receipts
The Department of Health’s own receipts are expected to decline from a 2015/16 Adjusted Budget of R476.650 million to R427.855 million in 2018/19 which equates to an average annual growth rate of minus 3.5 per cent. The decline in own revenue over the period is because of the expiration of the agreement with the Global Fund in March 2016 which means that the Department will no longer receive Global Fund donor funding in the future.
Hospital patient fees, which is comprised of medical aid payments, Road Accident Fund payments, payments from individuals and state departments, is expected to increase from R341.188 million in the 2015/16 Adjusted Budget to R360.977 million in 2018/19, which represents an average annual growth rate of 1.9 per cent. Health patient fee tariffs are determined nationally by the Uniform Patient Fees schedule which details how patients are classified. The collection of Road Accident Fund payments have been undergoing a process of decentralisation since 2013 but this process has, however, not yet been concluded.
Casino and horseracing taxes
Casino taxes revenue is expected to increase from R403.594 million in the 2015/16 Adjusted Budget to R441.733 million in 2018/19. The projections of casino tax revenues, which include taxes from the Limited Payout Machines (LPMs), have increased mainly because of the 2 per cent increase in casino taxes across the six taxable bands. Casino and Horseracing tax revenue is projected to contribute about 17.9 per cent to total provincial own revenue over the MTEF.
Interest, dividends and rent on land
R179.595 million in total has been budgeted for over the 2016 MTEF for interest, dividends, and rent on land.
Liquor licence fees
Liquor licence fees are projected to increase by an average annual growth rate of 5.4 per cent over the 2016 MTEF from an Adjusted Budget of R27 million in 2015/16. The Liquor Act is enforced by the Western Cape Liquor Authority which regulates the industry and enforces responsible alcohol use.
Health’s revenues are expected to decline over the medium term due to the exit of the Global Fund
Medium Term Budget Policy Statement 2016 - 2019
28
Table 2.6 Estimated Western Cape own receipts by source 2015/16 - 2018/19
Provincial Department 2015/16 2016/17 2017/18 2018/19
R'000 Adjusted Budget Medium Term Estimates
Tax receipts 1 671 037 1 737 763 1 796 526 1 900 724
Casino taxes 403 594 412 267 417 517 441 733
Motor vehicle licences 1 220 443 1 277 065 1 329 156 1 406 247
Horseracing taxes 20 000 20 000 20 000 21 160
Other taxes (Liquor licence fees) 27 000 28 431 29 853 31 584
Sales of goods and services other than capital assets 498 064 501 523 507 748 536 845
Transfers received 151 948 77 397 19 701 20 844
Fines, penalties and forfeits 3 753 4 085 4 417 4 673
Interest, dividends and rent on land 55 393 57 368 59 576 62 650
Sales of capital assets 21 1 1 1
Financial transactions in assets and liabilities 94 587 57 682 50 536 50 192
Total provincial own receipts 2 474 803 2 435 819 2 438 505 2 575 929
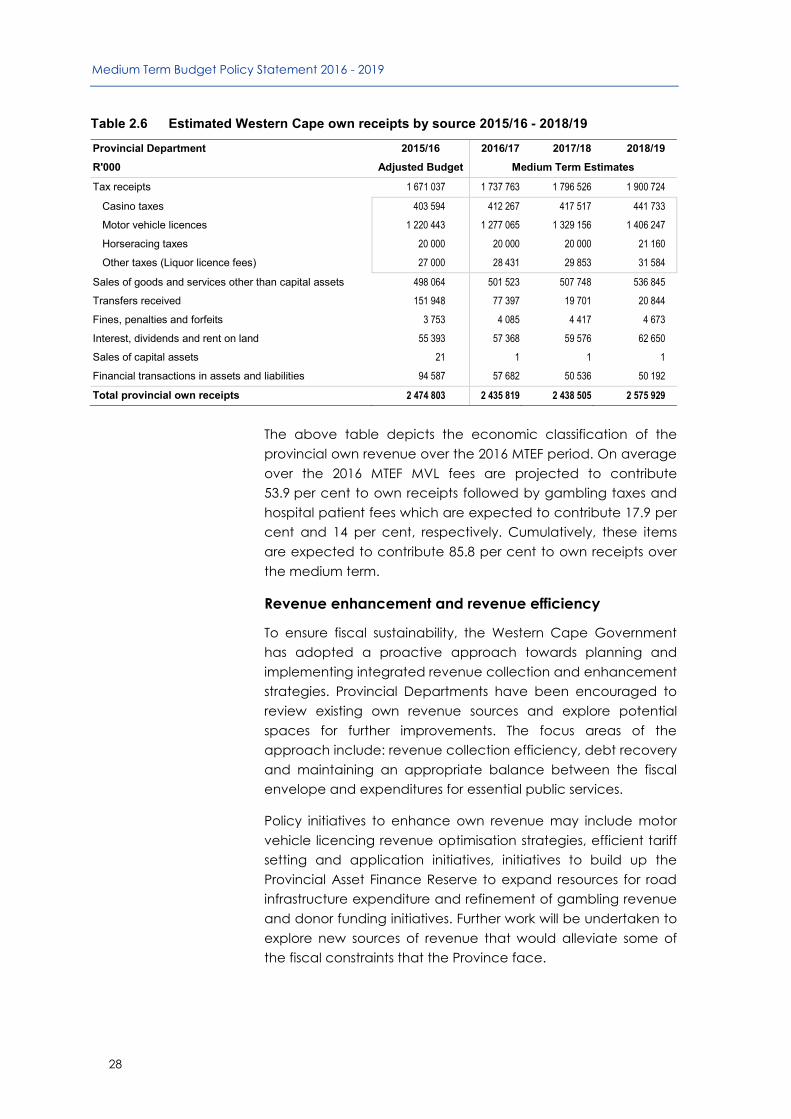
The above table depicts the economic classification of the provincial own revenue over the 2016 MTEF period. On average over the 2016 MTEF MVL fees are projected to contribute 53.9 per cent to own receipts followed by gambling taxes and hospital patient fees which are expected to contribute 17.9 per cent and 14 per cent, respectively. Cumulatively, these items are expected to contribute 85.8 per cent to own receipts over the medium term.
Revenue enhancement and revenue efficiency
To ensure fiscal sustainability, the Western Cape Government has adopted a proactive approach towards planning and implementing integrated revenue collection and enhancement strategies. Provincial Departments have been encouraged to review existing own revenue sources and explore potential spaces for further improvements. The focus areas of the approach include: revenue collection efficiency, debt recovery and maintaining an appropriate balance between the fiscal envelope and expenditures for essential public services.
Policy initiatives to enhance own revenue may include motor vehicle licencing revenue optimisation strategies, efficient tariff setting and application initiatives, initiatives to build up the Provincial Asset Finance Reserve to expand resources for road infrastructure expenditure and refinement of gambling revenue and donor funding initiatives. Further work will be undertaken to explore new sources of revenue that would alleviate some of the fiscal constraints that the Province face.
Chapter 2: The fiscal framework
29
Overall fiscal framework
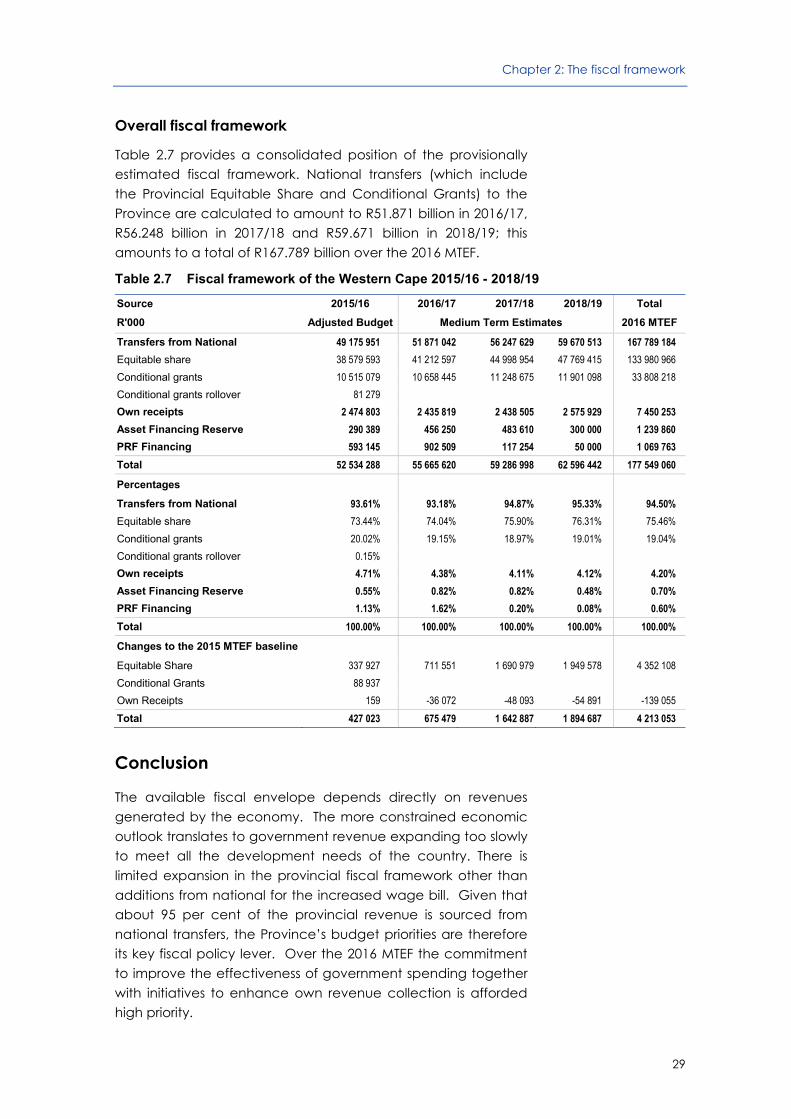
Table 2.7 provides a consolidated position of the provisionally estimated fiscal framework. National transfers (which include the Provincial Equitable Share and Conditional Grants) to the Province are calculated to amount to R51.871 billion in 2016/17, R56.248 billion in 2017/18 and R59.671 billion in 2018/19; this amounts to a total of R167.789 billion over the 2016 MTEF.
Table 2.7 Fiscal framework of the Western Cape 2015/16 - 2018/19
Source 2015/16 2016/17 2017/18 2018/19 Total
R'000 Adjusted Budget Medium Term Estimates 2016 MTEF
Transfers from National 49 175 951 51 871 042 56 247 629 59 670 513 167 789 184
Equitable share 38 579 593 41 212 597 44 998 954 47 769 415 133 980 966
Conditional grants 10 515 079 10 658 445 11 248 675 11 901 098 33 808 218
Conditional grants rollover 81 279
Own receipts 2 474 803 2 435 819 2 438 505 2 575 929 7 450 253
Asset Financing Reserve 290 389 456 250 483 610 300 000 1 239 860
PRF Financing 593 145 902 509 117 254 50 000 1 069 763
Total 52 534 288 55 665 620 59 286 998 62 596 442 177 549 060
Percentages Transfers from National 93.61% 93.18% 94.87% 95.33% 94.50%
Equitable share 73.44% 74.04% 75.90% 76.31% 75.46%
Conditional grants 20.02% 19.15% 18.97% 19.01% 19.04%
Conditional grants rollover 0.15%
Own receipts 4.71% 4.38% 4.11% 4.12% 4.20%
Asset Financing Reserve 0.55% 0.82% 0.82% 0.48% 0.70%
PRF Financing 1.13% 1.62% 0.20% 0.08% 0.60%
Total 100.00% 100.00% 100.00% 100.00% 100.00%
Changes to the 2015 MTEF baseline Equitable Share 337 927 711 551 1 690 979 1 949 578 4 352 108
Conditional Grants 88 937
Own Receipts 159 -36 072 -48 093 -54 891 -139 055
Total 427 023 675 479 1 642 887 1 894 687 4 213 053
Conclusion
The available fiscal envelope depends directly on revenues generated by the economy. The more constrained economic outlook translates to government revenue expanding too slowly to meet all the development needs of the country. There is limited expansion in the provincial fiscal framework other than additions from national for the increased wage bill. Given that about 95 per cent of the provincial revenue is sourced from national transfers, the Province’s budget priorities are therefore its key fiscal policy lever. Over the 2016 MTEF the commitment to improve the effectiveness of government spending together with initiatives to enhance own revenue collection is afforded high priority.

Medium Term Budget Policy Statement 2016 - 2019
30
The main risks to the fiscal outlook include:
Continued slow economic growth with the resultant constrained growth on tax collection will curb growth in the available fiscal envelope and available provincial funding; and
Revisions to national conditional grants that may be lower than the estimated allocations to the Province.
31
3
Budget policy priorities
In summary
The Provincial Strategic Plan’s goals of creating conditions for economic growth, providing better education, and achieving better health, safety and social outcomes are the main budget policy considerations aligned to the National Development Plan.
The financial impact of the higher than anticipated public-sector wage agreement and the weaker economic performance have emerged as key fiscal risks.
The Provincial approach to more integrated planning, budgeting and implementation focuses on a responsive budget which gives effect to policy priorities, the spatial and local context and improvements in service delivery.
The budget policy supports a holistic approach to economic development by protecting essential frontline services whilst supporting economic growth which includes prioritising infrastructure development.
The Policy Context Giving effect to the National Development Plan (NDP), Provincial Strategic Goals (PSGs), and identified game changers to chart a path to change are the main policy considerations informing the provincial medium term budget policy priorities.
The Provincial Strategic Plan (PSP): 2014 - 2019 sets out the Western Cape Government’s (WCG) vision and strategic priorities - together with an action plan to create conditions for economic growth, provide better education, and achieve better health, safety and social outcomes for our residents.
This is underpinned by the “whole-of-society” approach, which means that every organisation, institution, community, family and individual, has a responsibility and a role to play in development. Of course, a capable state must provide the foundation and create the opportunities for them to do so.

Medium Term Budget Policy Statement 2016 - 2019
32
The PSP sets out the WCG’s five Strategic Goals, each backed by a plan to maintain continuous improvement in the lives of residents.
Strategic Goals of the Provincial Strategic Plan
The WCG have selected several priority projects, called “Game Changers”, because they have the potential to be catalysts for substantial improvements in people’s lives. The approach to deliver on the Game Changers include developing roadmaps for each Game Changer; creating a system for performance tracking that draws on data and other sources of information; developing a delivery chain ensuring the implementation of the roadmaps, as well as regular stocktakes, reports and meetings.
Game Changers - key areas for bold, focused interventions
Energy Security: The Energy Security Game Changer is geared toward enhancing the uptake of rooftop PV and Solar Water Heaters, reduce energy usage in public and private buildings, facilitate economic growth through unconstrained by electricity disruptions and essentially diversify the energy mix.
Artisan and Technical Skills: The Artisanal and Technical Skills Changer is positioned to align the demand and supply of labour as it relates to artisan and technical skills. In effect it would focus on addressing the shortage of vocational skills in line with the increasing demand from industry particularly as it relates to the agri-processing, tourism and oil and gas sectors.
After Schools: The goal of the After Schools Game Changer is for 20 per cent (112 600) of no fee learners to have access to quality after school programmes by 2019.

Chapter 3: Budget policy priorities
33
e-Learning: The e-Learning Game Changer aims to create modern classrooms and improve teaching to enhance learning. E-Learning will increase access to ICT in disadvantaged communities, provide support to learners, contribute toward teacher training and professional development, and improve management and administration at schools.
Better Living Model: This Game Changer is to develop a replicable better living model of mixed use, mixed income, mixed tenure, residentially-led development that will address apartheid legacies. It will use the former Conradie Hospital site as the pilot.
Alcohol Harms Reduction: The objective of the Game Changer is to achieve a 30 per cent reduction in alcohol-related motorist fatalities over three years. Community Intervention specifically aims to reduce alcohol related injuries in the high risk areas of Gunya, Khayelitsha and Paarl East through the use of accredited Neighbourhood Watches. Another initiative is around Random Breath Testing as an integrated law enforcement and communication campaign.
Sanitation: This Game Changer addresses informal settlements and the challenges of sanitation. It will pioneer new approaches in support of scaled decent sanitation services.
Broadband: The Western Cape Broadband Initiative (WCBBI) is aimed at laying the groundwork for the investments into broadband infrastructure and programmes and initiates the roll-out of telecommunication infrastructure.
The WCG supports and is in the process of aligning policies and programmes with the priorities set in the NDP and United Nations Sustainable Development Goals (see Annexure). The Sustainable Development Goals (SDGs) builds on the Millennium Development Goals and seeks to complete what the latter did not achieve, particularly in reaching the most vulnerable. Alongside continuing development priorities such as poverty eradication, health, education and food security and nutrition; the SDGs sets out a wide range of economic, social and environmental objectives. New goals reflect the changes in global environment, for example sustainable industrialisation, access to energy, justice and equality. The SDGs have explicitly been developed to be universal in their application therefore applying equally to the developed and developing world.
The United Nation’s Sustainable Development Goals
Goal 1: End Poverty Goal 2: End Hunger
Goal 3: Well-being Goal 4: Quality Education
Goal 5: Gender Equality Goal 6: Water and Sanitation for All
Goal 7: Affordable and Sustainable Energy Goal 8: Decent Work for All
Goal 9: Technology to Benefit All Goal 10: Reduce Inequality
Goal 11: Safe Cities and Communities Goal 12: Responsible Consumption by All
Goal 13: Stop Climate Change Goal 14: Protect the Ocean
Goal 15: Take Care of the Earth Goal 16: Live in Peace
Goal 17: Mechanisms and Partnerships to reach the Goals
Medium Term Budget Policy Statement 2016 - 2019
34
Budget Policy Framework
Two key fiscal risks have emerged that has a significant impact on the current 2015 and future MTEF budgets: the fiscal impact of the higher than anticipated public-sector wage agreement and the weaker economic performance. The national fiscal framework attempts to accommodate these developments to remain on course to achieve government’s objectives. The higher-than-expected 2015 public-sector wage agreement has made it necessary to shift funds from the national contingency reserve to absorb the increased cost; however Provinces are still required to cover a portion through savings and reallocation within budget baselines.
The 2015 National Medium Term Budget Policy Statement highlighted that given the strained economic and fiscal environment, there is little room for new spending priorities over the next three years. However, government proposes to allocate additional resources to core areas of need, including projects that address urgent social priorities such as basic education, health and social protection. Medium-term spending priorities include education and skills development, health, social protection and infrastructure (roads, public transport, housing, water, education and health infrastructure).
Western Cape Budget Policy Principles
The Provincial Budget Policy Framework is premised on and will build on the principles highlighted in the 2015 Budget.
Constitutionalism: The belief system of government, laws and principles according to which a state is governed, controlled or limited by the Constitution.
Rule of Law: Where individuals are guaranteed rights and where independent institutions protect these rights and limit and disperse political power.
Whole-of-Society approach: The whole-of-society approach mobilises resources, knowledge, creativity and concerns of all role-players within given service delivery environments.
Evidence Based: Evidence based practices uses information and knowledge more effectively, methodically and creatively for policy making and policy delivery. It is an approach where evidence takes centre stage in the decision making process through promoting accountability.
Partnerships: Partnerships are about different stakeholders pooling resources for a common goal. The public service thus partners with a variety of role-players including Non-Governmental Organisations (NGOs), Universities, Foundations, Foreign Donors and private business in support of common goals.
Citizen Centric: Following a citizen centric approach focuses on facilitating citizens’ access to government, improving consultation and providing a citizen-centered approach to service delivery.
Public Value: The aim of creating and recognising public value is to be more responsive to and effective in addressing the issues which are most important to the public.
Game Changers: A game changer is a high impact, sharply focussed initiative that tackles an intractable problem or opens up a new opportunity that is important to citizens.
Provincial Strategic Plan: PSP 2014 - 2019 is the Western Cape Government’s 5 year strategic plan.

Chapter 3: Budget policy priorities
35
The budget policy objectives are in support of inclusive growth which captures the importance of structural transformation for economic diversification, socio-economic development and competition. It puts the emphasis on policies that remove constraints to growth and inequality and creates a level playing field for investment and access to opportunity.
The key objective is to continue balancing public finances, and maintain fiscal stability in a tighter economic environment. Therefore the budgets allocated toward essential frontline services need to be protected whilst supporting economic growth. To ensure fiscal stability the shortfalls resulting from the higher than anticipated wage agreements were addressed through allocations largely for the most personnel intensive provincial departments (health - mainly for nurses and doctors and education - mainly for teachers).
Provincial budget policy supports a holistic approach to economic development, which recognises the role of social spending whilst also promoting economic development objectives. Key to boosting economic potential is prioritising infrastructure led growth and supporting infrastructure development.
With the tighter fiscal environment it also becomes more crucial to manage fiscal risks and build up reserves for contingencies and growth enhancing infrastructure development. Speeding up implementation of the NDP and SDGs in the areas specific to Provinces and also the supporting priorities of the Provincial Strategic Plan are key outcomes that the budgets are allocated towards. This approach will also consolidate gains and progress on policy priorities announced in the previous Western Cape Medium Term Budget Policy Statement and 2015 Budget.
Partnering is a key response to budget constraints. It is recognised that government cannot deliver all services effectively and drive change on its own. Much more can be achieved if the energy, resources and mandates of other spheres of government and related agencies and entities, as well as non-governmental role players, are leveraged to assist the WCG fulfil its constitutional and legal mandate. This underpins the WCG’s ‘whole-of-society’ approach to policy-making and implementation.
Balancing public finances and maintaining fiscal stability
Prioritising social spending and economic development objectives
Partnering for development impact is a key response to budget constraints

Medium Term Budget Policy Statement 2016 - 2019
36
This necessitates an increase in partnering behaviour and the formation of partnerships, between departments, with other levels of government, across jurisdictional boundaries, and with non-governmental sectors, i.e. private sector, philanthropy, corporate social investment, civil society and knowledge institutions, in order to achieve the desired socio-economic developmental goals and objectives.
Integrated approach to planning and budgeting
The current fiscally constrained environment has reiterated the need for an integrated approach toward planning and budgeting. This approach focuses on formulating a responsive budget which gives effect to policy priorities, responds to the spatial and local context and improves service delivery while creating maximum socio-economic impact. The provincial planning and budgeting process focuses on resource allocations which drives delivery and creates public value with regard to the achievement of social outcomes and the satisfaction of citizens.
Key elements of a more integrated approach include:
• Ensuring that budgets and plans are aligned to key policy imperatives as outlined in the NDP 2030, OneCape 2040 and the PSP 2014 - 2019;
• Developing a joint planning and budgeting interface between the provincial government and local government (municipalities) within the Western Cape;
• Driving spatial governance and spatial targeting which is in line with the Provincial Spatial Development Plan (PSDF) and the Growth Potential of Towns Study;
• Institutionalising Province-wide Performance Monitoring & Evaluations and Intergovernmental Reporting mechanisms; and
• Identifying and facilitating partnerships and partnering for development impact between key stakeholders.
Chapter 3: Budget policy priorities
37
Towards creating a sustainable fiscal environment - considerations for provincial fiscal policy
In preparation of the Western Cape Medium Term Budget Policy Statement (WC MTBPS), the WC Minister of Finance hosted a Western Cape Fiscal Policy Workshop on 5 November 2015 with the theme of “Creating a sustainable fiscal environment”. As a subnational government is it important to ensure that the WCG’s corporate governance continues to be strengthened through prudent and sustainable resource management, and also that provincial fiscal policy is responsive to the developmental needs of the people of the Western Cape.
To this end the Provincial Treasury’s Fiscal Policy workshop brought together a group of private and public sector economists to share ideas and make recommendations that could be practically factored into the WC MTBPS and 2016 Budget Address.
Provincial fiscal policy plays a key role through its allocations to impact on supply side factors to economic growth (health, education and infrastructure) and also has a distribution impact to reduce poverty and inequality. Given that about 70 per cent of provincial expenditure is allocated towards education and health, one of the recommendations is that the role of provincial fiscal policy should be to find an optimal balance between key “social” and “non-social” spending programmes. Therefore Provinces should explicitly consider inclusive and sustainable economic growth as an important factor for fiscal policy and consider expenditure composition with changing economic conditions.
Medium term provincial budget policy priorities
Provincial Strategic Goal 1: Create opportunities for growth and jobs
Creating opportunities for growth and jobs is the number one priority of the WCG. The Province recognises that without inclusive growth of our business sectors, reducing unemployment will be difficult.
Project Khulisa
Project Khulisa focuses on productive and enabling sectors that contribute to the regions competitive advantage and/or have the potential to be catalytic in growing the economy. Identified sectors include tourism, agri-processing, and oil and gas (rig repair). Five key enablers of growth and job-creation that will also be prioritised include water, energy, broadband, skills and ease of doing business.

Medium Term Budget Policy Statement 2016 - 2019
38
Sector Strategic Intents
Tourism
Boost awareness of the Western Cape in key markets and sectors to drive conversion.
Improve accessibility to Cape Town and the regions.
Boost the attractiveness of the region through competitive product offerings and compelling packaging.
Oil and Gas
Develop suitable infrastructure
Co-develop and coordinate skills development across the sector
Enterprise development
Ease of doing business
Marketing coordination
Agri-processing
Grow the Western Cape's share of the global Halaal market from <1% to 2% by 2025.
Double the value of wine and brandy exports to China and Angola by 2025.
Increase local capacity to process agricultural goods for the domestic and international market.
Green Economy
The focus over the 2016 MTEF is to upscale the themes identified in the Green Economy Strategic Framework, namely smart living and working; smart eco-systems; energy security and efficiency; and resource efficiency. A focus on the green economy themes not only result in massive cost efficiencies for all stakeholders (government included), but will also see improved economic competitiveness and the rise of new industry opportunities.
Additional priorities under the green economy include the Western Cape Industrial Symbiosis Programme, improved waste management practices in municipalities through the waste economy project, water for economic development, 110% Green initiative and the Genius of Place project.
The WCG will also continue with its alien vegetation clearing programme to restore the Berg River system and its Fruitlook project whereby water usage of farmers can be monitored. Pro-active mitigation initiatives, specifically linked to water management (water availability and quality) will receive attention.
The recent drought in the Western Cape has illustrated that the risk of water shortages as a result of global warming is a reality which will significantly change the agricultural landscape in the Province. Other green economy initiatives such as maintenance to the canal system of the Clanwilliam dam, an agricultural climate change response plan for the agricultural
Chapter 3: Budget policy priorities
39
sector called SmartAgri, and the GreenAgri portal, a one stop web-based resource to the benefit of agricultural stakeholders form an integral response by the WCG towards realising the needs of the agricultural sector. The Department of Agriculture will use its head office as an energy efficiency pilot site, a green initiative that could serve as a role model to farmers and agri-businesses.
Nurturing Innovation
Innovation is a strategic enabler in fostering a competitive economy. Over the 2016 MTEF, a joint Innovation and Design Strategic Framework will be developed within the economic cluster departments of the WCG. The main emphasis will be on how to facilitate the application of innovative solutions in order to improve cost efficiency and service delivery. In addition, an innovation support toolkit will be developed to facilitate and support innovation in government, business and communities.
Skills Development
Skills development is also critical for inclusive growth. Initiatives include:
• Coordination through the Provincial Skills Forum (PSF): bringing together the collaborative efforts of a number of stakeholders to close the gap between the supply and demand for skills.
• Vocational Skills: targeting artisan development and vocational skills in strategic sectors such as: Rigging and Ship Repair; Tourism and hospitality; and Agri-processing. Three broad areas of focus had been identified, which include: in-school; in-college and in-work place interventions to encourage a higher uptake of learners and students pursuing and completing vocational studies and careers.
• e-Skills Platform: requires the development of an e-skills ecosystem to increase reach, capacity and accessibility of skills development interventions utilising broadband.
• Work and Skills Programme: provide an excellent opportunity to provide youth with experiential work placement opportunities for a period between 6 and 18 months in industries across the Province with a focus on the hospitality and tourism; agri-processing; and ship and rig repair sectors.
• Other skills development initiatives include built environment related trade programmes and contractor development programmes.
Innovation is a strategic enabler for competitive economy
Targeting artisan development and vocational skills
Medium Term Budget Policy Statement 2016 - 2019
40
Ease of Doing Business
According to the World Bank 2015 study that compares business regulations for domestic firms in 189 countries South Africa is ranked 43. The identified Ease of Doing Business (EDB) programme is a key component in creating opportunities for growth and jobs. Attention will be placed on improving both the legislative and process components of services (e.g. EIAs, agricultural services) offered to business. As a cross-cutting transversal enabler, this intervention draws its agenda for action from the three priority sectors (i.e. tourism, oil and gas and agri-processing), other strategic priorities (e.g. land reform) and game changers (e.g. Skills, Energy for growth).
The completion of various studies regarding, firstly, the cost of doing business in the three priority sectors, secondly, an analysis of the provincial business-facing services and, thirdly, an analysis of local government business-facing services, will serve as the basis in implementing projects that will lead to an improved business regulatory environment.
Initiatives to improve the local and district business regulatory environments include:
• Partnering with the City of Cape Town in improving its standing as per the World Bank’s Doing Business index;
• Improvement of land assembly processes and land use;
• Working with municipalities to improve their business-facing services (e.g. building plan approval and business licencing);
• Working in partnership with business chambers (e.g. Afrikaanse Handelsinstituut (AHI)) in moving business and government closer to each other on a local and district level; and
• Working with the key stakeholders in easing the landing of projects driven by tourism, agri-processing and oil and gas.
Agriculture
Land reform remains a core priority to the Province as well as the NDP. The WCG envisages improving on its land reform success rate from 62 to 70 per cent. A new initiative that will assist in the improvement of land reform success includes the establishment of a new Land Reform Advisory Desk (LREAD) at the Cape Agency for Sustainable Integrated Development in Rural Areas (Casidra), which will provide planning support to
Ease of Doing Business an enabler for economic development
Establishment of a Land Reform Advisory Desk
Chapter 3: Budget policy priorities
41
farmers, businesses, municipalities and land owners as far as land reform initiatives is concerned.
Other new initiatives that will promote transformation in the Agricultural sector includes a land audit, developing a baseline for Agri BEE status in the Western Cape, to devise and implement a wine transformation programme and ensuring access for emerging farmers to agri parks.
Agricultural education is at a critical apex, and the demands of students at tertiary institutions highlighted the need for quality education within the context of transformation and the drive for sustainable jobs. The Elsenburg Agricultural Training Institute is well-positioned to respond, and a detailed transformation plan at all levels will guide the implementation to remain relevant and appropriate within the education and training environment.
Provincial Strategic Goal 2: Improve education outcomes and opportunities for youth development
A commitment to improve education outcomes is at the centre of the WCG’s agenda for government.
The main goals of the Western Cape Education Department are to improve the level of language and mathematics in all schools; increase the number and quality of passes in the National Senior Certificate; and increase the quality of education provision in poorer communities.
Key focus areas over the 2016 MTEF include:
• The implementation of the Curriculum and School Management strategies, in particular the Mathematics, Language and Teacher Development strategies;
• The development and implementation of School Improvement Plans (SIPs), focused on quality teaching time, the management of resources and reducing teacher and learner absenteeism;
• Providing and monitoring the use of textbooks, furniture and equipment;
• Strengthened systems for the management and use of Learning and Teaching Support Material both at school and district level;
• Increasing awareness of and support library access and usage;

Medium Term Budget Policy Statement 2016 - 2019
42
• A High School programme in support of the learning needs of those who most need help;
• Focus on repeater rates in all grades, especially in Grades 1 and 9, with interventions to reduce these;
• Implementation of the e-learning strategy;
• Support of poor learners and to broaden access and excellence through Conditional Grants for the strengthening of results in Mathematics and Physical Science, the National School Nutrition Programme, the HIV and AIDS programme and two infrastructure grants;
• Train principals of schools on financial management and recruitment and selection of staff;
• Provide a range of specific care and support services to schools affected by crime and violence through the Safe Schools Call Centre operators, district based Safe Schools Coordinators and fieldworkers; and
• Joint planning with municipalities and other government departments.
One of the more significant developments for 2014 was the expansion of the no fee school programme. About 216 schools, with 172 541 learners, in Quintiles 4 and 5, became “No Fee” schools, through applying for no-fee status.
The pro-poor emphasis in the WCED will be pronounced, albeit in a financially-constrained context. An optimal environment for teaching and learning will be provided and managed through infrastructure, fee relief, resourcing and transport plans. Planning and projections are informed by enrolment and population trends and data analytics. The purpose of all interventions is to provide the best possible education foundations and opportunities for all.
Early Childhood Development
Early Childhood Development (ECD) will be strengthened through a pilot project in 100 Pre-Grade R sites. The focus of the special ECD programme is to improve school readiness of a cohort of children aged 4 - 5 years at 100 sites in the Western Cape where school readiness is currently poor, specifically in areas of literacy and numeracy. The programme also aims to improve language acquisition to enable the children to cope better at school. This includes support systems for parents of children to better equip them to stimulate the same learning within the home in order to reinforce the learning happening
ECD will be strengthened

Chapter 3: Budget policy priorities
43
within the centres/playgroups and a monitoring system to track impact on school readiness.
A provincial Living Lab project for improved Language and Mathematics in 100 schools for Grades R – 3 will concentrate on providing structured and focused support for improved learning in the Foundation Phase. The focus will be on materials, use of materials and on teacher skills, parental involvement and tracking progress by means of norms for reading, writing and mathematics in each quarter.
Youth programmes
The Provincial Youth Development Strategy focus is on youth not in education, employment or training (NEETs). Youth programmes currently underway which will continue over the 2016 MTEF include the National Youth Service programme; road safety education and awareness at schools; Youth Cafés; the Youth Safety Work Programme; the Youth Safety and Religion Programme; and the Chrysalis and Wolwekloof youth training programme.
After school programme
The Mass participation, Opportunity and access Development and growth (MOD) Programme is an after-school, mass participation programme where school-going learners participate in after-school activities at MOD Centres. This creates a safe space and environment for participation in fun-filled activities, play, recreation, sport, arts, culture, as well as academic activities on a daily basis.
There are currently 181 MOD Centres based at primary and high schools in the Western Cape. Given that MOD Centres are located in historically disadvantaged and underserved areas, complementary programmes in support of the MOD Centres include the provision of meals to school children at the Centres as well as after school partial care facilities. Through various talent identification and talent development processes, the participants that display potential for further development have the opportunity to advance their skills and talents to another level. The MOD Programme will also focus on improvement in participation in after school activities.
Implementation of the Provincial Youth Development Strategy
MOD Centres will create a safe space and environment for participation in fun-filled after-school activities

Medium Term Budget Policy Statement 2016 - 2019
44
Provincial Strategic Goal 3: Increase wellness, safety and tackling social ills
The focus on ‘wellness’ has highlighted the social determinants of health and the imperatives of addressing the upstream risk factors such as poverty, unemployment and overcrowding. Inter-sectoral interventions targeting upstream risk factors include initiatives to reduce the harms from alcohol abuse, the 1 000 days project, the Western Cape on Wellness (WoW) project and the integrated service delivery model in Drakenstein.
Inter-sectoral projects to improve wellness
• First 1 000 Days
The design and implementation of a campaign that raises awareness and facilitates action at a community and service provision level concerning the first 1 000 days of a child’s life (from conception to two years of age) that is the most critical period to his/her health, development and chances of success in later life. Key messages with related actions by parents/main carers and service providers will be determined, using a transversal and multi-sectoral approach. The campaign will also promote the important role of men as caring, engaged fathers, supportive partners and carers.
• Western Cape on Wellness (WoW!)
WoW is a partnership approach to prevent and reduce the burden of Non Communicable Diseases, including obesity, through enabling, promoting and activating increased physical activity, healthy eating and a healthy weight. Using a settings-based design; engaging worksites, schools and communities; the overarching aim is to co-create and expand a culture of wellness in the Western Cape.
• Integrated Service Delivery Model
Partnerships among the WCG include Local Government, NPOs and CBOs to create an optimally integrated service delivery model in Drakenstein that we can hopefully replicate in the rest of the Province over time.
From a health sector perspective, the provincial health system’s capability for prevention and health promotion will need to be enhanced in response to the increasing burden of chronic diseases (e.g. HIV, AIDS, TB, CDL, etc.). Early identification and the prevention of secondary complications are central to success in preventing and managing chronic health problems. The Province will therefore continue to invest in further capacitating primary health care services to address these challenges.
The rising phenomena of people presenting at health facilities with multiple morbidities adds further complexity and intensifies the strain on the provincial health system. Patients with multi-morbidity are generally more complex and expensive to diagnose and treat, stay longer in hospitals and have a poorer prognosis. This situation requires greater continuity in health care provisioning and for it to become increasingly integrated to ensure person centredness.
Further capacitating primary health care services
Chapter 3: Budget policy priorities
45
Persons with disabilities
The Province will over the next three years continue with the promotion of the rights, well-being and socio-economic empowerment of Persons with Disabilities and their families or caregivers in promoting redress and rectifying the gaps in the disability sector. Provision has been made for increases to protective workshops and residential care facilities for people with disabilities, expansion in day care for children and adults with disabilities, special care centres for children with intellectual disabilities and specialised support services to people with disabilities. To further strengthen support for the disability sector, a help desk for persons with disabilities has been established and is operational, referral pathways for children and youth with disabilities that will improve the efficiency of services as well as the establishment of a residential facility in Maitland that can accommodate 30 persons with dual diagnosis and intellectual disability.
Children and Older Persons
Plans in response to the older person’s population increase in the Province as well as the implementation of the Older Person’s Act include increasing the provision of funding for service centres, independent and assisted living facilities and residential care facilities.
Key social development priorities are the improvement of child care and protection services as legislated by the Children’s Act and Child Justice Act; substance abuse interventions; victim support; shelters for homeless adults, especially women and children and including, special accommodation for victims of human trafficking; probation services and diversion programmes.
Increasing Safety
The Provincial Community Safety Improvement Partnership (CSIP) is a response to give effect to national and provincial policy directives adopting the “whole-of-society” approach. The key basic priorities of the CSIP are to Promote Professional Policing (PPP), Promote Safety Partnership and Secure Public Spaces.
The CSIP aims, by means of a formal process of joint planning, to; clarify roles and responsibilities, initiate various projects with shared objectives and measurable targets between the main role-players within the field of safety namely the South African Police Service (SAPS), the Municipality, the Community Police
Strengthen support services to people with disabilities
Medium Term Budget Policy Statement 2016 - 2019
46
Forums, the Neighbourhood Watch structures, the Department of Community Safety and other safety partners.
The CSIP planning is done through the Policing Needs and Priorities process which shall culminate in the drafting of a local safety plan, as well as a process aimed at the signing of a Memorandum of Understanding with the CSIP policing clusters and individual municipalities.
Transport safety is a high priority for the WCG and projects include the public transport safety implementation programme, safely home projects, traffic law enforcement training and public transport law enforcement.
Arts and Culture
Arts and Culture plays a key strategic role in alleviating social ills in communities as well as promoting economic development. Museums and heritage play a particular role in the social and economic identity of the Province. Toward this end, the Cape Town Museum will house historic collections to preserve and promote the unique heritage of our province. The Museum will be located in the old Standard Bank building in Adderley Street.
In addition, the use of EPWP opportunities have been expanded to include the arts, culture, language, museums and heritage sectors where beneficiaries gain training opportunities, attend accredited courses in Tourism Guiding, Arts and Culture Management at Community Level, and Theatre Lighting and Sound.
Provincial Strategic Goal 4: Enable resilient, quality, sustainable and inclusive living environment
Integrated human settlements
Human Settlements priorities include:
• Upgrading informal settlements to improve the living conditions of many people in informal settlements and in backyards who continue to wait for housing;
• Prioritising the most deserving people like over 40s, the elderly, disabled, and child headed households in the allocation of Breaking New Ground (BNG) opportunities;
• Increasing affordable housing opportunities to provide shelter for people that earn too much, excluding them from qualifying for free subsidised housing, and earn too little to qualify for bonds. The Department of Human Settlements has embarked on partnerships on public private
Provincial Community Safety Improvement Partnership for safer communities
Cape Town museum will house historic collections
Upgrading Informal Settlements to improve living conditions
Chapter 3: Budget policy priorities
47
partnerships with financial institutions, developers and private sector to unlock this market; and
• Promoting security of tenure through the transfer of title deeds to beneficiaries.
Spatial and development planning
The aim of the Provincial Spatial Development Framework (PSDF) is to give spatial expression to the NDP and OneCape 2040. The PSDF advocates the sustainable use of our Provincial spatial assets through managing and protecting our biodiversity and ecosystems, safeguarding our coastal and inland water and managing our use of water. These assets also hold immense socio-economic development potential. Equitable access to services and opportunities a keystone to building a strong regional economy.
Provincial Spatial Development Framework principles
• CAPITALISE and build on the Western Cape comparative strengths (e.g. gateway status, knowledge economy, lifestyle offering) and leverage the sustainable use of its unique spatial assets.
• CONSOLIDATE existing and emerging regional economic nodes as they offer the best prospects to generate jobs and stimulate innovation.
• CONNECT urban and rural markets and consumers, fragmented settlements and critical biodiversity areas (i.e. freight logistics, public transport, broadband, priority climate change ecological corridors, etc.).
• CLUSTER economic infrastructure and facilities along public transport routes (to maximise the coverage of these public investments) and respond to unique regional identities within the Western Cape.
The PSDF is being unpacked through regional planning initiatives which facilitate the coordination, integration and alignment of Provincial and Municipal land use planning policy and to address specific economic, social, natural or unique features in a specific area. The regional plans will also have a strong emphasis on creating cross-sectoral implementation and delivery frameworks. Three functional region plans will be developed over the 2016 MTEF period – the Cape Metro Region, Saldanha Bay/West Coast Region and George/Mossel Bay Region.
Municipal planning support initiatives need to be strengthened further through the continuation of the Built Environment Support Programme (BESP) that specifically supports partner municipalities in updating and strengthening their Spatial Development Frameworks (SDFs) and Human Settlement Plans (HSPs).
Regional plans emphasising cross-sectoral implementation and delivery
Medium Term Budget Policy Statement 2016 - 2019
48
Resource use efficiency and sustainability
The Western Cape State of the Environment Outlook Report (2013) indicated that in terms of our natural systems, land, inland water, biodiversity, and oceans and coasts are under significant pressure. Climate change also poses significant bio-physical and economic risks to the Province. The mainstreaming of sustainability, resource-use efficiency and climate change response into Provincial and Municipal planning and programmes is therefore a strategic priority.
The investment in enhancing fire-fighting capacity in the Province resulted in the improvement in the ability to extinguish wildland fires. However, the state of many fire services within the Province, especially outside the metropolitan areas is a matter of increasing concern. Investment in certain areas has been almost non-existent. The dire financial situation of most district municipalities has resulted in old and obsolete equipment not being replaced. The 2016 MTEF will allocate additional resources to expand fire-fighting capacity across the Province, Climate Change initiatives and disaster prevention. Key areas include management of wildfires at CapeNature; climate change mitigation projects for agriculture to assist with drought, water and food security; as well as hazardous material response/capacity along major routes, and fire-fighting capacity.
Some of the key interventions over the next three years for sustainable resource use include:
• Expanding the Berg River Improvement Plan methodology to the Breede and Olifants/Doorn Rivers catchment areas;
• Waste management programmes in support of the municipalities;
• Driving Sustainable Public Procurement (also links to the Green Economy);
• Municipal support on climate change and other sustainability interventions, including human settlements and other infrastructure (e.g. Sustainable Settlement Feasibility Study); and
• Increasing the number of Air Quality Monitoring Stations from the current 11 stations distributed across the Province.

Chapter 3: Budget policy priorities
49
Strategies to ensure that the economy and social delivery are supported through effective and appropriate management of freshwater, terrestrial, coastal and estuarine biodiversity, and the ecosystem goods and services it provides to communities. Two key priorities for biodiversity management in the 2016 MTEF period are to finalise a Provincial Biodiversity Strategy and Action Plan by 31 March 2016 and to continue with Biodiversity Law Reform.
Regional Socio-economic Project/Violence Prevention through Urban Upgrading project
The practical application of the development planning and integrated service delivery, with the aim of achieving planning led budgeting and spatial targeting, will continue to be implemented through the Regional Socio-Economic Projects (RSEP) and the Violence Prevention through Urban Upgrading (VPUU) Programme during the 2016 MTEF period. The main goal of the programme is to partner with active citizens to plan and implement upgrading and safety projects in poor neighbourhoods in the Province. Entering its second year of implementation, this Programme represents the combination of the WCG’s RSEP/VPUU Programme.
The RSEP/VPUU Programme is being implemented in towns with high socio-economic needs. The Programme is based on the successes achieved through the City of Cape Town’s VPUU programme in Khayelitsha since 2005. Through joint funding from the German Development Bank (KfW) and the WCG, the Programme is being piloted in five partner municipalities, namely Saldanha Bay, Swartland, Breede Valley, Drakenstein and Theewaterskloof, together with a Phase 4 in the City of Cape Town.
Provincial Strategic Goal 5: Embedding good governance and integrated service delivery
Implementation of Broadband
The Western Cape’s broadband strategy and implementation plan is regarded as an enabling game changer for the Province. It is aligned to the NDP through the development of a dynamic and connected information society and a vibrant knowledge economy that is more inclusive. This initiative will contribute to making high-speed broadband internet available to various stakeholders. It is also aligned to the national government’s South Africa Connect initiative which plans to improve broadband penetration across the country.
Effective management of biodiversity and ecosystems
High speed broadband internet availability

Medium Term Budget Policy Statement 2016 - 2019
50
Broadband is to be implemented through 4 streams:
• Stream 1 is responsible for driving Broadband infrastructure provision to the WCG. This will ensure that a scalable high bandwidth network connects all provincial government buildings (including schools) and that this infrastructure can be leveraged to support the socio-economic goals of the WCG.
• Stream 2 is responsible for ensuring that the Economic/Value Added Stream (VAS) goals of the WCG continue to take place. The major focus of Broadband Stream 2 is therefore to ensure leadership coordination and support; improving broadband access, readiness and up-take for connected citizens; and improving the competitiveness for connected business.”
• Stream 3 is an application development stream. This stream includes supportive systems, processes and other applications to run on the broadband infrastructure in order to maximise utilisation and thereby improve the efficiency and effectiveness of the provincial government.
• Stream 4 consists of sector-specific initiatives, such as e-Education, which will leverage off the three streams as highlighted above and contribute to the outcomes contained in the Provincial Strategic Plan.
ICAN
An ICAN centre is a physical facility containing various focussed interactive zones, which include separate areas for learning, quiet study zones; create zones and gaming zones. The primary goal of an ICAN centre is to improve community accessibility, readiness and usage of broadband. Additionally, it is envisaged that via the use of Broadband connectivity, community members will acquire the skills to assist them to find employment, aid entrepreneurs in building businesses and assist students on their academic path. To this end, the ICAN centre project is envisaged to facilitate socio-economic inclusion, the closing of the digital divide; and the creation of opportunities for all the citizens of the Western Cape.
Rural Library connectivity project
The Rural Library Connectivity Project provides internet access to rural communities in the Province. This forms part of the wider Broadband Initiative of the WCG, which the provincial Library Service is taking part in.

Chapter 3: Budget policy priorities
51
Expansion of Cape Access Centres
The establishment of twelve Cape Access Centres is envisaged for 2016/17. The purpose of these centres is to provide access to ICTs and training to citizens in rural areas. The programme provides poorer and disadvantaged communities with access to government services and products. It contributes to optimisation of service delivery.
Implementation of Biz Systems
An integrated province-wide Monitoring and Evaluation automated solution (BizSuite) is being developed and will be rolled out in the WCG. A central repository for local government data and municipal performance information will be created. A Transversal Spatial Intelligence System will be developed to inform policy development and planning. Municipal spatial intelligence capacity building and empowerment and support initiatives will be undertaken with municipalities.
Strengthening financial governance
Good governance is a key pillar of a capable state. Focused initiatives include improving financial sustainability and financial governance. Effective public spending by government and by implication government procurement is a strategic policy lever for achieving economic development and governance objectives. Initiatives to strengthening supply chain management (including procurement planning, strategic sourcing and contract management) will continue over the 2016 MTEF.
Provincial support to local government through the Financial Management Support Grant aims to strengthen financial management within municipalities.
Supporting local government
Increasingly municipalities are faced with the challenge of having to deliver basic services to the ever growing population of the Province. The local government legislative landscape is changing, thus putting pressure on municipalities to comply with various governance-related issues. Support will be provided to municipalities in delivering services to the communities they serve while also assisting with governance related issues. This will include efforts to review or introduce various best practice governance models, which will include ward committee, ICT governance, public participation models in municipalities.
Providing access to ICTs and training to citizens
Improving financial sustainability and financial governance
Strengthening supply chain management
Medium Term Budget Policy Statement 2016 - 2019
52
Whilst the Province is doing well in terms of access to basic services as reported by Statistics South Africa over the years, the pressure to meet the present demand for satisfactory levels of service is increasing. Municipalities face an even more difficult task in preparing to meet future demand for basic infrastructure and services. Each district in the Province is supported to develop bulk water and sanitation master plans. These plans are 15 year investment plans that indicate the demand for infrastructure now and in the next 15 years. The priority will be to review the plans to ensure that they still respond to the changing demands of the communities. The development of asset management plans is vital in assisting municipalities with their infrastructure planning and maintenance.
Conclusion
Departments are generally under pressure to fully deliver on some of their service delivery requirements, given the current fiscal framework. The current fiscal environment has necessitated departments needing to consider trade-offs in allocation and reallocation of resources.
Resources will be channeled to core areas of need, including projects that address urgent social priorities and initiatives that facilitate inclusive economic growth. As such a significant proportion of the medium term budget will continue to be allocated toward education, health, social service and infrastructure.
Develop bulk water and sanitation master plans

53
4
Infrastructure
In summary
Infrastructure budgets grow from R5.4 billion in 2012/13 to R7.6 billion in 2017/18, with a shift in focus towards investment in the maintenance, refurbishment and renewal of ageing infrastructure.
Investment in maintenance is set to grow over the 2016 MTEF period.
Departments are planning in accordance with the strategies and policy frameworks of the WCG, most notably the Provincial Spatial Development Framework; whilst maintaining fiscal discipline and engendering efficiencies in the delivery of infrastructure.
Overview
The Western Cape Government (WCG) has identified infrastructure development as a core component of its agenda to transform the economy, bring about spatial transformation and stimulate economic growth and job creation. Infrastructure investment remains a pivotal enabler of socio-economic development.
Public sector infrastructure delivery is a complex and multi-faceted operation. The effective and efficient delivery of public sector infrastructure programmes and projects can only be assured if it is preceded by rigorous planning processes underpinned by a comprehensive set of legislative, policy, planning and implementation documents. The Western Cape Government’s capacity to select, plan, appraise and build projects of an infrastructural nature will continue to be strengthened over the 2016 MTEF.
Improving capital budgeting and performance
The WCG has made a large contribution to investment growth over the last 4 years.
Over the period ahead, there will be a strong focus on building partnerships to boost inclusive growth and job creation.
Infrastructure development is a core component to transform the economy
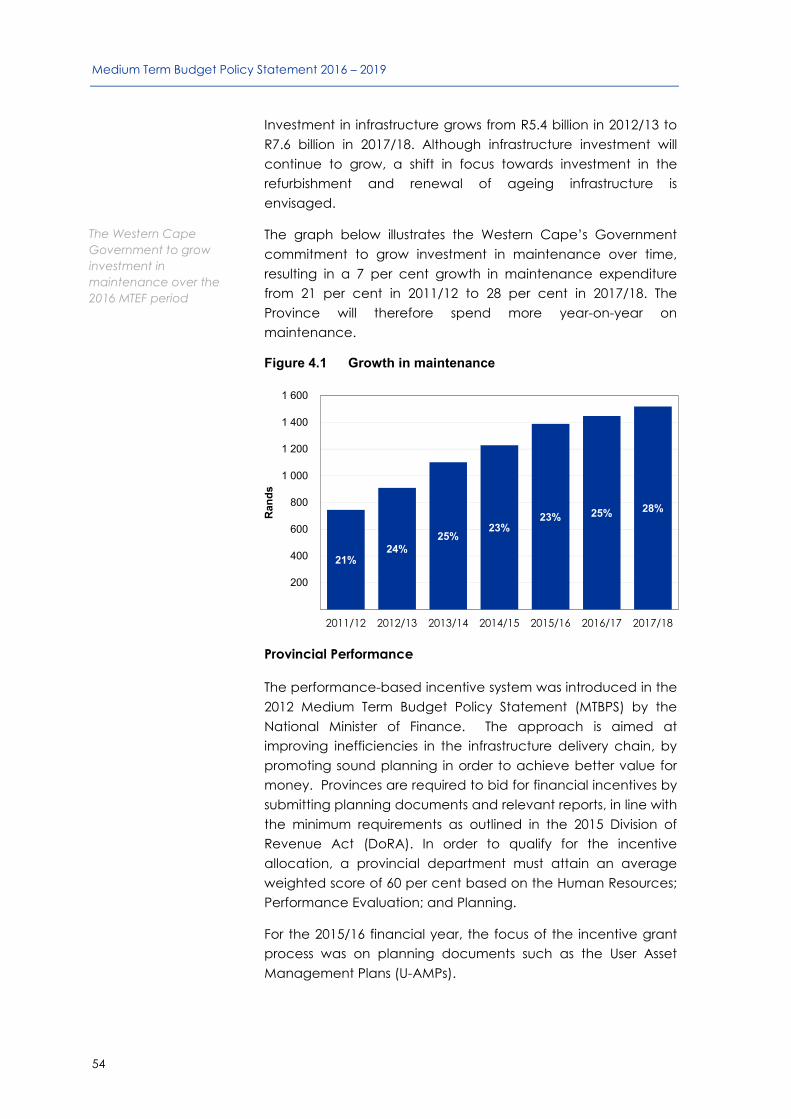
Medium Term Budget Policy Statement 2016 – 2019
54
Investment in infrastructure grows from R5.4 billion in 2012/13 to R7.6 billion in 2017/18. Although infrastructure investment will continue to grow, a shift in focus towards investment in the refurbishment and renewal of ageing infrastructure is envisaged.
The graph below illustrates the Western Cape’s Government commitment to grow investment in maintenance over time, resulting in a 7 per cent growth in maintenance expenditure from 21 per cent in 2011/12 to 28 per cent in 2017/18. The Province will therefore spend more year-on-year on maintenance.
Figure 4.1 Growth in maintenance
Provincial Performance
The performance-based incentive system was introduced in the 2012 Medium Term Budget Policy Statement (MTBPS) by the National Minister of Finance. The approach is aimed at improving inefficiencies in the infrastructure delivery chain, by promoting sound planning in order to achieve better value for money. Provinces are required to bid for financial incentives by submitting planning documents and relevant reports, in line with the minimum requirements as outlined in the 2015 Division of Revenue Act (DoRA). In order to qualify for the incentive allocation, a provincial department must attain an average weighted score of 60 per cent based on the Human Resources; Performance Evaluation; and Planning.
For the 2015/16 financial year, the focus of the incentive grant process was on planning documents such as the User Asset Management Plans (U-AMPs).
21%24%
25%23%
23% 25% 28%
200
400
600
800
1 000
1 200
1 400
1 600
2011/12 2012/13 2013/14 2014/15 2015/16 2016/17 2017/18
Ran
ds
The Western Cape Government to grow investment in maintenance over the 2016 MTEF period

Chapter 4: Infrastructure
55
For the 2016/17 financial year, the focus is still on the U-AMP, however, more emphasis will be placed on broader planning documents such as the Infrastructure Programme Management Plans (IPMPs); the Construction Procurement Strategy (CPS); the End of Year Conditional Grant Evaluation Reports and the Quarterly Human Resource Capacity Reports as submitted by the Departments of Health and Education.
The Western Cape has already made significant strides towards fulfilling the requirements set out by the National Treasury to qualify for such an incentive.
With the assistance of the National Treasury, through its Infrastructure Delivery Improvement Programme, the Province is benefitting from the deployment of technical assistance and training in planning, procurement and management systems for the provincial departments as well as oversight functions in the provincial treasury.
Infrastructure Delivery Management System (IDMS)
The Western Cape Infrastructure Delivery Management System (WCIDMS) is designed to be linked to multi-year budgeting with a strong focus on outcomes, value for money and the effective and efficient functioning of the entire value chain of infrastructure delivery. The Infrastructure Delivery Management Committee (IDMC) drives the promotion of increased openness, transparency, trust and collaboration between Provincial Treasury and all relevant role-players in the infrastructure delivery value chain.
An IDMS–enriched public sector is characterised by a standardised and uniform approach to infrastructure delivery; supporting effective and efficient delivery; stronger public institutions through the appointment of appropriate personnel in infrastructure; using the IDMS human resources capacitation framework; improved infrastructure planning, budgeting, management, operations and management; adherence to relevant legislation; better infrastructure procurement; enhaced intergovernmental relations; and improved reporting, monitoring and evaluation.
Medium-term spending priorities
Government continues to invest in public infrastructure and housing. A Ministerial Infrastructure Committee headed by the Provincial Minister of Finance will meet on a quarterly basis to exercise oversight over the implementation of infrastructure projects in the Province. Medium term budget allocations estimated at R23.3 billion include:
• R8.9 billion in roads and public transport;
• R6.2 billion in public housing;
• R2 billion in general buildings;
• R3.9 billion in school buildings;
• R91 million for tourism facilities; and
• R2.2 billion in health facilities and equipment.

Medium Term Budget Policy Statement 2016 – 2019
56
Education
The Education Action Plan 2019, incorporating the theme towards Schooling 2030, guides education infrastructure planning and outlines the first steps to be taken in realising the longer term 2030 vision. While there are still challenges in education infrastructure in poorer areas, greater emphasis will be placed on maintenance.
The key strategic shift on maintenance, which was initiated in the past two years, will be sustained, hence the number of new schools will be reduced during the current MTEF. The focus over the MTEF will be on the replacement of schools built of inappropriate materials and other infrastructure.
The following infrastructure projects will be embarked on over the medium term:
• 15 new secondary schools
• 13 new primary schools
• Scheduled maintenance at 185 schools
• 19 replacement primary schools
• 2 Special Schools
• 66 Grade R classrooms at 33 primary schools
• 2 replacement secondary schools
• 1 replacement classroom project
Health
A key objective for this sector is to ensure the optimal delivery of provincial health infrastructure facilities. Healthcare 2030, as the overarching strategy, highlights a shift in the long term strategy to increase wellness by improving the quality of health services.
The 2030 State of Environment Outlook Report confirms the significant population growth towards urbanisation and as a result places pressure on the Health facilities and planning of infrastructure. However, planning for new facilities and investment in existing facilities is underpinned by the Forward Planning 2032 study which aims to improve access and capacity of existing facilities, as well as forecasted demand. The findings of this study are evident of being incorporated over the MTEF, with investment being directed to the replacement of Community Day Centres, hospitals, ambulance stations and the construction of new facilities.

Chapter 4: Infrastructure
57
The following priority areas for the 2016 MTEF have been identified:
• To complete the feasibility study phase of the Tygerberg Hospital redevelopment project;
• To develop and implement a Health Technology strategy and standard equipment list per facility type;
• To strengthen and improve the primary health care infrastructure and medical equipment in all Geographic Service Areas (GSAs);
• To modernise emergency centres at hospitals;
• To provide/upgrade acute psychiatric units at hospitals; and
• To focus on maintenance and fire compliance of existing health facilities.
Transport
The WCG continues to work towards the delivery of safe and integrated transport systems that facilitate economic opportunity and also connect communities to places of work and improve access to social services. In this regard, the government is cognisant of the fact that an improved public transport system means an improvement of all modes of transport with the ultimate goal of making public transport more attractive and ensuring a modal split between private and public transport where public transport is the mode of choice.
Roads Infrastructure is considered to be a key prerequisite for social and economic development and is of vital importance to increase provincial economic performance. An efficient roads system gives the Province a competitive edge in moving goods economically and also helps attain an efficient distribution of population, industry and income.
Roads projects that are of strategic importance in the Province and aligned to the areas identified for high economic growth potential are:
• Borcherds Quarry Interchange on the N2 – This includes constructing the interchange on the Borcherds Quarry Road and extending the 3rd lane on TR2/1 to NR020. The rehabilitation and upgrade of TR2/1 from 13.8 km to 20.5 km between the Borcherds Quarry and Swartklip interchange is under construction.
Roads Infrastructure key for social and economic development
Medium Term Budget Policy Statement 2016 – 2019
58
• N1/N7 upgrade – This includes the upgrade of the Wingfield interchange and bridges on N1 and N7. The project is currently in design phase.
• An addition of a 3rd lane to the N1 at Durban Road Interchange – This project intends extending the 3rd lane on TR09/1 west of Durban Road interchange to the NR0101. The project is currently in tender phase.
• Extensions to the road network in support of the Saldanha Bay Industrial Development Zone – This includes Road Network Improvements in support of the SBIDZ (Extension of MR 559 and Port Access). The project is currently in design phase.
Apart from its focus on leveraging high growth areas, the WCG has also commenced with the development of a Provincial Public Transport Institutional Framework (PPTIF) to incrementally implement public transport within the rural context. Within this Framework the public transport environment is contextualised and an implementation response developed. The PPTIF is a strategic project which aims to address the barriers to improved public and non-motorised transport in the non-Metro areas of the Western Cape and drive improvement in partnership with local government. The implementation of the PPTIF will be focused on potential growth areas in support of industrial development.
The continued roll-out and management of the George Integrated Public Transport Network (GIPTN) is one of the key transport projects of the WCG. The GIPTN project is a joint initiative between the Western Cape Government and the George Municipality to transform public transport in George through the introduction of a high quality, scheduled bus system owned and operated by former minibus taxi operators and employees - the lessons learnt from this project will assist the Western Cape Government in the formulation of appropriate policy interventions.
Public Works
The WCG purpose is to provide a balanced provincial government building infrastructure that promotes integration, accessibility, sustainability, equity, environmental sensitivity, economic growth and social empowerment. Preservation of the immovable asset portfolio for future generations and to ensure the best use of the assets that would enhance service delivery in an efficient, effective and economical manner is a
Continued roll-out and management of the George Integrated Public Transport Network
Chapter 4: Infrastructure
59
critical objective. Infrastructure projects related to planning, additions, renovations, refurbishments and maintenance of general building infrastructure will continue.
Key strategic initiatives/projects pertaining to the Provincial Property Portfolio are as follows:
Cape Town Central City Regeneration Programme
Work will continue on the six selected Cape Town Central City Regeneration Programme projects identified in the 2015 - 2018 Western Cape Medium Term Budget Policy Statement. The WCG through this programme leverage its provincial assets to achieve the socio-economic objectives of the Province and achieve greater levels of efficiency.
Office Accommodation Modernisation Programme
Efforts to optimise office space utilisation across the Province will continue in the form of the Modernisation Programme, which aims to align office space allocations with the latest national norms and standards and to develop effective and efficient workplace environments that contribute positively to staff performance and productivity. This Programme is expected to improve space utilisation efficiency by up to 40 per cent. Modernisation projects will be executed in the Cape Town, Cape Winelands and Eden regions.
Property Efficiency Strategy
The now annual Property Efficiency Report (PER) assists management to take more informed decisions on optimal utilisation and efficiency. It is anticipated that the PER will evolve into an active managerial decision-making and planning tool (both for the custodian department and user departments), and that it will assist in shaping policy development aimed at achieving greater property efficiency.
Human Settlements
Over the medium term, the following areas for development have been prioritised:
• Upgrading informal settlements to improve the living conditions of people in those settlements as well as backyard dwellers;
• Increasing affordable housing opportunities to provide shelter for those in the gap market;
Optimising office space utilisation will continue across the Province

Medium Term Budget Policy Statement 2016 – 2019
60
• Embarking on partnerships with the private sector to unlock the affordable housing market; and
• Promoting security of tenure through the transfer of title deeds to beneficiaries.
A Project Prioritisation Tool is being utilised to respond to the Growth Potential of Towns Study. Hence plans and project pipelines are developed as part of the Built Environment Support Plan to improve spatial alignment of settlement development.
Catalytic and provincial projects over the medium-term include:
• Southern Corridor N2 Phase 2 - 51 000 units
• North Eastern Corridor - 19 000 units
• Voortrekker Integration Zone - 1 600 units
• Vlakkeland - 3 000 units
• Dal Josafat - 5 000 units
• Trans Hex - 7 000 units
• Thembalethu and Syferfontein - 15 000
• Vredenburg Urban Regeneration - 1 000 units
CapeNature
The purpose of the Marketing and Eco-Tourism programme of CapeNature is to develop and maintain unique tourism product offerings that contribute to the sustainability of biodiversity management and to establish a positive and credible CapeNature brand by ensuring effective and efficient communication and marketing support to both internal and external stakeholders. CapeNature also develops and maintains a range of tourism products.
CapeNature’s infrastructure budget over the 2016 MTEF caters for the following projects: Salmonsdam Nature Reserve, Kogelberg Nature Reserve: Phase 2, Keurbooms Nature Reserve, Walker Bay Nature Reserve, Limietberg Nature Reserve, De Mond Nature Reserve as well as minor maintenance relating to various infrastructure projects.

Chapter 4: Infrastructure
61
Conclusion
The approach advocated by the Western Cape Infrastructure Framework (WCIF) is one that satisfies current needs and backlogs, maintains existing infrastructure, and plans proactively for a desired future outcome leading to resilient and inclusive growth en route to a vibrant, equitable and low-carbon society.
Departments are planning in accordance with the strategies and policy frameworks of the WCG (Provincial Spatial Development Framework; Growth Potential of Towns Study; Municipal Spatial Development Frameworks; and Joint Planning Initiatives) whilst maintaining fiscal discipline and engendering efficiencies in the delivery of infrastructure.


63
5
Expenditure
In summary
Aggregate expenditure is set to grow at an average nominal rate of 5.5 per cent over the medium term.
Considering the constrained fiscal outlook, budget adjustments are largely to maintain fiscal stability.
The continued emphasis on efficiency in expenditure has led to the refinement of financial prudence measures and deepened organisational efficiency.
Introduction
Given the current economic outlook and already constrained fiscal environment, it has become imperative for government to create fiscal stability as well as deepen current efficiencies in public spending.
This chapter provides an overview of government’s response to a constrained fiscal environment through the provincial expenditure over the medium term, the 2015/16 mid-year estimates and efficiency in spending.
Provincial government expenditure
Table 5.1 (overleaf) provides estimated provincial expenditure by departments and the Provincial Parliament from 2014/15 - 2018/19.
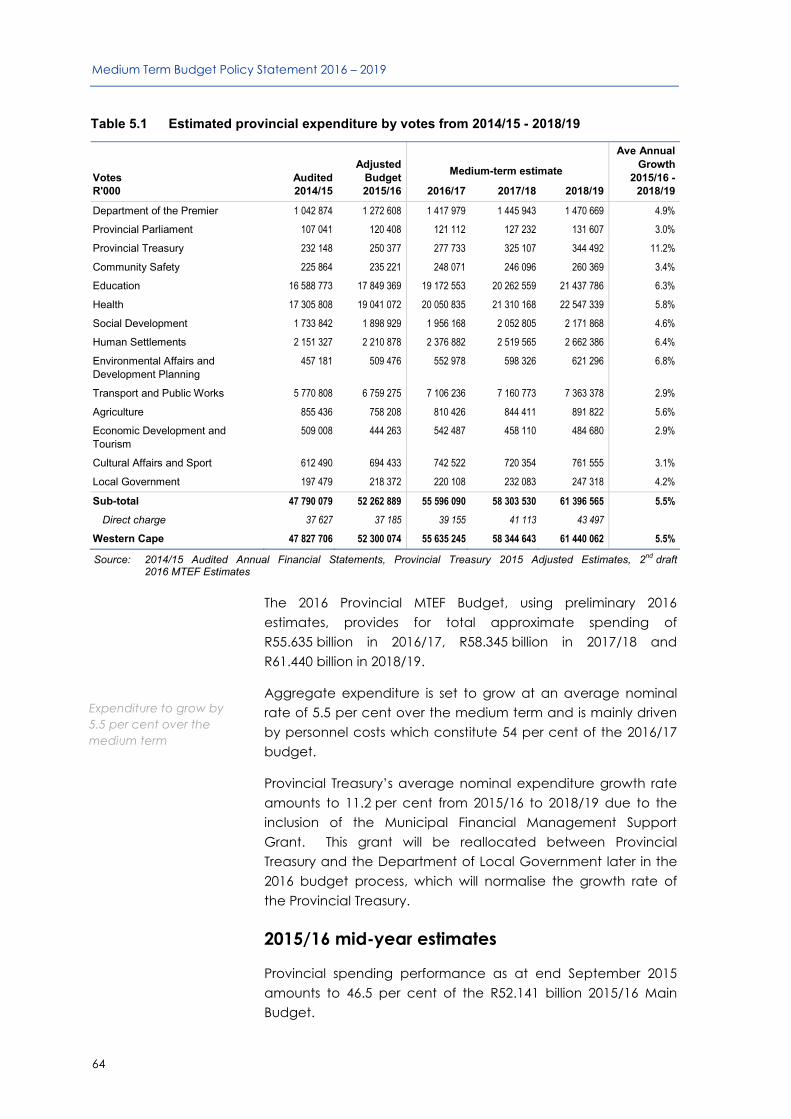
Medium Term Budget Policy Statement 2016 – 2019
64
Table 5.1 Estimated provincial expenditure by votes from 2014/15 - 2018/19
Ave Annual Adjusted
Medium-term estimate Growth
Votes Audited Budget 2015/16 -R'000 2014/15 2015/16 2016/17 2017/18 2018/19 2018/19
Department of the Premier 1 042 874 1 272 608 1 417 979 1 445 943 1 470 669 4.9%
Provincial Parliament 107 041 120 408 121 112 127 232 131 607 3.0%
Provincial Treasury 232 148 250 377 277 733 325 107 344 492 11.2%
Community Safety 225 864 235 221 248 071 246 096 260 369 3.4%
Education 16 588 773 17 849 369 19 172 553 20 262 559 21 437 786 6.3%
Health 17 305 808 19 041 072 20 050 835 21 310 168 22 547 339 5.8%
Social Development 1 733 842 1 898 929 1 956 168 2 052 805 2 171 868 4.6%
Human Settlements 2 151 327 2 210 878 2 376 882 2 519 565 2 662 386 6.4%
Environmental Affairs and Development Planning
457 181 509 476 552 978 598 326 621 296 6.8%
Transport and Public Works 5 770 808 6 759 275 7 106 236 7 160 773 7 363 378 2.9%
Agriculture 855 436 758 208 810 426 844 411 891 822 5.6%
Economic Development and Tourism
509 008 444 263 542 487 458 110 484 680 2.9%
Cultural Affairs and Sport 612 490 694 433 742 522 720 354 761 555 3.1%
Local Government 197 479 218 372 220 108 232 083 247 318 4.2%
Sub-total 47 790 079 52 262 889 55 596 090 58 303 530 61 396 565 5.5%
Direct charge 37 627 37 185 39 155 41 113 43 497
Western Cape 47 827 706 52 300 074 55 635 245 58 344 643 61 440 062 5.5%
Source: 2014/15 Audited Annual Financial Statements, Provincial Treasury 2015 Adjusted Estimates, 2nd draft 2016 MTEF Estimates
The 2016 Provincial MTEF Budget, using preliminary 2016 estimates, provides for total approximate spending of R55.635 billion in 2016/17, R58.345 billion in 2017/18 and R61.440 billion in 2018/19.
Aggregate expenditure is set to grow at an average nominal rate of 5.5 per cent over the medium term and is mainly driven by personnel costs which constitute 54 per cent of the 2016/17 budget.
Provincial Treasury’s average nominal expenditure growth rate amounts to 11.2 per cent from 2015/16 to 2018/19 due to the inclusion of the Municipal Financial Management Support Grant. This grant will be reallocated between Provincial Treasury and the Department of Local Government later in the 2016 budget process, which will normalise the growth rate of the Provincial Treasury.
2015/16 mid-year estimates
Provincial spending performance as at end September 2015 amounts to 46.5 per cent of the R52.141 billion 2015/16 Main Budget.
Expenditure to grow by 5.5 per cent over the medium term

Chapter 5: Expenditure
65
Besides the constrained fiscal environment, the main pressure facing departments in the current financial year is the shortfall of the 2015 Wage Agreement particularly in frontline services such as Education, Health and Human Settlements. It is required of all other departments to address the 2015 Wage Agreement shortfall through reprioritisation and deepening current efficiency measures.
2015 Adjusted Estimates
Consistent with the approach in previous financial years, the 2015 Adjusted Estimates lays the basis for the 2016 Medium Term Expenditure Framework (MTEF). Decisions regarding the 2015 Adjusted Estimates thus have implications on the 2016 MTEF. The adjusted estimates make provision for additional net spending amounting to R240.596 million. The allocations per vote is summarised in the table above.
The 2015 Adjusted Budget addresses budget issues unique to the 2015/16 financial year, in the main providing for the impact of the 2015 Wage Agreement. In this regard R214.579 million, received from national equitable share funds, in order to fund this specific pressure, has been allocated to ensure that the following departments have a sustainable fiscal base for essential frontline services:
R62.922 million to Education;
R149.461 million to Health; and
R2.196 million to Human Settlements.
The balance of the funds received from National Treasury in 2015/16 to deal with the wage implications has been allocated to Education in the 2016/17 financial year to ensure a sustainable fiscal base to deal with the carry-through impact of the 2015 Wage Agreement.
R130.717 million has been allocated for infrastructure related projects:
For the demolition of the Conradie Hospital, R11.076 million;
For property rates and municipal services higher than the projected escalation, R12.102 million;
For education infrastructure, R12.755 million (grant rollover);
For the revitalisation of health facilities, R67.052 million (grant rollover);
2015 Wage Agreement shortfall is main pressure in 2015/16 financial year

Medium Term Budget Policy Statement 2016 – 2019
66
To acquire a property for a community health clinic in Beaufort West, R1 million and for health related lease agreements, R575 000;
To Human Settlements for bulk services and eradication of the bucket system (Saldanha Bay, Prince Albert, Calitzdorp and Witzenberg), R19.149 million;
For routine road maintenance within the Eden District Municipality, R2.008 million; and
To Cultural Affairs and Sport, R5 million, for library infrastructure and maintenance in the Metro.
It was necessary to align some departmental baselines by shifting funds between departments to ensure the sustainability of certain policy objectives. To this effect, amongst other, the Department of Education received funding for e-Learning initiatives, structured and focused support for improved learning in the foundation phase at schools as part of the 100 Schools Initiative, R10 million, to supplement experimental hubs at schools R10 million, and for the purchase of tablets for schools R10 million. Furthermore, the Department of the Premier received R18 million for enabling of the procurement of an Open Text Enterprise Licence Agreement for the Enterprise Content Management System.
R36.127 million, received for the traffic management function from the Road Traffic Management Corporation, has been allocated to Transport and Public Works.
With regards to provincial contingencies, R26.5 million has been allocated for climate change, disaster prevention and municipal fire brigade, as follows:
R6.5 million to be earmarked for Disaster prevention measures: Management of wildfires at CapeNature through Environmental Affairs and Development Planning;
R10 million for climate change mitigation projects for Agriculture to assist with drought, water and food security; and
R10 million, as unforeseen and unavoidable expenditure, for hazardous material response capacity along major routes, as well as firefighting capacity across the Province, to the Department of Local Government.

Chapter 5: Expenditure
67
Considering the constrained fiscal outlook and to facilitate fiscal sustainability and financial prudence, provincial budgets were realigned to allow for the reduction or reallocation of funds over the 2016 MTEF amounting to R217.307 million:
R53 million reallocation of Broadband in the Department of the Premier to the 2016 MTEF.
R5.244 million to decrease the transfer payment allocation by the Provincial Treasury to the Gambling and Racing Board.
R78.634 million reduction in Transport and Public Works towards dealing with the provincial wage agreement shortfall.
R80.429 million reallocation to the 2016/17 financial year at Economic Development and Tourism for the provincial CTICC contribution (R65 million), broadband and a Halaal Park (Project Khulisa Agro-processing project).
Efficiency in spending
To ensure efficiencies in spending, departments instituted new efficiency initiatives and refined previously instituted financial prudence measures. Departments have deepened organisational efficiency practices by doing more with less, whilst continuing to ensure requisite levels of quality.
Personnel management
Frontline service departments such as Education will continue the reduction of temporary, relief and excess educators with the aim of creating personnel stabilisation. Additional efficiencies embarked upon are the enhanced monitoring and implementation of the Policy on Incapacity Leave and Ill-Health Retirement (PILIR) as well as reviewing the cost effectiveness of contract staff vis-à-vis payment of overtime.
Health, being personnel driven, manages personnel efficiencies through its Approved Post List (APL). This is essentially the departmental mechanism to budget for, manage and control personnel expenditure on an annual and monthly basis. These APL budgets have subsequently been reduced and will be prudently monitored on a hospital/facility level (per occupational group, e.g. medical, nursing, allied, and administrative) to ensure stability on all levels.
Realignment of certain votes for fiscal sustainability
Improved efficiency and management of personnel

Medium Term Budget Policy Statement 2016 – 2019
68
In order to stabilise the major expenditure cost driver, the balance between remuneration levels, employee numbers and productivity requires further consideration over the MTEF.
Non-personnel expenditure
Departments will further consolidate and streamline administrative functions to eliminate duplication of effort. Key initiatives include a focus on the following:
The investigation of key goods and services expenditure items (line-by-line and economic classification);
Enhanced procurement planning of key departmental commodities; and
Driving down inventory costs by, amongst others, assigning dedicated teams to address Inventory Management, where applicable; and
Reviewing and refining departmental policies to improve the efficiency and utilisation of the Government fleet.
Conclusion
The expenditure focus will continue to be on efficiency in personnel and non-personnel expenditure, personnel productivity (effectiveness) and fiscal stability in order to do more with less while achieving the Provincial Strategic Goals.
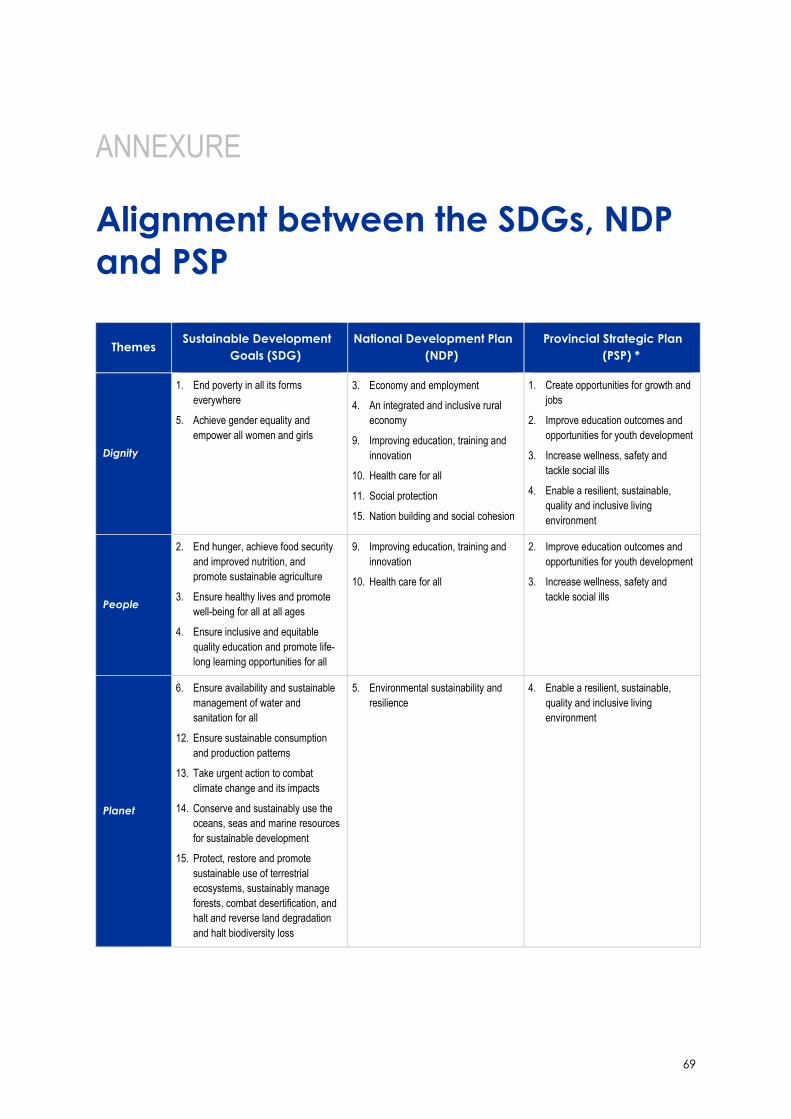
69
ANNEXURE
Alignment between the SDGs, NDP and PSP
Themes Sustainable Development Goals (SDG)
National Development Plan (NDP)
Provincial Strategic Plan (PSP) *
Dignity
1. End poverty in all its forms everywhere
5. Achieve gender equality and empower all women and girls
3. Economy and employment
4. An integrated and inclusive rural economy
9. Improving education, training and innovation
10. Health care for all
11. Social protection
15. Nation building and social cohesion
1. Create opportunities for growth and jobs
2. Improve education outcomes and opportunities for youth development
3. Increase wellness, safety and tackle social ills
4. Enable a resilient, sustainable, quality and inclusive living environment
People
2. End hunger, achieve food security and improved nutrition, and promote sustainable agriculture
3. Ensure healthy lives and promote well-being for all at all ages
4. Ensure inclusive and equitable quality education and promote life-long learning opportunities for all
9. Improving education, training and innovation
10. Health care for all
2. Improve education outcomes and opportunities for youth development
3. Increase wellness, safety and tackle social ills
Planet
6. Ensure availability and sustainable management of water and sanitation for all
12. Ensure sustainable consumption and production patterns
13. Take urgent action to combat climate change and its impacts
14. Conserve and sustainably use the oceans, seas and marine resources for sustainable development
15. Protect, restore and promote sustainable use of terrestrial ecosystems, sustainably manage forests, combat desertification, and halt and reverse land degradation and halt biodiversity loss
5. Environmental sustainability and resilience
4. Enable a resilient, sustainable, quality and inclusive living environment
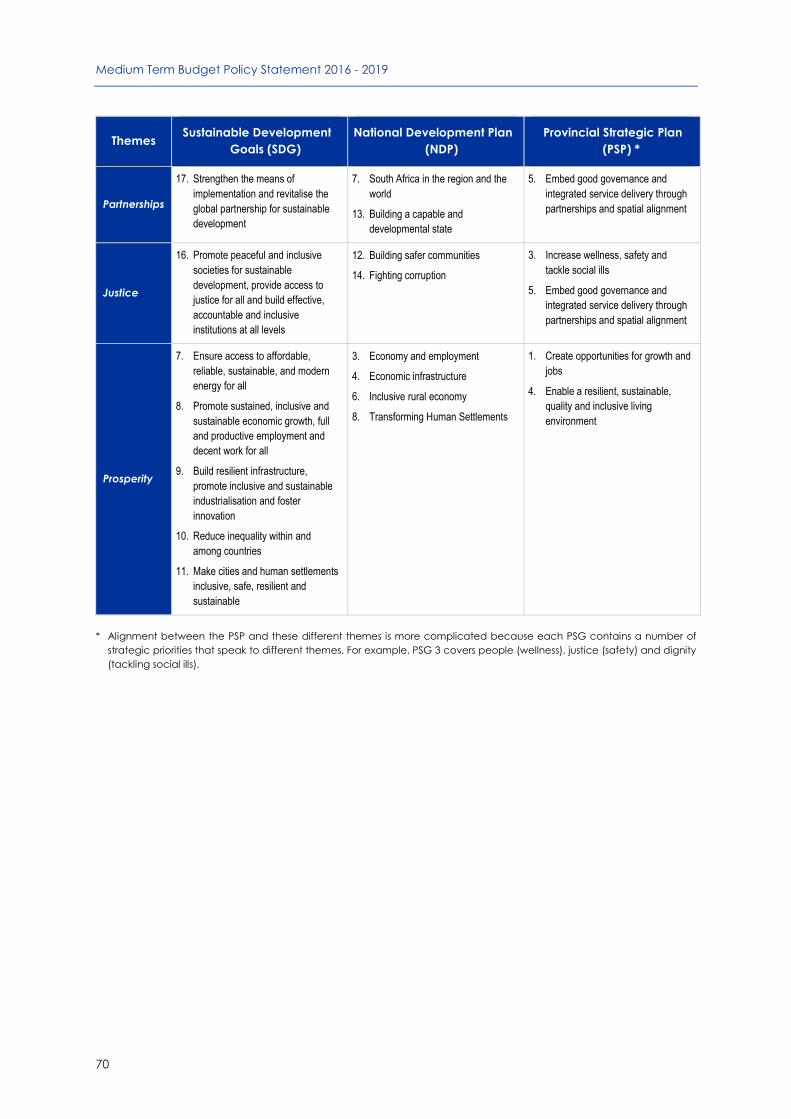
Medium Term Budget Policy Statement 2016 - 2019
70
Themes Sustainable Development Goals (SDG)
National Development Plan (NDP)
Provincial Strategic Plan (PSP) *
Partnerships
17. Strengthen the means of implementation and revitalise the global partnership for sustainable development
7. South Africa in the region and the world
13. Building a capable and developmental state
5. Embed good governance and integrated service delivery through partnerships and spatial alignment
Justice
16. Promote peaceful and inclusive societies for sustainable development, provide access to justice for all and build effective, accountable and inclusive institutions at all levels
12. Building safer communities
14. Fighting corruption
3. Increase wellness, safety and tackle social ills
5. Embed good governance and integrated service delivery through partnerships and spatial alignment
Prosperity
7. Ensure access to affordable, reliable, sustainable, and modern energy for all
8. Promote sustained, inclusive and sustainable economic growth, full and productive employment and decent work for all
9. Build resilient infrastructure, promote inclusive and sustainable industrialisation and foster innovation
10. Reduce inequality within and among countries
11. Make cities and human settlements inclusive, safe, resilient and sustainable
3. Economy and employment
4. Economic infrastructure
6. Inclusive rural economy
8. Transforming Human Settlements
1. Create opportunities for growth and jobs
4. Enable a resilient, sustainable, quality and inclusive living environment
* Alignment between the PSP and these different themes is more complicated because each PSG contains a number of
strategic priorities that speak to different themes. For example, PSG 3 covers people (wellness), justice (safety) and dignity (tackling social ills).
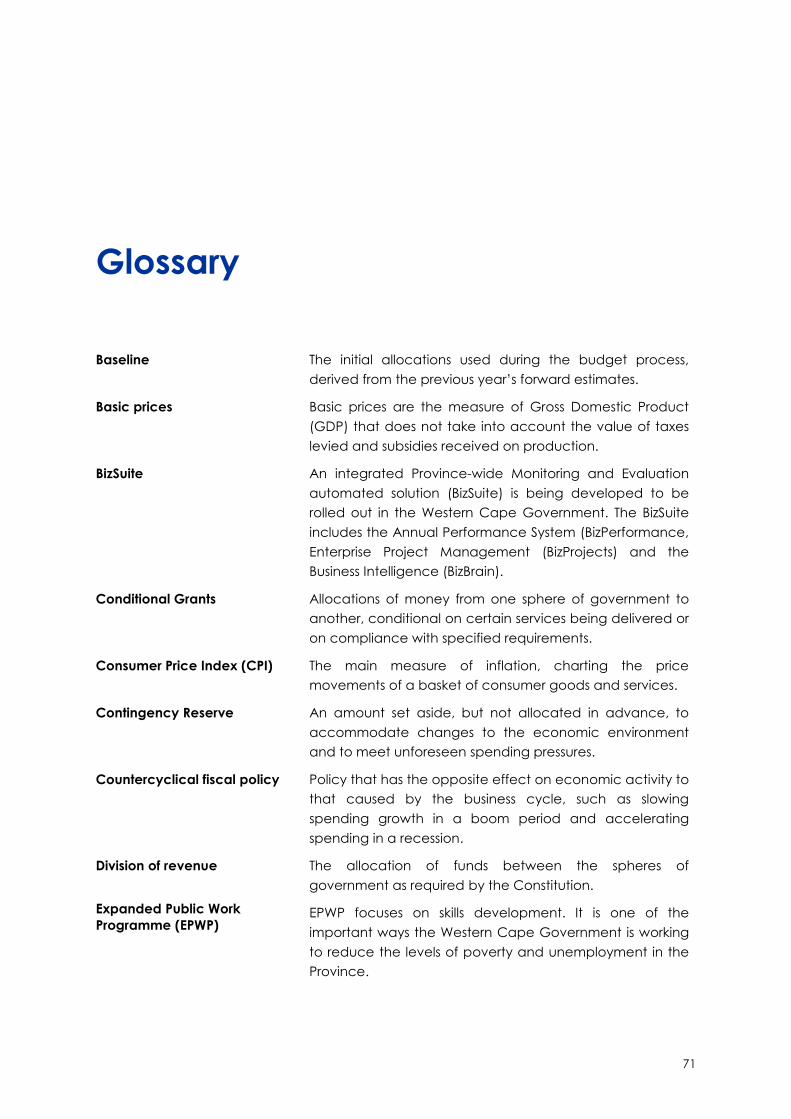
71
Glossary Baseline The initial allocations used during the budget process,
derived from the previous year’s forward estimates.
Basic prices Basic prices are the measure of Gross Domestic Product (GDP) that does not take into account the value of taxes levied and subsidies received on production.
BizSuite An integrated Province-wide Monitoring and Evaluation automated solution (BizSuite) is being developed to be rolled out in the Western Cape Government. The BizSuite includes the Annual Performance System (BizPerformance, Enterprise Project Management (BizProjects) and the Business Intelligence (BizBrain).
Conditional Grants Allocations of money from one sphere of government to another, conditional on certain services being delivered or on compliance with specified requirements.
Consumer Price Index (CPI) The main measure of inflation, charting the price movements of a basket of consumer goods and services.
Contingency Reserve An amount set aside, but not allocated in advance, to accommodate changes to the economic environment and to meet unforeseen spending pressures.
Countercyclical fiscal policy Policy that has the opposite effect on economic activity to that caused by the business cycle, such as slowing spending growth in a boom period and accelerating spending in a recession.
Division of revenue The allocation of funds between the spheres of government as required by the Constitution.
Expanded Public Work Programme (EPWP)
EPWP focuses on skills development. It is one of the important ways the Western Cape Government is working to reduce the levels of poverty and unemployment in the Province.

Medium Term Budget Policy Statement 2016 - 2019
72
Financial year The 12 months according to which companies and organisations budget and account.
Fiscal framework/envelope A framework for integrating fiscal policy and budgeting over the medium-term by linking a system of aggregate fiscal forecasting to a disciplined process of maintaining detailed medium-term budget estimates by ministries reflecting existing government policies.
Fiscal policy Policy on taxation, spending and borrowing by government.
Fiscal space The ability of a government’s budget to provide additional programme resources without jeopardising fiscal sustainability.
Gini coefficient The Gini coefficient measures income inequality, varying from 0 (complete equality) to 1 (complete inequality). The Gini focuses on relative and may not reflect the actual poverty levels.
Gross domestic product (GDP) A measure of the total national output, income and expenditure in the economy. GDP per head is the simplest overall measure of welfare, although it does not take account of the distribution of income, nor of goods and services produced outside the market economy.
Indirect grant A grant allowing a national department to perform a function on behalf of a province or municipality. No funds are transferred, but the end-product of the grant, such as infrastructure built, is generally transferred to provincial or municipal ownership.
Infant mortality The probability of a child born in a specific year dying before reaching the age of one, expressed per 1 000 live births.
Inflation An increase in the general level of prices.
Infrastructure Programme Management Plans (IPMP)
Includes the Construction Procurement Strategy (G2 in the Gateway System of the IDMS). The IPMP describes how the work listed in the prioritised MTEF work list is packaged; managed and controlled from the client’s perspective.
Medium-term Expenditure Framework (MTEF)
The three-year spending plans of national and provincial governments published at the time of the Budget.
Medium-term Strategic Framework
Defines the strategic objectives and targets of National Government over a five year period, coinciding with the electoral term.

Glossary
73
Mass participation; Opportunity and access; Development and growth (MOD) Programme
The MOD Programme is an after-school, mass participation programme wherein school-going learners participate in after-school activities.
Narrow unemployment rate Rate of unemployment that does not take into account the discouraged employment seekers from the labour force.
Non-searching unemployed Individuals who want to work and are available to work, but who are not actively looking for work.
Poverty gap This provides the average distance of the population from the poverty line and is expressed as a percentage of the poverty line. The smaller the gap the easier it is for individuals/households to graduate out of poverty as they are closer to the poverty line.
Poverty severity This takes into account not only the distance separating the population from the poverty line, i.e. the poverty gap, but also the inequality among the poor. That is, a higher weight is placed on those households/individuals who are further away from the poverty line. The lower the percentage, the less inequality there is amongst the poor.
Premature mortality/ Years of life lost
Premature mortality, or years of life lost, is an estimate of the average years a person would have lived if he or she had not died prematurely, i.e. before the estimated life expectancy.
Provincial Equitable Share The allocation of nationally raised revenue to provincial government as required by the Constitution.
Provincial own receipts Refers to taxes/fees and/or user charges, which a provincial department receives.
Provincial Strategic Plan The WCGs five year strategic plan, coinciding with the 5 year electoral term, that gives effect to the National Development Plan and Provincial Strategic Goals.
Sustainable Development Goals (SDGs)
The Sustainable Development Goals (SDGs) builds on the Millennium Development Goals (MDGs). Alongside continuing development priorities such as poverty eradication, health, education and food security and nutrition; the SDGs sets out a wide range of economic, social and environmental objectives as well. SDGs have explicitly been developed to be universal in their application therefore applying equally to the developed and developing world.

Medium Term Budget Policy Statement 2016 - 2019
74
Under-5 mortality The probability of a child born in a specific year dying before reaching the age of five, expressed per 1 000 live births.
User Asset Management Plan (U-AMP)
In terms of the Government Immovable Asset Management Act (GIAMA), all national and provincial departments are required to complete an Asset Management Plan that will form part of the planning and budgeting process of Government. Users of immovable assets completes a U-AMP, and includes all assets controlled or used, or intends to control or use. The custodians and users of jointly conduct a strategic planning process and submit the plan to the relevant treasury on an annual basis.
Western Cape Infrastructure Framework ( WCIF)
A strategic framework intended to align the planning, delivery and management of infrastructure, provided by all stakeholders (national government, provincial government, local government, parastatals and the private sector), to the strategic agenda and vision for the Province.