western new york health care safety-net assessment · western new york health care safety-net...
TRANSCRIPT
Western New York Health Care Safety-Net Assessment
FINAL REPORT
February 2008
Submitted to: Community Health Foundation
Of Western and Central New York 726 Exchange Street, Suite 518 Buffalo, New York 14210-1485
Submitted by: John Snow, Inc.
44 Farnsworth Street Boston, MA 02210-1211

Western New York Safety-Net Assessment John Snow, Inc.
2
ACKNOWLEDGEMENTS The JSI Project Team could not have completed this ambitious project without the support and efforts of literally hundreds of people throughout the western New York region. Their commitment to the region and the people they serve is inspiring. On behalf of the Community Health Foundation of Western and Central New York (CHFWCNY), the JSI Project Team extends our thanks and appreciation to everyone who took the time and effort to give their input, expertise, and experience to this assessment. Special thanks go to Amber Slichta, Program Officer at CHFWCNY and Kenneth Rogers, consultant to CHFWCNY, for their guidance and support during this effort. They were always available to answer questions and share their expertise and excellent knowledge of the region. We would also like to specifically acknowledge the safety-net organizations and providers that participated in site visits and thank all the people who contributed through interviews and consumer survey activities. We could not have completed this project without the help of those in the field. We also thank John Taylor at the Buffalo Primary Care Research Institute and the Upstate New York Practice Based Research Network (UNYNET) for his willingness and efforts to include questions for this project on the UNYNET physician survey that was distributed in the Fall of 2007. Finally, we would like to express our appreciation to the students at the University at Buffalo Department of Psychology who formed our survey data collection team. They were an impressive example of the University’s contribution to the region.
John Snow, Inc. Research and Training Institute (JSI) PROJECT TEAM
Patricia Fairchild, Project Director Ashley Marks, Research Assistant Julie Hook, Analyst Alec McKinney, Lead Analyst Orla Kennedy, Research Assistant Natalie Truesdell, Analyst Michael Rodriquez, Information Tech- nology Advisor For Additional Information: Please contact [email protected] or [email protected]
Western New York Safety-Net Assessment John Snow, Inc.
3
Western New York
Health Care Safety-Net Assessment Final Report
Table of Contents
I. Executive Summary……………………………………………………………...8
II. Purpose and Rationale………………………………………………………….18
III. Approach, Methods, and Project Activities…………………………………...21
A. ACCESS - Describe the Safety-Net and Assess its Capacity and Strength……………………………………………………………….....21
1. Categories of Safety-Net Provider…………………………….….....21
2. Approach to Data Collection…...……………………………………23
B. CONSUMER EXPERIENCE – Assess Consumer’s Experience with
their Primary Care…………...…...……………………………………26 C. INFORMATION TECHNOLOGY - Determine the Health
Information Technology (HIT) Capacity of Safety-Net Providers….27 D. BENCHMARKING………………………...…...…...…………………27
IV. Findings Related to the Structure of the Safety-Net and Access…………….31
A. Common Themes Across the Region…………………….…………….31 1. Assessment of Safety-Net’s Strengths Based on the IOM Core
Competencies…………………….………………………………….31 2. Utilization of Emergency Departments for Ambulatory Care
Sensitive Conditions…………………….…………………………….35
3. Identified Needs to Strengthen the Safety-Net……………………..37
4. Safety Net Capacity, Structure, Service Gaps, Challenges, and Strengths………………………………………..……………………..39

Western New York Safety-Net Assessment John Snow, Inc.
4
B. County-Specific Description and Issues………………………...…………………….43 Allegany County…………………..……………...…………………….43
Cattaraugus County ………………………...…………………...….…44 Chautauqua County…...…………………...………………….…….....46 City of Buffalo and Erie County …..……...……………………….….48
Genesee County………………………………………..……...…….….51 Niagara County……………………………….………………………..53 Orleans County……………………………….………………………..55
Wyoming County……………………………….…………………..….56 V. Consumer Experience: The Western New York Children’s Access Survey
(WNYCAS) ……………………………….……………………………….…..57 A. Introduction ……………………………….…………………………57
B. Summary of Survey Results………………………………………….58 C. Detailed Discussion of Findings…………………………………..….65
1. Description/characteristics of population surveyed…………...…65 2. Health insurance coverage…………...……………………………68 3. Health care access and utilization………………………………....69 4. Cultural competence and health literacy……………………....…77
VI. Health Information Technology……………………………………………..79
A. Review of Safety-Net HIT Capacity in Western New York………..79 B. State and National Perspective………………………………………80
VII. Recommendations…………...………………………………………………..84
A. Stabilize and Grow the Safety-Net ………………………………….84 B. Link Safety-Net Providers to Improve Access and Quality………..87
C. Reduce Dependency on Emergency Rooms for Primary Care…….89

Western New York Safety-Net Assessment John Snow, Inc.
5
Western New York
Health Care Safety-Net Assessment Final Report
List of Tables and Figures
Tables Table 1. Comparison of emergency department visits in western New York to the entire state of New York (page 35) Table 2. Comparison of emergency department visits in western New York to five other states (page 36) Table 2a. Total non-emergent/emergent primary care treatable or avoidable and emergency ED care needed not preventable or avoidable ED visits (page 37) Table 3. Allegany County (page 43) Table 4. Cattaraugus County (page 44) Table 5. Chautauqua County (page 46) Table 6. Erie County (page 48) Table 7. Genesee County (page 51) Table 8. Niagara County (page 53) Table 9. Orleans County (page 55) Table 10. Wyoming County (page 56) Table 11. Number of surveys collected in each county (page 65) Table 12. Demographic characteristics of population surveyed (page 66) Table 13. Race and Ethnicity of WNYCAS Respondents (page 66) Table 14. Children’s Health Coverage in the WNYCAS (page 68) Table 15. Usual Source of Care (page 69) Table 16. Comparison of wait time to schedule preventive care visits between provider and community locations (page 71) Table 17. Comparison of the wait time for children’s sick visits between parents surveyed in community sites versus provider sites (page 72)

Western New York Safety-Net Assessment John Snow, Inc.
6
Table 18. Reasons why children did not get all the medical care they needed (page 75) Table 19. Reasons why children did not get all the dental care they needed (page 76) Table 20. Reasons why children did not get all the dental care they needed (page 76) Table 21. Reasons why parents do not always follow their child’s provider’s advice (page 78) Figures Figure 1. The percent of children who had a preventive care visit in the last 12 months (page 58) Figure 2. Parent’s ability to schedule a preventive care visit for their child (page 59) Figure 3. Consumer ability to schedule a sick visit (page 59) Figure 4. Consumer ability to understand written communication from their provider (page 60) Figure 5. Percent of children who had a gap in health coverage in the last 12 months (page 61) Figure 6. Percent of children who visited the ER in the last 12 months (page 62) Figure 7. Percent of children who had a preventive dental visit in the last year (page 63) Figure 8. Ability of parents to speak to provider by phone (page 64) Figure 9. Income of WNYCAS respondents compared to western New York 2000 Census Data (page 67) Figure 10. The percent of children who have had a preventive care visit in the last twelve months by insurance type (page 70) Figure 11. The national rate of children’s ER visits by insurance type (page 72) Figure 12. Reasons why children in western New York went to the ER in the last year (page 73) Figure 13. Percent of parents who reported getting specialty care for their child was a problem (page 74)

Western New York Safety-Net Assessment John Snow, Inc.
7
Western New York Health Care Safety-Net Assessment
Final Report
Appendices
A. Contacts a. List of Provider Site Visits b. List of Key Informants c. Key Informant Interview Guide d. List of Other Providers Contributing to Safety-Net
B. Provider Site Visit Protocol C. Emergency Department Utilization Data
D. County Summary Table
E. Consumer Survey Materials
a. List of Survey Sites b. List of Survey Questions and Responses c. Comprehensive Methodology d. Consumer Survey
F. Health Information Technology (HIT)
a. HIT Capacity at Selected Safety Net Providers

Western New York Safety-Net Assessment John Snow, Inc.
8
I. EXECUTIVE SUMMARY A. OVERVIEW AND PURPOSE
The Community Health Foundation of Western and Central New York (CHFWCNY) has selected children in communities of poverty and their families as one of its strategic priorities for the near future. CHFWCNY is committed to improving health care for this population and strengthening the health care safety-net in western New York is a critical part of CHFWCNY’s goal. To support this work, CHFWCNY hired John Snow, Inc, (JSI) a nationally recognized public health and health care planning firm, to conduct an overall assessment of western New York’s safety-net. Western New York counties included in the assessment are: Allegany, Cattaraugus, Chautauqua, Erie, Genesee, Niagara, Orleans, and Wyoming. In developing its view of the safety-net, CHFWCNY has drawn ideas from the Department of Health and Human Services (DHHS) Agency for Healthcare Research and Quality (AHRQ). AHRQ defines the safety-net as follows:
“The health care safety-net consists of a wide variety of providers delivering care to low income and other vulnerable populations, including the uninsured and those covered by Medicaid. Many of these providers have either a legal mandate or an explicit policy to provide services regardless of a patient's ability to pay. Major safety-net providers include public hospitals and community health centers as well as teaching and community hospitals, private physicians, and other providers who deliver a substantial amount of care to these populations.”
For the purposes of this assessment, CHFWCNY defines the primary care safety-net to include primary medical, oral health and behavioral health services. The specific services included in primary medical care are those offered by family medicine, pediatrics, internal medicine and OB/GYN practitioners. Behavioral health care includes mental health and substance abuse services. The overall goal of this project was to collect information from key health care stakeholders, safety-net providers, and consumers about the safety-net’s current state with respect to access, consumer experience, and health information technology. The following were the project’s major objectives:
1) Describe the PRIMARY CARE SAFETY-NET, including primary medical care, behavioral health and oral health providers, and identify the key players throughout the region,
2) Assess ACCESS and the safety-net’s overall capacity and strength, 3) Assess CONSUMER’S EXPERIENCE with their primary care, and 4) Determine the INFORMATION TECHNOLOGY (IT) capacity of the primary care
safety-net.
Western New York Safety-Net Assessment John Snow, Inc.
9
B. APPROACH
JSI and CHFWCNY developed an approach for each component of the project. These are summarized below. ACCESS - Describe the Safety-Net and Assess its Capacity and Strength With respect to access, the Project Team identified and described the primary care safety-net and assessed its ability to provide adequate, accessible, high quality services to low income, underserved children and their families in western New York. In identifying the safety-net the Project Team made significant efforts to identify the primary medical, oral and behavioral health care providers that serve substantial numbers of low income and uninsured children. The overall assessment was not designed to facilitate a full primary care safety-net inventory but rather to identify key players and describe the safety-net’s basic structure and strengths. While the Project Team is confident that it has captured the major safety-net providers it is possible, that the Team’s efforts have not uncovered all of the primary care providers that play an important role in the safety-net. Categories of Safety-Net Providers: To assist in describing the western New York safety-net, the JSI Project Team worked with CHFWCNY staff to identify and categorize key safety-net providers. Organizations and providers were grouped in three categories. These categories simply distinguish how each provider participates in the region’s health care safety-net; all providers are critical to continuing to ensure and expand access to low-income children and their families. The following are the safety-net provider categories that are being used in this assessment.
• Core Safety-Net Providers. For purposes of this project, a core safety-net provider is either a health care organization that provides comprehensive primary medical care services or is an organization that provides comprehensive outpatient mental health, substance abuse, or dental services. Core primary medical care providers strive to serve as a patient’s medical home, as defined by the Commonwealth Fund. In the Commonwealth Fund’s definition, a medical home is characterized by : o A regular doctor or source of care o Easy access to the provider by telephone o Easy access to health advice on evenings and weekends or whenever the provider is
closed o Visits with the provider that occur conveniently for patients, are on time and are
efficient
Core safety-net provider must also be guided by an explicit funding policy, a public policy mandate, or some intractable mission to serve low income, Medicaid insured, and uninsured populations. Core providers do not limit the proportion of Medicaid patients they serve and have explicit policies to serve people without regard for their ability to

Western New York Safety-Net Assessment John Snow, Inc.
10
pay. Policies related to the uninsured/underinsured typically include a sliding fee scale that defines specific discounts based on ones household income and family size. Some core safety-net providers may have a policy to provide free care to low income uninsured patients. Furthermore, core providers actively promote these policies and make efforts to reduce barriers to access for those with limited or no means to pay for services.
• Essential Safety-Net Contributors. An essential contributor to the safety-net is a health
care organization or provider of primary medical care, oral health or behavioral health services to large proportions and/or large numbers of people insured by Medicaid, as well as some uninsured/underinsured patients. These organizations may provide services to those who are uninsured on a discounted basis but do so on an individual basis without any explicit mandate or mission. These providers often put caps on the proportion of Medicaid or uninsured patients they serve and many do not have sliding fee scales that are applied across the board without exception. The Project Team also includes in this category, organizations that meet the definition of “core” found above in terms of mission and policies regarding the uninsured, but provide services on a limited part-time basis.
• Other Contributing Providers. Organizations and providers in this category are
important contributors to the safety-net but typically provide only a small amount of services to those insured by Medicaid and an even smaller portion to those who are low income and uninsured. These organizations are usually private providers who simply do not have the infrastructure or financial means to serve large numbers of low income uninsured or Medicaid patients. They often put caps on the proportions of patients they serve in these groups, do not have a formal sliding fee scale, and do not self-identify as a safety-net provider.
Approach to Data Collection In order to focus the project’s resources, the JSI Project Team concentrated on identifying and collecting information from providers and organizations that are part of the core safety-net. Secondarily, the Project Team worked to define the role of the other types of providers that contribute to the safety-net. The Project Team developed a multi-pronged approach to collecting data with respect to assessing access and addressing this portion of the assessment that included: key informant interviews; site visits with safety-net providers; interviews with other providers contributing to the safety-net; and, identification of private physicians and their impact on the safety-net. CONSUMER EXPERIENCE – Assess Consumer’s Experience with their Primary Care The Project Team was charged with assessing the experience of western New York safety-net users/consumers related to primary care services. More specifically, this component of the project explored whether consumers feel they have access to a reliable and consistent source of primary care, the extent to which consumers perceive service gaps or barriers to access, and the experience consumers have when seeking care. For this component of the project, the Project Team developed a survey methodology that collected information from two distinct samples of consumers: 1) consumers waiting for services in primary care provider offices who were already

Western New York Safety-Net Assessment John Snow, Inc.
11
affiliated with a primary care provider and 2) consumers accessing services in various other community venues whose status related to safety-net utilization were unknown. To collect primary data from consumers, the Project Team: developed a consumer survey; the Western New York Children’s Access Survey (WNYCAS). INFORMATION TECHNOLOGY - Determine the Health Information Technology Capacity of Safety-Net Providers With respect to health information technology, the Project Team was charged with delineating the baseline health information technology (HIT) capacity of western New York’s core safety-net providers. In addition, the Project Team compared the IT capacity of western New York’s safety-net to the capacity that is typically seen statewide or nationally. Finally, the Project Team was charged with providing guidance on the types of initiatives or best practices that could be explored in order to improve the IT capacity of the safety-net in western New York. The Project Team used the site visits to collect basic information on the IT systems that were either currently in place or in the process of being implemented. In addition, the Project Team conducted a series of face-to-face and telephone interviews with a selected group of five safety-net providers to collect more in-depth information on capacity as well as to refine the Project Team’s understanding of the needs, challenges, and IT potential of the region’s providers. The Project Team also developed a review of national initiatives that CHFWCNY and providers in western New York could draw from as they work to develop initiatives to strengthen the region’s capacity and application of IT resources. C. RECOMMENDATIONS The most important and overarching finding to emerge from JSI’s assessment of the safety-net in western New York is that the core safety-net (providers and organizations that have both the mission and resources to serve the low-income population without regard for their insurance status or ability to pay for services) is limited and in some parts of the region, non-existent. Not only are there a limited number of safety-net providers, particularly outside of Buffalo, of those that do exist many do not serve as full service, medical homes for their patients. The region is fortunate that other providers and organizations are contributing substantial levels of service to low-income children and their families, but these default safety-net providers - typically private physician practices, hospital-based practices, and academically-supported providers - cannot ensure ongoing and stable access to care especially for uninsured children and their families. Their resources simply do not enable them to absorb the uninsured population. In order to ensure that low-income families who are currently getting care continue to get it, to improve both the consistency and quality of that care and to bring more people into a system of care, the safety-net in western New York must be further developed and strengthened throughout the region. The following recommendations are intended to achieve this overarching goal.
Western New York Safety-Net Assessment John Snow, Inc.
12
Stabilize and Grow the Safety-Net 1. Support the development of new and/or the expansion of existing organizations so that
they can become stronger contributors to the core safety-net. A priority for western New York is to stabilize and grow the core safety-net with the overall objective of increasing the safety-net’s capacity to serve low income insured, under-insured, and uninsured children and families. In this regard, efforts should be taken to grow new and/or support existing core safety-net sites and bolster those making efforts to become core safety-net providers that are capable and committed to serving all patients regardless of their ability to pay, and particularly to support the development of primary care medical homes as defined in this report. The Federally Qualified Health Center (FQHC) and Rural Health Clinic (RHC) programs under the Health Resources and Services Administration (HRSA) are key programs that can support both the development of new provider organizations and/or new service delivery sites as well as the expansion of existing programs. Both provide for enhanced reimbursement for Medicaid and Medicare beneficiaries, stabilizing an organization’s ability to serve these groups, and the FQHC program can also provide Federal grant funding to cover some of the costs of serving the uninsured. Both FQHCs and RHCs serve as medical homes for patients. Based on JSI’s experience, these organizations are significantly under-represented in western New York and their growth could help strengthen the safety-net. 2. Stabilize and enhance the role of providers who are not part of the core safety-net but
can provide substantial services if supported (e.g. residency clinics). The goal of this recommendation is to enable provider organizations that may serve the low-income and uninsured population, and would like to do more, improve their ability to do so. In western New York, many of the organizations providing a substantial level of care to these populations are supported by a hospital and/or medical school residency programs. Often, these providers’ ability to serve low income populations is directly dependent on the financial, in-kind and philosophical support received from the hospital or residency program. To strengthen and stabilize these essential providers, it is important to achieve a better understanding of their costs and contributions. Part of this requires improving financial and data systems so the providers can maximize their revenue and efficiency as well as document their impact. Another part is engaging in community dialogue regarding the role and specific commitment of various organizations in the safety-net.
3. Develop capital investment initiatives geared to strengthening safety-net infrastructure
(e.g., buildings, systems, technology). Many of the providers included in this assessment struggle to pull together the necessary resources to support small and large capital projects that are critical to expanding capacity or maximizing the potential of current operations. The Project Team through its interviews and site visits talked with many organizations that expressed their grave need for financial resources to cover the cost of capital investment in several operational expenses including a new phone

Western New York Safety-Net Assessment John Snow, Inc.
13
system, health information technology initiatives, clinic renovations or building projects, equipment (e.g., dental operatories, lab equipment, etc.), and patient transport vehicles. Identifying resources for capital improvements and assisting safety-net organizations accessing these resources would directly help strengthen and enhance the safety-net. 4. Provide technical assistance geared to promoting improved productivity, efficiency, and
quality. One of the messages that the Project Team heard throughout its interviews and site visits was the idea that given the limited resources “we (safety-net providers) had better make sure that we are doing the best we can with the limited resources and operational capabilities that we have on hand.” Many safety-net providers simply do not have the expertise or the resources to commit to assessing their operations and developing the most productive, effective, and efficient systems that they need. Safety-net providers need assistance with improving their outreach efforts, billing and coding systems, their patient flow, and scheduling (“open-access”) systems, as well as their staffing profiles including staff roles and responsibilities. Basically, any support that would allow them to reach more people, diversify their payer mix, increase productivity, improve quality, and maximize efficiency would be welcomed. Because safety-net providers are so consumed with day-to-day operations, these resources must be very easy to access and implement. 5. Support initiatives that promote quality improvement (QI) and the use of HIT. Many providers have limited HIT infrastructure and struggle to effectively monitor clinic operations and make informed, data-driven decisions about patient care and service delivery. Others have substantial HIT resources but do not necessarily use them to their full potential. Regardless, nearly across the board, safety-net providers in western New York would benefit from investing more resources in quality improvement and strengthening their HIT infrastructure. Providers would benefit from both collaborative and targeted initiatives to support these efforts. Activities could support efforts such as: raising awareness regarding the importance and power of quality improvement and HIT; identifying and empowering QI/HIT champions; developing QI infrastructure (e.g., QI committees, continuous quality improvement structures, identification of measures and benchmarks, etc.); developing/managing chronic disease-specific quality collaboratives, supporting HIT training to maximize the use of existing systems; and supporting the development of patient satisfaction or consumer advisory efforts. Since the possibilities are endless, CHFWCNY should include safety-net providers in future planning to ensure new endeavors are most helpful. 6. Support initiatives that facilitate provider recruitment and retention. The recruitment and retention of clinical staff is an essential prerequisite to stabilizing and enhancing the safety-net. Nearly across the board, safety-net providers in the region struggle to recruit physicians and fill gaps in their clinical staffing. This issue is not unique to western New York or its safety-net providers; JSI sees the same challenges and shortages in many communities. Recruitment of scarce providers is a very difficult challenge for small provider organizations to overcome on their own.

Western New York Safety-Net Assessment John Snow, Inc.
14
This issue would benefit from a regional approach drawing on the expertise of agencies and organizations closely involved in provider training and development (e.g. the region’s health professional schools and training programs and the Area Health Education Centers (AHEC)). Some strategies, such as increased use of technology and telemedicine, might help mitigate the need for in demand and hard to recruit providers, especially specialists. In terms of retention, both compensation levels and work environment are key to provider retention. Efforts to address these two areas through technical assistance should help sustain current clinical staffing. 7. Support State policies that strengthen Medicaid/SCHIP While this project did not include an analysis of the Medicaid/SCHIP policy and its impact on the safety-net, we know that New York has many barriers that impede both enrollment and maintaining consistent eligibility, and that payments to private providers are not sufficient to sustain high levels of Medicaid insured patients in their practices. All providers, including those who make up the core safety-net, are extremely vulnerable to changes in State Medicaid/SCHIP policies. Adverse changes can mean that safety-net providers are not financially able to serve the same number of low-income patients. The private sector has neither a mandate nor a financial cushion to weather changes and is often forced to severely limit patients or services. Since private providers currently serve many low-income children and their families in western New York, and in some places provide the only safety-net, their ability to continue to contribute must be protected. Link Safety-Net Providers to Improve Access and Quality 1. Raise knowledge about the safety-net among providers and consumers There is a clear need to raise the profile, understanding, and awareness of the importance of the safety-net among the health care provider community, as well as among consumers. On the provider side, many health and social services providers are simply not aware of each other and the resources that exist in the region. One result of this is that safety-net providers struggle unnecessarily to address all the needs of their patients. Efforts to promote communication as well as increase knowledge and awareness, should encourage collaboration, facilitate referrals, and promote better service coordination. On the consumer side, there is limited awareness of the importance of primary care and preventive medicine, and where and how to access services. In other areas of the country, efforts to promote greater awareness and knowledge of the safety-net among consumers is often tied to a more general branding campaign that promotes the greater use of the safety-net and corresponding reduction of emergency room utilization. The challenge for western New York, however, is raising such awareness among consumers cannot exceed the capacity of the safety-net to respond to increased demand. Thus, expanding the safety-net must occur simultaneously with raising knowledge among consumers.

Western New York Safety-Net Assessment John Snow, Inc.
15
2. Improve collaboration among providers serving low-income children and their families
Given the limited awareness in many parts of the region about safety-net resources, it is not surprising that many providers are operating in silos rather than as part of a broader system of care for low-income children and their families. One critical step in strengthening the safety-net is to ensure that the resources that exist or become available are not forced to stand alone but can be tied into a broader system of care. Community symposia, resource inventories, help/referral-lines and coordinated case management programs could all help break-down existing silos and encourage better collaboration and referral among providers. 3. Strengthen the provision of evidence-based care The Institute of Medicine has identified the employment of evidenced-based practices as one of the main tenets or core competencies of improving outcomes as well as the quality and efficiency of care. As discussed, few providers in western New York have the resources, staff, or expertise to apply proven best practices and develop operations that are clearly rooted in the evidence. Collaborative initiatives or workshops that educate providers regarding various evidence-based practices and assist providers to incorporate the practices into their operations would benefit all providers and their patients. Possible areas of focus could include behavioral health integration, chronic disease management, elder case management and referral, or more broadly the development of operations that are tailored to medical home model. 4. Develop collaborative quality improvement initiatives Another core competency identified by the Institute of Medicine is the application of quality improvement strategies. CHFWCNY has already invested significant resources in this regard, drawing from approaches developed by the Institute of Healthcare Improvement and the Bureau of Primary Health Care (BPHC) at HRSA, in implementing a series of quality improvement, provider-driven, collaborative initiatives that facilitate continuous quality improvement activities, data monitoring and, information sharing across participants. Continuation and strengthening of quality improvement initiatives would not only result in improved health outcomes for patients but would also strengthen provider organizations in many ways - from supporting provider recruitment and retention, to realizing the full potential of technology, to improving efficiency and expanding capacity. There is a great deal of evidence, particularly from BPHC, IHI, and Community Clinics Initiative (CCI), that has shown that quality initiatives become stronger and more effective when they are implemented on a community-wide basis rather than within a single provider. 5. Support the further development of the western New York Regional Health
Information Organization (RHIO) and effective health information exchange. Many experts are concerned with the potential for a “digital divide” developing between safety-net providers and the broader healthcare marketplace with regard to HIT adoption and electronic health information exchange. The Project Team observed this beginning to occur in western New

Western New York Safety-Net Assessment John Snow, Inc.
16
York. However, there are numerous examples and approaches across the country of safety-net providers participating in this movement. Investment in efforts that support the development of the western New York RHIO and the involvement of core safety-net providers would reduce the “digital divide” that is already becoming apparent in the region. 6. Develop regional symposia on technology and data-driven quality improvement. As has been discussed throughout this report, safety-net clinics in western New York need support in their efforts to build HIT capacity and to learn how HIT can be applied or has been applied to maximize efficiency, improve quality, improve patient outcomes, and better target clinical programming and outreach efforts. A series of symposia that foster a greater understanding of the overall potential, connect individual organizations with HIT-experienced networks, leverage existing web-based HIT resources (e.g., HRSA’s HIT Toolbox, National Resource Center for HIT), and teach providers about clear, practical, and do-able activities that can be applied to facilitate the application of HIT and data-driven quality improvement would be a very worthwhile investment for the region. Reduce Dependency on Emergency Departments for Primary Care 1. Strengthen the primary care safety-net and implement programs to reduce ED
utilization One of the most important findings in the assessment was the high degree of emergency department (ED) utilization for care that could and should be provided in a primary care setting (ambulatory care sensitive conditions). While the professional community agrees that ED utilization is not preferable to primary care from either a cost or quality perspective, people continue to seek routine and acute care through EDs at record numbers. The reasons people use emergency rooms are numerous and complex and many have been discussed in this report. The challenge is to begin to reverse this utilization pattern. Around the country, many other communities are tackling this same problem. Some successful strategies to move people out of EDs have included:
• Hospital ED diversion programs, through which appropriate patients are either triaged on site to a primary care alternative at the time they enter the ED, or are referred for follow-up to a primary care provider. Many variations on these programs exist with varying degrees of intensity of the intervention.
• Aligning payment and other incentives to encourage patients to use a primary care setting instead of an ED and to encourage providers to refer patients to other settings
• Conducting community education campaigns for both providers and patients • Improving primary care access so patients don’t view the ED as their only alternative in
an acute or urgent situation. Telephone triage by clinical staff both during and after normal clinical hours and “open” access for acute appointments both can help reduce ED utilization.
2. Develop community outreach, education, awareness, and marketing campaigns
Western New York Safety-Net Assessment John Snow, Inc.
17
Any efforts to strengthen the safety-net have to go hand-in-hand with targeted, well-packaged community outreach, education and awareness efforts geared to reducing emergency utilization, increasing utilization and awareness of preventive services, and increasing awareness regarding the importance of a medical home and a regular source of primary care-based care. While some results of outreach and education programs can be seen rather quickly, such as when patients are both educated about and provided alternatives to emergency utilization; most results happen only over the long term. Still, providers are only part of the solution to ensuring a strong safety-net. Patients must understand when and how to use the health care system. In the long run, if patients receive appropriate services at the appropriate place, overall health care costs will be reduced and the financial requirements for supporting the safety-net mitigated. If this does not happen, no amount of resources will be sufficient to support the safety-net.

Western New York Safety-Net Assessment John Snow, Inc.
18
II. PURPOSE AND RATIONALE
The Community Health Foundation of Western and Central New York (CHFWCNY) has selected children in communities of poverty as one of its strategic priorities for the near future. CHFWCNY is committed to expanding access to health services, improving health status, and reducing the disparities in health outcomes for this population by investing in:
• Supports that allow children in poverty to reach their full physical, emotional and academic potential,
• Health care safety-net resources that are timely, accessible and centered on children and families,
• Programs that improve care coordination, promote service integration, encourage communication and information sharing and generally increase the quality of care.
Improving the efficiency, effectiveness and service capacity of the health care safety-net in western New York is a critical part of CHFWCNY’s work to improve care for children in communities of poverty and their families. To support this work CHFWCNY hired John Snow, Inc, (JSI) a nationally recognized public health and health care planning firm, to conduct an overall assessment of western New York’s safety-net. This assessment was designed to collect baseline data and information about the safety-net’s current state with respect to access, consumer experience, and health information technology. Western New York counties included in the assessment are: Allegany, Cattaraugus, Chautauqua, Erie, Genesee, Niagara, Orleans, and Wyoming. In developing its view of the safety-net, CHFWCNY has drawn ideas from the Department of Health and Human Services (DHHS) Agency for Healthcare Research and Quality (AHRQ). AHRQ defines the safety-net as follows:
“The health care safety-net consists of a wide variety of providers delivering care to low income and other vulnerable populations, including the uninsured and those covered by Medicaid. Many of these providers have either a legal mandate or an explicit policy to provide services regardless of a patient's ability to pay. Major safety-net providers include public hospitals and community health centers as well as teaching and community hospitals, private physicians, and other providers who deliver a substantial amount of care to these populations.”
The focus on this assessment in western New York is on the region’s primary care safety-net. CHFWCNY has taken a holistic view of health that is conveyed well in the definition of primary care from the Institute of Medicine (IOM):
“Primary care is the provision of integrated, accessible health care services by clinicians who are accountable for addressing a large majority of personal health care needs, developing a sustained partnership with patients, and practicing in the context of family and community.”

Western New York Safety-Net Assessment John Snow, Inc.
19
For the purposes of this assessment, CHFWCNY defines the primary care safety-net to include primary medical, oral health and behavioral health services. The specific services included in primary medical care are generally considered those offered by family medicine, pediatrics, internal medicine and OB/GYN practitioners. Behavioral health care includes mental health and substance abuse services. CHFWCNY has drawn from the IOM’s core competencies for 21st century health care to clarify and guide its work related to the safety-net. The following core competencies describe an approach that providers should take in providing care. The basic tenets of this approach are:
• Design of patient-centered care • Utilization of interdisciplinary teams • Utilization of informatics • Application of quality improvement strategies; and • Employment of evidence based practices.
The overall goal of this project was to collect information from key health care stakeholders, safety-net providers, and consumers that would provide a common platform from which to conduct a joint planning effort by western New York safety-net providers. Ultimately, this information will guide the efforts of CHFWCNY and its partners to develop and implement projects that will address existing provider needs and strengthen the region’s safety-net for children. This information will also provide baseline or reference data to enable CHFWCNY to evaluate and assess the impact and effectiveness of their efforts. More specifically, the primary objectives of this project were to:
1) Describe the PRIMARY CARE SAFETY-NET, including primary medical care, behavioral health and oral health providers, and identify the key players throughout the region,
2) Assess ACCESS and the safety-net’s overall capacity and strength, 3) Assess CONSUMER’S EXPERIENCE with their primary care, and 4) Determine the INFORMATION TECHNOLOGY (IT) capacity of the primary care
safety-net.
The project addressed the following major questions:
• What is the basic structure or composition of the safety-net for children?
• What organizations make up the region’s safety-net for children?
• To what extent are there gaps in the region’s safety-net?
• What is the capacity and strength of the region’s safety-net?
• What are the resource needs of the region’s safety-net?

Western New York Safety-Net Assessment John Snow, Inc.
20
• Is the care provided by the safety-net evidence-based, patient-centered, and guided by quality improvement efforts?
• How well do safety-net providers collaborate, share information, coordinate patient care and integrate their services?
• To what extent do safety-net providers use informatics to support their operations?
• How can CHFWCNY best strengthen and support the safety-net overall as well as with respect to individual provider organizations so as to ensure access to the highest quality care and services?

Western New York Safety-Net Assessment John Snow, Inc.
21
III. APPROACH, METHODS, AND PROJECT ACTIVITIES
At the outset of the project, the JSI Project Team worked with CHFWCNY to develop an overall approach, set of methods, and a work plan that was responsive to the needs of the Foundation and that would allow the project to achieve its goals and objectives. The work plan was divided into three distinct goal areas Access, Consumer Experience, and Information Technology, which mirrored the major components of the Foundation’s request for proposal. The following is a brief review of the major components of our approach. A. ACCESS - Describe the Safety-Net and Assess its Capacity and Strength
With respect to access, the Project Team identified and described the primary care safety-net and assessed its ability to provide adequate, accessible, high quality services to low income, underserved children and their families. In identifying the safety-net the Project Team made significant efforts to isolate the primary medical, oral and behavioral health care providers that serve substantial numbers of low income, uninsured, underserved, and otherwise vulnerable segments of the population. More specifically the Project Team worked to identify community health centers, hospital-outpatient clinics, residency clinics, public health department clinics, hospital emergency rooms, urgent care centers, and private physicians that served significant numbers of Medicaid1 insured and low income, uninsured and underinsured populations, especially children. The overall assessment was not designed to facilitate a full primary care safety-net inventory but rather to identify key players and describe the safety-net’s basic structure and strengths. While the Project Team is confident that it has captured the major safety-net providers it is possible, that the Team’s efforts have not uncovered all of the primary care providers that play an important role in the safety-net. 1. Categories of Safety-Net Providers To assist in describing the western New York safety-net, the JSI Project Team worked with CHFWCNY staff to identify and categorize key safety-net providers. These efforts began during the initial round of key informant interviews and were an on-going activity throughout the project. Ultimately, organizations and providers were grouped in three categories. These categories simply distinguish how each provider participates in the region’s health care safety-net; all providers are critical to continuing to ensure and expand access to low-income children and their families. In fact, as will be discussed in more detail in later sections of this report, all providers and organizations in western New York that serve low income children and their families are critical to assuring access to care in the region. The following are the safety-net provider categories that are being used in this assessment.
• Core Safety-Net Providers. For purposes of this project, a core safety-net provider is either a health care organization that provides comprehensive primary medical care services or is an organization that provides comprehensive outpatient mental health, substance abuse, or dental services. Core primary medical care providers strive to serve
1 In this report, Medicaid is used to refer all-inclusively to both Medicaid and SCHIP Programs including Child Health Plus and Family Health Plus.

Western New York Safety-Net Assessment John Snow, Inc.
22
as a patient’s medical home, as defined by the Commonwealth Fund2. In the Commonwealth Fund’s definition, a medical home is characterized by : o A regular doctor or source of care o Easy access to the provider by telephone o Easy access to health advice on evenings and weekends or whenever the provider is
closed o Visits with the provider that occur conveniently for patients, are on time and are
efficient
Core safety-net provider must also be guided by an explicit funding policy, a public policy mandate, or some intractable mission to serve low income, Medicaid insured, and uninsured populations. Core providers do not limit the proportion of Medicaid patients they serve and have explicit policies to serve people without regard for their ability to pay. Policies related to the uninsured/underinsured typically include a sliding fee scale that defines specific discounts based on ones household income and family size. Some core safety-net providers may have a policy to provide free care to low income uninsured patients. Furthermore, core providers actively promote these policies and make efforts to reduce barriers to access for those with limited or no means to pay for services.
• Essential Safety-Net Contributors. An essential contributor to the safety-net is a health
care organization or provider of primary medical care, oral health or behavioral health services to large proportions and/or large numbers of people insured by Medicaid, as well as some uninsured/underinsured patients. These organizations may provide services to those who are uninsured on a discounted basis but do so on an individual basis without any explicit mandate or mission. These providers often put caps on the proportion of Medicaid or uninsured patients they serve and many do not have sliding fee scales that are applied across the board without exception. The Project Team also includes in this category, organizations that meet the definition of “core” above in terms of mission and policies on the uninsured, but provide services on a limited part-time basis.
• Other Contributing Providers. Organizations and providers in this category are
important contributors to the safety-net but typically provide only a small amount of services to those insured by Medicaid and an even smaller portion to those who are low income and uninsured. These organizations are usually private providers who simply do not have the infrastructure or financial means to serve large numbers of low income uninsured or Medicaid patients. They often put caps on the proportions of patients they serve in these groups, do not have a formal sliding fee scale, and do not self-identify as a safety-net provider.
One of the main objectives of this categorization process was to identify providers in western New York that are key to preserving and strengthening the safety-net. The categorization is not meant to diminish the importance or impact that providers across all of the categories have on low income children and their families. The unfortunate reality is that organizations and providers that do not receive outside grants or otherwise have access to financial resources 2 There are myriad definitions of the term “Medical Home”. JSI selected the Commonwealth Fund definition for this project.

Western New York Safety-Net Assessment John Snow, Inc.
23
specifically dedicated to providing uncompensated care are limited in their ability to serve uninsured, underinsured and Medicaid patients. As a result, their participation in the safety-net is fragile and may be dependent on the good will or financial support of another organization like a hospital or parent agency; support that may be reduced or withdrawn at any time. 2. Approach to Data Collection In order to focus the project’s resources, the JSI Project Team concentrated on identifying and collecting information from providers and organizations that are part of the core safety-net. Secondarily, the Project Team worked to define the role of the other types of providers that contribute to the safety-net. As will be discussed later on in this report, the western New York safety-net relies heavily on providers that are not among the core of the safety-net as defined above. The Project Team developed a multi-pronged approach to collecting data with respect to assessing access and addressing this portion of the assessment.
• Key Informant Interviews. At the outset of the project, the JSI Team conducted 57 key informant interviews with leading health and public health stakeholders through out the region. These interviews were organized by county and allowed the Project Team to: begin to identify key elements of the safety-net; understand the environmental and political context of the region; gather information regarding the region’s major health and policy issues; and begin to identify strengths and gaps in the western New York safety-net. These interviews allowed the Project Team to develop a richer understanding of the regions health care system and facilitated the Project Team’s data collection efforts in other parts our approach. Finally, these initial interviews helped to ensure that key stakeholders were engaged in the process from the outset.
• Site Visits with Safety-Net Providers. The Project Team conducted site visits with all
identified primary medical care providers that fell within the category of core safety-net providers. Many parts of the region, however, do not have organizations or providers that fall within the project’s definition of the core safety-net. In these areas, the Project Team visited providers and organizations that key informants identified as essential contributors to the safety-net. Efforts were made to select sites that were geographically representative of the eight county region as well as representative of the different types of providers that made up the area’s safety-net for children. A listing of the 13 provider organizations that were visited is included in Appendix A.
Site visits were conducted by the JSI Project Team and included a series of on-site interviews with key administrative and clinical staff, a clinic walk-thru, and a standard data request that was completed and returned to JSI at a later date. The purpose of these site visits was to gather information on the services provided, the site’s staffing profile, the characteristics of the patient’s served, the organization’s capacity, its role in the safety-net for children, as well as information on the site’s resource needs and major challenges. The site visits also allowed the Project Team to gather information on the site’s physical, clinical, and administrative infrastructure as well as to generally assess the
Western New York Safety-Net Assessment John Snow, Inc.
24
extent to which the site applied evidence-based, patient-centered, integrated, well coordinated services. Finally, the site visits allowed the Project Team to gather insights from key providers on how CHFWCNY could best support them in their efforts to expand access to services and strengthen their ability to serve low income children and their families. To ensure that a standard set of information was collected at each of the sites, the visits were guided by a site visit protocol. The Site Visit Protocol is included in Appendix B.
• Interviews with Other Providers Contributing to the Safety-Net. In addition to the
site visits, the Project Team conducted a series of more than 20 phone or face-to-face interviews with other providers, including private physician practices, hospital-based practices, behavioral health providers, oral health providers, and hospital emergency room staff. These interviews were less comprehensive than the site visit interviews but allowed the Project Team to further define the safety-net, confirm its findings from the key informant interviews and site visits, and gain a better understanding of the role that these provider organizations play in the safety-net. Once again, these interviews were guided by a structured interview guide.
• Identification and Review of Private Physicians and their Impact. In conducting this
work CHFWCNY was interested in better understanding the role that private physicians play as part of the safety-net for children. The Project Team worked with CHFWCNY to explore how the project could best address this question within the scope and resources of the project. The Project Team decided to address these questions via existing secondary datasets and leverage existing primary data collection efforts. To identify significant Medicaid providers in the region data was requested from the State Medicaid Office. The request will not be fulfilled by the State Medicaid Office in time to incorporate the data into the analysis. Once this information has been compiled, the Project Team will review the information and issue a supplemental report.
In addition to Medicaid data, CHFWCNY was also able to connect the JSI Project Team with the University at Buffalo Primary Care Research Institute and the Upstate New York Practice Based Research Network (UNYNET)3 to explore the potential of partnering on a related survey project that UNYNET was implementing. More specifically, in the Fall of 2007, UNYNET, under the direction of John Taylor, surveyed primary care physician practices (family practice physicians, pediatricians, general practitioners, internal medicine physicians, obstetricians, and gynecologists) in the western New York region to assess their level of engagement and interest in issues related to quality improvement. After some discussions in the summer of 2007, Mr. Taylor graciously agreed to include a number of questions related to this project on their physician survey. The questions were designed to assess the role that primary care physician practices play as part of the western New York safety-net.
3 The UNYNET is a Primary Care Practice Based Research Network (PBRN) that is administered by the UB Primary Care Research Institute within the SUNY at Buffalo Department of Family Medicine to study issues of importance to primary care practice. The mission of UNYNET is to rapidly improve patient care by translating research into practice and by involving practices in research.

Western New York Safety-Net Assessment John Snow, Inc.
25
UNYNET is in the process of analyzing the full dataset but in the meantime has provided the JSI Project Team with a preliminary copy of the dataset so that the information collected from physician practices, particularly related to the safety-net, could be incorporated into this report. The JSI Project Team would like to thank UNYNET for its considerable efforts and for its willingness to support this safety-net assessment initiative. The following is the list of questions that were added to the survey as well as a brief discussion on the limitations of the data collected. Findings from a review of the data are incorporated later in the report. Safety-Net Questions 1. Does your physician practice accept uninsured patients and, if yes, does the uninsured patient
population represent more or less than 5% of your total patient population?
2. Does your physician practice accept HMO Medicaid patients, and, if yes, does the HMO Medicaid patient population represent more or less than 10 % of your total patient population?
3. Does your physician practice accept FFS Medicaid patients, and, if yes, does the FFS Medicaid patient population represent more or less than 30% of your total patient population?
4. Does your physician practice accept patients regardless of their ability to pay?
5. Does your physician practice implement a sliding fee scale for patients who are uninsured?
Limitations of the Data UNYNET distributed 607 surveys. Of the 607 physician practices surveyed, 36 of the practices were closed, and 236 (41%) responded to the survey. Of the 236 respondents, 155 (27%) of the practices were willing to have their data shared with an outside entity like JSI. Many of the physicians who responded and consented to have their data shared did not complete all of the safety-net specific questions. Response rates on a question by question basis range from approximately 20% to 27% depending on the question. As a result, it is not possible at this time to confidently generalize the analytic findings to the overall population of physician practices. Nonetheless, the Project Team believes the dataset does contribute to understanding the safety-net in western New York. Most helpful is that the survey identifies many private providers that play a significant role in the safety-net for children and should be involved in CHFWCNY’s efforts to strengthen the safety-net.

Western New York Safety-Net Assessment John Snow, Inc.
26
B. CONSUMER EXPERIENCE – Assess Consumer’s Experience with their Primary Care
The Project Team was charged with assessing the experience of western New York safety-net users/consumers related to primary care services. More specifically, this component of the project explored whether consumers throughout the region felt they had access to a reliable and consistent source of primary care, the extent to which consumers perceive service gaps or barriers to access, and the experience consumers have when seeking care. For this component of the project, the Project Team developed a survey methodology that collected information from two distinct samples of consumers: 1) consumers waiting for services in primary care provider offices who were already affiliated with a primary care provider and 2) consumers served in various other community venues whose status related to safety-net utilization were unknown. To collect primary data from consumers, the Project Team: developed a validated consumer survey; the Western New York Children’s Access Survey (WNYCAS). JSI hired and trained a group of eight University at Buffalo Department of Psychology undergraduate and graduate students to administer the survey; recruited dozens of health clinics and community-based organizations who agreed to allow the research assistants access to their consumers; and compiled and analyzed the survey data. A detailed description of the survey methods and a copy of the survey instrument are included in Appendix E, however, the following is a brief review of some of its key elements. • Overall Approach and Recruitment of Survey Sites. Given the large geographic area, the
diverse population base, and project resources, the Project Team developed a methodology that relied on a convenience sampling approach. As stated above, surveys were collected from two population groups; those who were already engaged in care at one of the identified safety-net provider sites as well as those who were not necessarily engaged in care that were collected through an array of other community venues. Surveys were collected from a representative sample of primary care clinics and other community venues. Great care was taken to recruit an array of venues that would help to ensure that the survey sample was representative of the low income target population geographically, demographically, and socio-economically. Data collection sites were chosen from throughout the eight county region and a variety of different types of service organizations participated. A listing of all of the data collection sites is included in Appendix E.
• Survey Development. The WNYCAS was primarily developed by drawing questions from
existing state and national health surveys. This was done to help ensure that questions were valid and reliable and that western New York results could be compared or benchmarked against state and national comparison data to facilitate a richer analysis. Where existing questions were not available to address specific issues of interest to CHFWCNY, JSI used questions similar to questions from previous JSI surveys that had provided useful information.
• Administration of Survey. The survey was designed as a respondent-administered survey.
However, the University at Buffalo Department of Psychology research assistants who assisted with the survey, received extensive training on how to approach potential respondents, obtain proper consent, and answer respondent questions, as well as on how to

Western New York Safety-Net Assessment John Snow, Inc.
27
administer the survey to those who required assistance. The surveys were administered either in provider or community center waiting rooms or in some other designated area to ensure confidentiality when appropriate. The survey was translated into Spanish and a number of the research assistants spoke Spanish-fluently. Research assistants were also prepared to link respondents to translators for other languages, if necessary.
• Data Management and Analysis. The data management and analysis phase was facilitated
using a specialized survey research tool called Teleform. Teleform is a survey research tool that assists in both survey development and data management. Teleform facilitates automated scanning and data cleaning as well as the development of an electronic database. The analysis was conducted using SPSS and other statistical software programs that facilitated a rigorous analysis and thorough reporting of survey results. Data files are available in both SPSS and ACCESS by contacting CHFWCNY.
C. INFORMATION TECHNOLOGY - Determine the Health Information Technology
(HIT) Capacity of Safety-Net Providers
With respect to health information technology, the Project Team was charged with delineating the baseline information technology (IT) capacity of western New York’s core safety-net providers. In addition, the Project Team set out to compare the IT capacity of western New York’s safety-net to the capacity that is typically seen statewide or nationally. Finally, the Project Team was charged with providing guidance on the types of initiatives or best practices that could be explored in order to improve the IT capacity of the safety-net in western New York. The Project Team used the site visits to collect basic information on the IT systems that were either currently in place or in the process of being implemented. In addition, the Project Team conducted a series of face-to-face and telephone interviews with a selected group of five safety-net providers to collect more in-depth information on capacity as well as to refine the Project Team’s understanding of the needs, challenges, and IT potential of the region’s providers. The Project Team also developed a review of national initiatives that CHFWCNY and providers in western New York could draw from as they work to develop initiatives to strengthen the region’s capacity and application of IT resources. D. BENCHMARKING In addition to describing the safety-net and consumer experiences, CHFWCNY also requested that JSI establish baseline determinations of the availability of adequate access to primary medical, behavioral and oral health care compare the baseline to national benchmarks. Benchmarks and comparison data are provided as follows:
• National Benchmarks for Access: The benchmarks used to compare access to primary care in western New York with national standards are the DHHS Health Resources and Services Administration’s (HRSA) calculations of Health Professional Shortage Areas (HPSA) and indices of Medically Underserved Areas (MUA) and Medically Underserved Populations (MUP). HPSAs are calculated based on provider to population

Western New York Safety-Net Assessment John Snow, Inc.
28
ratios for primary medical care, oral health and mental health.4 The population ratios defining these designations are as follows:
o Primary care shortage area ratio: Ratio of population to full-time-equivalent primary medical care providers is at least 3,500:1 or greater than 3,000:1 in areas of high need
o Oral health shortage ratio: Ratio of population to full-time-equivalent dentist is at least 5,000:1 or greater than 4,000:1 in areas of high need
o Mental health shortage ratio: Ratio of population to core mental health professional greater than 6,000:1, and population to psychiatrist ratio of 20,000:15
If a shortage is determined, a score is assigned indicating the severity of the shortage. Western New York has 12 primary care HPSAs, 6 Mental Health HPSAs and 6 Dental HPSAs (This excludes designations for correctional institutions). MUAs and MUPs are indices calculated based on the percent of people in poverty, percent elderly, percent infant mortality and primary care provider ratios for an area of specific population group. Western New York has 16 MUAs and 0 MUPs currently designated. A chart included later in this report identifies the specific HPSAs, MUAs and MUPs in western New York. However, it is highly likely that many more areas or population groups in the region are eligible for these designations.
• Emergency Department Utilization as a Proxy for Access: Utilization of hospital
emergency departments (ED) for non-emergent conditions and/or conditions that could be treated in a primary care setting (ambulatory care sensitive conditions) is often considered a proxy measure for the adequacy of a primary care system in an area. The New York University (NYU) Center for Health and Public Service Research and the United Hospital Fund of New York have jointly developed a classification system for emergency department use6,7,8, by examining ICD-9 codes that were associated with primary care sensitive or emergent conditions for visits that do not result in an in-patient admission. Based on ICD-9 codes, they classified four categories of patients: 1) Non-emergent - The patient's initial complaint, presenting symptoms, vital signs, medical history, and age indicated that immediate medical care was not required within 12 hours; 2) Emergent/Primary Care Treatable - Based on information in the record, treatment was required within 12 hours, but care could have been provided effectively and safely in a primary care setting. The complaint did not require continuous observation, and no
4 HRSA Bureau of Health professions. Shortage Designation http://bhpr.hrsa.gov/shortage/ 5 The ratios for mental health also include designations based on core mental health professional only (6,000:1) or population to psychiatrist only (30,000:1). The thresholds are lower for all categories if the area has unusually high needs for mental health services. 6 Billings J, Parikh N, Mijanovic T. Emergency Department Use in New York City: A Substitute for Primary Care? The Commonwealth Fund, March 2000. 7 Billings J, Parikh N, Mijanovic T. Emergency Room Use: The New York Story. The Commonwealth Fund, November 2000. 8 Billings J, Parikh N, Mijanovic T. Emergency Department Use in New York City: A Survey of Bronx Patients. The Commonwealth Fund, November 2000.

Western New York Safety-Net Assessment John Snow, Inc.
29
procedures were performed or resources used that are not available in a primary care setting (e.g., CAT scan or certain lab tests); 3) Emergent - ED Care Needed - Preventable/Avoidable - Emergency department care was required based on the complaint or procedures performed/resources used, but the emergent nature of the condition was potentially preventable/avoidable if timely and effective ambulatory care had been received during the episode of illness (e.g., the flare-ups of asthma, diabetes, congestive heart failure, etc.); and 4) Emergent - ED Care Needed - Not Preventable/Avoidable - Emergency department care was required and ambulatory care treatment could not have prevented the condition (e.g., trauma, appendicitis, myocardial infarction, etc.).
The researchers have developed an algorithm publicly available online9 for organizations to use for their own research purposes. The Project Team obtained 2005 emergency department utilization data from the New York State Department of Health’s Statewide Planning and Research Cooperative System (SPARCS) dataset10 and applied this algorithm to determine an estimation of inappropriate emergency department utilization for primary care in western New York. While JSI could not identify national benchmarks defining appropriate levels of emergency department utilization for children, the Team is able to compare utilization in western New York with the State of New York overall and with other states that have used the same methodology.
• Western New York Consumer Responses Compared to National Data: The Project
Team compared responses on the consumer survey to national data in order to benchmark the western New York consumer experience. The four national surveys that the consumer survey is benchmarked to are the National Survey of Children’s Health (NSCH), The Commonwealth Fund 2006 Health Quality Survey, The Centers for Disease Control and Prevention (CDC) Behavioral Risk Factor Surveillance System (BRFSS) and the Pew Health Care Internet Survey.
The National Survey of Children’s Health (NSCH) was the primary source for questions for the Western New York Children’s Access Survey (WNYCAS).The NSCH survey reports public national and New York State data on children’s access to care. The survey was distributed in 2003 by the Maternal and Child Health Bureau of the Health Resources and Services Administration. The survey encompasses children age 0-17 and was distributed by phone to 102,353 children nationwide. The NSCH survey covers many dimensions of children’s health including family interactions, parental health, physical and emotional health, health access, and after school experiences. The questions for the WNYCAS were pulled primarily from the health access and medical home section of the survey. The Commonwealth Fund 2006 Health Quality Survey was a secondary source for questions. The Commonwealth Fund Survey was a phone based survey conducted in 2006 of 3,535 adults. The survey targeted understanding qualitative dimensions of what constitutes a medical home and is comprehensive in looking at patient communication
9 http://wagner.nyu.edu/chpsr// 10 http://www.health.state.ny.us/statistics/sparcs/

Western New York Safety-Net Assessment John Snow, Inc.
30
with providers. The questions pulled from this survey for the WNYCAS are those that focus on communication with providers in terms of access and satisfaction. The definition of medical home11 in this survey is also the one JSI selected to use in this assessment.
A smaller number of questions were pulled from the BRFSS and the Pew Health Care Internet Survey. The BRFSS survey is an annual survey conducted by the CDC that interviews 350,000 adults. The survey covers health status, health risk factors, and access to care. The question on health insurance access from the BRFSS was used as a benchmark for parent’s access to insurance in the WNYCAS. The Pew Health Care Internet Survey was a phone survey of approximately 12,000 adults conducted in 2000 to understand how people are using the internet for health information. Two questions were used from this survey to look at how families in western New York use the internet in addition to traditional sources for health information.
11 This report is using the Commonwealth Fund’s definition of medical home defined as: a regular doctor or source of care, easy access to the provider by telephone, easy access to health advice on evenings and weekends or whenever the provider is closed, and visits with the provider that occur conveniently for patients, are on time and are efficient

Western New York Safety-Net Assessment John Snow, Inc.
31
IV. FINDINGS RELATED TO THE STRUCTURE OF THE SAFETY-NET AND
ACCESS A number of common themes describe the structure, capacity and strength of western New York’s safety-net. However, there is also considerable variation among providers and across the region. In order to improve the safety-net’s capacity to serve more people, more effectively and efficiently, the Project Team believes it is important to articulate both common themes and variations. First, this section includes a discussion of overarching themes that emerged from the assessment and that apply either throughout the region, to major geographic segments of the region, or to certain groups of providers. Included in this section is a discussion of the common themes with respect to how the safety-net is structured, the specific types of providers that make up the safety-net, and existing service gaps, as well as with respect to the major strengths and weaknesses of the safety-net. Second, this section includes a summary description of the safety-nets in each county within the region. The Project Team elected to use counties to describe the safety-net in western New York because: western New York is geographically expansive and has diverse communities making a discussion of the region as a whole potentially overwhelming; most data about the population is available on a county basis, as are several benchmarks and comparison data the Team is using; important unique considerations within several counties must be taken into consideration to strengthen and enhance the safety-net throughout the region. The Project Team understands that for many services, county lines do not influence how people access primary care services. Movement within and across the region is noted to the extent it was revealed through interviews and site visits. Finally, the county descriptions were significantly influenced by the people the Project Team interviewed. Intentionally, the county descriptions are not the same, but rather reflect the key themes that emerged from the interviews. A. Common Themes Across the Region
1. Assessment of Safety-Net’s Strengths based on the IOM Core Competencies CHFWCNY draws from the Institute of Medicine’s (IOM’s) core competencies for 21st century health care to clarify and guide its work related to the safety-net. These core competencies describe an approach that health care providers should take in providing care. According to this approach: (Institute of Medicine, 2001)
“All health professions should be educated to deliver patient centered care as members of an interdisciplinary team, emphasizing evidence-based practice, quality improvement practices, and informatics.”
The Project Team applied the basic tenets of this approach in assessing the strength and the overall quality of care provided by the safety-net in western New York. Through its key informant interviews, site visits, and other provider interviews, the Project Team collected a significant amount of information regarding the strength of western New York’s safety-net for children. It should be noted, however, that the Project Team’s methodology was not designed to

Western New York Safety-Net Assessment John Snow, Inc.
32
conduct a rigorous site-by-site analysis. That would have required much more extensive data collection efforts and would have been burdensome on provider organizations. The Team believes that the methods that were applied provide ample information to assess in general terms the extent to which the IOM’s standards are applied in western New York and more specifically how CHFWCNY can work with providers to expand these ideas. Overall, based on our interviews and site visits, the Project Team was not able to identify any safety-net provider organizations in western New York that had the resources or experience to apply the IOM core competencies in a comprehensive fashion. Certainly, some provider organizations have successfully integrated one or two of these ideas into their operations and approach to care, which is a significant accomplishment. However, except for a number of notable exceptions, the Project Team found that most providers had not invested a great deal of resources to address these competencies. This is not due to any lack of commitment or desire, but rather, in most cases, a lack of resources, management capacity, and institutional support to manage the day-to-day operations of these efforts. Most safety-net providers simply do not have the ability to focus their efforts on these issues given the demands they face and their limited resources.
• Design of Patient Centered Care. Overall the Project Team did not observe that safety-net providers were investing time or resources to promote patient-centered care in the way defined by the IOM. The fact that many patients use emergency rooms is perhaps the most significant evidence of the limitations in this regard. Also, the limited availability of providers after normal business hours reflects a lack of orientation to the patient’s needs. While a great deal of macro-level planning goes on within the rural counties through the Rural Health Networks, there seems to be limited collaboration between providers, and regardless, the planning that does occur does not seem to trickle down to the patient-level. The Project Team saw limited evidence of care coordination and communication between health and social service provider organizations. This lack of communication and collaboration, in many areas, was palpable and there was a sense that many health and social services providers, both within and certainly across disciplines, operate in virtual silos that do not encourage or facilitate communication and information sharing. Thus the patient is left to navigate the system on their own.
• Utilization of Interdisciplinary Teams. In Buffalo there are many good examples of primary care and specialty care service integration and the use of interdisciplinary, co-located teams. For example, a number of the core safety-net providers in Buffalo have integrated their primary care operations with behavioral health and dental operations in a co-located fashion, which works to promote access and reduce barriers to care. There are also good examples of co-located or enhanced referral, interdisciplinary programs involving primary care providers and providers at the hospitals. This is true with respect to the residency programs, which enjoy very strong relations with the hospitals and the University at Buffalo. It is also true of many of the programs serving developmentally disabled clients which have implement many programs to ensure their clients have access to comprehensive primary care services.
In the rural areas of western New York, the examples of interdisciplinary teams are more limited but they do exist, particularly among the larger, multi-service clinics. More

Western New York Safety-Net Assessment John Snow, Inc.
33
specifically, as in Buffalo, there are a number of good examples of integrated primary care, behavioral health, and dental programs. The fact that services or service providers are co-located or part of hospital-owned, vertically and horizontally integrated provider networks does not necessarily mean that care is being integrated or that interdisciplinary teams are working well together. There is a lot that could be done to ensure that these models are well-functioning and that appropriate sharing of information and expertise is occurring. However, in this regard there seems to be a reasonable foundation to start from.
• Utilization of Health Information Technology (HIT). The HIT capabilities of the
safety-net are discussed in greater depth in later sections of this report. In general, the network of core and essential safety-net providers interviewed in this project are underutilizing HIT relative to private sector, non-safety-net providers nationally but have comparable HIT capacity of their safety-net peers. The exceptions to this statement are the safety-net providers in the region that are affiliated (formally or informally) with larger health care systems such as the University at Buffalo and/or the region’s major hospitals.
With respect to HIT infrastructure, most of the larger, affiliated safety-net providers had
significant HIT infrastructure and capacity. Many had electronic medical records (EMRs), as well as dedicated HIT and QA coordinators. The independent, community-based safety-net providers generally do not have the same robust HIT infrastructures because of limited technical and human resources and/or financial constraints. However, JSI’s most significant finding is that even among those that do have robust HIT infrastructure, such as EMRs or chronic disease registries, most are not utilizing these systems to their full potential. With a few exceptions, there was limited evidence that many safety-net providers had made efforts or committed resources to develop a clear culture that appreciated the importance and the intrinsic value of data and HIT. Furthermore, many sites with relatively new or pending EMRs do not have the resources to fully train their staff to take advantage of all their system’s functionality. Finally, it is not clear that sites are dedicating the appropriate clinical and administrative staff time to manage quality improvement programs supported by HIT. There also appears to be limited participation in regional efforts taking place in Buffalo and western New York around electronic health information exchange (HIE). While several provider groups interviewed are sitting on regional steering committees or boards for these HIEs, they are there primarily as observers with limited clarity on the potential benefits to their patients and organizations of actively exchanging information with local and regional health partners. There appears to be a need to better define the benefits of their participation.
While it is perhaps obvious, it is important to note that just establishing HIT is not the end goal; rather, HIT is the means through which a provider can improve operational efficiencies, support informed decision making, effectively advocate for community and

Western New York Safety-Net Assessment John Snow, Inc.
34
patient needs, and ultimately improve patient and community health outcomes.12 In JSI’s assessment, safety-net providers in western New York would greatly benefit from assistance and resources that enhance their ability to use HIT in ways that would allow them to improve their capacity and better assess the quality of services. These efforts would also allow safety-net providers to more fully address other of the IOM competencies discussed in this section.
• Application of Quality Improvement Strategies. Central to the notion of quality and performance improvement is the tenet that decisions regarding the appropriate type and approach to patient care will be supported by evidenced-based protocols and linked to specific data that is consistently collected, analyzed and utilized in a timely and accurate way. These efforts should be guided by a dedicated quality improvement committee or champion to ensure that efforts are given the appropriate weight and properly managed. Our interviews and sites visits identified a number of safety-net sites that had quality improvement champions and were engaged in formal, data-driven quality improvement activities. For example, the Federally Qualified Health Centers (FQHC) are required to implement some form of quality improvement activities, typically have quality improvement committees and apply continuous quality improvement-type activities. The hospital-affiliated organizations, including the Family Practice and Pediatric Residency Programs, also have formal quality improvement infrastructures that facilitate these activities. However, other than these institutions there was limited evidence of other organizations that had extensive, formal, or on-going quality improvement programs.
The effective quality improvement activities that are taking place are typically focused around specific chronic diseases (e.g., diabetes, asthma), specific clinical measures (e.g., immunizations, first-trimester prenatal care), or on basic clinic operations (e.g., no show rates, wait-times, and patient flow). For example, a number of sites, such as the Community Health Center of Buffalo and Oak Orchard Community Health Center, have participated in the Bureau of Primary Health Care’s (BPHC), Health Disparities Collaboratives (HDC) for Diabetes. All of the formal quality improvement activities identified foster collaboration across clinics or organizations and facilitate the development of data-driven, continuous quality improvement activities. More specifically, these activities allow providers to explore specific operational changes that could improve clinic efficiency and patient outcomes. Perhaps more importantly, these activities are a way for clinics to build capacity, knowledge, and buy-in among staff on the value and the importance of data and HIT. As alluded to above, clinic organizations need to create cultures that fully embrace and appreciate the power of HIT and quality improvement.
• Employment of Evidence-Based Practices. Based on our interviews and site visits, a
number of provider organizations have prioritized the management of diabetes, asthma, and other chronic medical conditions as part of their operational strategies. As a result, these organizations have applied evidenced-based disease management protocols to track,
12 Wired for Change: Strengthening Community Clinics Through Collaborative Information Technology. Prepared for the Community Clinics Initiative by BTW CONSULTANTS, INC. Kim Ammann Howard, Ellen Irie, Kris Helé, and Fay Twersky. www.communityclinics.org
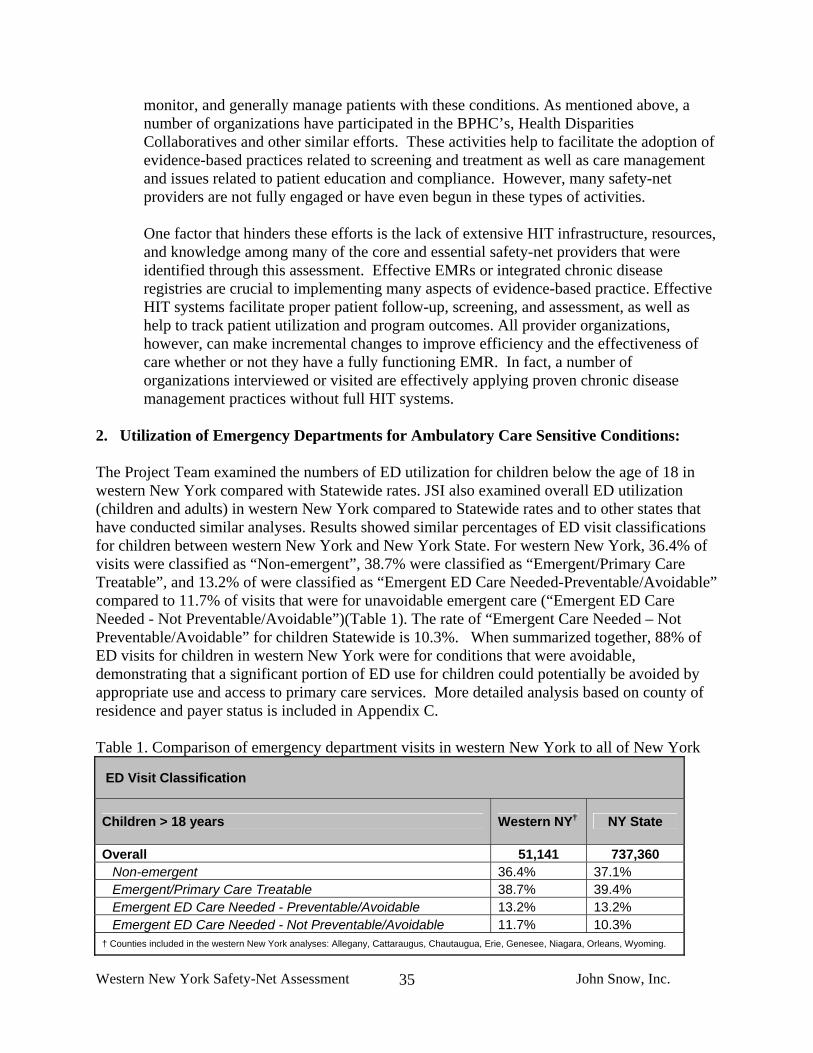
Western New York Safety-Net Assessment John Snow, Inc.
35
monitor, and generally manage patients with these conditions. As mentioned above, a number of organizations have participated in the BPHC’s, Health Disparities Collaboratives and other similar efforts. These activities help to facilitate the adoption of evidence-based practices related to screening and treatment as well as care management and issues related to patient education and compliance. However, many safety-net providers are not fully engaged or have even begun in these types of activities.
One factor that hinders these efforts is the lack of extensive HIT infrastructure, resources, and knowledge among many of the core and essential safety-net providers that were identified through this assessment. Effective EMRs or integrated chronic disease registries are crucial to implementing many aspects of evidence-based practice. Effective HIT systems facilitate proper patient follow-up, screening, and assessment, as well as help to track patient utilization and program outcomes. All provider organizations, however, can make incremental changes to improve efficiency and the effectiveness of care whether or not they have a fully functioning EMR. In fact, a number of organizations interviewed or visited are effectively applying proven chronic disease management practices without full HIT systems.
2. Utilization of Emergency Departments for Ambulatory Care Sensitive Conditions: The Project Team examined the numbers of ED utilization for children below the age of 18 in western New York compared with Statewide rates. JSI also examined overall ED utilization (children and adults) in western New York compared to Statewide rates and to other states that have conducted similar analyses. Results showed similar percentages of ED visit classifications for children between western New York and New York State. For western New York, 36.4% of visits were classified as “Non-emergent”, 38.7% were classified as “Emergent/Primary Care Treatable”, and 13.2% of were classified as “Emergent ED Care Needed-Preventable/Avoidable” compared to 11.7% of visits that were for unavoidable emergent care (“Emergent ED Care Needed - Not Preventable/Avoidable”)(Table 1). The rate of “Emergent Care Needed – Not Preventable/Avoidable” for children Statewide is 10.3%. When summarized together, 88% of ED visits for children in western New York were for conditions that were avoidable, demonstrating that a significant portion of ED use for children could potentially be avoided by appropriate use and access to primary care services. More detailed analysis based on county of residence and payer status is included in Appendix C. Table 1. Comparison of emergency department visits in western New York to all of New York
ED Visit Classification
Children > 18 years Western NY† NY State
Overall 51,141 737,360 Non-emergent 36.4% 37.1% Emergent/Primary Care Treatable 38.7% 39.4% Emergent ED Care Needed - Preventable/Avoidable 13.2% 13.2% Emergent ED Care Needed - Not Preventable/Avoidable 11.7% 10.3%
† Counties included in the western New York analyses: Allegany, Cattaraugus, Chautaugua, Erie, Genesee, Niagara, Orleans, Wyoming.

Western New York Safety-Net Assessment John Snow, Inc.
36
In addition, while JSI could find no national benchmarks or estimates of this data, several states have used this algorithm to estimate state specific numbers of ED usage patterns and have found similar results13(Table 2 and Table 2a). These results underscore the importance of the availability of primary care resources and highlight that access to primary care services are pervasive throughout the country. Table 2. Comparison of emergency department visits in western New York to five other states.
Percent of ED visits that fall into each classification
All Ages Non-emergent Emergent/ Primary Care Treatable
Emergent ED Care Needed - Preventable/
Avoidable
Emergent ED Care Needed - Not Preventable/
Avoidable
Western NY† (n=239,776) 35.1% 35.2% 11.8% 17.9%
NY State (n=2,732,613) 36.9% 35.2% 11.3% 16.7%
Utah (n=315,217) 35.9% 34.2% 9.7% 20.1%
Tennessee (n=1,283,738) 37.6% 34.6% 9.7% 18.1%
Maryland (n=1,138,500) 36.6% 34.9% 11.1% 17.4%
New Jersey (n=1,395,321) 35.9% 36.1% 17.3% 10.7%
Arizona (n=91,409) 34.4% 36.1% 11.5% 18.0% † Counties included in the western New York analyses included: Allegany, Cattaraugus, Chautauqua, Erie, Genesee, Niagara, Orleans, and Wyoming. N=number of encounters
13To keep consistent with the New York state analysis, JSI excluded additional categories (including visits for drug/alcohol, injuries and psychiatric issues) from state reports and recalculated percentages, thus percentages in the reports may not be consistent with those listed in the reports. Utah: Office of Health Care Statistics, Utah Department of Health. Utah Health Status Update: Primary CareSensitive Emergency Department Visits, June 2004. Available at: http://health.utah.gov/opha/ publications/hsu/0406_ED_Visits.pdf. Tennessee: Miller, Pope, Change. Non-Urgent ED Use in Tennessee, 2004. University of Memphis, September 2007. Available at: http://healthecon.memphis.edu/Documents/ED/TN%20Non-Urgent%20ED%20Issue%20Brief%202004.pdf Maryland: Barclay, P. Public Policy Forum: Impact of Emergency Department Use on the Health Cares System in Maryland. June 7, 2007. New Jersey: Delia, D. Potentially Avoidable Use of Hospital Emergency Departments in New Jersey, July 2006. Available at: http://www.cshp.rutgers.edu/Downloads/6330.pdf. Arizona: St. Lukes Health Initiatives. Fact and Fiction: Emergency Department Use and the Health Safety Net in Maricopa County, Phoenix, AZ, April 2004. Available at: http://www.slhi.org/publications/studies_research/pdfs/Fact_and_Fiction.pdf.

Western New York Safety-Net Assessment John Snow, Inc.
37
Table 2a. Total non-emergent/emergent primary care treatable or avoidable and emergency ED care needed not preventable or avoidable ED visits
Percent of ED visits that fall into each classification
All Ages Total Encounters Non-Emergent/
Emergent Primary Care Treatable or
Avoidable
Emergent ED Care Needed – Not Preventable/
Avoidable
Western NY† 239,776 82.1% 17.9%
NY State 2,732,613 83.3% 16.7%
Utah 315,217 79.9% 20.1%
Tennessee 1,283,738 81.9% 18.1%
Maryland 1,138,500 82.6% 17.4%
New Jersey 1,395,321 89.3% 10.7%
Arizona 91,409 82.0% 18.0% † Counties included in the western New York analyses included: Allegany, Cattaraugus, Chautauqua, Erie, Genesee, Niagara, Orleans, and Wyoming.
3. Identified Needs to Strengthen the Safety-Net
One of the issues that was addressed at length in the key informant interviews, provider site visits, and other provider discussions was the resource needs of safety-net providers that would contribute to strengthening the safety-net. Key informants and provider organizations were asked what resources were most needed to strengthen their ability to expand capacity and improve the services that they provide to low-income populations. Overall, the most common themes in this regard were related to: 1) provider recruitment; 2) technical assistance with respect to improving clinical operations, productivity/ efficiency, chronic disease management, and quality improvement; and 3) the need for small and large capital projects to expand or update physical, administrative and/or IT infrastructure. The following is a review of the information that was collected in this area.
• Workforce Development, Recruitment, and Retention. Nearly across the board primary care safety-net providers in western New York struggle to recruit providers and fill gaps in their clinical staffing. This is particularly true in the rural areas outside of the City of Buffalo, but is also a significant issue in the City of Buffalo. This problem is not unique to western New York. Safety-net providers throughout the country are finding it increasingly difficult to recruit primary care clinicians. However, recruitment in western New York seems to be particularly challenging, given the region’s demographic and socio-economic characteristics, low reimbursement rates for Medicaid and private insurance, and the rural nature of most of the region. At least 7 of the 13 sites that were interviewed and/or visited had at least one vacancy on their clinical staff and many had been working to recruit and fill their vacancies for months or even years. Many of the providers that were interviewed or visited said that there was a great deal of pent-up demand and believed that they could readily expand access to services if they were able to recruit clinical providers.
Western New York Safety-Net Assessment John Snow, Inc.
38
• Technical Assistance. Given the inherent financial challenges related to low reimbursement rates and lack of funding to support services to the uninsured, there is a growing appreciation of the importance of ensuring that operations are functioning as effectively and efficiently as possible. With this in mind, many providers expressed the need for technical assistance to help implement operational changes that would promote greater clinical productivity and effectiveness. More specifically, providers expressed the need for assistance with respect to:
o patient flow re-engineering o improved scheduling and follow-up procedures to reduce no-show rates o development of “open access” or other flexible scheduling systems o improved coding and billing procedures o promotion of streamlined or evidenced-based clinical protocols o implementation of electronic medical record systems.
All of these initiatives would influence the effectiveness and efficiency of clinic operations and help providers and organizations overall to maximize the impact of their limited resources. Providers also said that there was a need to expand case management, outreach, facilitated enrollment, and education services so as to ensure that low income children and families were appropriately engaged in care and received all of the health and social services they needed. Similarly, providers expressed that there was a need for programs that promoted care coordination and service integration, particularly with respect to chronic disease management, mental health/oral health integration, and pharmacy assistance programs. These activities would allow providers to expand capacity/access, reduce barriers to care, and promote higher quality care. More specifically, providers expressed the need for technical assistance or financial resources that would allow them to: implement proven service integration models and hire case managers, outreach staff, health educators, and clinical (chronic disease) care managers.
Finally, providers expressed interest and said there was a need for provider-specific or community-wide (collaborative) quality initiatives similar to what CHFWCNY, HRSA, and the Institute for Healthcare Improvement have been doing with respect to chronic disease. More specifically, providers expressed a desire to work together to develop data monitoring and continuous quality improvement initiatives tailored to specific diseases or clinical operations (e.g., depression, diabetes, asthma, hypertension/heart disease, etc.). One provider also expressed interest in developing broader collaborative initiatives related to the most pressing child health priorities (e.g., immunization, asthma, obesity). In this case a broad group of health and public health stakeholders could be brought together to establish goals, programmatic strategies, and various outcome measures and work together to address various target issues.
• Small and Large Capital Projects. A majority of providers that the Project Team visited
were operating in physical facilities that were either too small or needed substantial renovations. With this in mind, many of the sites expressed the need for financial capital

Western New York Safety-Net Assessment John Snow, Inc.
39
in the form of straight grants, loan guarantees, or favorable loan terms so that they could make the necessary improvements or expand their facilities. In addition, many sites expressed a need for large and small capital investments to update their administrative infrastructures or purchase new equipment. More specifically, sites expressed the need for investments in new information technology systems (Practice management, EMRs, chronic disease registries, etc.), new phone systems, dental operatories, and ophthalmology screening equipment. Finally, a number of sites said that in order to expand capacity and either maintain their orientation as a core safety-net provider or become a new part of the core safety-net then they needed resources that they could tap to cover the cost of uncompensated care.
4. Safety-net Capacity, Structure, Service Gaps, Challenges, and Strength As stated above, there are a number of common themes that are cross-cutting with respect to describing the structure, capacity and strength of western New York’s safety-net. However, there is also considerable geographic variation, particularly in the degree to which some of the cross-cutting factors impact the specific geographic components of the safety-net. If CHFWCNY is going to effectively engage certain provider organizations and/or develop targeted strategies to strengthen specific segments of the safety-net then it must understand the breadth and the specifics of the geographic variation that exists in the region. The following is a review of the common themes across the region. County by county descriptions that describe specific county variations and/or that highlight issues that were uncovered in the Project Team’s site visits and interviews are provided in the next section. Capacity and Structure
• Extremely Limited Capacity. Throughout most of the western New York region, the safety-net is ill-defined and has very limited capacity, particularly for those without insurance. In some parts of the region, such as the cities of Buffalo and Niagara Falls, there is significant capacity to serve low income populations who are insured by Medicaid, but there is little and, in many cases, virtually no capacity to serve those without insurance. There are very few safety-net providers that fit in to the “core” safety-net description defined above in any of the region’s counties but there is a particular dearth of “core” safety-net providers in the region’s rural counties.
• Over utilization of Hospital Emergency Rooms. In most areas in western New York,
there are no absolute gaps in primary care, particularly for those who are insured by Medicaid. However, given the lack of capacity to serve the uninsured combined with an array of barriers and disincentives that effect the entire population - such as limited public transportation, long wait-times, lack of timely scheduling, administrative barriers to Medicaid enrollment, no after-hours care, and provider shortages - there are virtual gaps that hinder access to primary care-based care and encourage the use of the emergency room. As a result, a large proportion of the families in the region have learned over time

Western New York Safety-Net Assessment John Snow, Inc.
40
to rely on the region’s hospital emergency rooms as their usual source of acute care and do not, in any real sense, have a “medical home”.14
• Major Reliance on Independent, Private Physician Practices. Typically, safety-nets
are bolstered by a set of “core” safety-net providers that are formally or informally mandated to serve low income Medicaid insured, uninsured, and underinsured populations. These organizations tailor their operations to low income populations, provide a range of enabling and supportive services to promote appropriate access, and are often heavily subsidized so that they can provide uncompensated care to the uninsured. Once again, in western New York there is a significant dearth of “core” safety-net providers and a subsequent reliance on independent, private physician practices that are not well supported to serve these low income Medicaid insured and uninsured populations. As a result, these private practices often cap the number of Medicaid and uninsured patients they serve and, in many cases, refuse to serve those who do not have the ability to pay all together. There is a particularly heavy reliance on private physician practices in the region’s rural areas.
Challenges and Service Gaps
• Lack of Access to Oral and Behavioral Health Services. In many areas of the region there are simply no providers willing or able to provide behavioral or oral health services to Medicaid insured or to uninsured patients on a sliding fee scale basis. As a result, patients are forced to either travel long distances outside of their area for care or go without needed services all together. It is not uncommon for low income populations in many rural areas to travel 1-2 hours or more to Buffalo, Rochester, or Erie, PA for behavioral health or oral health services.
• Lack of Access to After-Hours Care. There is extremely limited access to after-hours
care (evening, night-time, or weekend clinic hours). Most of the core safety-net providers, such as the FQHCs and the residency clinics, have after-hours care 1 or 2 nights per week but other than this small handful of providers the Project Team did not identify any other providers who have regular evening hours and no safety-net providers that have regular weekend hours.
• Administrative Barriers to Medicaid Enrollment and Re-Enrollment. Low income
populations throughout the region struggle to enroll and, perhaps more significantly, maintain their enrollment in Medicaid. For many, the enrollment process can be involved and quite cumbersome and must be done annually for a patient to maintain his/her benefits. As a result, many low income individuals or families who are actually eligible for Medicaid are either never enrolled or have sporadic coverage if they do not take specific actions to re-enroll themselves at the end of each year. These administrative barriers create significant disincentives for individuals/families to align themselves with a
14 This report is using the Commonwealth Fund’s definition of medical home defined as: a regular doctor or source of care, easy access to the provider by telephone, easy access to health advice on evenings and weekends or whenever the provider is closed, and visits with the provider that occur conveniently for patients, are on time and are efficient

Western New York Safety-Net Assessment John Snow, Inc.
41
primary care-based provider. More specifically, the uninsured and those who struggle with their Medicaid eligibility seem more inclined to go to the emergency room, where they can not be refused care, than face the inconvenience and awkward nature of trying to prove their income or Medicaid eligibility to a primary care-based provider.
• Lack of Awareness or Access to Preventive Services. Many of the key informants that
the Project Team interviewed expressed general concerns regarding the lack of awareness and access to preventive services. They referred to the over-utilization of emergency room as well as what they perceived as a lack of awareness in the general population regarding the importance of routine check-ups and other preventive services. This is particularly true of dental services. Furthermore, there was little discussion or reference to large scale screening efforts or efforts to promote preventive services. This finding is not fully corroborated by the consumer survey data; in fact the consumers survey data showed that those that responded have at least as high if not better use of preventive medical services as the state and the nation. However, the idea of lack of preventive care was so widely supported by the key informant interviews that it deserves further exploration.
• Provider Shortages, Provider Recruitment, and Retention. As mentioned above,
there is significant lack of capacity in the region’s safety-net. This issue is compounded by the fact that primary care safety-net providers throughout the region waste inordinate amounts of time and strain to fill gaps in their clinical staffing. This is particularly true in the rural areas but is also a significant issue in the City of Buffalo. Many of the providers that were interviewed or visited said that there was a great deal of pent-up demand and believed that they could readily expand access to services if they were able to recruit clinical providers.
Strengths and Opportunities
• Strong Network of Hospital and Academic Partners. The western New York region’s safety-net is well supported by a network of major hospitals (both urban and rural) and the University at Buffalo. Without these major players, the county and the region would be in crisis. The hospital’s emergency rooms play a significant and vital role in providing primary care services to those who are not engaged in the primary care setting. Also, many hospitals, on their own, and in coordination with the University at Buffalo, provide a substantial amount of primary care through their hospital-based and community-based outpatient clinics. The University at Buffalo’s Family Practice and Pediatric Residency Practices provide a substantial amount of primary care to low income children and families, particularly those who are Medicaid insured. In addition, as in most regions of the country, the hospitals are nearly the sole source of medical specialty care services. The University at Buffalo also participates in provider recruitment, planning, and research activities that directly and indirectly support the safety-net in significant ways.
• County Health Departments. Comprehensive direct primary care is outside the scope
of most health departments yet they play a vital role in the safety-net system. The county health departments including the public health and mental health agencies provide a

Western New York Safety-Net Assessment John Snow, Inc.
42
range of health and social services including direct patient care, particularly for high risk children and families. There is a range in the scope of services they provide in each county; however, they are in many cases the provider of last resort and their case management services are critical to connecting families with comprehensive care.
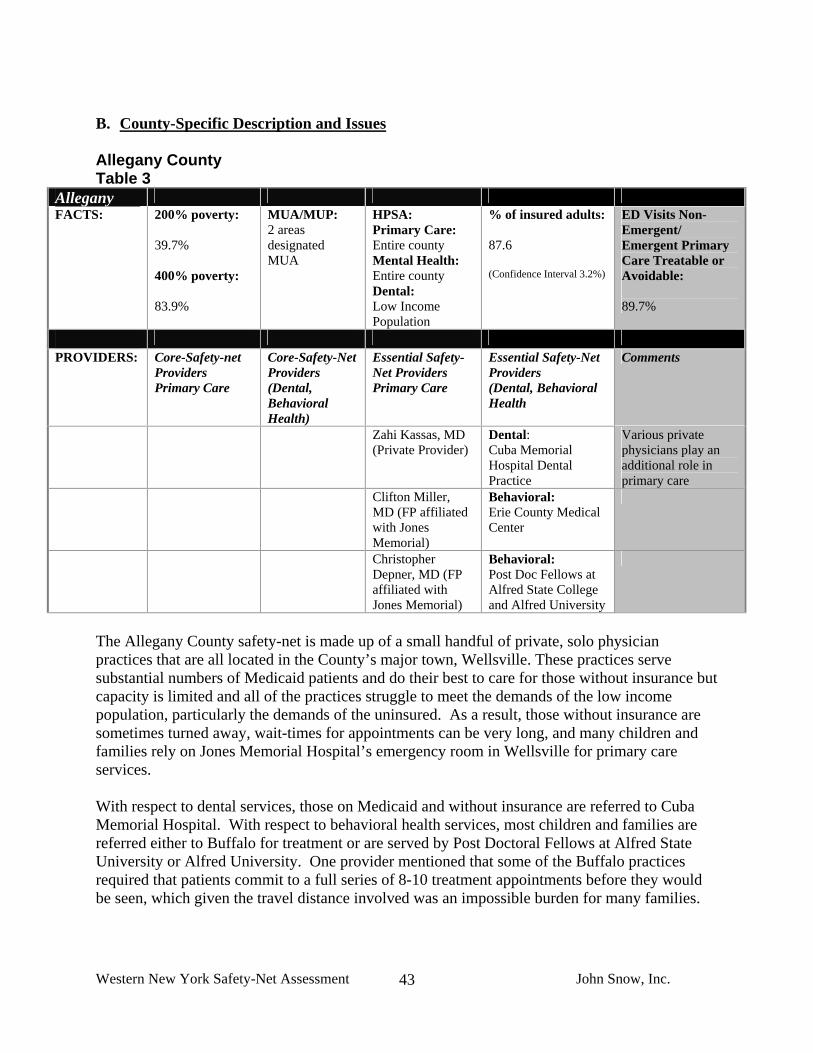
Western New York Safety-Net Assessment John Snow, Inc.
43
B. County-Specific Description and Issues Allegany County Table 3
Allegany FACTS: 200% poverty:
39.7% 400% poverty: 83.9%
MUA/MUP: 2 areas designated MUA
HPSA: Primary Care: Entire county Mental Health: Entire county Dental: Low Income Population
% of insured adults: 87.6 (Confidence Interval 3.2%)
ED Visits Non-Emergent/ Emergent Primary Care Treatable or Avoidable: 89.7%
PROVIDERS: Core-Safety-net
Providers Primary Care
Core-Safety-Net Providers (Dental, Behavioral Health)
Essential Safety-Net Providers Primary Care
Essential Safety-Net Providers (Dental, Behavioral Health
Comments
Zahi Kassas, MD (Private Provider)
Dental: Cuba Memorial Hospital Dental Practice
Various private physicians play an additional role in primary care
Clifton Miller, MD (FP affiliated with Jones Memorial)
Behavioral: Erie County Medical Center
Christopher Depner, MD (FP affiliated with Jones Memorial)
Behavioral: Post Doc Fellows at Alfred State College and Alfred University
The Allegany County safety-net is made up of a small handful of private, solo physician practices that are all located in the County’s major town, Wellsville. These practices serve substantial numbers of Medicaid patients and do their best to care for those without insurance but capacity is limited and all of the practices struggle to meet the demands of the low income population, particularly the demands of the uninsured. As a result, those without insurance are sometimes turned away, wait-times for appointments can be very long, and many children and families rely on Jones Memorial Hospital’s emergency room in Wellsville for primary care services. With respect to dental services, those on Medicaid and without insurance are referred to Cuba Memorial Hospital. With respect to behavioral health services, most children and families are referred either to Buffalo for treatment or are served by Post Doctoral Fellows at Alfred State University or Alfred University. One provider mentioned that some of the Buffalo practices required that patients commit to a full series of 8-10 treatment appointments before they would be seen, which given the travel distance involved was an impossible burden for many families.
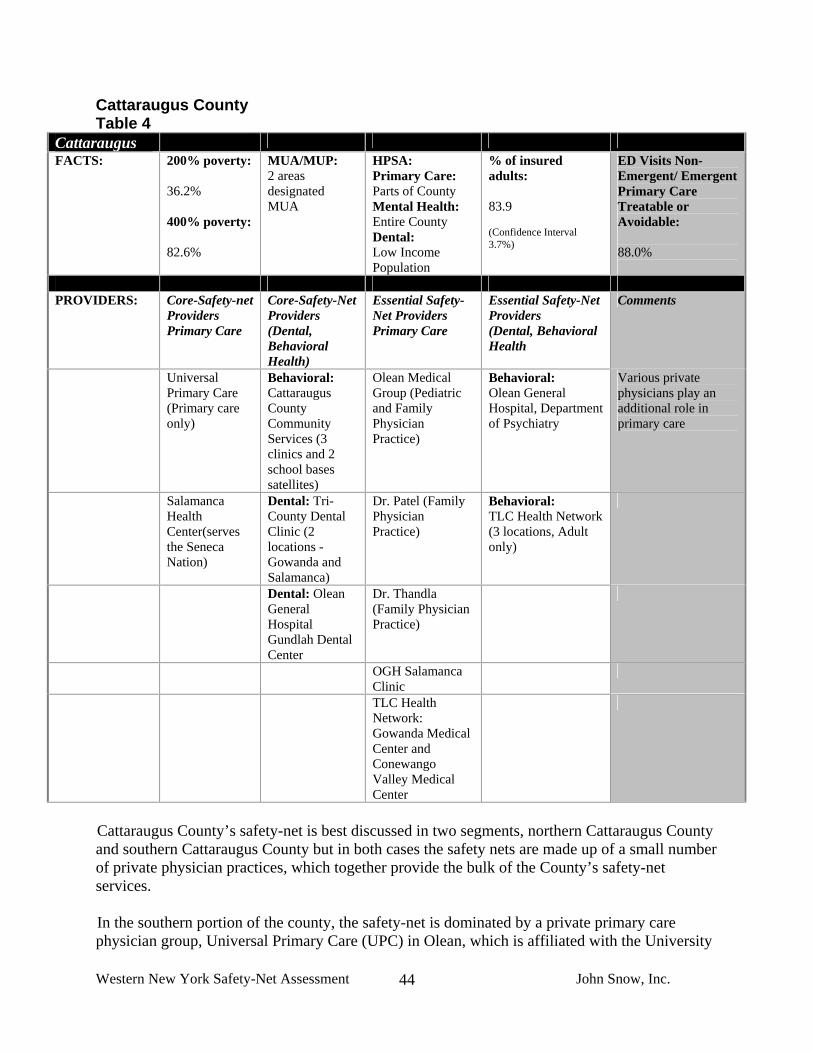
Western New York Safety-Net Assessment John Snow, Inc.
44
Cattaraugus County Table 4
Cattaraugus FACTS: 200% poverty:
36.2% 400% poverty: 82.6%
MUA/MUP: 2 areas designated MUA
HPSA: Primary Care: Parts of County Mental Health: Entire County Dental: Low Income Population
% of insured adults: 83.9 (Confidence Interval 3.7%)
ED Visits Non-Emergent/ Emergent Primary Care Treatable or Avoidable: 88.0%
PROVIDERS: Core-Safety-net
Providers Primary Care
Core-Safety-Net Providers (Dental, Behavioral Health)
Essential Safety-Net Providers Primary Care
Essential Safety-Net Providers (Dental, Behavioral Health
Comments
Universal Primary Care (Primary care only)
Behavioral: Cattaraugus County Community Services (3 clinics and 2 school bases satellites)
Olean Medical Group (Pediatric and Family Physician Practice)
Behavioral: Olean General Hospital, Department of Psychiatry
Various private physicians play an additional role in primary care
Salamanca Health Center(serves the Seneca Nation)
Dental: Tri-County Dental Clinic (2 locations -Gowanda and Salamanca)
Dr. Patel (Family Physician Practice)
Behavioral: TLC Health Network (3 locations, Adult only)
Dental: Olean General Hospital Gundlah Dental Center
Dr. Thandla (Family Physician Practice)
OGH Salamanca Clinic
TLC Health Network: Gowanda Medical Center and Conewango Valley Medical Center
Cattaraugus County’s safety-net is best discussed in two segments, northern Cattaraugus County and southern Cattaraugus County but in both cases the safety nets are made up of a small number of private physician practices, which together provide the bulk of the County’s safety-net services. In the southern portion of the county, the safety-net is dominated by a private primary care physician group, Universal Primary Care (UPC) in Olean, which is affiliated with the University
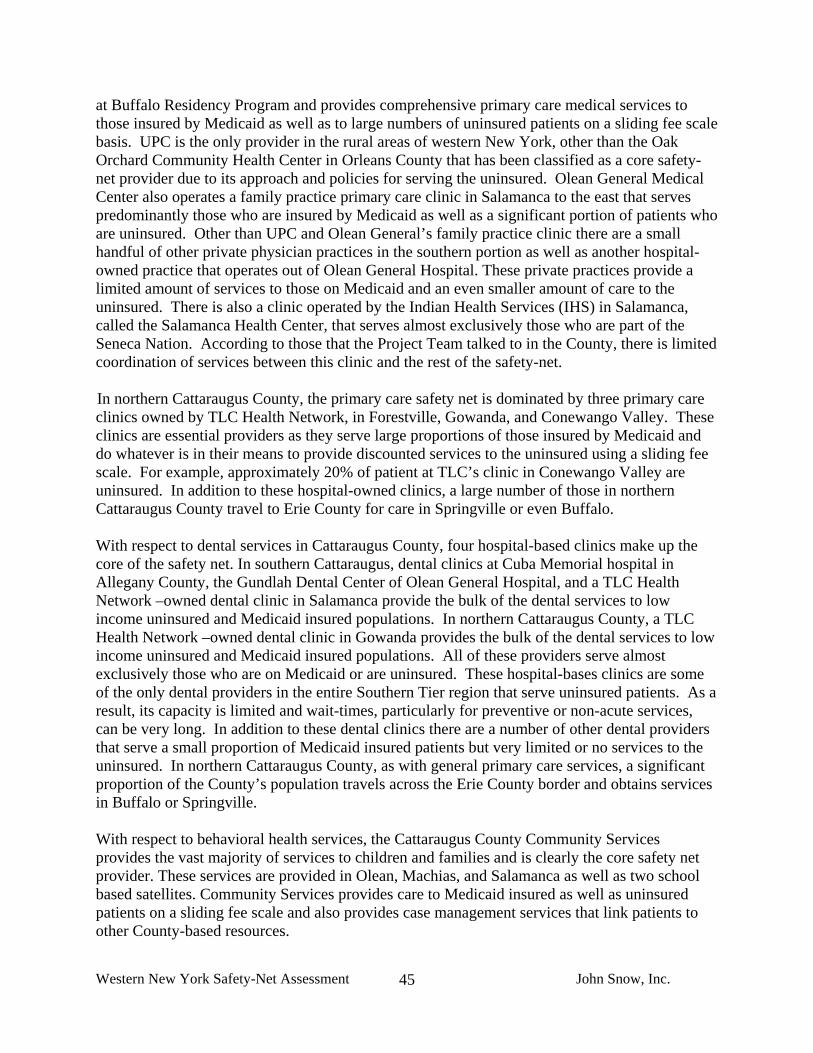
Western New York Safety-Net Assessment John Snow, Inc.
45
at Buffalo Residency Program and provides comprehensive primary care medical services to those insured by Medicaid as well as to large numbers of uninsured patients on a sliding fee scale basis. UPC is the only provider in the rural areas of western New York, other than the Oak Orchard Community Health Center in Orleans County that has been classified as a core safety-net provider due to its approach and policies for serving the uninsured. Olean General Medical Center also operates a family practice primary care clinic in Salamanca to the east that serves predominantly those who are insured by Medicaid as well as a significant portion of patients who are uninsured. Other than UPC and Olean General’s family practice clinic there are a small handful of other private physician practices in the southern portion as well as another hospital-owned practice that operates out of Olean General Hospital. These private practices provide a limited amount of services to those on Medicaid and an even smaller amount of care to the uninsured. There is also a clinic operated by the Indian Health Services (IHS) in Salamanca, called the Salamanca Health Center, that serves almost exclusively those who are part of the Seneca Nation. According to those that the Project Team talked to in the County, there is limited coordination of services between this clinic and the rest of the safety-net. In northern Cattaraugus County, the primary care safety net is dominated by three primary care clinics owned by TLC Health Network, in Forestville, Gowanda, and Conewango Valley. These clinics are essential providers as they serve large proportions of those insured by Medicaid and do whatever is in their means to provide discounted services to the uninsured using a sliding fee scale. For example, approximately 20% of patient at TLC’s clinic in Conewango Valley are uninsured. In addition to these hospital-owned clinics, a large number of those in northern Cattaraugus County travel to Erie County for care in Springville or even Buffalo. With respect to dental services in Cattaraugus County, four hospital-based clinics make up the core of the safety net. In southern Cattaraugus, dental clinics at Cuba Memorial hospital in Allegany County, the Gundlah Dental Center of Olean General Hospital, and a TLC Health Network –owned dental clinic in Salamanca provide the bulk of the dental services to low income uninsured and Medicaid insured populations. In northern Cattaraugus County, a TLC Health Network –owned dental clinic in Gowanda provides the bulk of the dental services to low income uninsured and Medicaid insured populations. All of these providers serve almost exclusively those who are on Medicaid or are uninsured. These hospital-bases clinics are some of the only dental providers in the entire Southern Tier region that serve uninsured patients. As a result, its capacity is limited and wait-times, particularly for preventive or non-acute services, can be very long. In addition to these dental clinics there are a number of other dental providers that serve a small proportion of Medicaid insured patients but very limited or no services to the uninsured. In northern Cattaraugus County, as with general primary care services, a significant proportion of the County’s population travels across the Erie County border and obtains services in Buffalo or Springville. With respect to behavioral health services, the Cattaraugus County Community Services provides the vast majority of services to children and families and is clearly the core safety net provider. These services are provided in Olean, Machias, and Salamanca as well as two school based satellites. Community Services provides care to Medicaid insured as well as uninsured patients on a sliding fee scale and also provides case management services that link patients to other County-based resources.
Western New York Safety-Net Assessment John Snow, Inc.
46
Chautauqua County Table 5
Chautauqua FACTS: 200% poverty:
35.9% 400% poverty: 81.8%
MUA/MUP: 2 areas designated MUA
HPSA: Primary Care: Parts of County Mental Health: Entire County Dental: Low Income Population
% of insured adults: 83.9 (Confidence Interval 3.7%)
ED Visits Non-Emergent/ Emergent Primary Care Treatable or Avoidable: 90.4%
PROVIDERS: Core-Safety-net
Providers Primary Care
Core-Safety-Net Providers (Dental, Behavioral Health)
Essential Safety-Net Providers Primary Care
Essential Safety-Net Providers (Dental, Behavioral Health
Comments
Robert Berke, MD (Family Practice)
Dental: Dr. Menoff (Extractions only)
WCA Family Health Centers, (Family Practice)
Dental: University Pediatric Dentistry (UB, Department of Pediatric and Community Dentistry)
Various private physicians play an additional role in primary care
Jamestown Pediatrics, (Jamestown)
Behavioral: Catholic Charities (Comprehensive services children and adults)
Southern Tier Pediatrics
Behavioral: The Resource Center, Jamestown(Adult and Children Developmentally Disabled focused services)
TLC Health Network: Tri-County Medical Center
Ganesh, Despande, MD
Rajiv Parikh, MD, Westfield Family
Physicians
Relative to most of the Counties in the rural areas of western New York, Chautauqua County has a substantial number of primary care providers that make up its safety-net for children. However, as with the region’s other county safety-nets, these providers are not well distributed throughout the County and typically limit the amount of services they provide to Medicaid insured and uninsured patients. No providers in Chautauqua County can be classified as core

Western New York Safety-Net Assessment John Snow, Inc.
47
safety-net providers and the safety-net’s capacity, particularly for the uninsured, is limited and inconsistent. All but two of the safety-net providers identified by the Project Team are private pediatric or family physician practices. The Resource Center in Jamestown and the Tri-County Medical Center are the two exceptions. The Resource Center is a not-for-profit, multi-service agency that provides a comprehensive range of health and social services, including primary care medical, dental, and behavioral health services predominantly to children and adults who are disabled or who are developmentally delayed. Their patients are almost entirely insured by Medicaid but like the other safety-net providers they serve a relatively small number of patients who are uninsured. The Tri-County Medical Center is part of the TLC Health network. They offer uninsured patients transparent costs for services and a discounted fee schedule. An additional TLC Health Network site, Conewango Valley Medical Center located in Cattaraugus County frequently provides services to residents in Chautauqua County. WCA and Brooks Memorial Hospital are active participants in the safety-net and provide a great deal of care through their emergency rooms. The hospitals have also been active participants in County’s health care planning efforts and are currently participating in discussions with the Chautauqua County Health Network and the Community Health Center Association of New York State (CHCANYS) related to the feasibility of developing a FQHC for the County. With respect to behavioral health services, the County Mental Health Department and Catholic Charities serve the vast majority of children in need and provide services to both Medicaid insured and the uninsured on a sliding fee scale basis. These organizations provide comprehensive services but it can take months to get an appointment, particularly for those with undiagnosed or mild to moderate issues. With respect to dental services, capacity is extremely limited. No providers serve large numbers of children who are Medicaid insured or uninsured on a regular and consistent basis. The Resource Center provides services to those on Medicaid as well as a limited number of children without insurance. The University at Buffalo’s Department of Pediatric and Community Dentistry also operates a dental van that provides services to children and families at certain locations on a monthly basis. In both cases, however, long wait-lists and/or major barriers to care limit access. Finally, a private dental provider serves large numbers of children on Medicaid but does mostly extractions and does not provide general preventive or restorative care on a regular basis.
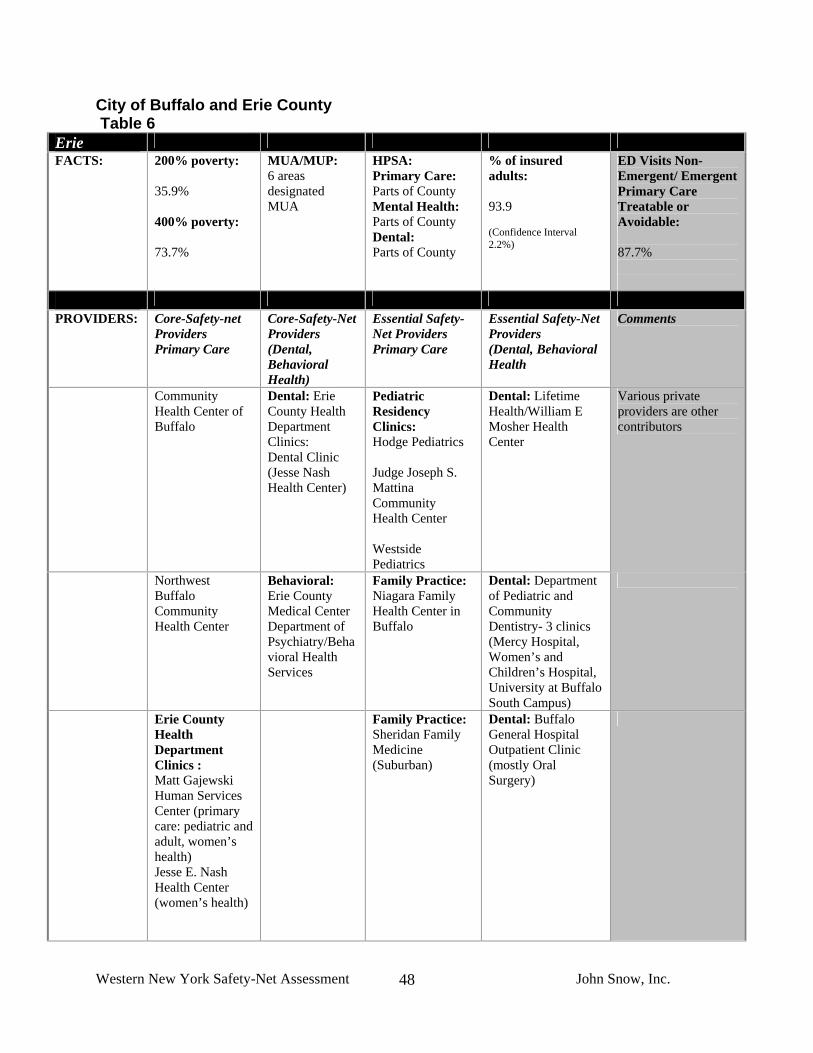
Western New York Safety-Net Assessment John Snow, Inc.
48
City of Buffalo and Erie County Table 6
Erie FACTS: 200% poverty:
35.9% 400% poverty: 73.7%
MUA/MUP: 6 areas designated MUA
HPSA: Primary Care: Parts of County Mental Health: Parts of County Dental: Parts of County
% of insured adults: 93.9 (Confidence Interval 2.2%)
ED Visits Non-Emergent/ Emergent Primary Care Treatable or Avoidable: 87.7%
PROVIDERS: Core-Safety-net
Providers Primary Care
Core-Safety-Net Providers (Dental, Behavioral Health)
Essential Safety-Net Providers Primary Care
Essential Safety-Net Providers (Dental, Behavioral Health
Comments
Community Health Center of Buffalo
Dental: Erie County Health Department Clinics: Dental Clinic (Jesse Nash Health Center)
Pediatric Residency Clinics: Hodge Pediatrics Judge Joseph S. Mattina Community Health Center Westside Pediatrics
Dental: Lifetime Health/William E Mosher Health Center
Various private providers are other contributors
Northwest Buffalo Community Health Center
Behavioral: Erie County Medical Center Department of Psychiatry/Behavioral Health Services
Family Practice: Niagara Family Health Center in Buffalo
Dental: Department of Pediatric and Community Dentistry- 3 clinics (Mercy Hospital, Women’s and Children’s Hospital, University at Buffalo South Campus)
Erie County Health Department Clinics : Matt Gajewski Human Services Center (primary care: pediatric and adult, women’s health) Jesse E. Nash Health Center (women’s health)
Family Practice: Sheridan Family Medicine (Suburban)
Dental: Buffalo General Hospital Outpatient Clinic (mostly Oral Surgery)
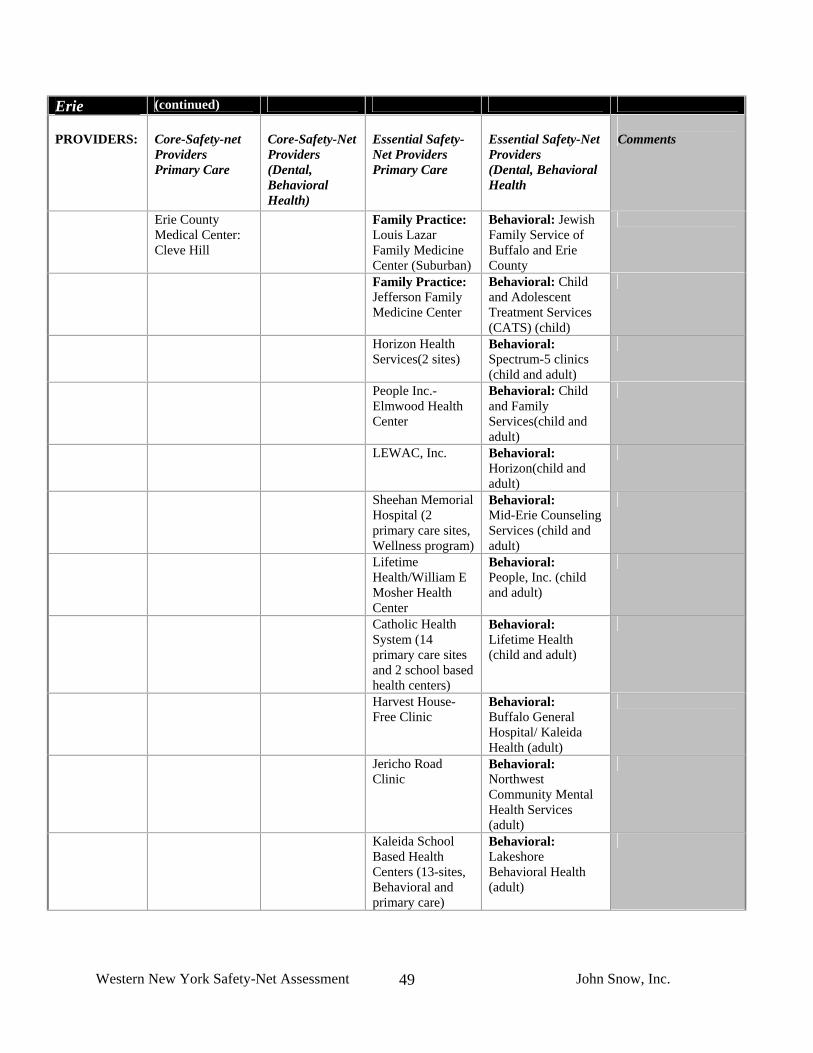
Western New York Safety-Net Assessment John Snow, Inc.
49
Erie (continued) PROVIDERS:
Core-Safety-net Providers Primary Care
Core-Safety-Net Providers (Dental, Behavioral Health)
Essential Safety-Net Providers Primary Care
Essential Safety-Net Providers (Dental, Behavioral Health
Comments
Erie County Medical Center: Cleve Hill
Family Practice: Louis Lazar Family Medicine Center (Suburban)
Behavioral: Jewish Family Service of Buffalo and Erie County
Family Practice: Jefferson Family Medicine Center
Behavioral: Child and Adolescent Treatment Services (CATS) (child)
Horizon Health Services(2 sites)
Behavioral: Spectrum-5 clinics (child and adult)
People Inc.- Elmwood Health Center
Behavioral: Child and Family Services(child and adult)
LEWAC, Inc. Behavioral: Horizon(child and adult)
Sheehan Memorial Hospital (2 primary care sites, Wellness program)
Behavioral: Mid-Erie Counseling Services (child and adult)
Lifetime Health/William E Mosher Health Center
Behavioral: People, Inc. (child and adult)
Catholic Health System (14 primary care sites and 2 school based health centers)
Behavioral: Lifetime Health (child and adult)
Harvest House- Free Clinic
Behavioral: Buffalo General Hospital/ Kaleida Health (adult)
Jericho Road Clinic
Behavioral: Northwest Community Mental Health Services (adult)
Kaleida School Based Health Centers (13-sites, Behavioral and primary care)
Behavioral: Lakeshore Behavioral Health (adult)

Western New York Safety-Net Assessment John Snow, Inc.
50
The Project Team’s efforts in Erie County were focused almost entirely on the City of Buffalo as the City has the largest concentration of children in poverty in the County and western New York region. The Project Team has listed the resources that were identified in areas outside of Buffalo in the table above. In Buffalo, the primary care safety-net is comprised of a very diverse group of providers. The core safety-net providers include two Federally Qualified Health Centers (FQHC), several residency clinics, the Erie County Health Department clinics, and a handful of small, mission-driven or faith-based organizations. In addition, there are at least 10-12 other non-profit, private physician, and hospital-based clinic practices that collectively provide a substantial amount of care to low income Medicaid insured populations but that do not serve large numbers of those who are uninsured. As in other parts of the region, Buffalo’s network of hospitals plays a major and vital role in the safety-net. They serve large numbers of people through their emergency rooms, support the residency programs, provide the bulk of medical specialty care for Buffalo and the region, and participate in recruitment and planning activities. With respect to behavioral health services, a number of large, private, multi-site providers together are the dominant providers in the city. These providers serve large numbers of Medicaid insured patients on a referral basis but only a limited number of uninsured patients. The Erie County Medical Center’s (ECMC) Department of Psychiatry and its Division of Behavioral Health is a major player and provides services to a full range of patients including to Medicaid and uninsured patients. ECMC also provides some behavioral health services in an integrated, co-located fashion through their primary outpatient clinics. ECMC’s behavioral health department is the only provider that could be categorized as part of the safety-net’s core as it provides services regardless of ability to pay using a sliding fee scale. Sheehan Memorial Health Services also provides a significant amount of services to Medicaid insured and uninsured patients, particularly with respect to addiction services. The FQHC clinics both provide a very limited amount of behavioral health services on-site through their primary care staff as well as through dedicated behavioral health counselors who provide counseling and case management services. In addition to these providers a number of other small, private, not-for-profit behavioral health providers serve Medicaid insured patients and a limited amount of uninsured. With respect to dental services, the dominant safety-net providers are the FQHC clinics and the Jesse E. Nash Dental Clinic, which is part of the Erie County Health Department. A number of private, not-for-profit clinics that provide a significant amount of dental services, as well as a number of hospital-based clinics that provide the majority of the oral surgical services and a small amount of general dentistry.

Western New York Safety-Net Assessment John Snow, Inc.
51
Genesee County Table 7
Genesee FACTS: 200% poverty:
25.9% 400% poverty: 76.4%
MUA/MUP: No Designations in the County
HPSA: Primary Care: Entire County Mental Health: Entire County Dental: Correctional Institution
% of insured adults: 88.4 (Confidence Interval 3.1%)
ED Visits Non-Emergent/ Emergent Primary Care Treatable or Avoidable: 88.7%
PROVIDERS: Core-Safety-net
Providers Primary Care
Core-Safety-Net Providers (Dental, Behavioral Health)
Essential Safety-Net Providers Primary Care
Essential Safety-Net Providers (Dental, Behavioral Health
Comments
Oak Orchard Community Health Center (Located in Orleans County)
Behavioral: Mental Health Services of Orleans County
United Memorial Medical Center Outpatient Clinics: (3 sites: Byron, Batavia, Leroy)
Dental: Eastman Dental Mobile Van (Summer months only)
Significant role of various private providers
Behavioral: Catholic Charities
Behavioral: Hillside Family Services
Behavioral: Horizon Health Services (chemical dependency adolescents and adults)
Genesee County does not have a “core” safety-net provider that serves everyone regardless of their ability to pay. The safety-net is dominated by a small number of private practices, including a number of outpatient hospital- and community-based clinics operated by United Memorial Medical Center in Batavia. More specifically, the hospital has three outpatient clinics in the towns of Batavia, Leroy, and Byron. These clinics provide services to both children and adults, however their main focus is adults and they serve a very limited number of uninsured patients. In addition to the hospital-owned clinics, the hospital also operates a Fast Track Service which streamlines services for those who come to the ER for non-urgent, ambulatory sensitive conditions. Insured patients seen through the Fast Track Service who do not have a primary care provider are referred to one of the outpatient clinics for follow-up care. Oral health service capacity is extremely limited, particularly for those who are low income and uninsured. There are a handful of private dental providers in the County but they cap their Medicaid roles and do not, as a matter of policy, serve those who can not pay for services. A Rochester-based dental van, called the Eastman Dental Services van, provides a limited amount of dental services, even to those without insurance on a discounted basis, but does not operate year round and does not take all forms of Medicaid, which makes it an unreliable source of

Western New York Safety-Net Assessment John Snow, Inc.
52
ongoing care for many. The majority of behavioral health services are provided through the County Mental Health department. This is the only provider in the area licensed to accept Medicaid. In addition to the County Mental Health department, Catholic Charities and Hillside Children’s services provide both behavioral health and social services in the area.

Western New York Safety-Net Assessment John Snow, Inc.
53
Niagara County Table 8
Niagara FACTS: 200% poverty:
27.1% 400% poverty: 75%
MUA/MUP: 1 area designated MUA
HPSA: Primary Care: Parts of County Mental Health: No Designation Dental: No Designation
% of insured adults: 91.2 (Confidence Interval 3.1%)
ED Visits Non-Emergent/ Emergent Primary Care Treatable or Avoidable: 88.2%
PROVIDERS: Core-Safety-net
Providers Primary Care
Core-Safety-Net Providers (Dental, Behavioral Health)
Essential Safety-Net Providers Primary Care
Essential Safety-Net Providers (Dental, Behavioral Health
Comments
Planned Parenthood of Western New York (2 locations, Niagara and Lockport)
Neighborhood Health Center-Mt. St. Marys Clinic
Dental: UCP Dental Clinic (child and adults, developmental disability and general public)
Various private providers
Hamilton B Mizer Health Center at Niagara Falls Memorial Hospital
Dental: University Pediatric Dentistry (University at Buffalo, Department of Pediatric and Community Dentistry)
Behavioral: Monsignor Carr-Catholic Charities (child)
Behavioral: United Cerebral Palsy of Niagara (children, mostly developmentally delayed)
Behavioral: Horizon Health Services (2 locations Niagara and Brockport- Adult only)
Rainbow Pediatrics Summit Pediatrics
Niagara County’s and the City of Niagara Falls’ safety-nets are extremely limited, with respect to absolute numbers of clinics, service capacity, and distribution. Only two, relatively small pediatric clinics in the County, operated by Planned Parenthood, can be considered core safety-net providers and serve both Medicaid populations and the uninsured on a sliding fee scale basis.

Western New York Safety-Net Assessment John Snow, Inc.
54
The Planned Parenthood clinics make a tremendous effort to serve the population but struggle to meet demand and are not widely known due to the general perception that they are a family planning agency. Two hospital-operated clinics in Niagara Falls serve a limited number of children and families on Medicaid and an even a more limited number of uninsured children. Based on information gathered through the project’s key informant interviews and site visits, the majority of Medicaid insured children and families in the County are served by two large private pediatric groups that operate out of Niagara Falls and Lewiston. A number of other small, solo pediatric providers were also identified in the Lockport area. These private providers serve large proportions of those on Medicaid but their policies related to serving uninsured patients who cannot pay for services are unknown. Based on our interviews and site visit discussions, there seems to be a heavy reliance on the Buffalo health care market for services, particularly in the eastern portion of the County where services are very sparse. With respect to behavioral health services, two main non-profit providers directly provide services specifically for children - Family & Children’s Services of Niagara, Inc. and the Monsignor Carr Institute Children's Clinics with locations in Niagara Falls and Lockport. Additionally, Niagara County has two inpatient behavioral health providers; Community Missions of Niagara, and Niagara Falls Memorial Medical Center Bridges Child/Adolescent Psychiatric Program. However, it was recently reported publicly through the media that the Bridges program will be closing. The County Mental Health Department only provides services to adults. With respect to dental services, the University at Buffalo’s Department of Pediatric and Community Dentistry operates a clinic in Niagara Falls that is the primary referral source for the entire County and for safety-net providers that were identified. A small dental clinic operated by United Cerebral Palsy serves primarily those with developmental disabilities but also serves a small number of children in the general population. No dental providers take Medicaid patients in Lockport or in other towns in the County outside of Niagara Falls. Niagara County’s proximity to Buffalo is a significant asset and mitigates some of the issues related to lack of capacity and strength of the County’s safety-net. Based on the Project Team’s interviews and on a review of the physician survey data provided by UNYNET, there also seems to be a strong network of private, pediatric providers that are well known and provide good access for those who are Medicaid insured.

Western New York Safety-Net Assessment John Snow, Inc.
55
Orleans County Table 9
Orleans FACTS: 200% poverty:
30.8% 400% poverty: 78.6%
MUA/MUP: 1 area designated MUA
HPSA Primary Care: Entire County Mental Health: Entire County Dental: No Designation
% of insured adults: 88.4 (Confidence Interval 3.1%)
ED visits Non-Emergent/ Emergent Primary Care Treatable or Avoidable: 89.3%
PROVIDERS: Core-Safety-net
Providers Primary Care
Core-Safety-Net Providers (Dental, Behavioral Health)
Essential Safety-Net Providers Primary Care
Essential Safety-Net Providers (Dental, Behavioral Health
Comments
Oak Orchard Community Health Center (2 sites- Albion, Brockport)
Dental and Behavioral: Oak Orchard Community Health Center (2 sites- Albion, Brockport)
Behavioral: Catholic Charities
Various private providers
Behavioral: Mental Health Services of Orleans County
Behavioral: Hillside Family Services
Oak Orchard Community Health Center is an FQHC with a location in Orleans County and is the dominant safety-net provider in the County. It is the only provider in the County that provides services to children and families who are uninsured regardless of their ability to pay. Oak Orchard offers comprehensive services including medical, dental and behavioral health through two locations: one in Orleans County (Albion), and one in neighboring Monroe County (Brockport). Oak Orchard through both its sites serves a large number of people from Orleans and draws patients in significant numbers from Genesee and even Wyoming Counties. A handful of other private, independent practices accept a limited number of Medicaid patients. The Lakeside Hospital in Brockport also plays a major role. Its emergency room is a place of last resort from many. It also has a series of affiliated outpatient clinics and is the focal point of medical specialty care for the north western part of the region. Oral health capacity is particularly strained and there are substantial gaps in services, particularly for non-urgent care. Oak Orchard is the only dental provider in the area that accepts Medicaid and those without insurance on a sliding fee scale basis. Oak Orchard provides dental services in its Brockport clinic as well as through a mobile van that visits schools and other community-based locations throughout their primary (Orleans and Monroe Counties) and secondary (Wyoming County) service areas. The Oak Orchard Dental Department has lost several dentists in the last year and faces extreme challenges related to recruiting dental providers to the area. Behavioral health services are provided by Genesee County Mental Health services and to a much smaller extent by Catholic Charities.
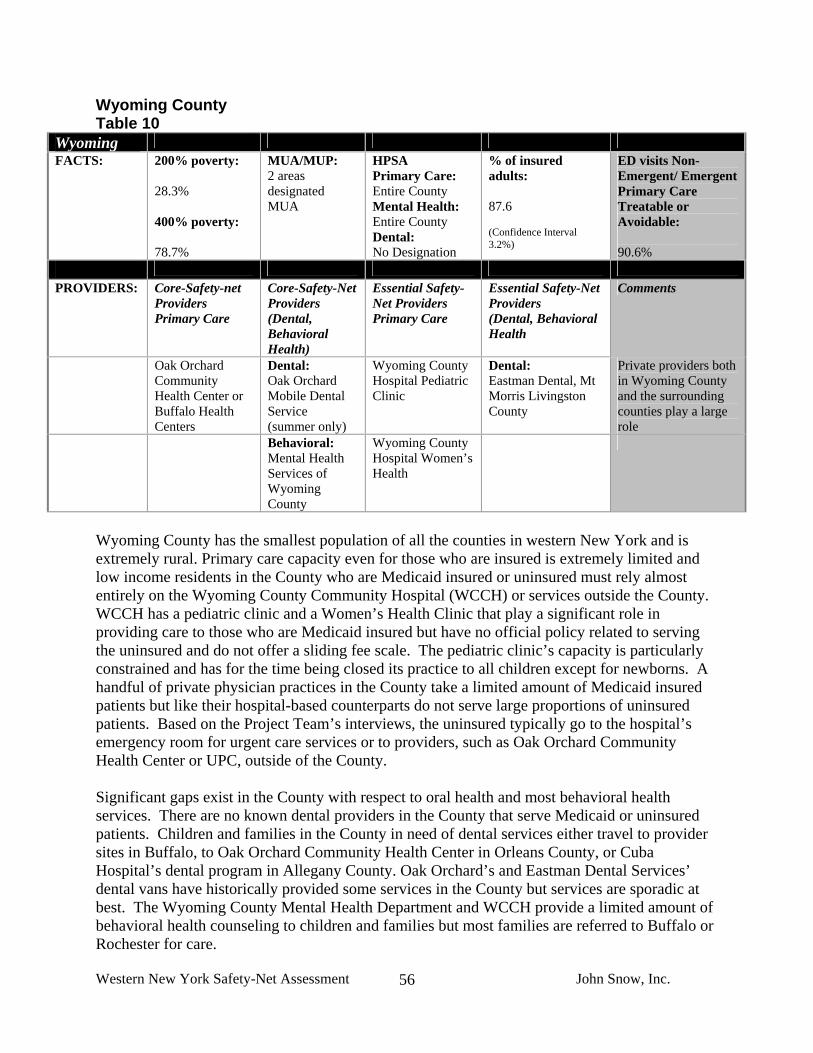
Western New York Safety-Net Assessment John Snow, Inc.
56
Wyoming County Table 10
Wyoming FACTS: 200% poverty:
28.3% 400% poverty: 78.7%
MUA/MUP: 2 areas designated MUA
HPSA Primary Care: Entire County Mental Health: Entire County Dental: No Designation
% of insured adults: 87.6 (Confidence Interval 3.2%)
ED visits Non-Emergent/ Emergent Primary Care Treatable or Avoidable: 90.6%
PROVIDERS: Core-Safety-net
Providers Primary Care
Core-Safety-Net Providers (Dental, Behavioral Health)
Essential Safety-Net Providers Primary Care
Essential Safety-Net Providers (Dental, Behavioral Health
Comments
Oak Orchard Community Health Center or Buffalo Health Centers
Dental: Oak Orchard Mobile Dental Service (summer only)
Wyoming County Hospital Pediatric Clinic
Dental: Eastman Dental, Mt Morris Livingston County
Private providers both in Wyoming County and the surrounding counties play a large role
Behavioral: Mental Health Services of Wyoming County
Wyoming County Hospital Women’s Health
Wyoming County has the smallest population of all the counties in western New York and is extremely rural. Primary care capacity even for those who are insured is extremely limited and low income residents in the County who are Medicaid insured or uninsured must rely almost entirely on the Wyoming County Community Hospital (WCCH) or services outside the County. WCCH has a pediatric clinic and a Women’s Health Clinic that play a significant role in providing care to those who are Medicaid insured but have no official policy related to serving the uninsured and do not offer a sliding fee scale. The pediatric clinic’s capacity is particularly constrained and has for the time being closed its practice to all children except for newborns. A handful of private physician practices in the County take a limited amount of Medicaid insured patients but like their hospital-based counterparts do not serve large proportions of uninsured patients. Based on the Project Team’s interviews, the uninsured typically go to the hospital’s emergency room for urgent care services or to providers, such as Oak Orchard Community Health Center or UPC, outside of the County. Significant gaps exist in the County with respect to oral health and most behavioral health services. There are no known dental providers in the County that serve Medicaid or uninsured patients. Children and families in the County in need of dental services either travel to provider sites in Buffalo, to Oak Orchard Community Health Center in Orleans County, or Cuba Hospital’s dental program in Allegany County. Oak Orchard’s and Eastman Dental Services’ dental vans have historically provided some services in the County but services are sporadic at best. The Wyoming County Mental Health Department and WCCH provide a limited amount of behavioral health counseling to children and families but most families are referred to Buffalo or Rochester for care.

Western New York Safety-Net Assessment John Snow, Inc.
57
V. CONSUMER EXPERIENCE: THE WESTERN NEW YORK CHILDREN’S ACCESS SURVEY (WNYCAS) A. Introduction The Western New York Children’s Access Survey (WNYCAS) was developed to understand consumer experience related to using primary care services in the region. The primary survey objective was to understand gaps in services and the needs of families accessing care for their children based on their perspective and personal experience. The survey questions were designed to mirror and compliment the qualitative interviews with providers and other key informants to understand the potential gaps in the safety-net from the consumer’s perspective. The survey instrument includes questions on consumer’s experience in scheduling appointments, reaching providers by phone, and ability to communicate with providers. The survey also identifies the barriers to access from the consumer perspective. The survey covers general health access barriers such as insurance status, transportation, and communication and on specific barriers to different types of medical services. The survey breaks down access to services into four categories: medical, dental, mental health and specialty care. A copy of the survey is included in appendix E. The survey was developed primarily by drawing questions from existing state and national health surveys. Where existing questions were not available to address specific issues of interest to CHFWCNY, JSI used questions similar to questions from previous JSI surveys that have provided useful information. The four national surveys that questions were pulled from are the 2003 National Survey of Children’s Health (NSCH)15, The Commonwealth Fund 2006 Health Quality Survey16, CDC Behavioral Risk Factor Surveillance System 2006 (BRFSS)17 and the 2000 Pew Health Care Internet Survey18. The goal in distribution of the survey was to capture families in two distinct groups 1) those that are waiting for services and affiliated one of the community health centers or other pediatric providers that serve low income families, 2) families in the community whose status related to the safety-net utilization were unknown. The survey was distributed face to face to parents at community agencies, events, and provider offices with the cooperation of numerous organizations and individuals in each county. A total of 668 surveys were collected from September through December 2007. Four hundred and forty-one (66%) survey respondents were reached at 23 community sites across the eight counties and 226 (34%) were reached at 12 provider sites in five of the counties (Cattaraugus, Erie, Niagara, Orleans and Wyoming). A complete discussion of the methodology and the limitations of the survey are listed in the Appendix E. 15 Child and Adolescent Health Measurement Initiative. 2003 National Survey of Children's Health, Data Resource Center for Child and Adolescent Health website. http://childhealthdata.org/content/Default.aspx 16 The Commonwealth Fund 2006 Health Quality Survey http://www.commonwealthfund.org/surveys/surveys_show.htm?doc_id=50684 17 Centers for Disease Control and Prevention (CDC). Behavioral Risk Factor Surveillance System Survey Data. Atlanta, Georgia: U.S. Department of Health and Human Services, Centers for Disease Control and Prevention, 2006. The CDC Behavioral Risk Factor Surveillance Survey (BRFSS) http://www.cdc.gov/brfss/ 18 The Pew Health Care Internet Survey http://www.pewinternet.org/report_display.asp?r=26

Western New York Safety-Net Assessment John Snow, Inc.
58
B. Summary of Survey Results A comprehensive safety-net provides children and their family access to preventive and acute care and enables good communication between providers and families. The results of the WNYCAS provide insight into which components of comprehensive care the western New York safety-net has succeeded in providing access to children and their families and the areas where consumers perceive there are gaps. Comparing data from this survey with state and national statistics provides a context for the data and highlights areas where western New York residents have better access to care than is typical, and areas that may be targets for improvement within the safety-net. Areas where western New York exceeds or meets national or state benchmarks and standards:
Figure 1. The percent of children who had a preventive care visit in the last 12 months
91.277.8
88.3
0.0
25.0
50.0
75.0
100.0
Western NewYork
Children'sHealth Survey
NationalSurvey ofChildren's
Health (NewYork)
NationalSurvey ofChildren's
Health(National)
Perc
ent
The confidence interval for the New York NSCH data is 86.5-90.0%. The standard error for the National NSCH data is 77.3%- 78.2%.
1. The rate of annual preventive care visits for low income children in western New
York is comparable to national rates. Survey respondents indicated that their child had visited a provider for preventive care in the last months at a significantly higher rate (91.2%) than national (77.8%) and state (88.3%) statistics (Figure 1). The American Academy of Pediatrics recommends children to have annual visits from age 3 to 21, skipping only years 7 and 9. Between the age of one month and 2 years, children are recommended to have 9 visits. Regular preventive care is associated with lower rates of emergency room use and inpatient hospitalization.

Western New York Safety-Net Assessment John Snow, Inc.
59
Figure 2. Parents ability to schedule a preventive care visit for their child
34.537.7
12.1
6
0
5
10
15
20
25
30
35
40
Within 48 hours Within a w eek After more thanone w eek
After more thanone month
Perc
ent
2. Scheduling preventive care visits does not pose a significant problem. As a measure
of the convenience of accessing primary care, parents were asked how quickly they could get an appointment for preventive care for their child. Most families were able to schedule a preventive care visit in less than a week (72%), and only 6 % of families had to wait more than one month to schedule an appointment (Figure 2). Parent’s ability to easily schedule a preventive care visit is critical for regular preventive care. Easy scheduling of appointments in western New York likely contributes to the high rate of annual preventive care visits.
Figure 3. Consumer abilty to schedule a sick visit
54
24
93 1 1 3 4
41
16 13
3 28
310
0102030405060
On theSameDay
TheNextDay
In 2 to3 Days
In 4 to5 Days
In 6 to7 Days
AfterMorethanone
week
Went toan ER
Did notneed a
sickvisit
Perc
ent Western New York
Children's HealthSurvey
The CommonwealthFund Survey
The standard error for the Commonwealth Fund survey of adults is ± 2%

Western New York Safety-Net Assessment John Snow, Inc.
60
3. The timeliness for scheduling sick visits is comparable to national data. Parents
surveyed reported that they were able to get an appointment for their child to see a provider more quickly than adult respondents in the Commonwealth Fund survey (Figure 3). It is important to note the comparison with The Commonwealth Fund Survey is adult data and that wait for sick visits in general may be shorter for children than adults. However, The Commonwealth Fund Survey also targeted a general population, not just those most vulnerable. These considerations may factor each other out to some extent.
4. Wait times in the doctor’s office were not reported as a barrier to access. Across all
areas of care (medical, dental, mental health, and specialty), specialty care was the only area where patients listed waits in the doctor offices as a complaint. It is important to note that parents were not asked about their satisfaction with wait times in offices in general, they were only asked whether it was a barrier to access.
5. Rate of health insurance coverage for low income parents in western New York is
comparable to state and national rates overall. The number of parents responding that they do not have health care coverage is comparable to the number of adults reporting they do not have health care coverage in 2006 BRFSS New York state and national data. This suggests that low income adults in western New York are just as likely to have health insurance coverage as other adults in the state.
Figure 4. Consumer ability to understand written communication from their provider
64
23
81 3 1
50
29
105 4 3
010
2030
4050
6070
Very easy
Somewhat easy
Somewhat difficult
Very difficult
Don't get any written information from provider
Don't Know
Perc
ent Western New York
Children's HealthSurvey AdultCommonwealthSurvey
The standard error for the Commonwealth Fund survey of adults is ± 2%

Western New York Safety-Net Assessment John Snow, Inc.
61
6. Providers are trusted and explain things well. Survey respondents indicated that their child’s health care provider always or usually explains things in a way that they and their child can understand as frequently as adults in The Commonwealth Fund Survey (Figure 4). Parents indicated that it is very or somewhat easy to understand written information they receive from their child’s provider at higher rates than respondents to the Commonwealth Fund Survey of adults, and fewer found it somewhat or very difficult. Further highlighting the positive relationship between parents and providers, 83.3% of parents when they do not understand information given by a provider, will ask their provider or someone else in the office to explain. Fewer than 10% of respondents have not always followed a provider’s advice or treatment plan for their child in the past two years. This is half the percentage of adults that reported not following a provider’s advice or treatment plan for themselves in The Commonwealth Fund Survey. While the comparison may be confounded by the fact that parents may be more likely to listen to a provider in regards to their child’s health than their own, this still demonstrates that overall that the western New York parents surveyed trust their children’s providers.
Areas for improvement:
Figure 5. Percent of children who had a gap in health coverage in the last 12 months
18.0
11.714.9
0.0
10.0
20.0
30.0
40.0
Western New YorkChildren's Health
Survey
National Survey ofChildren's Health
(New York)
National Survey ofChildren's Health
(National)
Perc
ent
The confidence interval for the New York NSCH data is 10.0-13.5%. The standard error for the National NSCH is 14.5-14.4%.
1. Health insurance coverage is inconsistent, most notably for the Medicaid population. Although most children were currently covered by health insurance at the time of the survey, a greater number of respondents indicated that there was some time in the past 12 months when their child was not covered. Also, compared to state and national data, western New York children in this survey were more likely to have had some time in the past 12 months uncovered(Figure 5). This may be because the target

Western New York Safety-Net Assessment John Snow, Inc.
62
population of this survey was low income children and families. Children with Medicaid were more likely than children with other types of insurance to have experienced lapses in coverage as were children living at or below 200% FPL – both of which constituted a majority of survey respondents.
Figure 6. Percent of children who visited the ER in the last 12 months
05
1015202530354045
Western New YorkChildren's Health
Survey
National Survey ofChildren's Health
(New York)
National Survey ofChildren's Health
(National)
Perc
ent
The confidence interval for the New York NSCH data is 17.1-21.6%. The standard error for the National NSCH is 18.0-18.7%.
2. Utilization of the ER is high by national standards. Forty percent of parents – more than twice the national rate – reported that their child had been to the ER one or more times in the last year(Figure 6). The rate of children going to the ER two or more times was also three times higher in western New York than nationally. The differences in over utilization between western New York and the national data cannot be accounted for by over sampling a low income or Medicaid population. There is high ER utilization in both rural and urban areas but it is significantly higher in urban areas (45% vs. 37%).
High ER utilization is typically linked with poor access to primary care. From the data in this survey, a high percentage of children are receiving annual preventive care visits. Thus there may be a number of other potential reasons ER utilization is high. While ability to schedule sick visits is comparable to national standards, children in urban areas are less likely to be able to schedule a sick visit on the same day and have a significantly higher utilization of the ER. In addition, parents may not have good access to after hours care or may not be able reach their provider after hours. Parents may simply be uneducated on proper utilization of the ER, or unintentional incentives may encourage ER utilization.
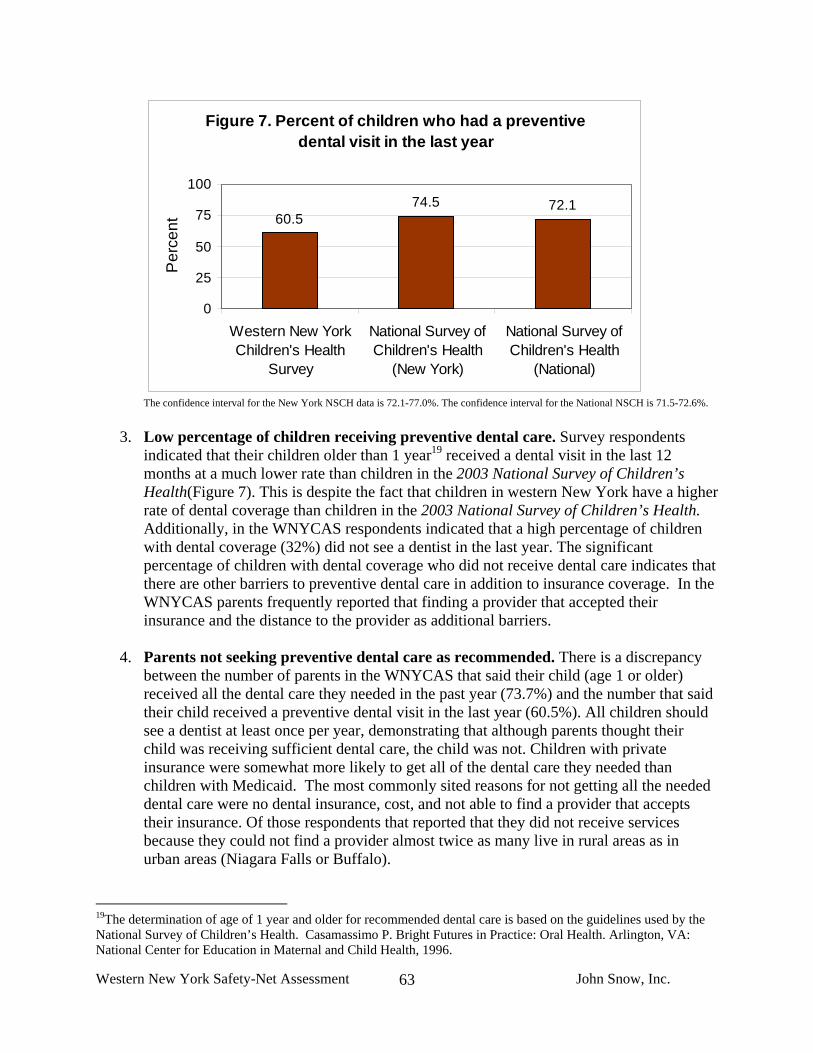
Western New York Safety-Net Assessment John Snow, Inc.
63
Figure 7. Percent of children who had a preventive dental visit in the last year
60.574.5 72.1
0
25
50
75
100
Western New YorkChildren's Health
Survey
National Survey ofChildren's Health
(New York)
National Survey ofChildren's Health
(National)
Per
cent
The confidence interval for the New York NSCH data is 72.1-77.0%. The confidence interval for the National NSCH is 71.5-72.6%.
3. Low percentage of children receiving preventive dental care. Survey respondents indicated that their children older than 1 year19 received a dental visit in the last 12 months at a much lower rate than children in the 2003 National Survey of Children’s Health(Figure 7). This is despite the fact that children in western New York have a higher rate of dental coverage than children in the 2003 National Survey of Children’s Health. Additionally, in the WNYCAS respondents indicated that a high percentage of children with dental coverage (32%) did not see a dentist in the last year. The significant percentage of children with dental coverage who did not receive dental care indicates that there are other barriers to preventive dental care in addition to insurance coverage. In the WNYCAS parents frequently reported that finding a provider that accepted their insurance and the distance to the provider as additional barriers.
4. Parents not seeking preventive dental care as recommended. There is a discrepancy
between the number of parents in the WNYCAS that said their child (age 1 or older) received all the dental care they needed in the past year (73.7%) and the number that said their child received a preventive dental visit in the last year (60.5%). All children should see a dentist at least once per year, demonstrating that although parents thought their child was receiving sufficient dental care, the child was not. Children with private insurance were somewhat more likely to get all of the dental care they needed than children with Medicaid. The most commonly sited reasons for not getting all the needed dental care were no dental insurance, cost, and not able to find a provider that accepts their insurance. Of those respondents that reported that they did not receive services because they could not find a provider almost twice as many live in rural areas as in urban areas (Niagara Falls or Buffalo).
19The determination of age of 1 year and older for recommended dental care is based on the guidelines used by the National Survey of Children’s Health. Casamassimo P. Bright Futures in Practice: Oral Health. Arlington, VA: National Center for Education in Maternal and Child Health, 1996.

Western New York Safety-Net Assessment John Snow, Inc.
64
5. The four most significant barriers to access across all forms of care reported by parents are insurance, acceptance of insurance type, distance to provider, and cost. Parents were asked if their child received all the care he or she needed in the areas of general medical care, dental care, mental health, and specialty care. If a child did not get all of the care he or she needed, parents were asked to report what the major barriers were to accessing care. The most commonly reported barriers to access across all types of care – medical, dental, mental and specialty – are: no insurance, “can’t find provider who accepts child’s insurance”, distance, and cost.
a. Insurance was most frequently reported barrier for dental and mental health. b. Acceptance of coverage was frequently reported for specialty care and dental. c. Distance was most frequently reported as a barrier for specialty care.
The barriers that parents most often report are consistent with the barriers providers and other members of the safety-net reported in the qualitative assessment. Key informants often mentioned the challenge in finding dental providers that accept Medicaid and that distance is the primary barrier to specialty care in rural areas.
Figure 8. Ability of parents to speak to provider by phone
4.216.6 20.7
48.7
1.0 4.914.2
79.9
0153045607590
Never
Someti
mes
Usuall
y
Always
Perc
ent
Western New YorkChildren's HealthSurveyNational Survey ofChildren's Health
The confidence intervals of the National NSCH data is 79.2-80.6% for “Always”, 13.6-14.8% for “Usually”, 4.5-5.3% for “Sometimes”, and 0.8-1.2% for “Never.”
6. Parents are not always able to get advice they need from their provider by phone.
Parents were asked how often they were able to get the advice they needed when calling their child’s provider. This question was asked to determine parents’ ability to communicate with their child’s provider outside of an office visit. Compared to national data, a much smaller number of parents reported they always got the information they needed, and a much larger number said they never were able to get the information they needed by phone in western New York(Figure 8). A parent’s ability to reach a provider by phone may affect their decision to delay or seek immediate care for a sick child. Ultimately, poor phone access may contribute to higher utilization of the ER.

Western New York Safety-Net Assessment John Snow, Inc.
65
C. Detailed Discussion of Findings Descriptions of the geographic and demographic characteristics of survey respondents and a detailed discussion of the findings follows below. The number of survey respondents in addition to the percentage is listed in parentheses as (n= X) when appropriate. Where there are a sufficient number of responses comparisons were made between groups based on poverty status, income, race, location of survey distribution (community versus provider location), urban and rural geography, and insurance status. Differences between groups were tested for significance using a Chi-Square test. The level of significance is indicated in parentheses as (p< X). A complete list of frequencies for each question is listed in Appendix E. 1. Description/characteristics of population surveyed Erie County makes up the largest percent of the population in the eight western New York Counties (59.5%). Of the 668 surveys collected, 33.8% were from Erie County (Table 11). Allegany County was significantly overrepresented: 18.6% of surveys were from that county, whereas the population in Allegany County represents 3% of western New York’s population. An analysis of Allegany compared to other rural counties showed that the over sampling in this county does not impact the overall urban and rural results. Orleans and Wyoming were overrepresented as well. See Appendix E for a full listing of survey sites by county. Table 11. Number of surveys collected in each county. The urban rural differences in consumer experience were reviewed by comparing the data from Buffalo and Niagara Falls to the rural counties. Forty-one percent (n= 274) of surveys collected were from these two cities.
County Frequency of Surveys
Percent of Surveys
Total Population
Percent of Area
Population Allegany 124 18.6 50,267 3.3Cattaraugus 47 7.0 81,534 5.3Chautauqua 32 4.8 135,357 8.7Erie 226 33.8 921,390 59.5Genesee 15 2.2 58,830 3.8Niagara 77 11.5 216,130 14.0Orleans 45 6.7 43,213 2.7Wyoming 80 9.8 42,613 2.8Other 10 1.5 - - Unidentified 12 1.8 - - TOTAL 668 100.0 1,548,334 100.00

Western New York Safety-Net Assessment John Snow, Inc.
66
Table 12. Demographic Characteristics Children Age Range:
<1 year 11% 1-5 years 39% 6-12 years 34% 13-18 years 15%
Children with special needs: 19% of children need more health services than usual* *Determined by question 13 of survey
Parents Age range: 17-72 (average age 34)
Gender: 84% Female 16% Male
Race: 66% White 22% Black or African American 3% Native American 1% Asian 7% Hispanic
Employment: Fulltime: 42.0% Part time (one job): 15.6% Part time (multiple jobs): 3.0% Not employed retired: 1.6% Not employed for pay: 16.3% Not employed –disability: 12.9% Other: 2.1%
Household Income: <10,000 25.3% 10,000-15,000 15.0% 15,000-25,000 19.5% 25,000-35,000 11.5% 35,000-50,000 10.8% 50,000-75,000 7.0% 75,000+ 6.1%
Poverty Level: 62% of households live under 200% of FPL
Number of children living at home 87% 1-3 children living at home 13% 4+ children living at home
Sixty-six percent (66%) of those surveyed identified as White alone (compared to 87% overall in western New York), 22% identified as Black or African-American alone, 3% as Native American or Alaskan Native alone, 1% as Asian alone, and fewer than 1% as Native Hawaiian or Pacific Islander alone. Three percent (3%) declined to answer or did not know, and 2% identified as another race. The remaining 4% identified as one or more races. When asked specifically about Hispanic ethnicity, 7% of survey respondents identified as Hispanic/Latino. This compares to 3% of the population in western New York that is Hispanic/Latino. Fewer than 2% (n=11) of surveys were completed in Spanish (Table 13). Table 13. Race and Ethnicity of Survey Respondents
Race/Ethnicity Frequency Percent
WNY Percent
2000 Census
Data White alone 442 66 87 Black/African American alone 149 22 9 Native American/Alaskan Native alone 23 3 <1 Asian alone 5 1 1 Native Hawaiian and Other Pacific Islander alone 1 0 0
Other 14 2 1 More than one race 25 4 1 Did not know 3 0 Declined to answer 12 2 Total 668 100 100 Hispanic/Latino 46 7 3
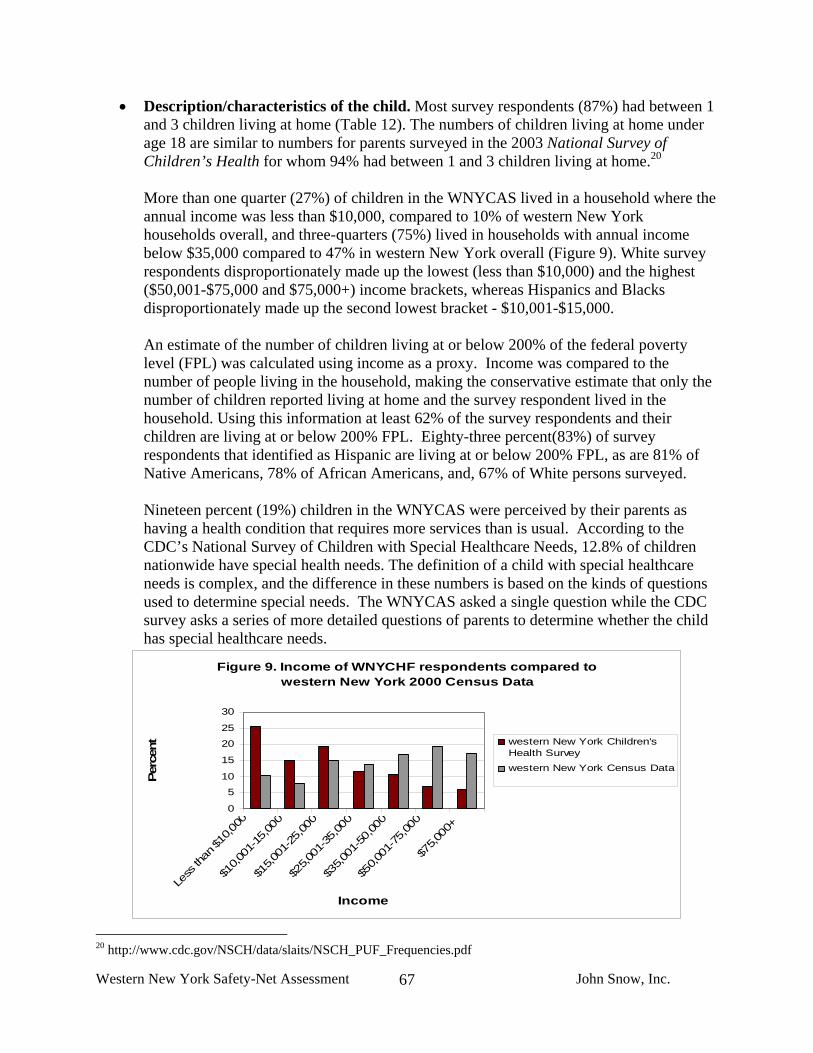
Western New York Safety-Net Assessment John Snow, Inc.
67
• Description/characteristics of the child. Most survey respondents (87%) had between 1 and 3 children living at home (Table 12). The numbers of children living at home under age 18 are similar to numbers for parents surveyed in the 2003 National Survey of Children’s Health for whom 94% had between 1 and 3 children living at home.20
More than one quarter (27%) of children in the WNYCAS lived in a household where the annual income was less than $10,000, compared to 10% of western New York households overall, and three-quarters (75%) lived in households with annual income below $35,000 compared to 47% in western New York overall (Figure 9). White survey respondents disproportionately made up the lowest (less than $10,000) and the highest ($50,001-$75,000 and $75,000+) income brackets, whereas Hispanics and Blacks disproportionately made up the second lowest bracket - $10,001-$15,000.
An estimate of the number of children living at or below 200% of the federal poverty level (FPL) was calculated using income as a proxy. Income was compared to the number of people living in the household, making the conservative estimate that only the number of children reported living at home and the survey respondent lived in the household. Using this information at least 62% of the survey respondents and their children are living at or below 200% FPL. Eighty-three percent(83%) of survey respondents that identified as Hispanic are living at or below 200% FPL, as are 81% of Native Americans, 78% of African Americans, and, 67% of White persons surveyed.
Nineteen percent (19%) children in the WNYCAS were perceived by their parents as having a health condition that requires more services than is usual. According to the CDC’s National Survey of Children with Special Healthcare Needs, 12.8% of children nationwide have special health needs. The definition of a child with special healthcare needs is complex, and the difference in these numbers is based on the kinds of questions used to determine special needs. The WNYCAS asked a single question while the CDC survey asks a series of more detailed questions of parents to determine whether the child has special healthcare needs.
Figure 9. Income of WNYCHF respondents compared to western New York 2000 Census Data
0
5
10
15
20
25
30
Less
than
$10,0
00
$10,0
01-15,00
0
$15,0
01-25,00
0
$25,0
01-35,00
0
$35,0
01-50,00
0
$50,0
01-75,00
0
$75,0
00+
Income
Perc
ent western New York Children's
Health Surveywestern New York Census Data
20 http://www.cdc.gov/NSCH/data/slaits/NSCH_PUF_Frequencies.pdf
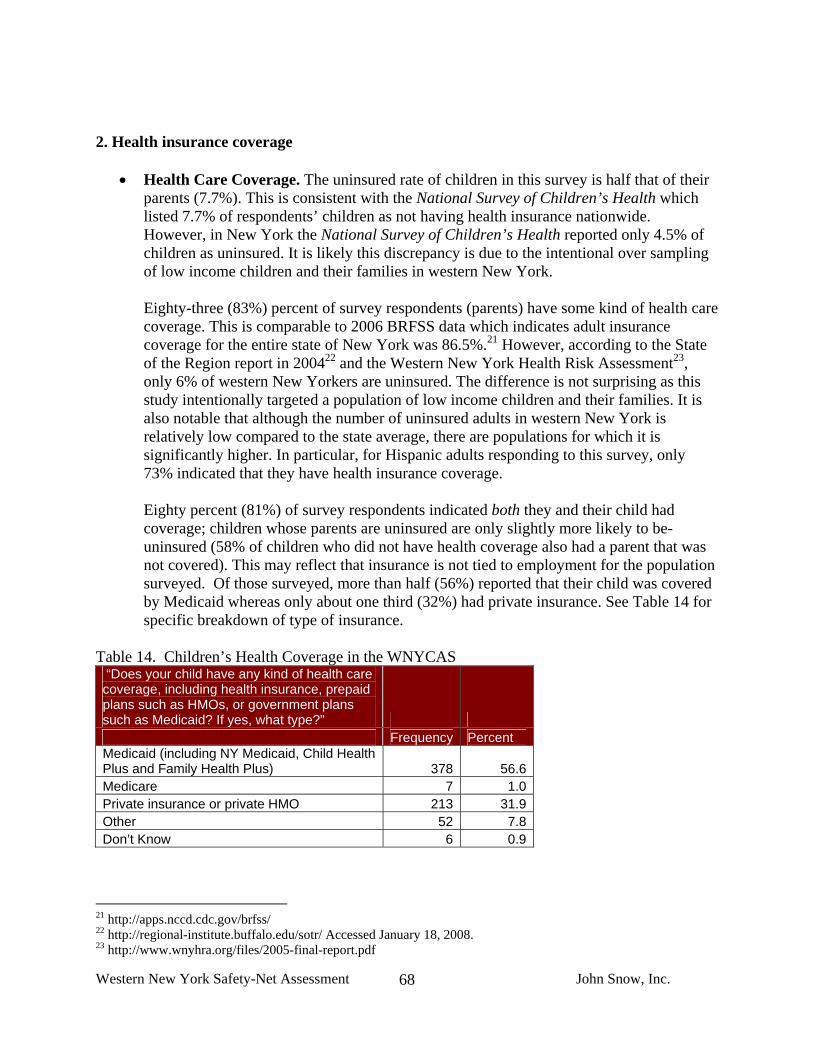
Western New York Safety-Net Assessment John Snow, Inc.
68
2. Health insurance coverage
• Health Care Coverage. The uninsured rate of children in this survey is half that of their parents (7.7%). This is consistent with the National Survey of Children’s Health which listed 7.7% of respondents’ children as not having health insurance nationwide. However, in New York the National Survey of Children’s Health reported only 4.5% of children as uninsured. It is likely this discrepancy is due to the intentional over sampling of low income children and their families in western New York.
Eighty-three (83%) percent of survey respondents (parents) have some kind of health care coverage. This is comparable to 2006 BRFSS data which indicates adult insurance coverage for the entire state of New York was 86.5%.21 However, according to the State of the Region report in 200422 and the Western New York Health Risk Assessment23, only 6% of western New Yorkers are uninsured. The difference is not surprising as this study intentionally targeted a population of low income children and their families. It is also notable that although the number of uninsured adults in western New York is relatively low compared to the state average, there are populations for which it is significantly higher. In particular, for Hispanic adults responding to this survey, only 73% indicated that they have health insurance coverage.
Eighty percent (81%) of survey respondents indicated both they and their child had coverage; children whose parents are uninsured are only slightly more likely to be-uninsured (58% of children who did not have health coverage also had a parent that was not covered). This may reflect that insurance is not tied to employment for the population surveyed. Of those surveyed, more than half (56%) reported that their child was covered by Medicaid whereas only about one third (32%) had private insurance. See Table 14 for specific breakdown of type of insurance.
Table 14. Children’s Health Coverage in the WNYCAS “Does your child have any kind of health care coverage, including health insurance, prepaid plans such as HMOs, or government plans such as Medicaid? If yes, what type?” Frequency Percent Medicaid (including NY Medicaid, Child Health Plus and Family Health Plus) 378 56.6Medicare 7 1.0Private insurance or private HMO 213 31.9Other 52 7.8Don’t Know 6 0.9
21 http://apps.nccd.cdc.gov/brfss/ 22 http://regional-institute.buffalo.edu/sotr/ Accessed January 18, 2008. 23 http://www.wnyhra.org/files/2005-final-report.pdf

Western New York Safety-Net Assessment John Snow, Inc.
69
Although most children (92%) were currently covered by health insurance at the time of the WNYCAS, 17% of respondents indicated that there was some time in the past 12 months when their child was not covered. This is high compared to the National Survey of Children’s Health numbers for the State of New York (11.7% CI:10.0-13.5%) and for the nation as a whole (14.9% CI: 14.5-15.4%) (Figure 5). This may be because a large number of children in the WNYCAS are covered by Medicaid. Children with Medicaid were more likely than children with other types of insurance to have experienced lapses in coverage - 71% (n=66 of 93) of currently insured children who had experienced lapses in coverage over the past 12 months were covered by Medicaid. And 80% (n=89) who experienced lapses in coverage were living at or below 200% FPL. Over one-quarter - 27% (n=12) of children whose parents identified as Hispanic/Latino had lapses in insurance coverage. There were no other significant differences between races in lapses in insurance coverage.
• Dental Care Coverage. Seventeen percent (17%) of all children did not have dental
coverage, and 18% of children over the age of 2 did not have dental coverage. In comparison, according to the National Survey of Children’s Health 22.8% (CI:22.4-23.3%) of children nationwide do not have dental health coverage. Also perhaps counter intuitively, children living below 200% poverty are more likely to have dental coverage(79.6%) than children living above 200% poverty (74.8%) (p<0.05). This is likely explained by the large number of families surveyed with children covered by Medicaid. Children on Medicaid are more likely to have dental coverage (85%) than privately insured children (73%). Children of African American parents were more likely to have dental coverage (82.9% p<0.05) than other races/ethnicities – in large part because they are more likely to be covered by Medicaid. Notably, children in rural areas were more likely to lack dental coverage (21%) than in the urban areas of Erie and Niagara Falls (11% p<0.01).
3. Health care access and utilization
• Frequency of where child usually gets care. Families were asked where they “usually” take their children when he or she is sick and needs health care. For most families their primary source of care is private physicians (76%), followed by community health centers (16%), hospital outpatient clinics (1.5%), and the emergency room (4%). This compares similarly to the distribution of sources of care for adults nationally according to the Commonwealth Fund Survey (Table 15).
Table.15 Usual Source of Care Children in Western New York
(%) Adults in the Commonwealth Fund Survey (%)
Private Physicians 76 71 Community Health Center 16 11 Hospital Outpatient Clinic 1.5 5 Emergency Room 4 5 Some Other Place 0.25 3 Don’t Know 0.7 6

Western New York Safety-Net Assessment John Snow, Inc.
70
• Frequency of routine preventive care. Children’s access to primary care was measured
in part by whether they had received a preventive care visit in the last twelve months. Of the children surveyed 91.2% had visited a provider for a preventive visit in the last months. The 2003 National Survey of Children’s Health found that 77.8% of children nationally had a preventive care visit and 88.3% of kids in the State of New York overall. By this measure, the children of western New York have good access to primary care.
While the rate of preventive care visits is high, access is not uniform. We found differences in access by insurance status, race, and poverty status. Children that had private insurance (93%) and Medicaid (92%), had higher rates of preventive care than the uninsured (74%) (Figure 10). Families at 200% and below of the federal poverty level had lower rates of accessing care, and of those that did not have a primary care visit in the last year, 70% were in poverty. There were no differences between the rate of annual preventive care visits by race or between the children surveyed in provider and community sites.
Figure 10. The percent of children who have had a preventive care visit in the last twelve months by insurance type
7483
91 92 93100
0
20
40
60
80
100
120
NoInsurance
Medicare Other Medicaid PrivateInsurance
More thanOne Type ofInsurance
Medical Insurance Type
Perc
ent
• Frequencies for lengths of time wait for preventive appointment. As a measure of the convenience of accessing primary care, parents were asked how quickly they could get an appointment for preventive care. Most families were able to schedule a preventive care visit in less than a week (77%), and 6.5 % of families had to wait a month to schedule an appointment. Parents who lived in Niagara or Erie counties less frequently (18%) were able to schedule an appointment the same day as parents in other areas (33.8%). Parents that were surveyed in community sites were more likely to be able to schedule a preventive care visit in within a week than families surveyed in provider sites (p<0.01) (Table 16). This may reflect the difference in the usual source of care between these two groups.
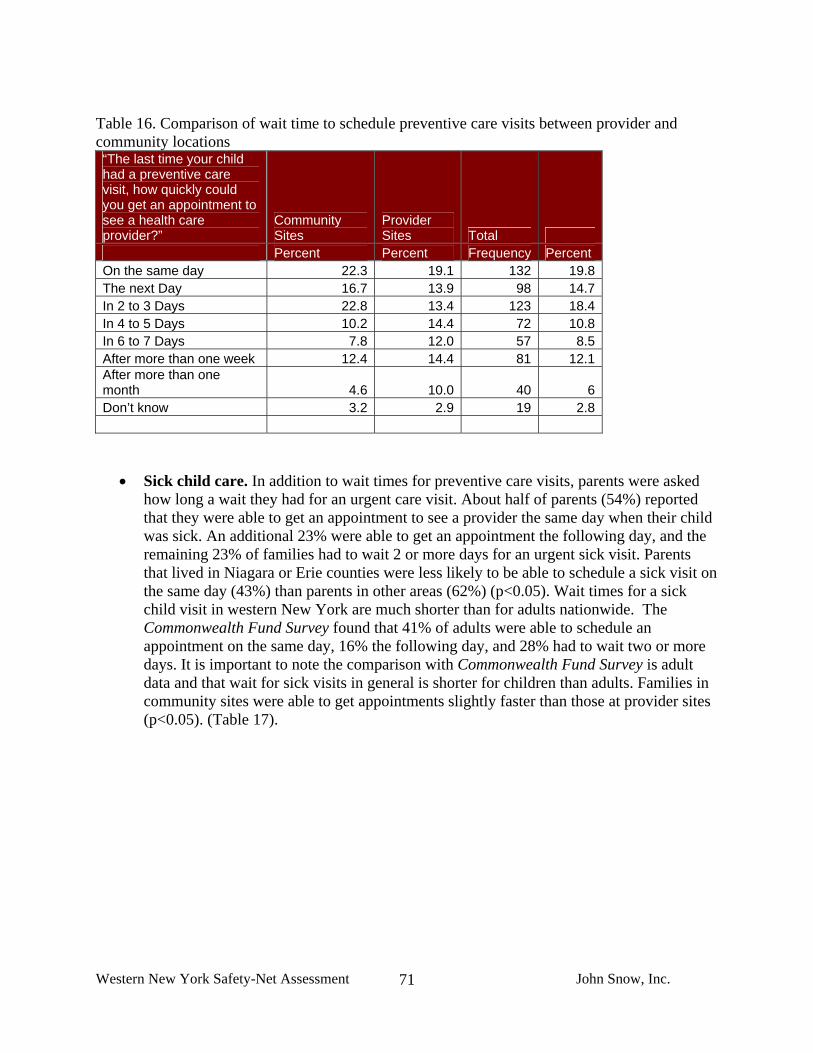
Western New York Safety-Net Assessment John Snow, Inc.
71
Table 16. Comparison of wait time to schedule preventive care visits between provider and community locations “The last time your child had a preventive care visit, how quickly could you get an appointment to see a health care provider?”
Community Sites
Provider Sites Total
Percent Percent Frequency Percent On the same day 22.3 19.1 132 19.8 The next Day 16.7 13.9 98 14.7 In 2 to 3 Days 22.8 13.4 123 18.4 In 4 to 5 Days 10.2 14.4 72 10.8 In 6 to 7 Days 7.8 12.0 57 8.5 After more than one week 12.4 14.4 81 12.1 After more than one month 4.6 10.0 40 6 Don’t know 3.2 2.9 19 2.8
• Sick child care. In addition to wait times for preventive care visits, parents were asked how long a wait they had for an urgent care visit. About half of parents (54%) reported that they were able to get an appointment to see a provider the same day when their child was sick. An additional 23% were able to get an appointment the following day, and the remaining 23% of families had to wait 2 or more days for an urgent sick visit. Parents that lived in Niagara or Erie counties were less likely to be able to schedule a sick visit on the same day (43%) than parents in other areas (62%) (p<0.05). Wait times for a sick child visit in western New York are much shorter than for adults nationwide. The Commonwealth Fund Survey found that 41% of adults were able to schedule an appointment on the same day, 16% the following day, and 28% had to wait two or more days. It is important to note the comparison with Commonwealth Fund Survey is adult data and that wait for sick visits in general is shorter for children than adults. Families in community sites were able to get appointments slightly faster than those at provider sites (p<0.05). (Table 17).

Western New York Safety-Net Assessment John Snow, Inc.
72
Table 17. Comparison of the wait time for children’s sick visits between parents surveyed in community sites versus provider sites.
“The last time your child was sick or needed medical attention in the past 12 months, how quickly could you get an appointment to see a health care provider?”
Community Sites
Provider Sites Total
Percent Percent Frequency Percent On the Same Day 56.7 50.0 363 54.4 The Next Day 24.7 22.1 159 23.8 In 2 to 3 Days 9.3 8.4 60 8.9 In 4 to 5 Days 2.7 3.1 19 2.8 In 6 to 7 Days 0.2 3.5 9 1.3 After More than one week 0.5 1.8 6 <1 Not Sick no needed attention 2.9 5.3 25 3.7 Went to an ER 2.0 3.5 17 2.5 Missing 0.9 2.2 9 1.3
• Times to ER in past year. Parents were asked to report how many times their child had
visited the ER in the last year and if so for what reason. Forty percent (40%) of parents reported that their child had been to the ER one or more times in the last year. This rate is significantly higher than the national rate of 18.9% of children from the 2003 National Survey of Children’s Health. The rate of children going two or more times is three times higher in western New York (18%) than the National Survey of Children’s Health (5.7%). In addition, children on Medicaid using the ER one or more times is 14.3%, which is well below the rate of Medicaid users in western New York (45%). The differences in over utilization between western New York and the national data cannot be accounted for by over sampling a low income or Medicaid population.
Figure 11. The national rate of children’s ER visits by insurance type.
Child and Adolescent Health Measurement Initiative. 2003 National Survey of Children's Health, Data Resource Center for Child and Adolescent Health website. Retrieved [01/14/08] from www.nschdata.org
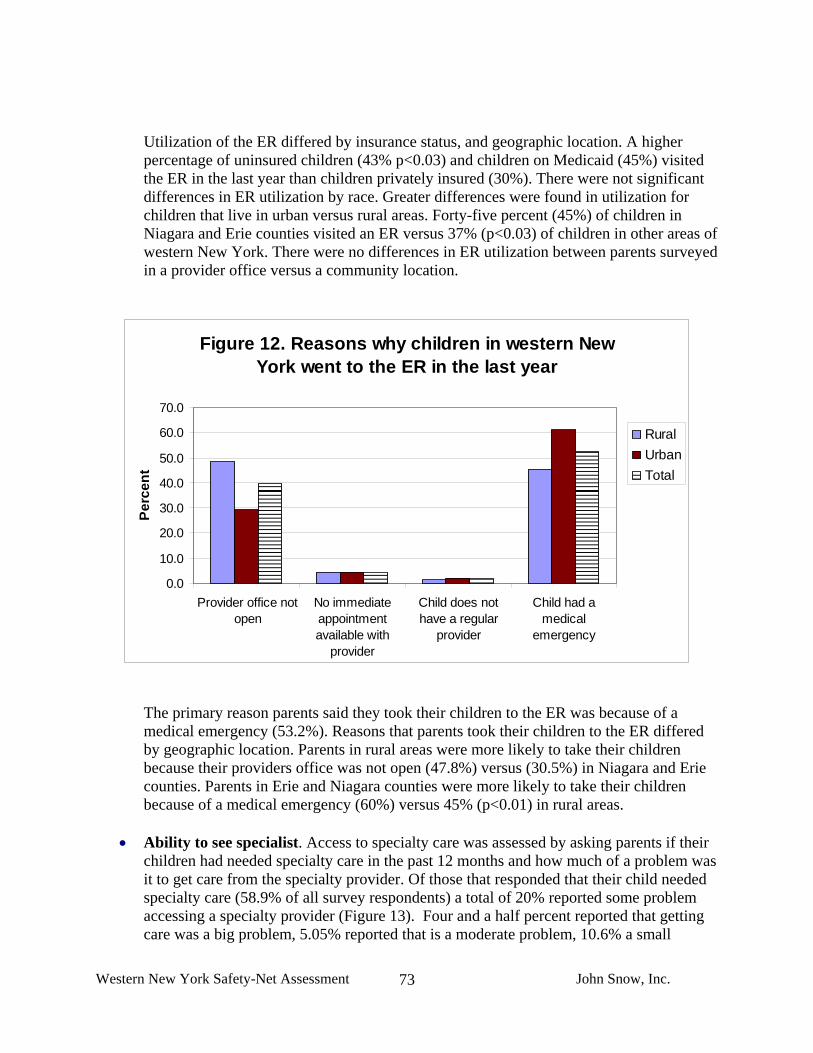
Western New York Safety-Net Assessment John Snow, Inc.
73
Utilization of the ER differed by insurance status, and geographic location. A higher percentage of uninsured children (43% p<0.03) and children on Medicaid (45%) visited the ER in the last year than children privately insured (30%). There were not significant differences in ER utilization by race. Greater differences were found in utilization for children that live in urban versus rural areas. Forty-five percent (45%) of children in Niagara and Erie counties visited an ER versus 37% (p<0.03) of children in other areas of western New York. There were no differences in ER utilization between parents surveyed in a provider office versus a community location.
Figure 12. Reasons why children in western New York went to the ER in the last year
0.0
10.0
20.0
30.0
40.0
50.0
60.0
70.0
Provider office notopen
No immediateappointmentavailable with
provider
Child does nothave a regular
provider
Child had amedical
emergency
Perc
ent
RuralUrbanTotal
The primary reason parents said they took their children to the ER was because of a medical emergency (53.2%). Reasons that parents took their children to the ER differed by geographic location. Parents in rural areas were more likely to take their children because their providers office was not open (47.8%) versus (30.5%) in Niagara and Erie counties. Parents in Erie and Niagara counties were more likely to take their children because of a medical emergency (60%) versus 45% (p<0.01) in rural areas.
• Ability to see specialist. Access to specialty care was assessed by asking parents if their
children had needed specialty care in the past 12 months and how much of a problem was it to get care from the specialty provider. Of those that responded that their child needed specialty care (58.9% of all survey respondents) a total of 20% reported some problem accessing a specialty provider (Figure 13). Four and a half percent reported that getting care was a big problem, 5.05% reported that is a moderate problem, 10.6% a small
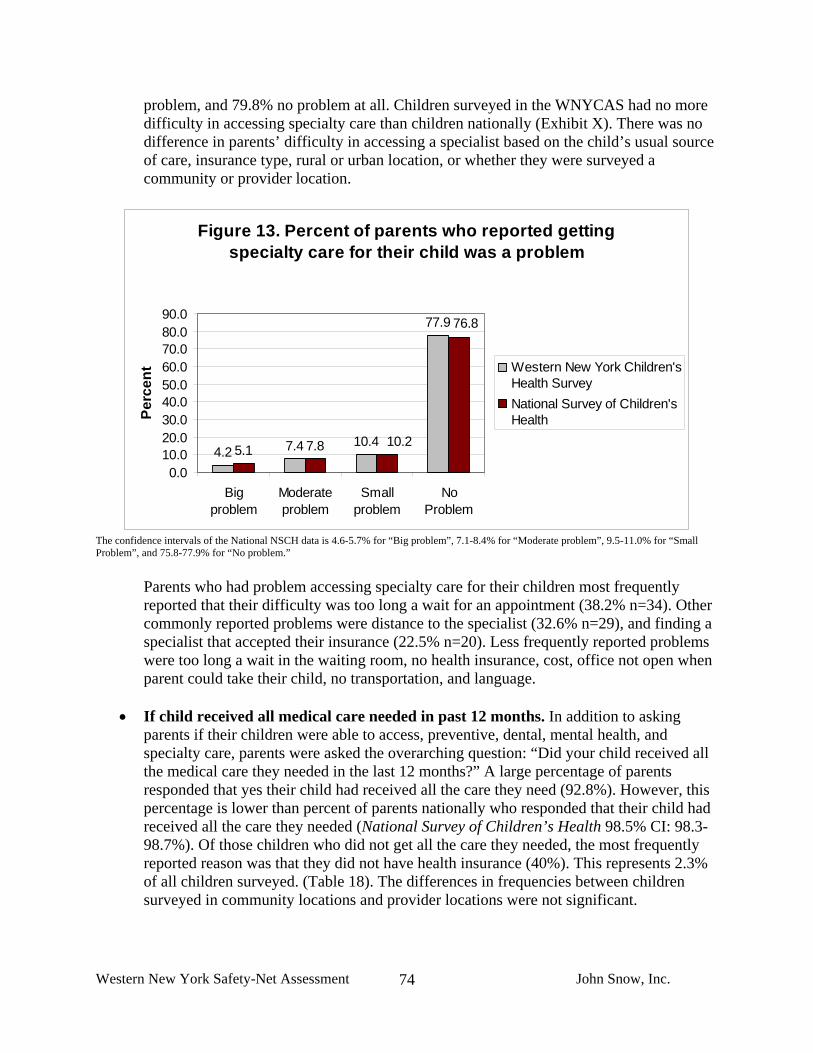
Western New York Safety-Net Assessment John Snow, Inc.
74
problem, and 79.8% no problem at all. Children surveyed in the WNYCAS had no more difficulty in accessing specialty care than children nationally (Exhibit X). There was no difference in parents’ difficulty in accessing a specialist based on the child’s usual source of care, insurance type, rural or urban location, or whether they were surveyed a community or provider location.
Figure 13. Percent of parents who reported getting specialty care for their child was a problem
4.2 7.4 10.4
77.9
5.1 7.8 10.2
76.8
0.010.020.030.040.050.060.070.080.090.0
Bigproblem
Moderateproblem
Smallproblem
NoProblem
Perc
ent Western New York Children's
Health Survey National Survey of Children'sHealth
The confidence intervals of the National NSCH data is 4.6-5.7% for “Big problem”, 7.1-8.4% for “Moderate problem”, 9.5-11.0% for “Small Problem”, and 75.8-77.9% for “No problem.”
Parents who had problem accessing specialty care for their children most frequently reported that their difficulty was too long a wait for an appointment (38.2% n=34). Other commonly reported problems were distance to the specialist (32.6% n=29), and finding a specialist that accepted their insurance (22.5% n=20). Less frequently reported problems were too long a wait in the waiting room, no health insurance, cost, office not open when parent could take their child, no transportation, and language.
• If child received all medical care needed in past 12 months. In addition to asking
parents if their children were able to access, preventive, dental, mental health, and specialty care, parents were asked the overarching question: “Did your child received all the medical care they needed in the last 12 months?” A large percentage of parents responded that yes their child had received all the care they need (92.8%). However, this percentage is lower than percent of parents nationally who responded that their child had received all the care they needed (National Survey of Children’s Health 98.5% CI: 98.3-98.7%). Of those children who did not get all the care they needed, the most frequently reported reason was that they did not have health insurance (40%). This represents 2.3% of all children surveyed. (Table 18). The differences in frequencies between children surveyed in community locations and provider locations were not significant.

Western New York Safety-Net Assessment John Snow, Inc.
75
Table 18. Reasons why children did not get all the medical care they needed “Why did your child not get all the medical care he/she needed?” Frequency Percent* Cost 9 22.5No health insurance 16 40.0Can't find a provider who accepts coverage 7 17.5Distance 7 17.5Office not open when I could get there 4 10.0Too long a wait for an appointment 5 12.5Too long a wait in the waiting room 0 0.0No child care 0 0.0No transportation 4 10.0No access for people with disabilities 0 0.0Provider did not speak my language 0 0.0Don't know 14 35.0Other 7 17.5Total 40 100
*Percent of total people who responded they had a problem accessing care.
• Dental care. Dental care access was determined by two questions. Did the child see a dentist for preventive care in the last twelve months? Did the child receive all the dental care they needed in the last 12 months? Of those children that are older than 1 year24, 60.5% received a dental visit in the last 12 months. This compares to 72.1% of children in the 2003 National Survey of Children’s Health. Children surveyed in provider sites (68.4%) were significantly more likely to have had a preventive dental care visit in the last year than children in community locations (56.6% p<0.01). There were no significant differences between rural and urban locations in the rate of preventive dental visits in the last year.
Children with dental coverage were more likely to have a preventive visit in the last year (66%) than children without dental coverage (52%). However, holding insurance does not ensure a child is seen for preventive care. There are a high percentage of children with dental coverage who did not see a dentist in the last year (32%). There were not significant differences between children on Medicaid and those with private insurance in their ability to get all the dental care they needed.
If children did not receive all the dental care they needed parents were asked why. The most commonly cited reasons for not getting all the needed dental care were no dental insurance (18.9% n=30), cost (16.4% n=26), and not able to find a provider that accepts their insurance (14.5% n=23) (Table 19).
24The determination of age of 1 year and older for recommended dental care is based on the guidelines used by the National Survey of Children’s Health. Casamassimo P. Bright Futures in Practice: Oral Health. Arlington, VA: National Center for Education in Maternal and Child Health, 1996.

Western New York Safety-Net Assessment John Snow, Inc.
76
Table 19. Reasons why children did not get all the dental care they needed “Why did your child not get all the dental care he/she needed?” Frequency Percent* Cost 26 16.4 No health insurance 30 18.9 Can't find a provider who accepts coverage 23 14.5 Distance 15 9.4 Office not open when I could get there 8 5.0 Too long a wait for an appointment 14 8.8 Too long a wait in the waiting room 0 0.0 No child care 0 0.0 No transportation 10 6.3 No access for people with disabilities 0 0.0 Provider did not speak my language 0 0.0 Don't know 32 20.1 Other 48 30.2 Total 159 100 *Percent of total people who responded they had a problem accessing care.
• Mental health care. Parents were asked whether their child received mental health services in the last 12 months and if all the services needed were received. Twelve percent (12%) reported their child had received mental health services in the last 12 months. This is almost double the number of nationwide according to the National Survey of Children’s Health (6.8%). This may indicate children in western New York have better access to services or have a higher degree of need than children nationally.
Of children that needed mental health services, 12.1% did not get all of the services they needed. There were not significant differences in access to mental health care between families surveyed in provider sites and those surveyed in community sites or rural versus urban locations. The most frequently reported reasons that the child did not get all the care they needed were no insurance (9.0% n=7), can’t find a provider who accepts child’s insurance (6.4% n=5), and too long of a wait for an appointment (6.3% n=5) (Table 20). Parent’s often did not say why their child did not get the care they needed (16.7% n=13).
Table 20. Reasons why children did not get all the mental health care they needed “Why did your child not get all the mental health care/counseling he/she needed?” Frequency Percent Cost 3 3.8No health insurance 7 9.0Can't find a provider who accepts coverage 5 6.4Distance 2 2.6Office not open when I could get there 1 1.3Too long a wait for an appointment 5 6.4Too long a wait in the waiting room, No child care 0 0.0No transportation 2 2.6No access for people with disabilities, Provider did not speak my language 0 0.0Don't know 13 16.7Other 17 21.8Total 78 100*Percent of total people who responded they had a problem accessing care.
Western New York Safety-Net Assessment John Snow, Inc.
77
• Transportation. Parents were asked both how long it takes them to get to their child’s
provider and their usual source of transportation. Seventy-five percent (75%) of parents responded that they drive themselves, 25% are dependent on a friend, relative, bus, taxi, or walking their child. The distance to the provider’s office is less than 15 minutes for 53% of parents, sixteen to thirty minutes for 32% of parents, thirty-one minutes to an hour for 12.6% of parents and more than an hour for 1.9% of parents.
• Ability to get advice from provider by phone. Parents were asked how often they were
able to get the advice they needed when calling their child’s provider. About half of parents (48%) reported they always got the information they needed. An additional 20.8% reported they usually got the information they needed, 16.5% sometimes, and 4.2% never. western New York has room to improve when compared to the National Survey of Children’s Health where 79.9% of parents said they always received the advice they needed, and only 1% said they never received the care they needed (Figure 8).
4. Cultural competence and health literacy
• Parent’s ability to understand information from their child’s providers. Eighty-nine percent (89%) of respondents indicated that their child’s health care provider always or usually explains things in a way that they and their child can understand. Similarly, 87% of respondents indicated that it is very or somewhat easy to understand written information they receive from their child’s provider and 9% find it somewhat or very difficult (Figure 4). In the Commonwealth Fund Survey, only 79% of adults responded that it was very or somewhat easy to understand written information they receive from a provider and 15% reported it was somewhat or very difficult. If they do not understand information given by a provider, 85.3% of respondents will ask their provider or someone else in the office to explain. After that they are most likely to ask a pharmacist (4.8%), followed by asking a family member or friend (3.8%) and lastly by looking for information independently – on the internet or in print materials (2.7%).
• Internet use. Fifty-six percent (56% n=371) of respondents go online to access the
Internet or send and receive email. Of those 371, more than half use the internet to look for advice on health of their child at least once per month.
• Not following provider’s advice. Nine percent (9%) of respondents have not always
followed a provider’s advice or treatment plan for their child in the past two years. More than half (n=33) said it was because they disagreed with what the provider wanted them to do. An additional 9 people did not understand what they were asked to do (Table 21).

Western New York Safety-Net Assessment John Snow, Inc.
78
Table 21. Reason’s why parents do not always follow their child’s provider’s advice
“Why did you not follow the health care provider’s advice or treatment plan?” Frequency
Western New York Children’s Access Survey
(%)
Adult Commonwealth
Survey (%) I didn't understand what I was supposed to do 9 13.0 50.0I disagreed with what the provider wanted me to do 33 47.8 29.0The provider's advice or treatment plan cost too much 3 4.3 10.0The provider's advice was too difficult to do 4 5.8 5.0The provider's advice or treatment plan went against my personal beliefs 3 4.3 4.0Because of potential side effects of the drug or treatment 6 8.7 3Other 11 15.9 3Total 69 100.0 3
In the Commonwealth Fund Survey, significantly more – 19% – of adults indicated that they did not always follow a provider’s advice or treatment plan for themselves over the last 2 years. It may be that people are more likely to follow advice regarding their children. For Commonwealth Fund Survey respondents that did not follow a provider’s advice, many more identified cost, the difficulty of following the advice or plan, disagreement with personal beliefs, or the potential side effects of the treatment plan as their reasons for not following the provider’s advice. Parents survey in the WNYCAS more often suggested that they did not understand what they were supposed to do. The differences may have to do with a greater willingness of persons to spend time and efforts on their child’s health than on their own and this also emphasizes the need for health literacy.
• Language. Fifteen (15) or (2.2%) of survey respondents indicated that they needed an
interpreter in the past 2 years to help them communicate with a health provider. In comparison, at the national level the Commonwealth Fund Survey found that 14% of adults identified that they needed an interpreter to speak with a health care provider. For those that did need an interpreter in the WNYCAS– almost half were provided a professional interpreter at the doctor’s office or from a bilingual staff member at the office others were able to get help from a school teacher or other school professional, family member/friend. In the Commonwealth Fund Survey, just over half of those surveyed (slightly more than in this survey) responded that they were able to get interpreter services at the clinic or provider’s office from bilingual staff or a professional interpreter.

Western New York Safety-Net Assessment John Snow, Inc.
79
VI. HEALTH INFORMATION TECHNOLOGY A. Review of Safety-Net HIT Capacity in Western New York The Project Team collected basic information on HIT capacity and available resources through site visits and phone interviews with thirteen core and other essential safety-net providers. In addition, the Project Team conducted five in-depth HIT site visits or extensive phone interviews that were identified through the Project Team’s earlier site visits as having substantial HIT infrastructure or engaging in innovative approaches related to HIT and quality improvement. The providers interviewed as part of this more in-depth HIT assessment are specifically highlighted on our List of Site Visits. All thirteen core and essential safety-net provider sites that the Project Team visited, except for the Wyoming County Community Hospital emergency room, have some form of practice management system that facilitates billing, scheduling, and some informal disease management and tracking functions. Six of the thirteen sites either have a fully functioning, state-of-the-art electronic medical record (EMR) or are planning to implement a full EMR within the next 3-4 months. Seven of the sites have implemented systems that automate chronic disease management activities but 4 of these systems are stand-alone systems that are not integrated with an EMR. Six of the sites have the ability to share electronic information, such as lab results, with affiliated hospitals or lab vendors. However, only one of these sites can exchange information in both directions and most can only receive lab results via a select number of computer terminals. Five of the provider sites have the ability to view x-rays and other diagnostic tests electronically and seven have dedicated HIT coordinators but three of these HIT Coordinators are not based on-site, and in some cases the coordinator plays more of an IT technician or maintenance function than a planning and system development function. Appendix F provides a summary of the HIT infrastructure and capacity within the sites that were visited. Overall, the core and essential safety-net providers interviewed are underutilizing HIT relative to private sector, non-safety-net providers nationally but have comparable HIT capacity to their safety-net peers across the country. The exceptions to this statement are the safety-net providers in the region that are affiliated (formally or informally) with larger health care and academic institutions such as the University at Buffalo and/or the region’s major hospitals. Jefferson Family Practice in Buffalo (University at Buffalo Residency Program), Universal Primary Care in Olean (informally affiliated with Olean General and UB Family Medicine), and the Hamilton B. Mizer Clinic in Niagara (owned by Niagara Fall Memorial Medical Center) are examples of these institutionally affiliated safety-net providers. Each of these providers has a relatively new, state-of-the-art EMR that allows them to send and retrieve electronic information and that automates quality assurance and chronic disease management activities. Contrasting this are the independent community-based providers, such as Northwest Buffalo Community Health Care Center, Oak Orchard in Brockport, the Community Health Center of Buffalo, and the Resource Center in Jamestown, that are doing what they can with limited

Western New York Safety-Net Assessment John Snow, Inc.
80
resources but are admittedly struggling to conduct advanced quality assurance and chronic disease management without additional resources and a more robust HIT infrastructure. Several levels of functionality are relevant when discussing the capacity of provider organizations to utilize HIT effectively. On the most basic level, is the opportunity to capture relevant health information electronically rather than through paper-based systems. Collecting information electronically, however, does not necessarily lead to more efficient and effective patient care and better patient health outcomes. In order for that to be achieved, a broader understanding of the power of HIT is required to support: 1) clinical and business decision making, 2) improvements in scheduling, clinic work flows, and other operational processes, 3) community/patient needs assessment and program development, and 4) tracking and monitoring of patient outcomes. Training and technical assistance activities throughout the region would enable safety-net providers to uniformly embrace HIT and develop the capacity to maximize its use. Among the organizations reviewed through this assessment project, a handful of providers could potentially be viewed as models and have begun to develop not only the HIT hardware, software, and HIT systems but the organizational buy-in, expertise, staff resources, and experience that together translates into clinical and administrative improvements as well as improvements in patient outcomes. However, these burgeoning models would benefit from more support so that: 1) systems and HIT tools can be perfected; 2) leaders and HIT champions can be identified and empowered; organizational cultures that embrace HIT can be fully fostered, and 3) effective collaboration can be promoted throughout the region. In this regard several approaches that have been proven effective in other parts of the country and could be applied to strengthen the overall HIT capacity in western New York. These approaches are discussed in some detail below and some of the lessons learned from these efforts are included in this reports recommendations section. B. State and National Perspectives There is a significant amount of activity in the State of New York with regard to HIT. Major pushes by regional affiliation organizations in both the urban and rural areas of the State focus on both electronic health record adoption and on linking electronic health information through health information exchanges. A number of State and national initiatives are developing practices with respect to building and supporting HIT capacity development within provider organizations. The following are brief descriptions of these efforts. These activities could very well be drawn from as CHFWCNY explores the types of activities to support and promote in western New York.
• Collaborative Initiatives. In the City of New York, the Primary Care Information
Project (PCIP) Taskforce is an interdivisional program designed to use HIT to improve population health in the City. As part of a Mayoral priority, the Taskforce coordinates the Department of Health and Mental Hygiene’s (DOHMH) activities to provide leadership in citywide initiatives to extend use of electronic health records (EHR) among thousands of ambulatory primary care providers. The Community Health Exchange Project (CHEX), also led by DOHMH, is a City-wide initiative to implement EHRs across 29
Western New York Safety-Net Assessment John Snow, Inc.
81
community health centers. The community health centers in the State are also being supported by the Community Health Care Association of New York State (CHCANYS), which provides HIT-related technical assistance, convenes a forum of HIT-related professionals at health centers in the state and is a partner in many of the community health center related HIT initiatives.
• Funding Opportunities for HIT. These broad efforts are being helped along by the large amount of financial resources being supplied by the Health Care Efficiency and Affordability Law for New Yorkers Capital Grant Program (HEAL NY), which began distributing grants in 2005 and currently has additional funding available; the Medical Society of the State of New York (MSSNY); the Agency for Healthcare Research and Quality (AHRQ); and from the Health Resources and Services Administration (HRSA). The HEAL NY HIT grants program is the most substantial of the initiatives, distributing over $300 million during its initial phases to all regions of the State and now making available an additional $8.5 million. Efforts are focusing on building the internal organizational capacity of health care providers to implement and utilize HIT, as well as expanding the exchange of health information electronically across multiple regions, in the eventual hope of creating a Statewide Health Information Network (SHIN).
The western New York Clinical Information Exchange is supported by grants from HEAL NY to develop an online community health network for clinical data exchange, a data repository, e-prescribing and a diagnostic data network. AHRQ has funded projects under the Transforming Healthcare Quality through Information Technology have supported HIT planning projects in the Adirondacks and HRSA has supported telehealth through the University at Buffalo. These represent just a few of the selected HIT initiatives underway across the State of New York.
• Office of National Coordinator (ONC). The Office of the National Coordinator (ONC) has been tasked by the federal government with laying the groundwork for implementing a nationwide health information network (NHIN). The NHIN is envisioned as a series of health data exchange networks connected together that provide real-time data to providers at the point of care. It is a major component of the President’s vision for most American’s to have an electronic health record by 2014. ONC is funding pilot projects around the country to demonstrate the viability of distinct approaches to data exchange, including both centralized and de-centralized databases (or federated models). ONC is also supporting the development and adoption of standards for data exchange through the American Health Information Community (AHIC) and the review and certification of electronic health records (for both in-patient and out-patient settings) through the Certification Commission for Health Information Technology (CCHIT).
Both of these efforts are intended to take the uncertainty out of the HIT marketplace by encouraging HIT vendors to adopt uniform data standards and reduce the likelihood of electronic records being developed that lack interoperability, security and functionality. This will hopefully level the playing field for healthcare providers without deep knowledge of HIT and allow them to acquire systems without a reduced amount of fear. On the incentives side, the Centers for Medicaid and Medicare Services (CMS) are

Western New York Safety-Net Assessment John Snow, Inc.
82
piloting programs to provide enhanced reimbursements to providers who are able to collect and report a uniform set of quality indicators. The longer term expectation is that these programs will promote improved health outcomes for the patients provided with care, with EMRs being a central component of that effort.
• Regional Health Information Organizations (RHIO). HIT has shown significant
promise in improving safety and quality across the country. Electronic health information exchange (HIE) across provider organizations has been promoted as one of the central means for accomplishing these improvements. Advocates for building a nationwide health information network that will allow all health care providers to exchange data with each other frequently tout the quality improvement potential over the potential cost savings and efficiencies. Most current activities in this realm have focused on local efforts (rather than national) through entities known as regional health information organizations (RHIOs). RHIOs are thought to have a greater likelihood of success than other strategies, given that they are locally based, and that they may be linked together in the future to enable national exchange. As more provider organizations store data electronically, the natural next step is to electronically exchange the data with other providers. The complexity of having individual provider organizations (such as hospitals or doctors’ offices) set up protocols for electronic exchange can be daunting, RHIOs have emerged to act as potential independent third parties, bringing stakeholders together, and supporting the development of the appropriate systems, protocols, and eventual HIE networks.25 Western New York has a nascent RHIO that has potential to enhance information exchange and region-wide quality initiatives.
• The Community Clinics Initiative (CCI). The Community Clinics Initiative (CCI), a
unique collaboration between Tides and The California Endowment, begun in 1999 to provide resources, evidence-based programming and evaluation, education and training to support community health centers and clinics. Through information sharing and major grants, CCI acts as a catalyst to strengthen California's community clinics and health centers to improve health outcomes in underserved communities. Through programs and grants in technology, capacity building and leadership, CCI helps to ensure that community-based clinics remain vital partners in building healthier communities. In 2003, CCI introduced Strategic Investments in Technology, which focused on supporting projects that would advance the body of experience understanding regarding technology innovation and HIT innovation. Specifically, CCI invested nearly $3 Million to support collaborative HIT efforts that were implementing a broad and ambitious vision, particularly with respect to HIT and quality improvement, which fostered collaboration and the overall role that community health centers play as part of the community. As a result of this initiative, a great deal was learned about the factors that are critical to successful collaborative IT ventures both with respect to the resources and infrastructure needs required as well as with respect to the collaborative activities and processes that promote success.
25 Adler-Milstein, Julia; Andrew P. McAfee, David W. Bates, and Ashish K. Jha, The State Of Regional Health Information Organizations: Current Activities and Financing,
[Health Affairs 27, no. 1 (2008): w60–w69 (published online 11 December 2007; 10.1377/hlthaff.27.1.w60)]

Western New York Safety-Net Assessment John Snow, Inc.
83
CCI’s research has supported the idea that HIT efforts are more effective when implemented in conjunction with the expertise, economies of scale and experience of provider networks. The network implementation approach has been further endorsed over the last two years by the Office of Health Information Technology (OHIT) as they have formalized their requirements that HIT grant recipients be part of a health center controlled networks. OHIT has distributed more than $31 million dollars over the last year to expand use of HIT at health centers, all of which have been awarded to health center controlled networks (HCCNs). HIT grant eligibility for the current round of OHIT funding is similarly directed.
• Healthy Connections: Strengthening Care through Health Information Technology. The Colorado Health Foundation has been working over the last two years to identify and support the HIT needs of the safety-net providers in Colorado. They conducted a year-long evaluation of needs among safety-net providers across the state which indicated tremendous potential for HIT to help make providers more efficient, to improve coordination of care, to monitor chronic disease, and to increase the field’s ability to understand and address health issues across communities and populations.26 The Colorado Health Foundation then structured a three-pronged initiative called Healthy Connections: Strengthening Care through Health Information Technology to support the needs identified. Healthy Connections consists of capacity-building grants for organizations that are developing their long-term vision for HIT and assessing how to move forward; innovation grants to support organizations already implementing comprehensive HIT plans; and partnership grants to support collaborative efforts designed to improve the quality and integration of care, and increase the efficiency of HIT implementation for low-income, underserved populations. As with CCI and OHIT, the Colorado Health Foundation has supported implementation of HIT through a collaborative model.
26 Health Information Technology: A Strategy for Creating a Healthier Colorado, Colorado Health Foundation, 2007.

Western New York Safety-Net Assessment John Snow, Inc.
84
VII. RECOMMENDATIONS The most important and overarching finding to emerge from JSI’s assessment of the safety-net in western New York is that the core safety-net (providers and organizations that have both the mission and resources to serve the low-income population without regard for their insurance status or ability to pay for services) is limited and in some parts of the region, non-existent. Not only are there a limited absolute number of safety-net providers, particularly outside of Buffalo, of those that do exist many do not serve as full service, medical homes27 for their patients. The region is fortunate that other providers and organizations are contributing substantial levels of service to low-income children and their families, but these default safety-net providers - typically private physician practices, hospital-based practices, and academically-supported providers - cannot ensure ongoing and stable access to care especially for uninsured children and their families. Their resources simply do not enable them to absorb the uninsured population. Even people who have Medicaid face substantial barriers that hinder their access to timely, appropriate, affordable services. In short, without a strong core of primary care providers that are clearly identified as primary care medical homes and/or providers of behavioral health or oral health services and that have the capacity to serve a significant portion of low-income families, the whole network of primary care services in western New York will remain extremely fragile. In order to ensure that low-income families who are currently getting care continue to get it, to improve both the consistency and quality of that care and to bring more people into a system of care, the safety-net in western New York must be further developed and strengthened throughout the region. The following recommendations are intended to achieve this overarching goal. Stabilize and Grow the Safety-Net 1. Support the development of new and/or the expansion of existing organizations so that
they can become stronger contributors to the core safety-net. A priority for western New York is to stabilize and grow the core safety-net with the overall objective of increasing the safety-net’s capacity to serve low income insured, under-insured, and uninsured children and families. In this regard, efforts should be taken to grow new and/or support existing core safety-net sites and bolster those making efforts to become core safety-net providers that are capable and committed to serving all patients regardless of their ability to pay, and particularly to support the development of primary care medical homes as defined in this report. The Federally Qualified Health Center (FQHC) and Rural Health Clinic (RHC) programs under the Health Resources and Services Administration (HRSA) are key programs that can support
27 This report is using the Commonwealth Fund’s definition of medical home defined as: a regular doctor or source of care, easy access to the provider by telephone, easy access to health advice on evenings and weekends or whenever the provider is closed, and visits with the provider that occur conveniently for patients, are on time and are efficient.

Western New York Safety-Net Assessment John Snow, Inc.
85
both the development of new provider organizations and/or new service delivery sites as well as the expansion of existing programs. Both provide for enhanced reimbursement for Medicaid and Medicare beneficiaries, stabilizing an organizations ability to serve these groups, and the FQHC program can also provide Federal grant funding to cover some of the costs of serving the uninsured. Both FQHCs and RHCs serve as medical homes for patients. Based on JSI’s experience, these organizations are significantly under-represented in western New York and their growth could help strengthen the safety-net. 2. Stabilize and enhance the role of providers who are not part of the core safety-net but
can provide substantial services if supported (e.g. residency clinics). The goal of this recommendation is to enable provider organizations that may serve the low-income and uninsured population, and would like to do more, improve their ability to do so. In western New York, many of the organizations providing a substantial level of care to these populations are supported by a hospital and/or medical school residency programs. Often, these providers’ ability to serve low income populations is directly dependent on the financial, in-kind and philosophical support received from the hospital or residency program. To strengthen and stabilize these essential providers, it is important to achieve a better understanding of their costs and contributions. Part of this requires improving financial and data systems so the providers can maximize their revenue and efficiency as well as document their impact. Another part is engaging in community dialogue regarding the role and specific commitment of various organizations in the safety-net.
3. Develop capital investment initiatives geared to strengthening safety-net infrastructure
(e.g., buildings, systems, technology). Many of the providers included in this assessment struggle to pull together the necessary resources to support small and large capital projects that are critical to expanding capacity or maximizing the potential of current operations. The Project Team through its interviews and site visits talked with many organizations that expressed their grave need for financial resources to cover the cost of capital investment in several operational expenses including a new phone system, health information technology initiatives, clinic renovations or building projects, equipment (e.g., dental operatories, lab equipment, etc.), and patient transport vehicles. Identifying resources for capital improvements and assisting safety-net organizations accessing these resources would directly help strengthen and enhance the safety-net. 4. Provide technical assistance geared to promoting improved productivity, efficiency, and
quality. One of the messages that the Project Team heard throughout its interviews and site visits was the idea that given the limited resources “we [safety-net providers]had better make sure that we are doing the best we can with the limited resources and operational capabilities that we have on hand.” Many safety-net providers simply do not have the expertise or the resources to commit to assessing their operations and developing the most productive, effective, and efficient systems that they need. Safety-net providers need assistance with improving their outreach efforts, billing and coding systems, their patient flow, and scheduling (“open-access”) systems, as well as their

Western New York Safety-Net Assessment John Snow, Inc.
86
staffing profiles including staff roles and responsibilities. Basically, any support that would allow them to reach more people, diversify their payer mix, increase productivity, improve quality, and maximize efficiency would be welcomed. Because safety-net providers are so consumed with day-to-day operations, these resources must be very easy to access and implement. 5. Support initiatives that promote quality improvement (QI) and the use of HIT. Many providers have limited HIT infrastructure and struggle to effectively monitor clinic operations and make informed, data-driven decisions about patient care and service delivery. Others have substantial HIT resources but do not necessarily use them to their full potential. Regardless, nearly across the board, safety-net providers in western New York would benefit from investing more resources in quality improvement and strengthening their HIT infrastructure. Providers would benefit from both collaborative and targeted initiatives to support these efforts. Activities could support efforts such as: raising awareness regarding the importance and power of quality improvement and HIT; identifying and empowering QI/HIT champions; developing QI infrastructure (e.g., QI committees, continuous quality improvement structures, identification of measures and benchmarks, etc.); developing/managing chronic disease-specific quality collaboratives, supporting HIT training to maximize the use of existing systems; and supporting the development of patient satisfaction or consumer advisory efforts. Since the possibilities are endless, CHFWCNY should include safety-net providers in future planning to ensure new endeavors are most helpful. 6. Support initiatives that facilitate provider recruitment and retention. The recruitment and retention of clinical staff is an essential prerequisite to stabilizing and enhancing the safety-net. Nearly across the board, safety-net providers in the region struggle to recruit physicians and fill gaps in their clinical staffing. This issue is not unique to western New York or its safety-net providers; JSI sees the same challenges and shortages in many communities. Recruitment of scarce providers is a very difficult challenge for small provider organizations to overcome on their own. This issue would benefit from a regional approach drawing on the expertise of agencies and organizations closely involved in provider training and development (e.g. the region’s health professional schools and training programs and the Area Health Education Centers (AHEC)). Some strategies, such as increased use of technology and telemedicine, might help mitigate the need for in demand and hard to recruit providers, especially specialists. In terms of retention, both compensation levels and work environment are key to provider retention. Efforts to address these two areas through technical assistance should help sustain current clinical staffing. 7. Support State policies that strengthen Medicaid/SCHIP. While this project did not include an analysis of Medicaid/SCHIP policy and its impact on the safety-net, we know that New York has many barriers that impede both enrollment and maintaining consistent eligibility, and that payments to private providers are not sufficient to sustain high levels of Medicaid insured patients in their practices. All providers, including those

Western New York Safety-Net Assessment John Snow, Inc.
87
who make up the core safety-net, are extremely vulnerable to changes in State Medicaid/SCHIP policies. Adverse changes can mean that safety-net providers are not financially able to serve the same number of low-income patients. The private sector has neither a mandate nor a financial cushion to weather changes and is often forced to severely limit patients or services. Since private providers currently serve many low-income children and their families in western New York, and in some places provide the only safety-net, their ability to continue to contribute must be protected. Link Safety-Net Providers to Improve Access and Quality 1. Raise knowledge about the safety-net among providers and consumers. There is a clear need to raise the profile, understanding, and awareness of the importance of the safety-net among the health care provider community, as well as among consumers. On the provider side, many health and social services providers are simply not aware of each other and the resources that exist in the region. One result of this is that safety-net providers struggle unnecessarily to address all the needs of their patients. Efforts to promote communication as well as increase knowledge and awareness, should encourage collaboration, facilitate referrals, and promote better service coordination. On the consumer side, there is limited awareness of the importance of primary care and preventive medicine, and where and how to access services. In other areas of the country, efforts to promote greater awareness and knowledge of the safety-net among consumers is often tied to a more general branding campaign that promotes the greater use of the safety-net and corresponding reduction of emergency room utilization. The challenge for western New York, however, is raising such awareness among consumers cannot exceed the capacity of the safety-net to respond to increased demand. Thus, expanding the safety-net must occur simultaneously with raising knowledge among consumers. 2. Improve collaboration among providers serving low-income children and their
families. Given the limited awareness in many parts of the region about safety-net resources, it is not surprising that many providers are operating in silos rather than as part of a broader system of care for low-income children and their families. One critical step in strengthening the safety-net is to ensure that the resources that exist or become available are not forced to stand alone but can be tied into a broader system of care. Community symposia, resource inventories, help/referral-lines, coordinated case management programs could all help break-down existing silos and encourage better collaboration and referral among providers. 3. Strengthen the provision of evidence-based care. The Institute of Medicine has identified the employment of evidenced-based practices as one of the main tenets or core competencies of improving outcomes as well as the quality and efficiency of care. As discussed, few providers in western New York have the resources, staff, or expertise to apply proven best practices and develop operations that are clearly rooted in the evidence.

Western New York Safety-Net Assessment John Snow, Inc.
88
Collaborative initiatives or workshops that educate providers regarding various evidence-based practices and assist providers to incorporate the practices into their operations would benefit all providers and their patients. Possible areas of focus could include behavioral health integration, chronic disease management, elder case management and referral, or more broadly the development of operations that are tailored to medical home model. 4. Develop collaborative quality improvement initiatives. Another core competency identified by the Institute of Medicine is the application of quality improvement strategies. CHFWCNY has already invested significant resources in this regard, drawing from approaches developed by the Institute of Healthcare Improvement and the Bureau of Primary Health Care (BPHC) at HRSA, in implementing a series of quality improvement, provider-driven, collaborative initiatives that facilitate continuous quality improvement activities, data monitoring and, information sharing across participants. Continuation and strengthening of quality improvement initiatives would not only result in improved health outcomes for patients but would also strengthen provider organizations in many ways - from supporting provider recruitment and retention, to realizing the full potential of technology, to improving efficiency and expanding capacity. There is a great deal of evidence, particularly from BPHC, IHI, and Community Clinics Initiative (CCI), that has shown that quality initiatives become stronger and more effective when they are implemented on a community-wide basis rather than within a single provider. 5. Support the further development of the western New York Regional Health
Information Organization (RHIO) and effective health information exchange. Many experts are concerned with the potential for a “digital divide” developing between safety-net providers and the broader healthcare marketplace with regard to HIT adoption and electronic health information exchange and the Project Team observed this beginning to occur in western New York. However, there are numerous examples and approaches across the country of safety-net providers participating in this movement. Investment in efforts that support the development of the western New York RHIO and the involvement of core safety-net providers would reduce the “digital divide” that is already becoming apparent in the region. 6. Develop regional symposia on technology and data-driven quality improvement. As has been discussed throughout this report, safety-net clinics in western New York need support in their efforts to build HIT capacity and to learn how HIT can be applied or has been applied to maximize efficiency, improve quality, improve patient outcomes, and better target clinical programming and outreach efforts. A series of symposia that foster a greater understanding of the overall potential, connect individual organizations with HIT-experienced networks, leverage existing web-based HIT resources (e.g., HRSA’s HIT Toolbox, National Resource Center for HIT), and teach providers about clear, practical, and do-able activities that can be applied to facilitate the application of HIT and data-driven quality improvement would be a very worthwhile investment for the region.

Western New York Safety-Net Assessment John Snow, Inc.
89
Reduce Dependency on Emergency Departments for Primary Care 1. Strengthen the primary care safety-net and implement programs to reduce ED
utilization. One of the most important findings in the assessment was the high degree of emergency department (ED) utilization for care that could and should be provided in a primary care setting (ambulatory care sensitive conditions). While the professional community agrees that ED utilization is not preferable to primary care from a cost or quality perspective, people continue to seek routine and acute care through EDs at record numbers. The reasons people use emergency rooms are numerous and complex and many have been discussed in this report. The challenge is to begin to reverse this utilization pattern. Around the country, many other communities are tackling this same problem. Some successful strategies to move people out of EDs have included:
• Hospital ED diversion programs, through which appropriate patients are either triaged on site to a primary care alternative at the time they enter the ED, or are referred for follow-up to a primary care provider. Many variations on these programs exist with varying degrees of intensity of the intervention.
• Aligning payment and other incentives to encourage patients to use a primary care setting instead of an ED and to encourage providers to refer patients to other settings
• Conducting community education campaigns for both providers and patients • Improving primary care access so patients don’t view the ED as their only alternative in
an acute or urgent situation. Telephone triage by clinical staff both during and after normal clinical hours and “open” access for acute appointments both can help reduce ED utilization.
2. Develop community outreach, education, awareness, and marketing campaigns. Any efforts to strengthen the safety-net have to go hand-in-hand with targeted, well-packaged community outreach, education and awareness efforts geared to reducing emergency utilization, increasing utilization and awareness of preventive services, and increasing awareness regarding the importance of a medical home and a regular source of primary care-based care. While some results of outreach and education programs can be seen rather quickly, such as when patients are both educated about and provided alternatives to emergency utilization; most results happen only over the long term. Still, providers are only part of the solution to ensuring a strong safety-net. Patients must understand when and how to use the health care system. In the long run, if patients receive appropriate services at the appropriate place, overall health care costs will be reduced and the financial requirements for supporting the safety-net mitigated. If this does not happen, no amount of resources will be sufficient to support the safety-net.

Appendix A

Western New York Safety-Net Assessment PROVIDER SITE VISIT LIST
County Site Contact
ALLEGANY Zahi Kasas, MD - Private Practice Monica Acomb, Practice Manager
CATTARAUGUS Universal Primary Care Gail Speedy, Executive Director
CHAUTAUQUA The Resource Center
Clark Poppleton/ Asst. Executive Director for Health and Diagnostic and Treatment Services
ECMC Cleve-Hill Family Health Center
Marian Hetherly, Health Center Administrator
CHC of Buffalo Rachael Charette, Chief Operating Officer
Northwest Buffalo Community Health Care Center Rod May, Executive Director
Sheehan Memorial Hospital, Family Health Care Center
Joan Hoeflich /President CEO/Family Care Center Joe Hugar/COO
Winkelstein/ Women and Children's Hospital of Buffalo - Pediatric Clinic Peter Winkelstein, MD
ERIE
University of Buffalo Dept. of Family Medicine - Residency Clinics Thomas Rosenthal, MD
Planned Parenthood of Western NY - Pediatric Clinics Val DeAngelo
NIAGARA Niagara Falls Memorial Medical Center - Hamilton B. Mizer Primary Care Clinic Frank Maietta
ORLEANS Oak Orchard CHC Barbara Linhart, RN, MSN
WYOMING Warsaw Hospital, Emergency Room Greg Collins, MD
Appendix A 1

Western New York Safety Net Assessment KEY INFORMANT INTERVIEW LIST
County Organization Contact Name Lifetime Health Medical Group - WILLIAM E. MOSHER HEALTH CENTER Jacquie Mowbray Kaleida Health Melva Visher University of Buffalo Family Practitioner Dr. Chet Fox University at Buffalo School of Public Health and Health Professions Dr. Christopher Szwagiel Blue Cross Blue Sheild of Western NY Donald R Ingalls P2 Collaborative of Western New York Shelley Hirshberg Catholic Health System Honor Martin Near East & West Side Task Force Francesca Mesiah Cleve-Hill Family Health Center/Erie County Medical Center Marian Hetherly University at Buffalo Dept. Family Med Dr. Thomas Rosenthal Women and Children's Hospital of Buffalo Dr. Peter Winkelstein Erie County Public Health Michael Kubik Associate Commissioner New York State Department of Health Western Regional Office Sheila Kee LEWAC Associates of Western New York, Inc. Catherine Lewis-Smith
ERIE
Community Health Center Of Buffalo Rachel Charette
Western New York Public Health Alliance Kristina Young Blue Cross Blue Sheild of Western NY Donald R Ingalls Planned Parenthood of Western NY Laura Meyers Niagara County Dept of Health Daniel Stapleton Niagara Falls Memorial Hospital/Hamilton B Mizer Foundation Charles Walker Catholic Ministry Judy Justinger N
IAG
AR
A
Health Association of Niagara County John Kinner
Wyoming County Community Action (community non-profit) Martin Mucher Hillside Children's Services Ann Sherman Wyoming County Youth Board Jackie Klump
WYO
MIN
G
Wyoming County Public Health Dr. Gregg Collins
Appendix A 2

County Organization Contact Name Lakes Plains Community Care Network and WNY Rural AHEC Dr. Ken Oakley
Genesee County Health Department Ginny Sellan GEN
ESE
E United Memorial Medical Center Dan Ireland
Orleans Community Action Committee (community non-profit) Ed Fancher Orleans Dept Public Health Andrew Lucyszyn Dr. Bell, Private Practice Dr. David Bell O
RLE
AN
S
Salvation Army Rod Ballengee
Allegany County Public Health Lori Ballengee ACCORD Corp Marlene Babchack Allegany County DSS Patricia Schmelzer Jones Memorial Hospital Eva Benedict Dr. M. Zahi Kassas, MD Pediatrics. Private Practice affiliated w/Jones Memorial Hospital Monica Acomb
ALL
EGA
NY
Allegany/ Western Steuben Rural Health Network, Inc. Helen Evans
Dept. Social Services
Wendy Borugeois (DSS Commissioner) Kathy McGoldrick (Division Social Services) Andy Widger (Protective Services)
Olean General Hospital Timothy Finan The Rehabilitation Center Nancy Wonderling Cattaraugus County Public Health Barb Hastings Southern Tier Healthcare System, Inc.* Donna Kahm Universal Primary Care Gail Speedy Community Health Alliance Sharon Mathe C
ATT
AR
AU
GU
S
*The Southern Tier Healthcare System Inc. has a tri-county catchment area that also represents Allegany and Chautauqua counties
Catholic Charities Patricia Williams Chautauqua Opportunities Julie Town Department of Social Services Carmen Holsta Cooperative Extention Linda Burton Coordinated Children's Services Initiative Office of Mental Health Rachel Ludwig Get Covered Help Line and Health Network Lisa Culligan and Ann Abdella Dunkirk Hospital Rick Ketcham Westfield Hospital Christine Schuyler Family Court Judge Judith Claire
CH
AU
TAU
QU
A
Health Department Pat Applebe and Denise Nickols
*The Southern Tier Healthcare System Inc. has a tri-county catchment area that also represents Allegany and Chautauqua counties.
Appendix A 3

Western New York Health Care Safety-Net Assessment
KEY INFORMANT INTERVIEW GUIDE August 2007
Site: Interviewee: Introduction
• Introduce JSI, CHFWCNY and Purpose of Safety Net Needs Assessment • Progress to-date and how this fits into overall study approach and methods • If service providers, ask about their role and range of services in the safety-net
Interview Questions • (If Service Provider) What is your role with respect to the Safety Net and what
range of services do you provide? (If NOT a Service Provider) What is your background? How long have you been in the region and to what extent have you partnered or worked with the area’s safety net?
• What is the priority health and social service needs of the area’s children in
poverty and their families? • What are the most significant service gaps for these children and their families? • What barriers do they face that hinder access to health and social services? • Can you name the major health and social service providers serving low-income,
underserved populations in the area? What are the major components of the safety net? (primary care providers/clinics, oral health, mental health, social support, family support, etc.)
• To what extent do health and social service organizations who serve children
collaborate?
• Is there an interest/willingness to strengthen communication/collaboration?
• How is the area changing demographically or socio-economically? Is the number of vulnerable children/families growing or declining? Are there special or specific populations that are particularly at-risk?
• Do you know of any local or regionally focused reports or data sources that
might be helpful to incorporate into our assessment?
Appendix A 4

Western New York Safety-Net Assessment INTERVIEWS WITH OTHER PROVIDERS CONTRIBUTING TO THE SAFETY-NET
Organization Contact Name
Cuba Hospital Dental Clinic Donna Adams
Eastman Dental Services Holly Berone
Lakeside Hospital ER Angela Jones Brett Oak Orchard Van Dental Clinic Denise Beardsley Mental Health Association in Niagara County Cheryl Blacklock Olean Medical Group John Camus Mental Health Association in Cattaraugus County Pat Conroy Horizon Health Services Anne Constantino
Erie County Department of Mental Health Philip R. Endress
Orleans Dept. of Mental Health James Graziano Dr. Sanjay Gupta
Dental Mobil Van out of Oak Orchard Brenda Klingebiel Wyoming County Pediatric Clinic Cis Lyons Family & Children's Services of Niagara, Inc. Clarice McClure Catholic Charities Margaret Meyers
Cattaraugus County Community Services Department Cattaraugus County Counseling Center Dawn Miller
Lifetime Health Medical Group Jacqueline Mowbray Department of Health, Oral Health program Mary Beth Pascal
Erie County Medical Center Thomas Quatroche
Genesee County Mental Health Services Bob Riccobono Monsignor Carr Institute, Inc. Monsignor Carr Institute Children's Clinic - Niagara Falls Lisa Terian
Genesee UMMC ER Preferred name confidential *JSI has made their best efforts to note the spelling of names, however since many interviews were done by phone we recognize there may be errors in spelling. Please contact JSI if you notice an error and changes will be made prior to the report being posted online.
Appendix A 5

Appendix B

Western New York Health Care Safety-Net Assessment Provider Site Visit Protocol
Interview Guide and Data Request Organizational Information Organization Name: _____________________________ Address: ______________________________________ ______________________________________ ______________________________________ Contact Name: ______________________________ Title: ______________________________ Telephone: ______________________________ E-mail: ______________________________ 1) What type of primary care organization are you?
a. Federally Qualified Health Center (FQHC) ____ b. FQHC Look-Alike ____ c. Private Practice ____ d. Hospital- owned Practice ____ e. Other (specify) _______________ 2) What type of governance does your organization have? (Check all that apply)
a. Public ____ b. Private ____ c. Non-profit____ d. For-profit_____ e. Other_____ 3) How long has the organization been in operation? Please provide a brief history of the organization or a web page reference or attach written material summarizing the organization’s history. 4) Would you consider your organization part of the health care safety net for low income children and their families? If so, how would you define your role in the area’s health care safety? Has this role changed overtime? 5) What services do you provide on-site? (Generally speaking, data request will get at this in more detail) 6) (Depending on response to question 5) Where do your patients access other primary care and specialty services (Prompt as appropriate) (e.g. dental, mental health, family planning, OB/Gyn, medical specialty care, family support/case management, etc.)
Interview Guide
Appendix B 1

7) Are there gaps in the service area’s continuum of care? (Prompt, if necessary by listing major service area categories (e.g., MH, SA, Oral Health, Med. Specialty services, etc.) 8) Do you partner/collaborate with other community organizations? If so, who do you partner with? 9) Who is your target population? (Generally, we will be requesting more exact information through out data request) 10) What are the most significant barriers to access for your target population? (e.g., cost, transportation, language, cultural issues, etc.) 11) What are your particular strengths as an organization? Are there aspects of your management or clinical operations that you think are exemplary (best practices) and could/should be replicated by other providers? 12) What do you see as your most significant operational challenges? 13) Have you done any assessment of patient satisfaction in the last year? What particular strengths and issues came from the assessment? 14) Are you currently reporting any clinical quality data externally? (if yes, to whom?) Are there any formal quality improvement processes in place in your clinic? If yes, can you describe them briefly? 15) What resources (e.g., funding, staffing, technical assistance, etc.) would assist you in addressing these challenges? Information Systems 16) Does the organization have a practice management system? If so, how old is it and what is the name/vendor of the system? 17) Does the organization have an electronic medical record (EMR) system that captures clinical information at the patient and visit level? Who makes the system?
If yes, is the system:
a) Directly connected to practice management system b) Interfaced with the practice management system If none of the above, does the organization do duplicate entry?
18) Does the organization maintain a chronic disease registry? If so, describe. What does it do? What is the functionality? Is it off the shelf?
Appendix B 2
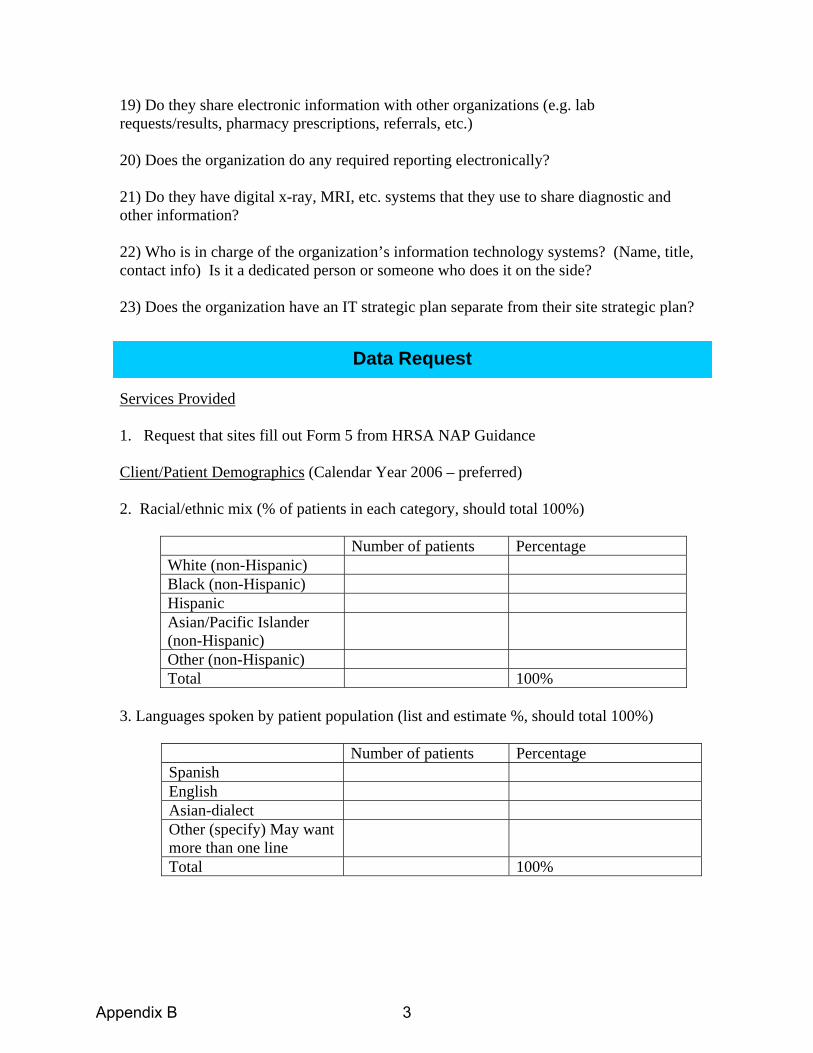
19) Do they share electronic information with other organizations (e.g. lab requests/results, pharmacy prescriptions, referrals, etc.) 20) Does the organization do any required reporting electronically?
21) Do they have digital x-ray, MRI, etc. systems that they use to share diagnostic and other information? 22) Who is in charge of the organization’s information technology systems? (Name, title, contact info) Is it a dedicated person or someone who does it on the side? 23) Does the organization have an IT strategic plan separate from their site strategic plan? Services Provided 1. Request that sites fill out Form 5 from HRSA NAP Guidance
Client/Patient Demographics (Calendar Year 2006 – preferred)
2. Racial/ethnic mix (% of patients in each category, should total 100%)
Number of patients Percentage White (non-Hispanic) Black (non-Hispanic) Hispanic Asian/Pacific Islander (non-Hispanic)
Other (non-Hispanic) Total 100%
3. Languages spoken by patient population (list and estimate %, should total 100%)
Number of patients Percentage Spanish English Asian-dialect Other (specify) May want more than one line
Total 100%
Data Request
Appendix B 3
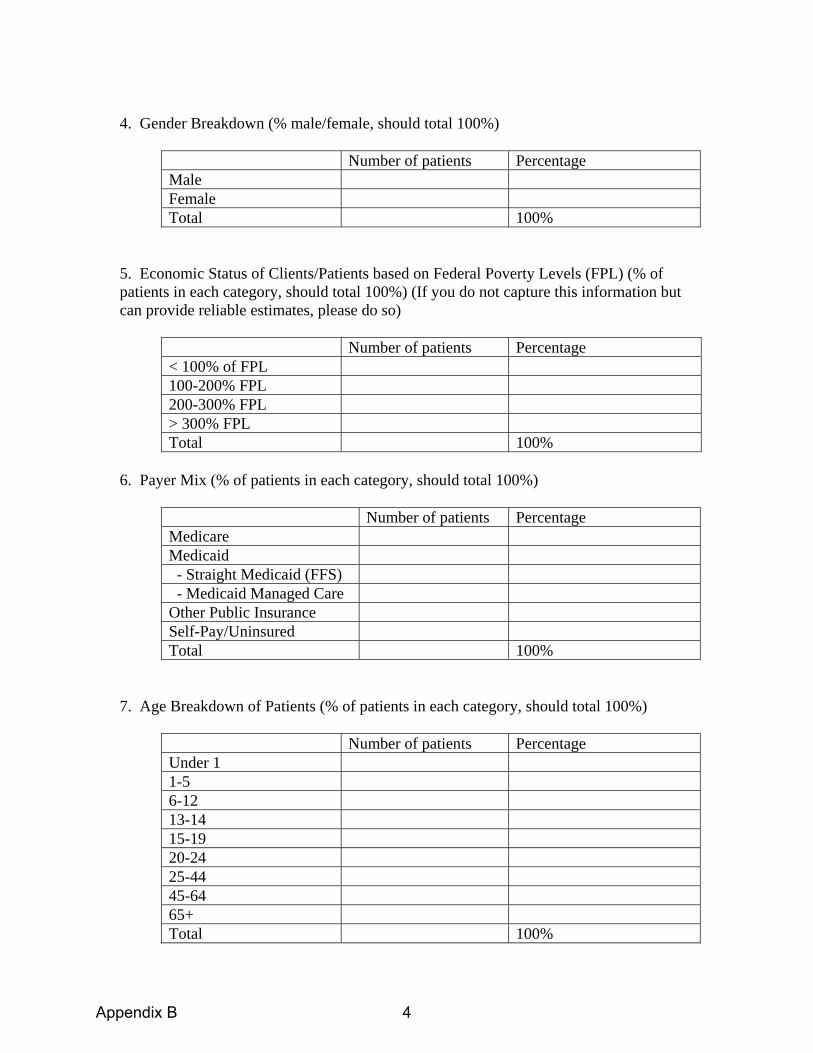
4. Gender Breakdown (% male/female, should total 100%)
Number of patients Percentage Male Female Total 100%
5. Economic Status of Clients/Patients based on Federal Poverty Levels (FPL) (% of patients in each category, should total 100%) (If you do not capture this information but can provide reliable estimates, please do so)
Number of patients Percentage < 100% of FPL 100-200% FPL 200-300% FPL > 300% FPL Total 100%
6. Payer Mix (% of patients in each category, should total 100%)
Number of patients Percentage Medicare Medicaid - Straight Medicaid (FFS) - Medicaid Managed Care Other Public Insurance Self-Pay/Uninsured Total 100%
7. Age Breakdown of Patients (% of patients in each category, should total 100%)
Number of patients Percentage Under 1 1-5 6-12 13-14 15-19 20-24 25-44 45-64 65+ Total 100%
Appendix B 4

8. Facility location(s):
Address (street, city, zip code) or “mobile”
Hours of Operation
Target Geographic Area (zip codes, census tracks, neighborhoods)
9. Do you offer a sliding fee scale? Yes_____ No______
9a. If yes, what is the upper income level for eligibility for the sliding scale and what is the minimum payment requested? (Please provide documentation explaining the sliding fee scale, if possible?)
Existing and Future Capacity 10. Number of people served and visits for last full year.
Number of people served last full year (2006) _______ Number of visits provided last full year (2006) _______
11. Current number of full-time equivalent (FTE) health care providers
Physicians _______ Nurse Practitioners/Physician Assistants _______ Nurses _______ Dentists _______ Dental Hygienists _______ Mental Health Counselors Other (specify) _________________________
________________________________ ________________________________ ________________________________
Appendix B 5
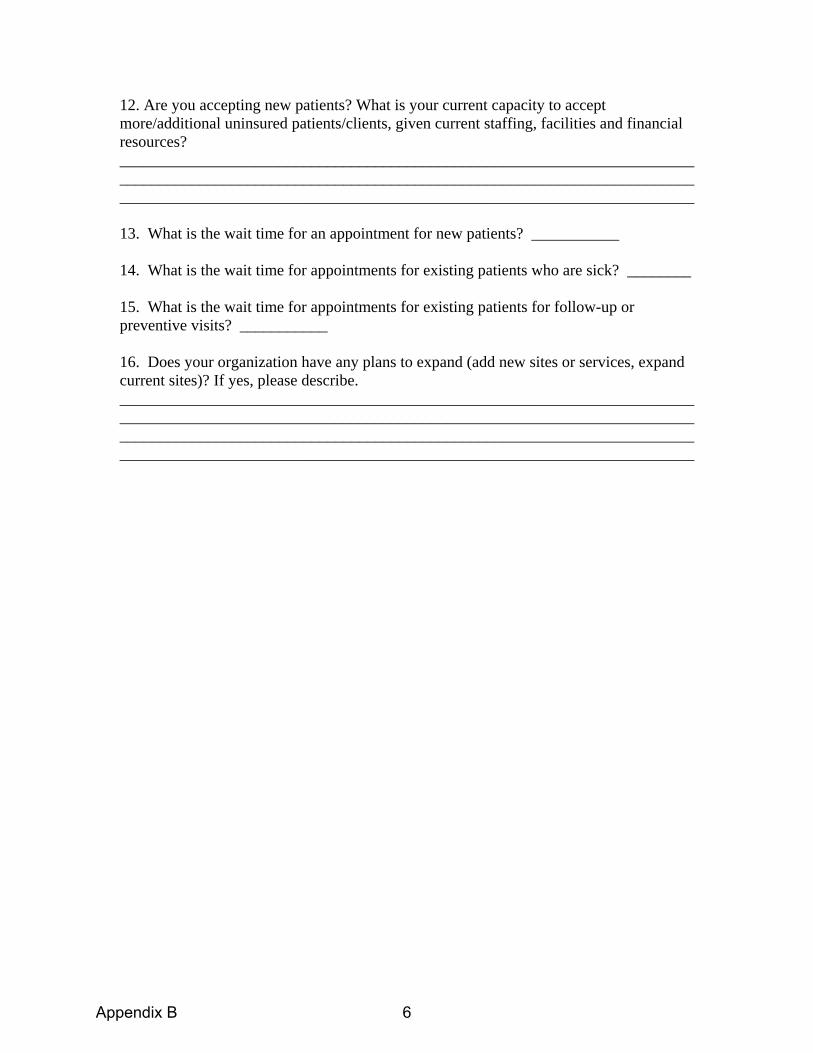
12. Are you accepting new patients? What is your current capacity to accept more/additional uninsured patients/clients, given current staffing, facilities and financial resources? ________________________________________________________________________________________________________________________________________________________________________________________________________________________ 13. What is the wait time for an appointment for new patients? ___________ 14. What is the wait time for appointments for existing patients who are sick? ________ 15. What is the wait time for appointments for existing patients for follow-up or preventive visits? ___________ 16. Does your organization have any plans to expand (add new sites or services, expand current sites)? If yes, please describe. ________________________________________________________________________________________________________________________________________________________________________________________________________________________________________________________________________________________________
Appendix B 6

Appendix C

Emergency Department Utilization Data About the algorithm used to classify Emergency Department Visits: The development of the algorithm required analysis of the full medical record. Since such detailed information is not generally available on computerized ED or claims records, these classifications were then "mapped" to the discharge diagnosis of each case in our sample to determine for each diagnosis the percentage of sample cases that fell into these four categories. The algorithm separately tabulates cases involving a primary diagnosis of injury, mental health problems, alcohol, or substance abuse and these are removed from the current analysis. ED Classification Process1
ED Visit Classification by Payer for Children Less than 18 Years Old – Western NY Compared to NY State
ED Visit Classification
Children > 18 years Western NY†
(n=51,141) NY State
(n=737,360)
Overall Non-emergent 36.4% 37.1%
Emergent/Primary Care Treatable 38.7% 39.4% Emergent ED Care Needed - Preventable/Avoidable 13.2% 13.2%
Emergent ED Care Needed - Not Preventable/Avoidable 11.7% 10.3%
1 http://wagner.nyu.edu/chpsr//
Appendix C 1

Insurance Status Self-Pay
Non-emergent 38.7% 37.6% Emergent/Primary Care Treatable 40.0% 39.2%
Emergent ED Care Needed - Preventable/Avoidable 11.3% 13.7% Emergent ED Care Needed - Not Preventable/Avoidable 10.1% 9.6%
Public Non-emergent 36.6% 37.3%
Emergent/Primary Care Treatable 40.8% 39.9% Emergent ED Care Needed - Preventable/Avoidable 12.4% 12.6%
Emergent ED Care Needed - Not Preventable/Avoidable 10.2% 10.2% Private
Non-emergent 36.1% 37.0% Emergent/Primary Care Treatable 38.1% 39.2%
Emergent ED Care Needed - Preventable/Avoidable 13.6% 13.4% Emergent ED Care Needed - Not Preventable/Avoidable 12.2% 10.5%
Other Non-emergent 40.9% 39.1%
Emergent/Primary Care Treatable 40.8% 40.1% Emergent ED Care Needed - Preventable/Avoidable 9.7% 10.4%
Emergent ED Care Needed - Not Preventable/Avoidable 8.6% 10.5% † Counties included in the Western New York analyses included: Allegany, Cattaraugus, Chautaugqua, Erie, Genesee, Niagara, Orleans, and Wyoming.
ED Visit Classification by County
ED Visit Classification
Children > 18 years Number of Encounters (n=51,141)
Non-Emergent/ Emergent Primary Care Treatable or
Avoidable
Emergent ED Care Needed Not
Preventable/Avoidable
ED County Location Allegany 1,594 89.7% 10.2% Cattaraugus 2,055 88.0% 12.0% Chautauqua 6,501 90.4% 9.6% Erie 30,864 87.7% 12.3% Genesee 1,966 88.7% 11.3% Niagara 6,017 88.2% 11.8% Orleans 1,105 89.3% 10.6% Wyoming 1,039 90.6% 9.3%
Appendix C 2

Appendix D

County Summary Table
Allegany FACTS: 200% poverty:
39.7% 400% poverty: 83.9%
MUA/MUP: 2 areas designated MUA
HPSA: Primary Care: Entire county Mental Health: Entire county Dental: Low Income Population
% of insured adults: 87.6 (Confidence Interval 3.2%)
ED Visits Non-Emergent/ Emergent Primary Care Treatable or Avoidable: 89.7%
PROVIDERS: Core-Safety Net
Providers Primary Care
Core-Safety-Net Providers (Dental, Behavioral Health)
Essential Safety-Net Providers Primary Care
Essential Safety-Net Providers (Dental, Behavioral Health
Comments
Zahi Kassas, MD (Private Provider)
Dental: Cuba Memorial Hospital Dental Practice
Clifton Miller, MD (FP affiliated with Jones Memorial)
Behavioral: Erie County Medical Center
Christopher Depner, MD (FP affiliated with Jones Memorial)
Behavioral: Post Doc Fellows at Alfred State College and Alfred University
Cattaraugus FACTS: 200% poverty:
36.2% 400% poverty: 82.6%
MUA/MUP: 2 areas designated MUA
HPSA: Primary Care: Parts of county Mental Health: Entire county Dental: Low Income Population
% of insured adults: 83.9 (Confidence Interval 3.7%)
ED Visits Non-Emergent/ Emergent Primary Care Treatable or Avoidable: 88.0%
PROVIDERS: Core-Safety Net
Providers Primary Care
Core-Safety-Net Providers (Dental, Behavioral Health)
Essential Safety-Net Providers Primary Care
Essential Safety-Net Providers (Dental, Behavioral Health
Comments
Universal Primary Care (Primary care only)
Behavioral: Cattaraugus County Community Services(3
Olean Medical Group (Pediatric and Family Physician Practice)
Behavioral: Olean General Hospital, Department of Psychiatry
Various private physicians play an additional role in primary care
Appendix D 1

clinics and 2 school bases satellites)
Salamanca Health Center(serves the Seneca Nation)
Dental: Tri-County Dental Clinic (2 locations -Gowanda and Salamanca)
Dr. Patel (Family Physician Practice)
Behavioral: TLC Health Network (3 locations, Adult only)
Dental: Olean General Hospital Gundlah Dental Center
Dr. Thandla (Family Physician Practice)
OGH Salamanca Clinic
TLC Health Network: Gowanda Medical Center and Conewango Valley Medical Center
Chautauqua FACTS: 200% poverty:
35.9% 400% poverty: 81.8%
MUA/MUP: 2 areas designated MUA
HPSA: Primary Care: Parts of county Mental Health: Entire county Dental: Low Income Population
% of insured adults: 83.9 (Confidence Interval 3.7%)
ED Visits Non-Emergent/ Emergent Primary Care Treatable or Avoidable: 90.4%
PROVIDERS: Core-Safety Net
Providers Primary Care
Core-Safety-Net Providers (Dental, Behavioral Health)
Essential Safety-Net Providers Primary Care
Essential Safety-Net Providers (Dental, Behavioral Health
Comments
Robert Berke, MD (Family Practice)
Dental: Dr. Menoff (Extractions only)
WCA Family Health Centers, (Family Practice,)
Dental: University Pediatric Dentistry (UB, Department of Pediatric and Community Dentistry)
Jamestown Pediatrics, (Jamestown)
Behavioral: Catholic Charities (Comprehensive services children and adults)
Southern Tier Pediatrics
Behavioral: The Resource Center, Jamestown(Adult
Appendix D 2

and Children Developmentally Disabled focused services)
Ganesh, Despande, MD
Rajiv Parikh, MD, Westfield Family
Physicians
TLC Health Network: Tri-County Medical Center
Erie FACTS: 200% poverty:
35.9% 400% poverty: 73.7%
MUA/MUP: 6 areas designated MUA
HPSA: Primary Care: Parts of county Mental Health: Parts of county Dental: Parts of county
% of insured adults: 93.9 (Confidence Interval 2.2%)
ED Visits Non-Emergent/ Emergent Primary Care Treatable or Avoidable: 87.7%
PROVIDERS: Core-Safety Net
Providers Primary Care
Core-Safety-Net Providers (Dental, Behavioral Health)
Essential Safety-Net Providers Primary Care
Essential Safety-Net Providers (Dental, Behavioral Health
Comments
Community Health Center of Buffalo
Dental: Erie County Health Department Clinics: Dental Clinic (Jesse Nash Health Center)
Pediatric Residency Clinics: Hodge Pediatrics Judge Joseph S. Mattina Community Health Center Westside Pediatrics
Dental: Lifetime Health
Various private providers are other contributors
Northwest Buffalo Community Health Center
Behavioral: Erie County Medical Center Department of Psychiatry/Behavioral Health Services
Family Practice: Niagara Family Health Center in Buffalo
Dental: Department of Pediatric and Community Dentistry- 3 clinics (Mercy Hospital, Women’s and Children’s Hospital, University at Buffalo South Campus)
Erie County Health Department Clinics :
Family Practice: Sheridan Family Medicine
Dental: Buffalo General Hospital Outpatient Clinic (mostly Oral
Appendix D 3

Matt Gajewski Human Services Center (primary care: pediatric and adult, women’s health) Jesse E. Nash Health Center (women’s health)
Surgery)
Erie County Medical Center: Cleve Hill
Family Practice: Louis Lazar Family Medicine Center
Behavioral: Jewish Family Service of Buffalo and Erie County
Family Practice: Jefferson Family Medicine Center
Behavioral: Child and Adolescent Treatment Services (CATS) (child)
Horizon Health Services
Behavioral: Spectrum-5 clinics (child and adult)
People Inc.- Elmwood Health Center
Behavioral: Child and Family Services (child and adult)
LEWAC, Inc. Behavioral: Horizon (child and adult)
Sheehan Memorial Hospital (2 primary care sites, Wellness program)
Behavioral: Mid-Erie Counseling Services (child and adult)
Lifetime Health/William E Mosher Health Center
Behavioral: People, Inc. (child and adult)
Catholic Health System (14 primary care sites and 2 school based health centers)
Behavioral: Lifetime Health (child and adult)
Harvest House- Free Clinic
Behavioral: Buffalo General Hospital/ Kaleida Health (adult)
Jericho Road Clinic
Behavioral: Northwest Community Mental Health Services (adult)
Kaleida School Based Health Centers (13-sites, Behavioral and primary care)
Behavioral: Lakeshore Behavioral Health (adult)
Appendix D 4
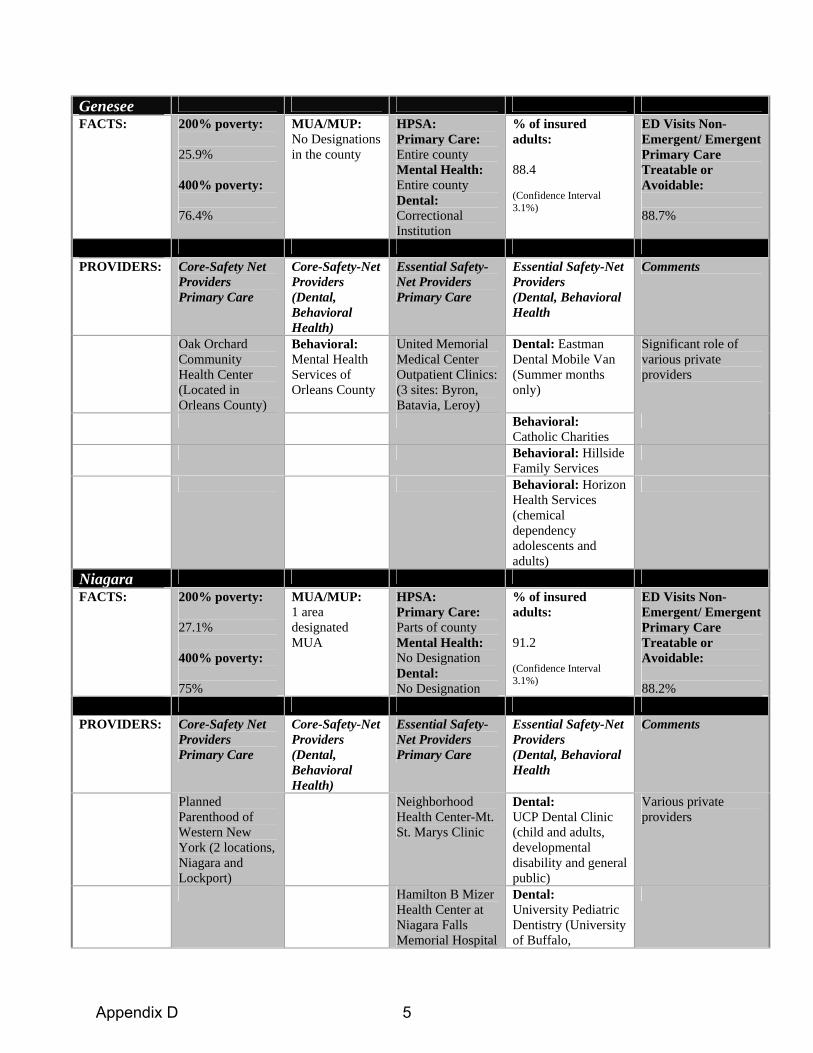
Genesee FACTS: 200% poverty:
25.9% 400% poverty: 76.4%
MUA/MUP: No Designations in the county
HPSA: Primary Care: Entire county Mental Health: Entire county Dental: Correctional Institution
% of insured adults: 88.4 (Confidence Interval 3.1%)
ED Visits Non-Emergent/ Emergent Primary Care Treatable or Avoidable: 88.7%
PROVIDERS: Core-Safety Net
Providers Primary Care
Core-Safety-Net Providers (Dental, Behavioral Health)
Essential Safety-Net Providers Primary Care
Essential Safety-Net Providers (Dental, Behavioral Health
Comments
Oak Orchard Community Health Center (Located in Orleans County)
Behavioral: Mental Health Services of Orleans County
United Memorial Medical Center Outpatient Clinics: (3 sites: Byron, Batavia, Leroy)
Dental: Eastman Dental Mobile Van (Summer months only)
Significant role of various private providers
Behavioral: Catholic Charities
Behavioral: Hillside Family Services
Behavioral: Horizon Health Services (chemical dependency adolescents and adults)
Niagara FACTS: 200% poverty:
27.1% 400% poverty: 75%
MUA/MUP: 1 area designated MUA
HPSA: Primary Care: Parts of county Mental Health: No Designation Dental: No Designation
% of insured adults: 91.2 (Confidence Interval 3.1%)
ED Visits Non-Emergent/ Emergent Primary Care Treatable or Avoidable: 88.2%
PROVIDERS: Core-Safety Net
Providers Primary Care
Core-Safety-Net Providers (Dental, Behavioral Health)
Essential Safety-Net Providers Primary Care
Essential Safety-Net Providers (Dental, Behavioral Health
Comments
Planned Parenthood of Western New York (2 locations, Niagara and Lockport)
Neighborhood Health Center-Mt. St. Marys Clinic
Dental: UCP Dental Clinic (child and adults, developmental disability and general public)
Various private providers
Hamilton B Mizer Health Center at Niagara Falls Memorial Hospital
Dental: University Pediatric Dentistry (University of Buffalo,
Appendix D 5

Department of Pediatric and Community Dentistry)
Behavioral: Monsignor Carr-Catholic Charities (child)
Behavioral: United Cerebral Palsy of Niagara (children, mostly developmentally delayed)
Behavioral: Horizon Health Services (2 locations Niagara and Brockport- Adult only)
Rainbow Pediatrics Summit Pediatrics
Orleans FACTS: 200% poverty:
30.8% 400% poverty: 78.6%
MUA/MUP: 1 area designated MUA
HPSA Primary Care: Entire County Mental Health: Entire County Dental: No Designation
% of insured adults: 88.4 (Confidence Interval 3.1%)
ED visits Non-Emergent/ Emergent Primary Care Treatable or Avoidable: 89.3%
PROVIDERS: Core-Safety Net
Providers Primary Care
Core-Safety-Net Providers (Dental, Behavioral Health)
Essential Safety-Net Providers Primary Care
Essential Safety-Net Providers (Dental, Behavioral Health
Comments
Oak Orchard Community Health Center (2 sites- Albion, Brockport)
Dental and Behavioral: Oak Orchard Community Health Center (2 sites- Albion, Brockport)
Behavioral: Catholic Charities
Various private providers
Behavioral: Mental Health Services of Orleans County
Behavioral: Hillside Family Services
Appendix D 6
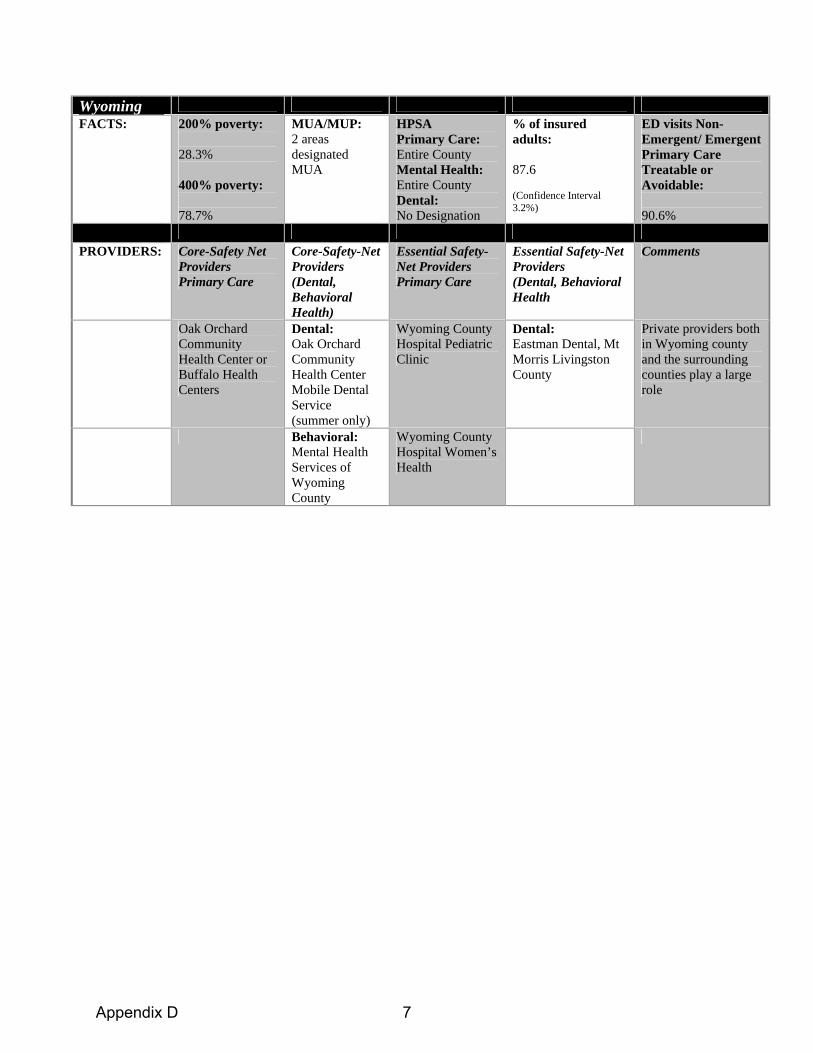
Wyoming FACTS: 200% poverty:
28.3% 400% poverty: 78.7%
MUA/MUP: 2 areas designated MUA
HPSA Primary Care: Entire County Mental Health: Entire County Dental: No Designation
% of insured adults: 87.6 (Confidence Interval 3.2%)
ED visits Non-Emergent/ Emergent Primary Care Treatable or Avoidable: 90.6%
PROVIDERS: Core-Safety Net
Providers Primary Care
Core-Safety-Net Providers (Dental, Behavioral Health)
Essential Safety-Net Providers Primary Care
Essential Safety-Net Providers (Dental, Behavioral Health
Comments
Oak Orchard Community Health Center or Buffalo Health Centers
Dental: Oak Orchard Community Health Center Mobile Dental Service (summer only)
Wyoming County Hospital Pediatric Clinic
Dental: Eastman Dental, Mt Morris Livingston County
Private providers both in Wyoming county and the surrounding counties play a large role
Behavioral: Mental Health Services of Wyoming County
Wyoming County Hospital Women’s Health
Appendix D 7

Appendix E
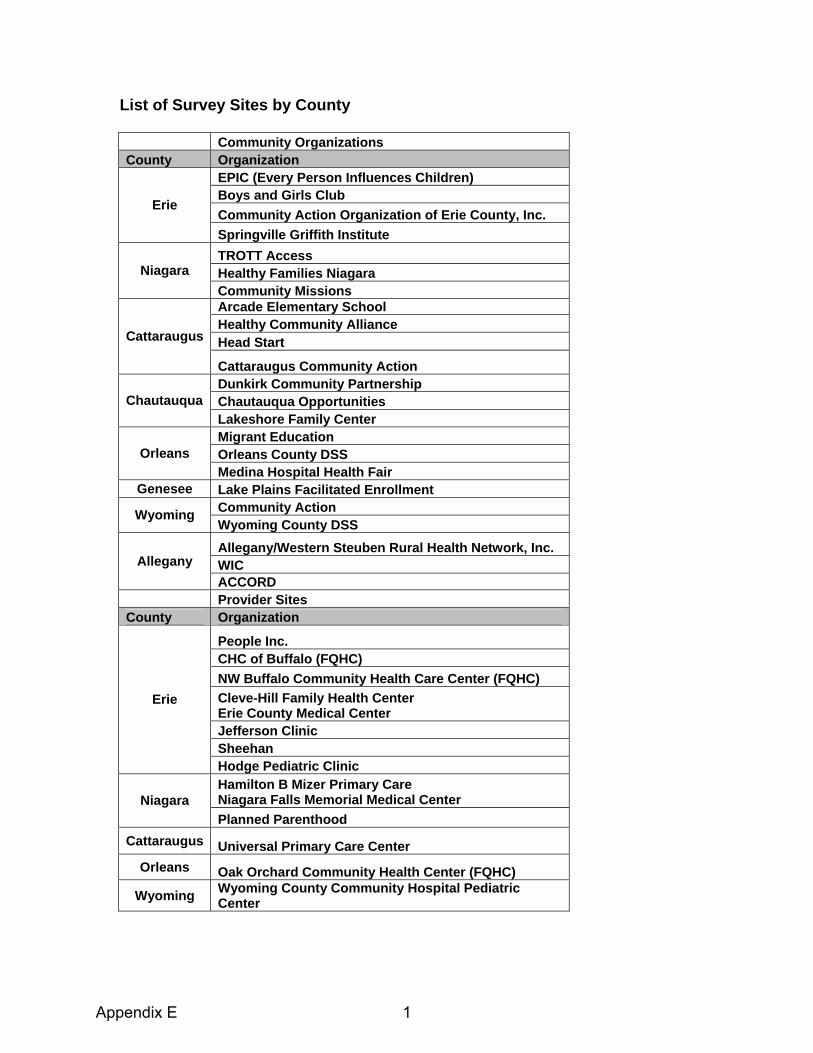
List of Survey Sites by County Community Organizations County Organization
EPIC (Every Person Influences Children) Boys and Girls Club Community Action Organization of Erie County, Inc.
Erie
Springville Griffith Institute TROTT Access Healthy Families Niagara Niagara Community Missions Arcade Elementary School Healthy Community Alliance Head Start Cattaraugus
Cattaraugus Community Action Dunkirk Community Partnership Chautauqua Opportunities Chautauqua Lakeshore Family Center Migrant Education Orleans County DSS Orleans Medina Hospital Health Fair
Genesee Lake Plains Facilitated Enrollment Community Action Wyoming Wyoming County DSS Allegany/Western Steuben Rural Health Network, Inc. WIC Allegany ACCORD
Provider Sites County Organization
People Inc. CHC of Buffalo (FQHC) NW Buffalo Community Health Care Center (FQHC) Cleve-Hill Family Health Center Erie County Medical Center Jefferson Clinic Sheehan
Erie
Hodge Pediatric Clinic Hamilton B Mizer Primary Care Niagara Falls Memorial Medical Center Niagara Planned Parenthood
Cattaraugus Universal Primary Care Center Orleans Oak Orchard Community Health Center (FQHC)
Wyoming Wyoming County Community Hospital Pediatric Center
Appendix E 1
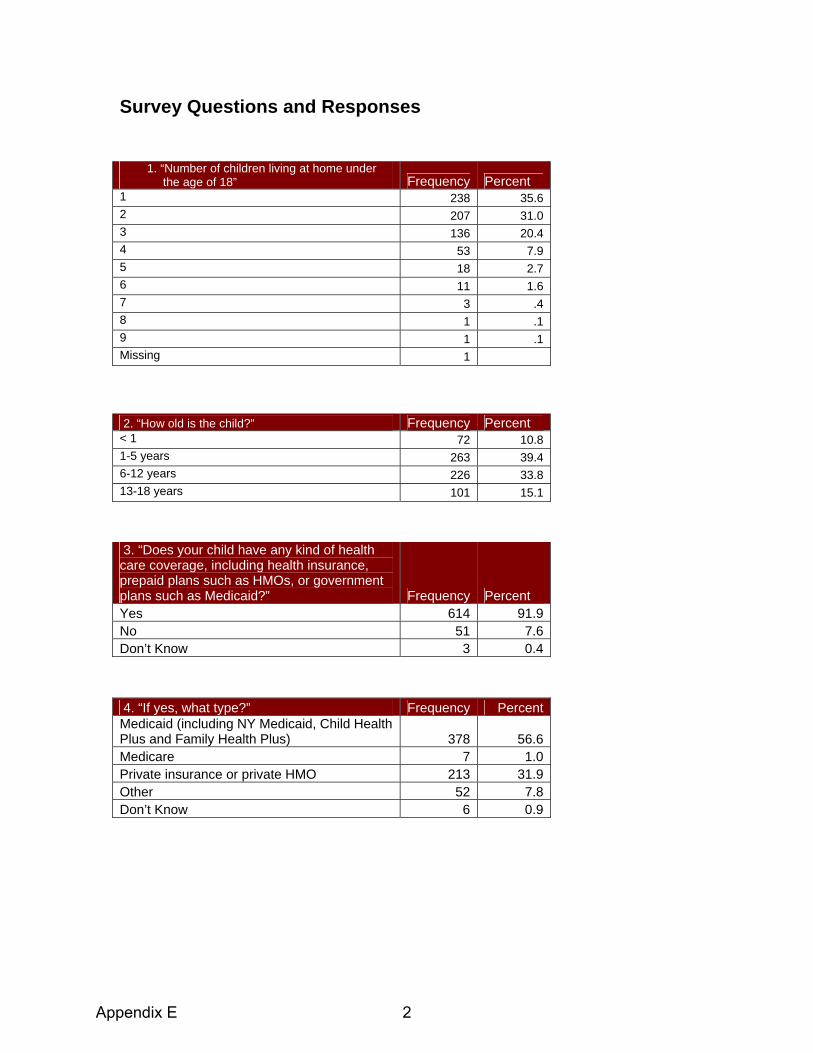
Survey Questions and Responses
2. “How old is the child?” Frequency Percent < 1 72 10.8 1-5 years 263 39.4 6-12 years 226 33.8 13-18 years 101 15.1
1. “Number of children living at home under the age of 18” Frequency Percent 1 238 35.6 2 207 31.0 3 136 20.4 4 53 7.9 5 18 2.7 6 11 1.6 7 3 .4 8 1 .1 9 1 .1 Missing 1
3. “Does your child have any kind of health care coverage, including health insurance, prepaid plans such as HMOs, or government plans such as Medicaid?” Frequency Percent Yes 614 91.9No 51 7.6Don’t Know 3 0.4
4. “If yes, what type?” Frequency PercentMedicaid (including NY Medicaid, Child Health Plus and Family Health Plus) 378 56.6Medicare 7 1.0Private insurance or private HMO 213 31.9Other 52 7.8Don’t Know 6 0.9
Appendix E 2

5. “During the past 12 months, was there any time when your child was not covered by any health insurance?” Frequency Percent Yes 116 17.4No 517 77.4Don’t Know 8 1.2Missing 27 4.0
6. “Does your child have insurance that helps pay for any routine dental care including cleanings, x-rays and examinations?” Frequency Percent Yes 512 76.6No 111 16.6Don’t Know 44 6.6Missing 1 0.1
7. “Where do you usually take your child when he/she is sick or needs health care?” (Select only one) Frequency Percent Doctor’s office or private clinic 511 76.5Community health center or other public clinic 113 16.9Hospital outpatient department 10 1.5Hospital emergency room 26 3.9Some other place 1 0.1Don’t know 5 0.7Don’t have a place I usually go 2 0.3
Appendix E 3

8. “During the past 12 months, did your child visit a health care provider (such as a general doctor, pediatrician, specialist doctor, nurse practitioner, or physician assistant) for preventive care? Preventive care visits include things like a well-child check-up, a routine physical exam, immunizations, or health screening tests.” Frequency Percent Yes 609 91.2No 51 7.6Don’t Know 7 1.0Missing 1 .1
9. “The last time your child had a preventive care visit, how quickly could you get an appointment to see a health care provider?” (select only one) Frequency Percent On the same day 132 19.8The next day 98 14.7In 2 to 3 days 123 18.4In 4 to 5 days 72 10.8In 6 to 7 days 57 8.5After more than one week 81 12.1After more than one month 40 6Don’t know 19 2.8Missing 46 6.9
Appendix E 4

10. “The last time your child was sick or needed medical attention in the past 12 months, how quickly could you get an appointment to see a health care provider?” (select only one) Frequency Percent On the Same Day 363 54.4The Next Day 159 23.8In 2 to 3 Days 60 8.9In 4 to 5 Days 19 2.8In 6 to 7 Days 9 1.3After More than one week 6 <1Not Sick no needed attention 25 3.7Went to an ER 17 2.5Missing 9 1.3
11. “During the past 12 months, how many times did your child go to a hospital emergency room about his/her health?”
Frequency Percent
0 399 59.71 147 22.02 66 9.93 34 5.14 9 1.35 7 1.06 4 0.68 1 0.160 1 0.1Missing 1 0.1
12. “If you went to a hospital emergency room it was because:” (select only one)“
Frequency Percent
Provider office not open 118 39.6No immediate appointment available with provider 13 4.4
Child does not have a regular provider 5 1.7
Child had a medical emergency 157 52.7Missing 5 1.7Total 298 100.0
Appendix E 5
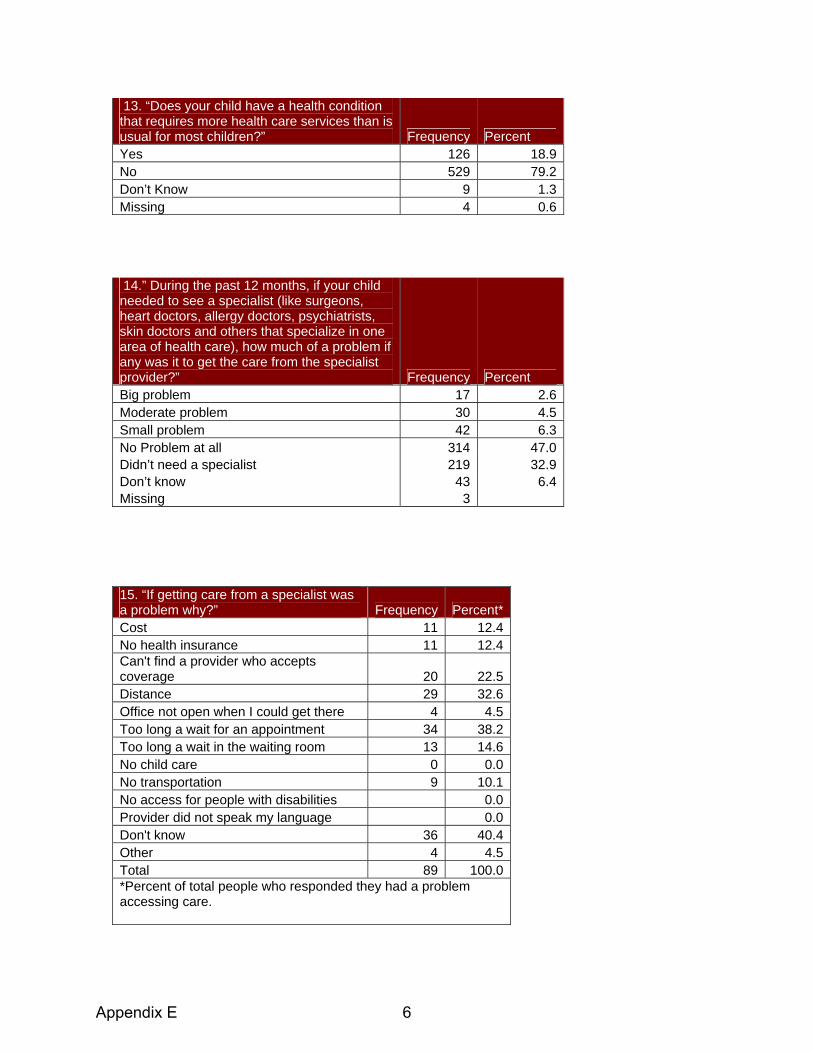
13. “Does your child have a health condition that requires more health care services than is usual for most children?” Frequency Percent Yes 126 18.9No 529 79.2Don’t Know 9 1.3Missing 4 0.6
14.” During the past 12 months, if your child needed to see a specialist (like surgeons, heart doctors, allergy doctors, psychiatrists, skin doctors and others that specialize in one area of health care), how much of a problem if any was it to get the care from the specialist provider?” Frequency Percent Big problem 17 2.6Moderate problem 30 4.5Small problem 42 6.3No Problem at all 314 47.0Didn’t need a specialist 219 32.9Don’t know 43 6.4Missing 3
15. “If getting care from a specialist was a problem why?” Frequency Percent*Cost 11 12.4No health insurance 11 12.4Can't find a provider who accepts coverage 20 22.5Distance 29 32.6Office not open when I could get there 4 4.5Too long a wait for an appointment 34 38.2Too long a wait in the waiting room 13 14.6No child care 0 0.0No transportation 9 10.1No access for people with disabilities 0.0Provider did not speak my language 0.0Don't know 36 40.4Other 4 4.5Total 89 100.0*Percent of total people who responded they had a problem accessing care.
Appendix E 6

16. “During the past 12 months did your child receive all the medical care he/she needed?” Frequency Percent Yes 614 91.9No 40 6.0Don’t Know 8 1.2Missing 6
17. Why did your child not get all the medical care he/she needed?” Frequency Percent Cost 9 22.5No health insurance 16 40.0Can't find a provider who accepts coverage 7 17.5Distance 7 17.5Office not open when I could get there 4 10.0Too long a wait for an appointment 5 12.5Too long a wait in the waiting room 0 0.0No child care 0 0.0No transportation 4 10.0No access for people with disabilities 0 0.0Provider did not speak my language 0 0.0Don't know 14 35.0Other 7 17.5Total 40 100*Percent of total people who responded they had a problem accessing care.
18. “During the past 12 months did your child see a dentist for any routine preventive dental care including check-ups, screenings and sealants? Include all types of dentists, such as orthodontists, oral surgeons, and other dental specialists.” Frequency Percent Yes 404 60.5No 255 38.2Don’t Know 8 1.2Missing 1
Appendix E 7

19. “During the past 12 months did your child receive all routine preventive dental care he/she needed?” Frequency Percent Yes 492 73.7No 159 23.8Don’t Know 14 2.1Missing 3
20. “Why did your child not get all the dental care he/she needed?” Frequency Percent*Cost 26 16.4No health insurance 30 18.9Can't find a provider who accepts coverage 23 14.5Distance 15 9.4Office not open when I could get there 8 5.0Too long a wait for an appointment 14 8.8Too long a wait in the waiting room 0 0.0No child care 0 0.0No transportation 10 6.3No access for people with disabilities 0 0.0Provider did not speak my language 0 0.0Don't know 32 20.1Other 48 30.2Total 159 100*Percent of total people who responded they had a problem accessing care.
21. “During the past 12 months, did your child receive any mental health care or counseling?” Frequency Percent Yes 78 11.7No 564 84.4Don’t Know 7 1.0Missing 19
Appendix E 8

22. “During the past 12 months did your child receive all the mental health care and counseling he or she needed?” Frequency Percent Yes 547 81.9No 78 11.7Don’t Know 19 2.8Missing 24
23. “Why did your child not get all the mental health care and counseling he/she needed?” Frequency Percent Cost 3 3.8No health insurance 7 9.0Can't find a provider who accepts coverage 5 6.4Distance 2 2.6Office not open when I could get there 1 1.3Too long a wait for an appointment 5 6.4Too long a wait in the waiting room 0 0.0No child care 0 0.0No transportation 2 2.6No access for people with disabilities 0 0.0Provider did not speak my language 0 0.0Don't know 13 16.7Other 17 21.8Total 78 100
24. “How do you usually get to your child’s provider’s office or clinic?” (Select only one) Frequency Percent Bus 46 6.9Drive myself 504 75.4Have a friend or relative drive 79 11.8Walk 23 3.4Taxi 7 1.0Other 6 .9Missing 3 .4
Appendix E 9

25. “About how long does it take to get to your child’s provider’s office or clinic?” (Select only one) Frequency Percent Less than 15 minutes 355 53.116-30 minutes 214 32.031-60 minutes 85 12.7More than 60 minutes 12 1.8Missing 2 .3
26. “During the past 12 months when you have called your child’s health care provider for help or advice over the phone, how often were you able to get the advice you needed?”
Western New York Children's Health Survey
(%)
National Children's Health
Survey(%)
National Survey Confidence
Interval Never 4.2 1.0 0.8-1.2 Sometimes 16.6 4.9 4.5-5.3 Usually 20.7 14.2 13.3-14.8 Always 48.7 79.9 79.2-80.6 Don't Know 8.4 Haven't needed to call 0.0 Missing 1.4
27. “How often does your child’s provider explain things in a way that you and your child can understand?” (select only one) Frequency Percent Never 10 1.5Sometimes 49 7.3Usually 139 20.8Always 453 67.8Don't Know 15 0.03Missing 2
Appendix E 10

28. “How easy or difficult is it for you to read and understand written information that you receive from child’s health care provider about your child’s health?” (select only one) Frequency Percent Very easy 427 63.9Somewhat easy 154 23.1Somewhat difficult 51 7.6Very difficult 8 1.2Don't get any written information from provider 19 2.8Don't Know 7 1.0Missing 2
29. “What do you usually do if you don’t understand information provided by your child’s health care provider?” (Select only one) Frequency Percent Ask the health care provider, or a staff person in office/clinic to explain
565 84.6
Ask a pharmacist 32 4.8Ask a family member or friend (who is not a health care professional)
25 3.7
Search for information on the internet 14 2.1Look for information in books, magazines, or other print materials
3 .4
Nothing 20 3.0Other 3 0.4Missing 6 .9
30. “Do you ever go online to access the Internet or the World Wide Web or to send and receive an e-mail?” Frequency Percent Yes 371 55.5No 294 44.0Missing 3 .4
Appendix E 11

31. “How often do you use the Internet to look for advice or information about health or health care for your child? (Select only one) Frequency Percent Once a week 70 10.5Once a month 59 8.8Every few months 99 14.8Less often 133 19.9Don’t know 29 4.3Missing 278 41.6
32. “Has there been a time in the last two years when you didn’t follow the health care provider’s advice or treatment plan for your child (including getting a recommended test or seeing a referred provider)?” Frequency Percent Yes 63 9.4No 604 90.4Missing 1 .1
33. “If yes, why did you not follow the health provider’s advice or treatment plan?” (select all that apply) Frequency Percent I didn't understand what I was supposed to do 9 13.0I disagreed with what the provider wanted me to do 33 47.8The provider's advice or treatment plan cost too much 3 4.3The provider's advice was too difficult to do 4 5.8The provider's advice or treatment plan went against my personal beliefs 3 4.3Because of the potential side effects of the drug or treatment 6 8.7Other 11 15.9Total 69 100.0
Appendix E 12

34. “In the last 2 years, did you need an interpreter to help you speak with a health care provider for your child?” Frequency Percent Yes 15 2.2No 651 97.5Missing 2 .3
35. “If you needed an interpreter to help you speak with a health care provider, who helped you most often?” (Select only one) Frequency Percent Professional interpreter provided by clinic or provider’s office
7 1.0
A bilingual staff member at the clinic or provider’s office
4 .6
A friend or family member 4 .6Didn’t receive interpreter services when I needed them
1 .1
Other 6 .6Missing 646 96.7
36. “Do you have any kind of health care coverage, including health insurance, prepaid plans-HMOs, or government programs such as Medicaid or Medicare?” Frequency Percent Yes 555 83.1No 97 14.5Don’t Know 4 .6Missing 12 1.8
Appendix E 13

37. “What is your age?” Frequency Percent 17-20 years 23 3.421-30 years 257 38.531-40 years 233 34.941-50 years 108 16.251+ years 34 5.1Missing 13 1.9
39. and 40. Race/Ethnicity Frequency Percent
White alone 442 66Black/African American alone 149 22Native American/Alaskan Native alone 23 3Asian alone 5 1Native Hawaiian and Other Pacific Islander alone 1 0Other 14 2More than one race 25 4Did not know 3 0Declined to answer 12 2Hispanic/Latino 46 7Total 668 100
38. “What is your gender?” Frequency Percent Male 105 15.7Female 553 82.8Missing 10 1.5
Appendix E 14

41. Zip Codes of Survey Respondents 14006 14038 14066 14125 14201 14217 14411 14591 14738 14805 14008 14040 14067 14127 14204 14218 14420 14620 14739 14806 14009 14042 14070 14129 14205 14220 14423 14701 14743 14813 14011 14047 14072 14131 14206 14221 14427 14706 14744 14880 14020 14048 14075 14132 14207 14222 14464 14708 14745 14895 14021 14051 14081 14134 14208 14223 14468 14709 14748 14898 14024 14052 14086 14135 14209 14224 14470 14714 14753 14029 14055 14091 14136 14210 14225 14525 14715 14755 14030 14057 14094 14138 14211 14226 14530 14719 14760 14031 14058 14101 14141 14212 14228 14536 14726 14770 14032 14060 14103 14143 14213 14301 14550 14727 14774 14033 14062 14108 14150 14214 14303 14559 14731 14779 14034 14063 14113 14167 14215 14304 14569 14735 14783 14036 14065 14120 14171 14216 14305 14571 14737 14804
42.Employment Status Frequency Percent
Fulltime (one job) 282 42.2Part-time (one job) 104 15.6Part-time (mult. Jobs) 20 3.0Not employed-retired 11 1.6Not employed-student 29 4.3Not employed for pay 109 16.3Not employed – disability 86 12.9Other 14 2.1Missing 13 1.9
43. Annual Household Income Frequency Percent
Less than $10,000 169 25.3
$10,001-15,000 100 15
$15,001-25,000 130 19.5 $25,001-35,000 77 11.5 $35,001-50,000 72 10.8 $50,001-75,000
47 7 $75,000+ 41 6.1 Missing 31 4.8
Appendix E 15
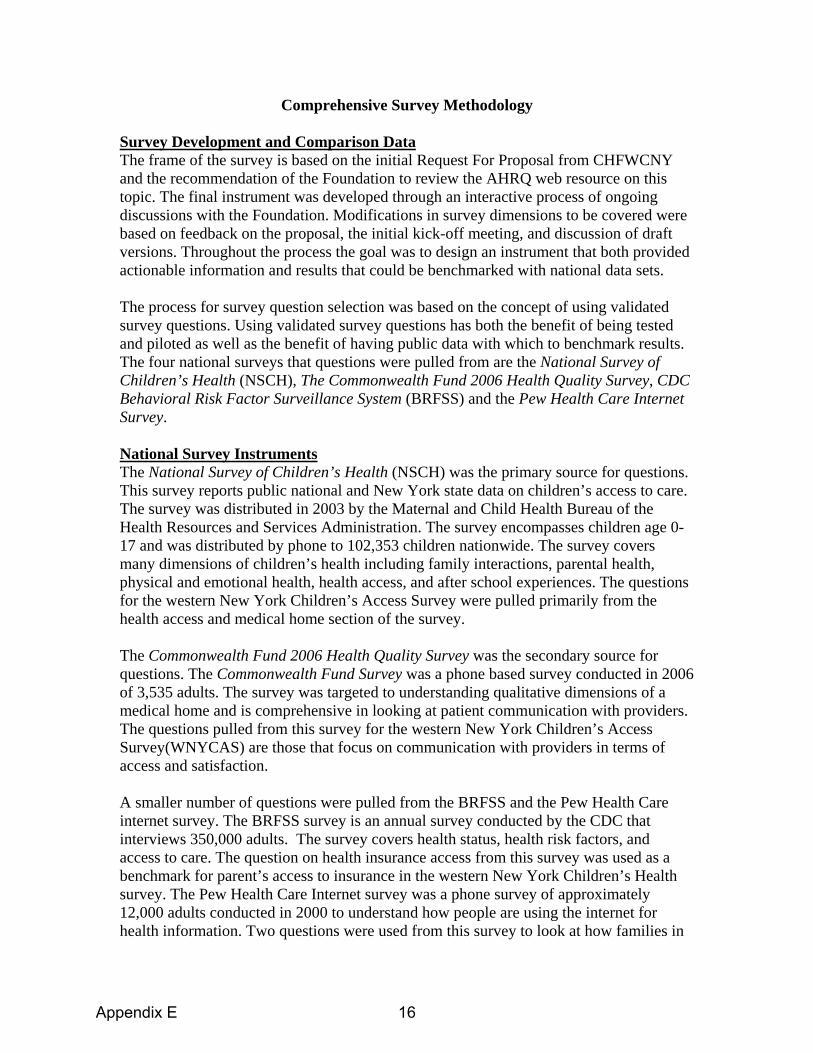
Comprehensive Survey Methodology Survey Development and Comparison Data The frame of the survey is based on the initial Request For Proposal from CHFWCNY and the recommendation of the Foundation to review the AHRQ web resource on this topic. The final instrument was developed through an interactive process of ongoing discussions with the Foundation. Modifications in survey dimensions to be covered were based on feedback on the proposal, the initial kick-off meeting, and discussion of draft versions. Throughout the process the goal was to design an instrument that both provided actionable information and results that could be benchmarked with national data sets. The process for survey question selection was based on the concept of using validated survey questions. Using validated survey questions has both the benefit of being tested and piloted as well as the benefit of having public data with which to benchmark results. The four national surveys that questions were pulled from are the National Survey of Children’s Health (NSCH), The Commonwealth Fund 2006 Health Quality Survey, CDC Behavioral Risk Factor Surveillance System (BRFSS) and the Pew Health Care Internet Survey.
National Survey Instruments The National Survey of Children’s Health (NSCH) was the primary source for questions. This survey reports public national and New York state data on children’s access to care. The survey was distributed in 2003 by the Maternal and Child Health Bureau of the Health Resources and Services Administration. The survey encompasses children age 0-17 and was distributed by phone to 102,353 children nationwide. The survey covers many dimensions of children’s health including family interactions, parental health, physical and emotional health, health access, and after school experiences. The questions for the western New York Children’s Access Survey were pulled primarily from the health access and medical home section of the survey. The Commonwealth Fund 2006 Health Quality Survey was the secondary source for questions. The Commonwealth Fund Survey was a phone based survey conducted in 2006 of 3,535 adults. The survey was targeted to understanding qualitative dimensions of a medical home and is comprehensive in looking at patient communication with providers. The questions pulled from this survey for the western New York Children’s Access Survey(WNYCAS) are those that focus on communication with providers in terms of access and satisfaction. A smaller number of questions were pulled from the BRFSS and the Pew Health Care internet survey. The BRFSS survey is an annual survey conducted by the CDC that interviews 350,000 adults. The survey covers health status, health risk factors, and access to care. The question on health insurance access from this survey was used as a benchmark for parent’s access to insurance in the western New York Children’s Health survey. The Pew Health Care Internet survey was a phone survey of approximately 12,000 adults conducted in 2000 to understand how people are using the internet for health information. Two questions were used from this survey to look at how families in
Appendix E 16
western New York use the internet in addition to traditional sources for health information.
Survey Administration The survey plan in the proposal submitted suggested the collection of 200-300 surveys from provider locations and 300-400 surveys from community locations for a total of 600-700 surveys. The provider locations were chosen based on their role as safety-net providers. Surveys were distributed at all of the federally qualified health centers in western New York as well as other essential safety-net providers. The objective in identifying community locations was to reach out to low income families who may not have a regular source primary care. The majority of survey locations in the community were agencies or community events that targeted low income families. A complete list of survey locations is included in the appendix. Surveys were distributed to parents or others who stated they were responsible for at least one child age 18. Survey administrators were on hand to explain the survey’s purpose, and to assist people in completing the survey if necessary. The majority of surveys were administered by trained students of the University at Buffalo Department of Psychology. In some cases social service agencies staff volunteered to assist in distribution of the survey and were trained by phone. JSI held a two day training session with the eight University at Buffalo psychology students hired for survey administration. As an incentive, all survey respondents were given the opportunity to enter into a raffle for a $250 gift certificate to a grocery store of their choice. Data Management and Analysis The data management and analysis phase was facilitated using a specialized survey research tool called Teleform. Teleform is a state-of-the-art survey research tool that assists in both survey development and data management. Teleform facilitates automated scanning and data cleaning as well as the development of an electronic database. The analysis was conducted using SPSS and SAS, which help to facilitate a rigorous analysis and thorough reporting of survey results. Where there are a sufficient number of responses comparisons were made between groups based on poverty status, income, race, location of survey distribution (community versus provider location), urban and rural geography, and insurance status. Differences between groups were tested for significance using a Chi-Square test. The level of significance is indicated in parentheses as (p< X). The original data files are available for future use in both SPSS and ACCESS by contacting CHFWCNY. Limitations The survey locations were chosen to gather information from consumers that are connected to the safety- net, as well as those low income families whose utilization of the safety-net is unknown. The survey does not represent a random sample of the western
Appendix E 17
New York population, but deliberately over-sampled low income families. As a non-probability sample, the survey results cannot be generalized to the total western New York population. The results simply represent a sample of the locations surveyed, and thus, potential safety net users. A non-probability sample was chosen as a way to assess the population of interest as efficiently as possible, and with a careful selection of survey distribution sites this methodology is reasonably representative of low income families. The goal of the survey distribution methodology was to sample a wide range of geographic locations representing all eight counties of western New York. However, as a non-random sample some counties have survey sample sizes that are not in proportion to their population. To ensure that results were representative of the rural counties in general and not skewed by counties that were over-represented in the data the data was run separately for the over-represented rural counties to identify if there were significant differences between the results of this county and the other rural counties. Surveys results are not weighted by population of each county because it is non-random sample, in the sense that not every person in each county was eligible to be surveyed. Survey results are not presented at a county level for two primary reasons. First, the sample size from each county is not large enough to generalize conclusions and apply them to the entire county. Second, the types of locations the surveys were collected from varies county by county. There are some counties in which no surveys were distributed in a provider setting and there are differences between counties in the types of events and social service agencies where the surveys were collected. When making comparisons with the benchmark data it is critical to consider that low income families and families on Medicaid are oversampled. For this reason the demographics of this survey differ from both the general population of western New York, and the populations in the surveys that are used for benchmark data. As a result, in areas where our data shows western New York as performing well, or better than the national benchmarks, this is significant considering we are looking at a more disadvantaged population than the national benchmark data represents. This also means that in areas where western New York appears to be doing worse than the national benchmarks, it is the subset of low income families of western New York that compares poorly to national data, and this may not be true if we were comparing the national data to the general population of western New York. There are also limitations to the survey result’s ability to represent the most vulnerable of families in western New York. The community locations we surveyed included social service agencies and community events. By nature of families being present at these locations and events, they represent the low income families that have been connected in some way with the social service safety-net. There may be a group of families not represented in our data who have fallen through the cracks and are not connected with the social service system and whose access to care is more challenging than the families represented in this survey.
Appendix E 18
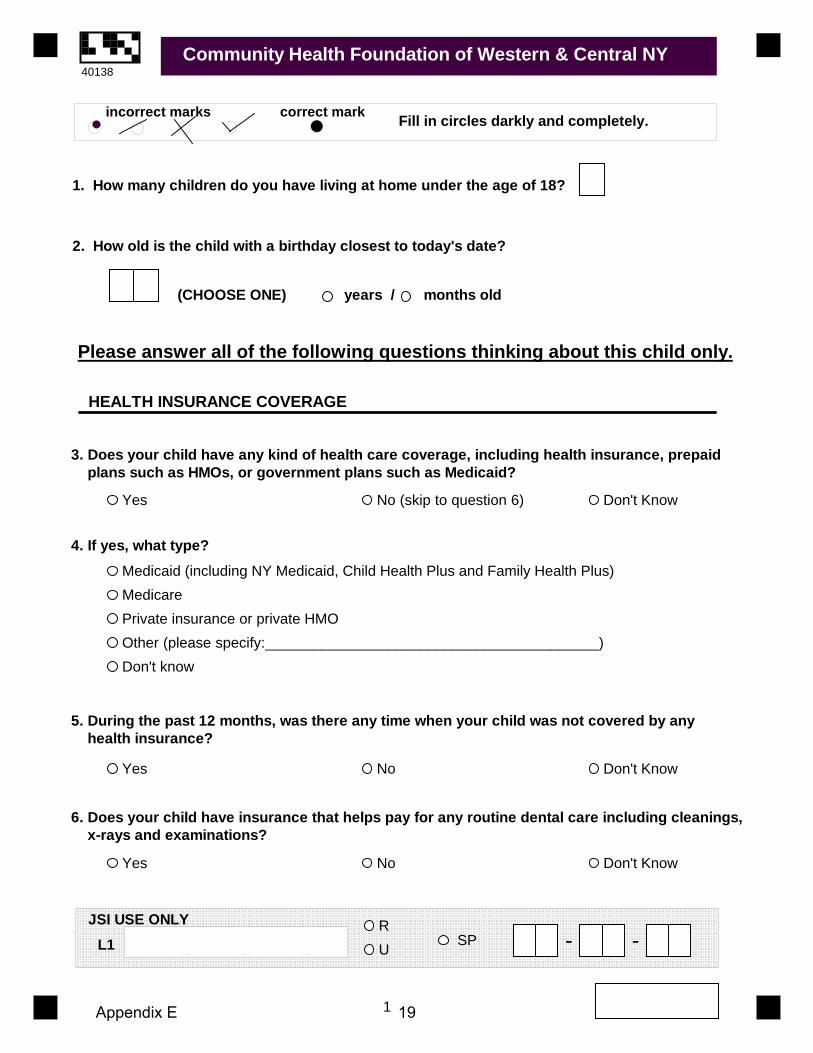
1. How many children do you have living at home under the age of 18?
3. Does your child have any kind of health care coverage, including health insurance, prepaid plans such as HMOs, or government plans such as Medicaid?
4. If yes, what type?
Yes No (skip to question 6) Don't Know
Medicaid (including NY Medicaid, Child Health Plus and Family Health Plus)MedicarePrivate insurance or private HMOOther (please specify:_________________________________________)Don't know
Community Health Foundation of Western & Central NY
HEALTH INSURANCE COVERAGE
2. How old is the child with a birthday closest to today's date?
(CHOOSE ONE) years / months old
Please answer all of the following questions thinking about this child only.
5. During the past 12 months, was there any time when your child was not covered by any health insurance?
Yes No Don't Know
6. Does your child have insurance that helps pay for any routine dental care including cleanings, x-rays and examinations?
Yes No Don't Know
JSI USE ONLYL1
Fill in circles darkly and completely.incorrect marks correct mark
SP - -
1
RU
40138
Appendix E 19

7. Where do you usually take your child when he/she is sick or needs health care? (Select only one)
8. During the past 12 months, did your child visit a health care provider (such as a general doctor, pediatrician, specialist doctor, nurse practitioner, or physician assistant) for preventive care? Preventive care visits include things like a well-child check-up, a routine physical exam, immunizations, or health screening tests.
9. The last time your child had a preventive care visit, how quickly could you get an appointmentto see a health care provider? (Select only one)
10. The last time your child was sick or needed medical attention in the past 12 months, how quickly could you get an appointment to see a health care provider? (Select only one)
Doctor's office or private clinicCommunity health center or other public clinicHospital outpatient departmentHospital emergency roomSome other place (please specify:________________________)Don't knowDon't have a place I usually go
Community Health Foundation of Western & Central NY
Yes No (skip to question 10) Don't Know
On the same dayThe next dayIn 2 to 3 daysIn 4 to 5 daysIn 6 to 7 daysAfter more than one weekAfter more than one monthNever able to get an appointmentDon't know
On the same dayThe next dayIn 2 to 3 daysIn 4 to 5 daysIn 6 to 7 daysAfter more than one weekNever able to get an appointmentNot sick nor needed medical attention in the past 12 monthsWent to ER/Urgent care where an appointment was not neededDon't know
HEALTH CARE ACCESS AND UTILIZATION
2
40138
Appendix E 20
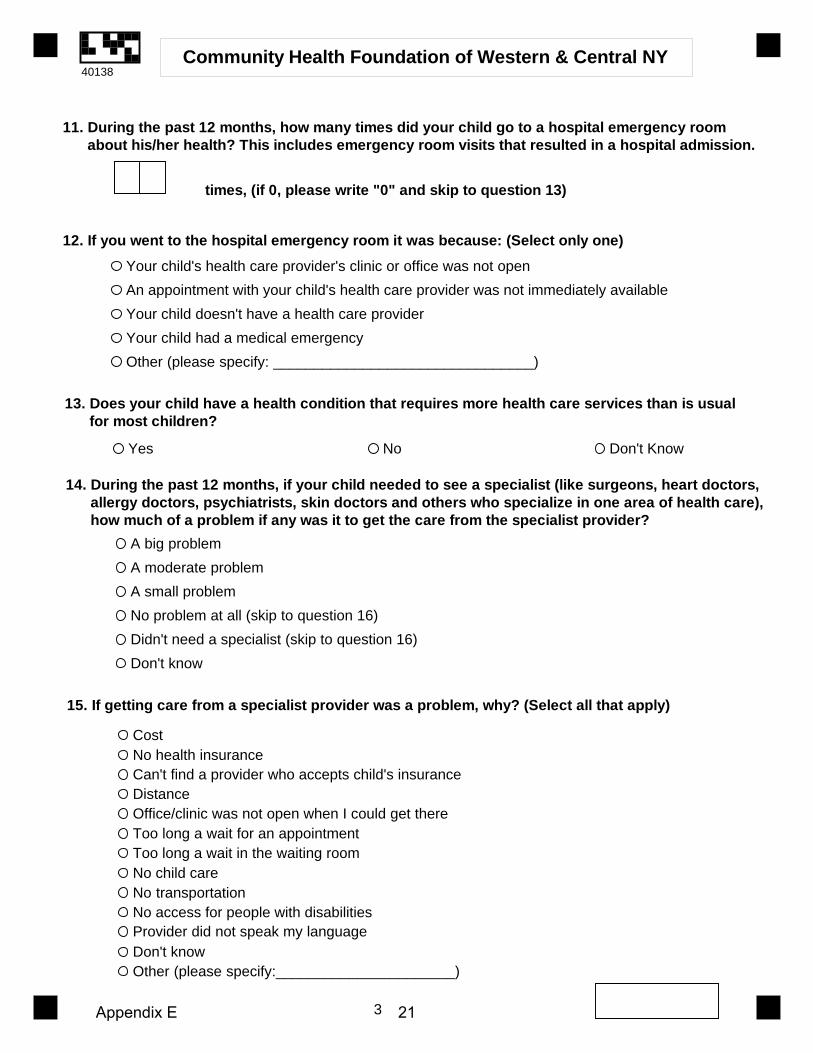
11. During the past 12 months, how many times did your child go to a hospital emergency room about his/her health? This includes emergency room visits that resulted in a hospital admission.
12. If you went to the hospital emergency room it was because: (Select only one)
13. Does your child have a health condition that requires more health care services than is usual for most children?
14. During the past 12 months, if your child needed to see a specialist (like surgeons, heart doctors, allergy doctors, psychiatrists, skin doctors and others who specialize in one area of health care), how much of a problem if any was it to get the care from the specialist provider?
Community Health Foundation of Western & Central NY
times, (if 0, please write "0" and skip to question 13)
Your child's health care provider's clinic or office was not openAn appointment with your child's health care provider was not immediately availableYour child doesn't have a health care providerYour child had a medical emergencyOther (please specify: ________________________________)
Yes No Don't Know
A big problemA moderate problemA small problemNo problem at all (skip to question 16)Didn't need a specialist (skip to question 16)Don't know
15. If getting care from a specialist provider was a problem, why? (Select all that apply)
CostNo health insuranceCan't find a provider who accepts child's insuranceDistanceOffice/clinic was not open when I could get thereToo long a wait for an appointmentToo long a wait in the waiting roomNo child careNo transportationNo access for people with disabilitiesProvider did not speak my languageDon't knowOther (please specify:______________________)
3
40138
Appendix E 21

16. During the past 12 months did your child receive all the medical care he/she needed?
17. Why did your child not get all the medical care he/she needed? (Select all that apply)
18. During the past 12 months did your child see a dentist for any routine preventive dental care including check-ups, screenings and sealants? Include all types of dentists, such as orthodontists, oral surgeons and other dental specialists.
19. During the past 12 months, did your child receive all the routine preventive dental care he/she needed?
Community Health Foundation of Western & Central NY
Yes (skip to question 18) No Don't Know
CostNo health insuranceCan't find a provider who accepts child's insuranceDistanceOffice/clinic was not open when I could get thereToo long a wait for an appointmentToo long a wait in the waiting roomNo child careNo transportationNo access for people with disabilitiesProvider did not speak my languageDon't knowOther (please specify:______________________)
Yes No Don't Know
Yes (skip to question 21) No Don't Know
20. Why did your child not get all the dental care he/she needed? (Select all that apply)CostNo health insuranceCan't find a dentist who accepts child's insuranceDistanceOffice/clinic was not open when I could get thereToo long a wait for an appointmentToo long a wait in the waiting roomNo child careNo transportationNo access for people with disabilitiesDentist did not speak my languageDon't knowOther (please specify:______________________)
21. During the past 12 months, did your child receive any mental health care or counseling?Yes No Don't Know
4
40138
Appendix E 22
24. How do you usually get to your child's provider's office or clinic? (Select only one)
25. About how long does it take to get your child's provider's office or clinic? (Select only one)
26. During the past 12 months when you have called your child's health care provider for help or advice over the phone, how often were you able to get the advice you needed? (Select only one)
BusDrive myselfHave a friend or relative driveWalkTaxiOther (please specify:_________________)
Community Health Foundation of Western & Central NY
23. Why did your child not get all the mental health care and counseling he/she needed? (Select all that apply)
CostNo health insuranceCan't find a provider who accepts child's insuranceDistanceOffice/clinic was not open when I could get thereToo long a wait for an appointmentToo long a wait in the waiting roomNo child careNo transportationNo access for people with disabilitiesProvider did not speak my languageDon't knowOther (please specify:______________________)
Less than 15 minutes16 to 30 minutes31 to 60 minutesMore than 60 minutes
NeverSometimesUsuallyAlwaysDon't KnowHaven't needed to call
22. During the past 12 months, did your child receive all the mental health care and counseling he/she needed?
Yes (skip to question 24) No Don't Know
5
40138
Appendix E 23

Community Health Foundation of Western & Central NY
CULTURAL COMPETENCE & HEALTH LITERACY
27. How often does your child's health care provider explain things in a way that you and your child can understand? (Select only one)
28. How easy or difficult is it for you to read and understand written information that you receivefrom your child's health care provider about your child's health? (Select only one)
NeverSometimesUsuallyAlwaysDon't know
Very easySomewhat easySomewhat difficultVery difficultDon't get any written information from providerDon't know
29. What do you usually do if you don't understand information provided by your child's health care provider? (Select only one)
Ask the health care provider, or a staff person in office/clinic to explainAsk a pharmacistAsk a family member or friend (who is not a health care professional)Search for information on the internetLook for information in books, magazines, or other print materialsNothingOther (please specify: ___________________________________________)
30. Do you ever go online to access the Internet or the World Wide Web or to send and receive e-mail?
Yes No (skip to question 32)
31. How often do you use the Internet to look for advice or information about health or health care for your child? (Select only one)
Once a weekOnce a monthEvery few monthsLess oftenDon't know
6
40138
Appendix E 24

32. Has there been a time in the last two years when you didn't follow the health care provider's advice or treatment plan for your child (including getting a recommended test or seeing a referred provider)?
33. If yes, why did you not follow the health care provider's advice or treatment plan? (Select all that apply)
I didn't understand what I was supposed to do.I disagreed with what the provider wanted me to do.The provider's advice or treatment plan cost too much.The provider's advice or treatment plan was too difficult to do.The provider's advice or treatment plan went against my personal beliefs.Because of the potential side effects of the drug or treatment.Other (please specify:____________________________________________)
34. In the last 2 years, did you need an interpreter to help you speak with a health care provider for your child?
35. If you needed an interpreter to help you speak with a health care provider, who helped you most often? (Select only one)
Professional interpreter provided by clinic or provider's officeA bilingual staff member at the clinic or provider's officeA friend or family memberDidn't receive interpreter services when I needed themOther (please specify:_______________________________________________)
Yes No (skip to question 34)
Yes No (skip to question 36)
ABOUT YOU
36. Do you have any kind of health care coverage, including health insurance, prepaid plans- HMOs, or government programs such as Medicaid or Medicare?
Please answer the remaining questions in regard to YOURSELF (not your child).
Yes No Don't Know
Community Health Foundation of Western & Central NY
7
40138
Appendix E 25

37. What is your age?
38. What is your gender?
40. Which one or more of the following would you say is your race? (Select all that apply)
Male Female
Black or African AmericanWhiteAsianNative Hawaiian or Other Pacific IslanderAmerican Indian or Alaska NativeOther (please specify: ______________________)Don't know
39. Are you Hispanic/Latino?Yes No Don't Know
41. What is the zip code where you live?
42. Please provide your employment statusEmployed fulltime (one job)Employed part-time (one job)Employed part-time (more than one job)Not employed - retiredNot employed - studentNot employed for payNot employed because of a disabilityOther (please specify:___________________________________)
43. Last year, that is in 2006, what was your total household income from all sources before taxes?
Under $10,000$10,001 - $15,000$15,001 - $25,000$25,0001 - $35,000$35,001 - $50,000$50,001 - $75,000$75,000 +
THANK YOU!
Community Health Foundation of Western & Central NY
8
40138
Appendix E 26

Appendix F

Practice Management
System
Electronic Medical Record
Chronic Disease Registry
Electronic Info. Sharing (e.g., labs and
other diagnostics)
Exchange of Digital X-Rays and Other
Diagnostics
Dedicated HIT
CoordinatorCHC of Buffalo1
Yes (Full) Yes1Yes, PECS No No Yes
Northwest Buffalo CHC Yes (Basic) No No No No NoJefferson Family Practice Yes (Full) Yes (Full) Yes Yes Yes, w/ Buffalo General Yes
Hodge Pediatrics2Yes (Basic) No Yes2
No No NoCleve-Hill Family Practice Yes (Basic) No No Yes, w/ECMC Yes, w/ ECMC Yes, @ ECMCErie County Health Department Yes (Basic) No No No No NoHamilton B. Mizer HC Yes (Full) Yes (Full) Yes Yes, w/ Niagara Fall MMC Yes, w/ Niagara Fall MMC Yes, @ NFMCCPlanned Parenthood of WNY Yes (Basic) No No No No NoOak Orchard CHC Yes (Full) In Process Yes, PECS Yes, w/ Lakeside Hospital Yes, w/ Lakeside Hospital YesWyoming County Hospital ER No No No No No NoZahi Kassas (Private Practice) Yes (Full) Yes (Basic) Yes Yes, w/ Jones Memorial Yes, w/ Jones Memorial NoUniversal Primary Care Yes (Full) Yes (Full) Yes Yes, w/ Olean General No Yes
The Resource Center Yes (Full) No3No No No Yes
Summary of Health Information Technology Infrastructure and Capacity Among Safety-Net Providers that were Visited
1 Current system has limited functionality but in the process of implementing a new state-of-the-art EMR that will interface with its existing Practice Management System and fully automate patient reporting, follow-up, and chronic disease management activities.2 Hodge Pediatrics is part of Kaleida's Pediatric Residency Program. While they do not have an electronic medical record or other automated HIT they do a great deal of quality assurance and chronic disease management with their paper-based systems and resources.3 Primary medical and dental clinics do not have an EMR but the behavioral health services use a system that tracks patient notes and other information.
Appendix F 1