western new york public policy transmission planning report
TRANSCRIPT

Western New York Public Policy Transmission Planning Report A Report by the New York Independent System Operator
Final Report October 17, 2017

i
NYISO BOARD OF DIRECTORS’ DECISION
ON
APPROVAL OF WESTERN NEW YORK PUBLIC POLICY TRANSMISSION PLANNING REPORT AND SELECTION
OF PUBLIC POLICY TRANSMISSION PROJECT
OCTOBER 17, 2017
INTRODUCTION
NYISO Staff submitted to the NYISO Board of Directors (“Board”) for its review and action the Public Policy Transmission Planning Report for the Western New York Public Policy Transmission Need (“Western NY Report”). The Western NY Report presents the results of the NYISO’s first Public Policy Transmission Planning Process (“Public Policy Process”). NYISO Staff evaluated numerous projects proposed to address the need for new transmission in Western New York to realize greater utilization of renewable energy from the Niagara hydroelectric facility and imports from Ontario (“Western NY Need”). As detailed in the Western NY Report, NYISO Staff recommends that the Board select the Empire State Line Proposal 1 (“Project T014”) proposed by NextEra Energy Transmission New York, Inc. (“NextEra”) as the more efficient or cost-effective transmission solution to address the Western NY Need.
The Board exercised its discretion under the ISO Agreement to provide all interested
parties with the opportunity to submit comments and to make oral presentations for the Board’s consideration prior to its taking action concerning the Western NY Report.1 Stakeholders and developers submitted comments through the stakeholder committee process, written comments, and oral presentations made to the Board on October 16, 2017.2 The Board carefully considered these comments in making its determination.
For the reasons set forth below, we approve the Western NY Report and select NextEra’s
Project T014 as the more efficient or cost-effective transmission solution to address the Western NY Need.
BACKGROUND The Public Policy Process is the means by which the NYISO addresses transmission needs that are driven by public policy requirements identified by the New York Public Service
1 ISO Agreement Section 5.07 (“The ISO Board also may review any matter, complaint, or
Committee action on its own motion.”) 2 The following entities submitted comments and/or made oral presentations to the Board:
Consolidated Edison of New York, Inc., New York Association of Public Power, New York State Electric and Gas Corporation, NextEra Energy Transmission of New York, Inc., Niagara Mohawk Power Corporation d/b/a National Grid, North America Transmission, LLC, and Power Authority of the State of New York.

ii
Commission (“PSC”). In a July 2015 order, the PSC identified the relief of congestion in Western New York, including access to 2,700 MW from the Niagara hydroelectric facility and additional imports of renewable energy from Ontario, as a Public Policy Transmission Need. NYISO Staff solicited and evaluated the viability and sufficiency of proposed solutions to address this Western NY Need. On May 31, 2016, the NYISO issued the Western New York Viability and Sufficiency Assessment and filed it with the PSC for its consideration and action. The NYISO identified ten viable and sufficient projects to address the Western NY Need.3 On October 13, 2016, the PSC issued an order confirming the Western NY Need and determining that the NYISO should evaluate and select a transmission solution. NYISO Staff, in coordination with its independent consultant, Substation Engineering Company (“SECO”), conducted a detailed evaluation and ranked the ten proposed solutions based on each project’s performance under the selection metrics established in the OATT. These quantitative and qualitative metrics include the project’s cost, cost per MW, expandability, operability, performance, property rights and routing, schedule, and other metrics (e.g., production cost savings, LBMP savings, emissions savings, congestion, etc.). NYISO Staff used a multitude of scenarios in evaluating the proposed projects’ performance under these metrics. NYISO Staff determined that NextEra’s Project T014 is the more efficient or cost-effective transmission solution to address the Western NY Need based on its total performance across the selection criteria and scenarios. Project T014 includes a new Dysinger 345 kV substation, a new East Stolle 345 kV switchyard, and a 345 kV line connecting Dysinger and East Stolle substations, with a 700 MVA 345 kV phase angle regulator (“PAR”) at the Dysinger end of the line. NYISO Staff developed a draft Western NY Report detailing the results of its analysis. The draft report was reviewed with stakeholders in five Electric System Planning Working Group (“ESPWG”) and Transmission Planning Advisory Subcommittee (“TPAS”) meetings and was revised and clarified based on stakeholder and developer feedback. In addition, the Market Monitoring Unit (“MMU”) reviewed and considered the impact on the NYISO-administered markets and concluded that the NYISO’s selection of Project T014 was reasonable and would not adversely affect the NYISO’s wholesale electricity markets. The Business Issues Committee and Management Committee subsequently reviewed and recommended Board approval of the Western NY Report through unanimous advisory votes with abstentions. Pursuant to Section 31.4.11.2 of the NYISO OATT, NYISO Staff then submitted the Western NY Report to the Board for its review and action. At the Board’s direction, NYISO Staff invited stakeholders and developers to submit comments to the Board for its consideration prior to its taking action concerning the Western NY Report. A number of stakeholders provided input in the stakeholder committees, which input
3 The NYISO also recommended in its Viability and Sufficiency Assessment certain non-bulk transmission facility upgrades that are needed to fulfill the objectives of the Western NY Need. The PSC subsequently directed National Grid to undertake the necessary upgrades on the non-bulk transmission facilities, and stated that the costs of these non-bulk transmission facilities should not be a distinguishing factor in the NYISO’s selection process for addressing the Western NY Need.

iii
was submitted to the Board. In addition, seven stakeholders and developers provided written comments in the committee process and following the Management Committee meeting, which comments were publicly posted and provided to the Board. Finally, three entities made oral presentations to the Board on October 16, 2017. NYISO Staff and the Board reviewed and carefully considered this input.
BOARD DECISION
We appreciate the significant work performed by NYISO Staff in administering the NYISO’s first Public Policy Process and the participation of the developers, stakeholders, and the PSC, including the extensive time and resources they have dedicated to this process and the valuable feedback they have provided.
Based on our review and consideration of the Western NY Report, stakeholders’ and
developers’ comments, and the analysis of the market impacts provided by the MMU, we approve the Western NY Report without modification and select NextEra’s Project T014 to address the Western NY Need. We agree with NYISO Staff’s conclusion that NextEra’s Project T014 is both the more efficient and more cost-effective transmission solution to address the Western NY Need based on its total performance across the selection metrics and scenarios. As the selected developer, NextEra will be eligible to allocate and recover the costs associated with its Project T014 to the extent permitted under the NYISO OATT.
North America Transmission, LLC (“NAT”) argues that we should select its project over
NextEra’s Project T014.4 NAT asserts that its project is substantially similar to NextEra’s, but with a lower capital cost and with better performance under certain metrics. We do not agree. As detailed in the Western NY Report, while NAT’s project performed well under certain selection metrics, including a lower overall capital cost for the smaller project, NYISO Staff reasonably concluded that Project T014 is the superior project across the full range of metrics and scenarios, particularly with respect to operability, cost per MW ratio, and production cost savings. Project T014’s design provides key operability benefits to the grid. The proposed Dysinger substation will become the new 345 kV hub in Western New York where seven 345 kV lines are connected, and will electrically reduce the distance for the existing Niagara to Rochester 345 kV transmission corridor. In addition, the proposed PAR at the Dysinger substation will provide additional operational flexibility by providing a new level of controllability to power flows on the 345 kV network.5 Project T014’s higher capital costs correlate to these greater benefits to the electric system, making it the more efficient and more cost-effective project. Moreover, Project T014 provides more production cost savings on a statewide basis than NAT’s project.
We also reject NAT’s assertion that the NYISO’s cost estimate determinations are flawed
because they did not take into account NAT’s proposed cost containment measure. We have selected Project T014 based on its superior performance across the range of selection metrics and scenarios, not simply the cost-based metrics. The NYISO is required to select the more efficient
4 North America Transmission was afforded the opportunity to raise its concerns directly with the Board through an oral presentation, but elected not to do so.
5 Even when the proposed PAR is bypassed, Project T014 still demonstrates significant benefits.

iv
or cost effective solution, not the least cost solution.6 Furthermore, the Federal Energy Regulatory Commission (“FERC”) rejected proposals to require the NYISO to consider cost containment as a selection metric,7 and the NYISO’s tariff does not currently require consideration of cost containment measures. However, based on feedback from the PSC, stakeholders, and developers, NYISO Staff has informed stakeholders that it will consider potential tariff changes that could take into account cost containment measures for future planning cycles.
Stakeholders and developers have praised NYISO Staff’s work in administering this first
Public Policy Process. They have also identified in their comments certain elements of the Public Policy Process that may benefit from further enhancement or clarification going forward, including the length of the process, the data provided for stakeholder review and the timeframe for that review, the consideration of cost containment measures, the treatment of non-bulk transmission facilities, the role of the MMU in the process, and other matters. NYISO Staff will perform a “lessons learned” review to consider process enhancements and clarifications based on its experience administering this first Public Policy Process and stakeholder and developer feedback. We direct NYISO Staff to consider the concerns raised by stakeholders and developers as part of this “lessons learned” process.
Finally, Con Edison raised concerns regarding the NYISO’s potential application of the
default load ratio share cost allocation methodology established in its OATT to allocate the project costs associated with the Western NY Need. As acknowledged by Con Edison, the NYISO OATT establishes a process by which the PSC or the selected developer may propose for FERC’s acceptance an alternative to the load ratio share cost allocation methodology. The NYISO will allocate the costs of NextEra’s Project T014 in accordance with this tariff process.
# # #
6 See New York Independent System Operator, Inc., 151 FERC ¶ 61,040 at P 116 (2015) (“2015
FERC Compliance Order”) (“Furthermore, if the Commission were to accept LS Power’s arguments, we would essentially be directing NYISO to consider cost as the primary factor in its evaluation of proposed transmission solutions for selection in the regional transmission plan for purposes of cost allocation; however, Order No. 1000 does not include such a requirement. Rather, Order No. 1000 requires NYISO to consider the relative efficiency and cost-effectiveness of proposed transmission solutions.”) (internal citations omitted).
7 See 2015 FERC Compliance Order at P 117 (“[W]e disagree with LS Power that the Commission should have required NYISO to include specific cost containment commitments among the evaluation metrics.”); New York Independent System Operator, Inc., 148 FERC ¶ 61,044 at P 251 (2014) (“We also reject NextEra’s proposed revision to include an additional cost metric based on a transmission developer’s willingness to accept cost risks since NYISO’s evaluation and selection process is not a rate making proceeding, and a transmission developer has the opportunity to recover its prudent costs in a proceeding before the Commission.”)

Western New York Public Policy Transmission Planning Report | 2
Table of Contents EXECUTIVE SUMMARY ........................................................................................................................................... 4
1. THE PUBLIC POLICY TRANSMISSION PLANNING PROCESS .............................................................................. 8
1.1 Identification of a Public Policy Transmission Need ................................................................... 8
1.2 Solicitation for Proposed Solutions .............................................................................................. 9
1.3 Evaluation for Viability and Sufficiency ........................................................................................ 9
1.4 Evaluation for Selection as the More Efficient or Cost Effective Solution .............................. 10
1.5 Identifying a Cost Allocation Methodology for the Public Policy Transmission Need ............. 11
2. WESTERN NEW YORK PUBLIC POLICY TRANSMISSION NEED ....................................................................... 12
2.1 Identification of Western New York Public Policy Transmission Need.................................... 12
2.2 Development of Solutions ......................................................................................................... 13
2.3 Viability and Sufficiency Assessment ........................................................................................ 16
2.4 Confirmation of Need for Transmission .................................................................................... 18
2.5 Local Transmission Plan Updates and PSC-Directed Upgrades .............................................. 19
3. EVALUATION FOR SELECTION OF THE MORE EFFICIENT OR COST EFFECTIVE SOLUTION .............................. 20
3.1 Overview of Proposed Viable and Sufficient Solutions ............................................................ 20
3.1.1 T006: North America Transmission – Proposal #1 ..................................................................................... 20 3.1.2 T007: North America Transmission – Proposal #2 ..................................................................................... 21 3.1.3 T008: North America Transmission – Proposal #3 ..................................................................................... 22 3.1.4 T009: North America Transmission – Proposal #4 ..................................................................................... 22 3.1.5 T011: National Grid – Moderate Power Transfer Solution ......................................................................... 23 3.1.6 T012: National Grid – High Power Transfer Solution ................................................................................. 24 3.1.7 T013: NYPA/NYSEG – Western NY Energy Link .......................................................................................... 25 3.1.8 T014: NextEra Energy Transmission New York – Empire State Line #1 ...................................................... 26 3.1.9 T015: NextEra Energy Transmission New York – Empire State Line #2 ...................................................... 27 3.1.10 T017: Exelon Transmission Company – Niagara Area Transmission Expansion ...................................... 27
3.2 Overview of Evaluation Assumptions ........................................................................................ 28
3.2.1 Transfer Limit Analysis ............................................................................................................................... 29 3.2.2 Resource Adequacy Analysis ...................................................................................................................... 31 3.2.3 Production Cost Analysis ............................................................................................................................ 32
3.3 Evaluation Metrics ..................................................................................................................... 38
3.3.1 Capital Cost Estimate ................................................................................................................................. 38 3.3.2 Cost Per MW Ratio ..................................................................................................................................... 38 3.3.3 Expandability .............................................................................................................................................. 43

Western New York Public Policy Transmission Planning Report | 3
3.3.4 Operability ................................................................................................................................................. 47 3.3.5 Performance ............................................................................................................................................... 55 3.3.6 Production Cost .......................................................................................................................................... 55 3.3.7 Property Rights and Routing ...................................................................................................................... 63 3.3.8 Potential Construction Delay...................................................................................................................... 66
3.4 Consequences for Other Regions ............................................................................................. 67
3.5 Impact on Wholesale Electricity Markets ................................................................................. 68
3.6 Non-BPTF Upgrades Addressed by National Grid ..................................................................... 68
3.7 Evaluation of Interaction with Local Transmission Owner Plans ............................................ 69
4. CONCLUSIONS AND RECOMMENDATIONS .................................................................................................. 70
4.1 Summary of Project Evaluations ............................................................................................... 70
4.1.1 Summary of Evaluation Results .................................................................................................................. 70 4.1.2 Tiered Ranking ........................................................................................................................................... 75
4.2 Ranking ....................................................................................................................................... 76
4.3 Selection Recommendation ...................................................................................................... 78
4.4 Next Steps .................................................................................................................................. 78
APPENDICES......................................................................................................................................................... 79
Appendix A – Public Policy Transmission Planning Process Glossary ........................................... 79
Appendix B – Western New York Public Policy Transmission Planning Need Viability and
Sufficiency Assessment ............................................................................................................................ 79
Appendix C – Phase 2 Selection Assumptions ............................................................................... 79
Appendix D – SECO Report .............................................................................................................. 79
Appendix E – Market Monitoring Unit Report ................................................................................. 79
Appendix F – Additional Analysis Results ........................................................................................ 79

Western New York Public Policy Transmission Planning Report | 4
Executive Summary This report presents the results of the Public Policy Transmission Planning Process
administered by the New York Independent System Operator (NYISO) for the Western New York
Public Policy Transmission Need. It represents the culmination of a multi-year joint effort by the
NYISO, the New York State Public Service Commission (PSC), Developers, and stakeholders to
address transmission needs in Western New York that are driven by Public Policy Requirements for
greater utilization of renewable energy from the Niagara hydroelectric facility and through imports
from Ontario. The NYISO conducted extensive evaluations of the proposed transmission projects
and recommends the ranking and selection of the more efficient or cost effective transmission
solution to the Western New York need as described herein.
The NYISO commenced the Public Policy Transmission Planning Process for the first time by
soliciting proposed transmission needs driven by Public Policy Requirements from NYISO’s
stakeholders and other interested parties. The NYISO filed the proposed transmission needs for
consideration by the PSC, which, upon considering various comments submitted, issued an order
that found “significant environmental, economic, and reliability benefits could be achieved by
relieving the transmission congestion identified in Western New York.” The PSC, therefore, adopted
the Western New York Public Policy Transmission Need (“Western NY Need”).
The NYISO performed baseline analysis to identify the specific transmission constraints in
Western New York that restrict the delivery of power from Niagara and Ontario to the rest of New
York State. Following review of the baseline analysis and discussions with stakeholders and
prospective Developers, the NYISO issued a solicitation for solutions to address the Western NY
Need. The NYISO conducted the Viability and Sufficiency Assessment for 12 projects to address the
need, and identified ten viable and sufficient projects. The NYISO also recommended certain non-
bulk transmission upgrades to fulfill the objectives of the Western NY Need. Following the PSC’s
review of the Viability and Sufficiency Assessment and consideration of public comments, the PSC
issued an order confirming the Western NY Need.
Upon issuance of the order confirming the need for transmission, the NYISO immediately
commenced a detailed evaluation of each viable and sufficient transmission proposal with the
assistance of its independent consultant, Substation Engineering Company (SECO). The
transmission projects include four proposals from North America Transmission, two from National
Grid, one from New York Power Authority (NYPA) and New York State Electric & Gas (NYSEG), two
from NextEra Energy Transmission New York, and one from Exelon Transmission Company. No two
projects are identical; the proposals offer a variety of options at the 345 kV, 230 kV, and 115 kV

Western New York Public Policy Transmission Planning Report | 5
levels as well as a variety of grid interconnection approaches. Details of the proposed projects are
provided in Section 3.
In determining which of the eligible proposed transmission projects is the more efficient or
cost effective solution to satisfy the Western NY Need, the NYISO considered the metrics set forth in
the tariff and ranked each proposed project based on the its performance under these metrics.
These metrics include capital costs, cost per MW, expandability, operability, performance, property
rights and routing, development schedule, and other metrics such as production cost savings,
locational based marginal price (LBMP) savings, emissions savings, and congestion.
A core concept of the NYISO’s evaluation and selection process is the use of an independent
consultant to review each proposed project and apply a consistent methodology across all projects
for establishing cost estimates, schedule estimates, and routing assessments. Utilizing detailed
project information provided by the Developers, SECO developed independent capital cost and
schedule estimates considering material and labor cost by equipment, engineering and design
work, permitting, site acquisition, procurement and construction work, and commissioning needed
for the proposed project. SECO’s cost estimates for the proposed transmission projects range from
$157 million to $487 million, with schedules ranging from 40 months to 71 months following the
NYISO’s selection.
A key objective of the Western NY Need is to fully utilize Niagara hydroelectric generation
while simultaneously maximizing imports from Ontario. Each project’s efficiency in achieving this
objective is measured in a number of ways utilizing power flow and production cost simulations
under a variety of system dispatches and conditions. Power flow results indicate that average
transfer capabilities across the Niagara ties for the proposed projects range from 216 MW to 1,796
MW. To determine the cost effectiveness of each project, the NYISO compared these electrical
results to SECO’s independent capital cost estimate for each project. The cost-per-MW ratios for the
projects range from 0.11 $M/MW to 0.82 $M/MW, with an average of 0.23 $M/MW. Further, the
increased transfer capability and relief of New York transmission constraints would result in
production cost savings of as much as $274 million over the first 20 years of a project being in-
service. The achieved savings may vary for each transmission project depending on system
conditions in the future. The ratios of production cost savings to capital costs range from 0 to 1.5,
with an average of 0.9.
The NYISO also considers qualitative metrics such as expandability, operability, and
performance. Significant amounts of existing and potential renewable resources in Ontario and
Western New York can be made available to the rest of New York State depending on a project’s

Western New York Public Policy Transmission Planning Report | 6
proposed design and ability to expand and adapt to new or modified system interconnections in the
future. The NYISO also considered how the proposed projects affect the flexibility in operating the
system, such as dispatch of generation, access to operating reserves, access to ancillary services,
and the ability to remove transmission for maintenance. Certain projects afford greater
expandability opportunities through substation design and transmission line configurations, while
other projects offer greater operability of the system through the use of controllable devices or
better integration of facilities with the overall system.
Based on consideration of all the evaluation metrics for efficiency or cost effectiveness, the
NYISO first distinguished the proposed projects into two tiers based on their performance relative
to their cost. Three metrics that significantly impacted this tiered ranking are: (1) the total capital
cost, (2) the production cost savings relative to the total capital cost, and (3) the cost per MW ratio
for the increased Ontario to New York thermal transfer limits over the Niagara Ties. The four Tier 1
projects offer increased efficiencies in the overall performance and utilization of the transmission
system resulting in greater access to renewable energy, while also offering cost effective designs
that would provide economic advantages to the New York electric grid. The Tier 1 projects are:
T006: North America Transmission Proposal 1
T013: NYPA/NYSEG Western NY Energy Link
T014: NextEra Energy Transmission New York Empire State Line Proposal 1
T015: NextEra Energy Transmission New York Empire State Line Proposal 2
Based on consideration of all the evaluation metrics for efficiency or cost effectiveness, together
with input from stakeholders, the NYISO staff recommends that the NYISO Board selects NextEra
Energy Transmission New York Empire State Line Proposal 1 (T014) as the more efficient or cost
effective transmission solution to satisfy the Western New York Public Policy Transmission Need.
Figure E-1 is a map showing the location of the components proposed by T014.
T014 proposed a new Dysinger 345 kV substation, a new East Stolle 345 kV switchyard, and a
345 kV line connecting Dysinger and East Stolle substations. The Dysinger substation will connect a
total of seven 345 kV lines: two existing lines from Niagara, two existing lines to Rochester, two
existing lines to Somerset, and the new line to East Stolle Road. The new East Stolle 345 switchyard
will be built next to the existing 345 kV Stolle Road substation. In addition, a 700 MVA 345 kV phase
angle regulator (PAR) is proposed at the Dysinger end of the Dysinger - East Stolle Road 345 kV
line.

Western New York Public Policy Transmission Planning Report | 7
Figure E-1: Map of the NextEra Energy Transmission New York Empire State Line
Compared with other Tier 1 projects, T014 more efficiently utilizes both the existing and
proposed transmission facilities. The proposed Dysinger substation would become the new 345 kV
hub in Western New York where seven 345 kV lines are connected, and electrically reduce the
distance for the existing Niagara to Rochester 345 kV transmission corridor. The proposed PAR at
the Dysinger substation provides additional operational flexibility by providing a new level of
controllability to power flows on the 345 kV network. Furthermore, the estimated overnight capital
cost for T014 is among the lowest of the Tier 1 projects. Combining the physical design and the
overnight capital cost, T014 demonstrates relatively lower cost per MW ratio among the projects
and the highest production cost saving over the cost ratio across all scenarios. Even when the
proposed PAR is bypassed, T014 still demonstrates significant benefits. Based on SECO’s evaluation,
there are no critical risks identified regarding siting, equipment procurement, real estate
acquisition, construction, and scheduling. Therefore, the NYISO staff determined that T014 is both
the more efficient and cost effective transmission solution to satisfy the Western NY Public Policy
Transmission Need.
Based on the project schedule evaluated by SECO, the required in-service date for the selected
project is June 2022. Following the approval of this report by the Board of Directors, the NYISO will
tender a Development Agreement to the Developer of the selected transmission project.

Western New York Public Policy Transmission Planning Report | 8
1. The Public Policy Transmission Planning Process The Public Policy Transmission Planning Process (PPTPP) is the newest component of the
NYISO’s Comprehensive System Planning Process and considers transmission needs driven by
Public Policy Requirements in the local and regional transmission planning processes. The Public
Policy Transmission Planning Process was developed in consultation with NYISO stakeholders and
the New York State Public Service Commission (PSC) and approved by the Federal Energy
Regulatory Commission (FERC) under Order No. 1000.1 At its core, the Public Policy Transmission
Planning Process provides for the NYISO’s evaluation and selection of transmission solutions to
satisfy a transmission need driven by Public Policy Requirements. The process was developed to
encourage both incumbent and non-incumbent transmission Developers to propose projects in
response to an identified need.
The NYISO is responsible for administering the Public Policy Transmission Planning Process in
accordance with Attachment Y to its Open Access Transmission Tariff (OATT). Consistent with its
obligations to regulate and oversee the electric industry under New York State law, the PSC has the
primary responsibility for the identification of transmission needs driven by Public Policy
Requirements.
A Public Policy Transmission Planning Process cycle typically commences every two years
following the posting of the draft Reliability Needs Assessment study results, and consists of four
core steps: (1) the identification of a Public Policy Transmission Need, (2) Developers proposing
solutions to satisfy the identified Public Policy Transmission Need, (3) an evaluation of the viability
and sufficiency of the proposed Public Policy Transmission Projects and Other Public Policy
Projects, and (4) a comparative evaluation of the viable and sufficient projects for the NYISO Board
of Directors to select the more efficient or cost effective Public Policy Transmission Project that
satisfies the Public Policy Transmission Need, if the PSC confirms that there is a need for
transmission. The selected Public Policy Transmission Project is eligible for cost allocation and cost
recovery under the NYISO’s tariffs.
1.1 Identification of a Public Policy Transmission Need
For each cycle of the Public Policy Transmission Planning Process, the NYISO begins the
process by inviting stakeholders and interested parties to submit proposed transmission needs
driven by Public Policy Requirements. A Public Policy Requirement includes an existing federal,
1 See New York Indep. Sys. Operator, Inc., Order on Compliance Filing, 143 FERC ¶ 61,059 (April 18, 2013); New York Indep. Sys. Operator, Inc., Order on Compliance Filing, 148 FERC ¶ 61,044 (July 17, 2014); New York Indep. Sys. Operator, Inc., Order on Compliance Filing, 151 FERC ¶ 61,040 (April 16, 2015); New York Indep. Sys. Operator, Inc., Order on Compliance Filing, 155 FERC ¶ 61,037 (April 18, 2016).

Western New York Public Policy Transmission Planning Report | 9
state, or local law or regulation, or a new legal requirement that the PSC establishes after public
notice and comment under New York State law.
Following the submission of proposals, the NYISO posts all submittals on its website and
provides those submissions, including any proposal from the NYISO, to the PSC. The NYISO
separately provides any submission that proposes the identification of transmission needs driven
by Public Policy Requirements within the Long Island Transmission District to the Long Island
Power Authority (LIPA). The PSC and LIPA, as applicable, consider the proposals in order to identify
any Public Policy Transmission Needs, and the PSC determines whether the NYISO should solicit
solutions to any of the identified needs.
1.2 Solicitation for Proposed Solutions
After the PSC determines that a Public Policy Transmission Need or a transmission need solely
within the Long Island Transmission District driven by a Public Policy Requirement should be
evaluated and considered by the NYISO for selection and regional cost allocation, the NYISO solicits
proposed solutions that Developers believe will satisfy the identified need. Developers are afforded
60 days to propose their solutions and are required to provide specific Developer qualification and
project information as detailed in Attachment Y to the OATT, the Public Policy Transmission
Planning Process Manual, and the NYISO’s solicitation.
Under the Public Policy Transmission Planning Process, proposed solutions fall into two
categories—(i) Public Policy Transmission Projects and (ii) Other Public Policy Projects. A Public
Policy Transmission Project is a transmission project or a portfolio of transmission projects
proposed by a qualified Developer to satisfy an identified Public Policy Transmission Need and for
which the Developer seeks to be selected by the NYISO for purposes of allocating and recovering
the project’s costs under the NYISO OATT. An Other Public Policy Project is a non-transmission
project (i.e., generation or demand-side projects) or a portfolio of transmission and non-
transmission projects proposed by a Developer to satisfy an identified Public Policy Transmission
Need. The NYISO will determine whether an Other Public Policy Project is viable and sufficient to
meet a Public Policy Transmission Need. However, an Other Public Policy Project is not entitled to
cost allocation and recovery under the NYISO OATT.
1.3 Evaluation for Viability and Sufficiency
In the first phase of analyses, the NYISO evaluates each proposed solution to the Public Policy
Transmission Need to determine whether it is viable and sufficient. The NYISO assesses all
resources types on a comparable basis within the same general timeframe. Under the viability
evaluation, the NYISO considers a Developer’s qualification and the project information data to

Western New York Public Policy Transmission Planning Report | 10
determine whether the project is technically practicable, whether there is the ability to obtain the
necessary rights-of-way within the required timeframe, and whether the project could be
completed within the required timeframe. Under the sufficiency evaluation, the NYISO evaluates the
degree to which each proposed solution independently satisfied the Public Policy Transmission
Need, including any specific criteria established by the PSC in its order identifying the need.
Following the viability and sufficiency evaluations, the NYISO presents the assessment to
stakeholders, interested parties, and the PSC for review and comments.
Following the NYISO’s presentation of the Viability and Sufficiency Assessment, the Public
Policy Transmission Planning Process requires the PSC to review the assessment and issue an
order. If the PSC concludes that there is no longer a transmission need driven by a Public Policy
Requirement, the NYISO will not perform an evaluation, or make a selection of, a more efficient or
cost-effective transmission solution for that planning cycle. If the PSC modifies the transmission
need driven by a Public Policy Requirement, the NYISO will restart its Public Policy Transmission
Planning Process as an out-of-cycle process. This out-of-cycle process will begin with the NYISO’s
solicitation of Public Policy Transmission Projects to address the modified Public Policy
Transmission Need. The NYISO will evaluate the viability and sufficiency of the proposed Public
Policy Transmission Projects. The NYISO will then proceed to evaluate the viable and sufficient
Public Policy Transmission Projects for purposes of selecting the more efficient or cost-effective
transmission solution to the modified Public Policy Transmission Need.
1.4 Evaluation for Selection as the More Efficient or Cost Effective Solution
Once the PSC determines that there remains a transmission need driven by a Public Policy
Requirement, the NYISO proceeds with the evaluation of the proposed Public Policy Transmission
Projects. The NYISO only considers those Public Policy Transmission Projects that it determined to
be viable and sufficient and that have provided the required notifications to proceed with the
evaluation for selection as the more efficient or cost effective solution to the identified need.
The NYISO’s selection is based on the totality of its evaluation of the eligible projects using the
pre-defined metrics set forth in Attachment Y of the OATT and others set by the PSC and/or in
consultation with stakeholders. The NYISO uses the project information provided by the Developer
at the start of the process, in addition to any other information available to the NYISO. In
performing its evaluation, the NYISO, or an independent consultant, reviews the reasonableness
and comprehensiveness of the information submitted by the Developer for each project that is
eligible to be evaluated for selection as the more efficient or cost effective solution to be used
against the specific evaluation metrics (see Section 4.3, below).

Western New York Public Policy Transmission Planning Report | 11
In determining which of the eligible proposed regulated Public Policy Transmission Projects is
the more efficient or cost effective solution to satisfy the Public Policy Transmission Need, the
NYISO considers each project’s total performance under all of the selection metrics. The NYISO may
develop scenarios that modify certain assumptions to evaluate the proposed Public Policy
Transmission Projects under differing system conditions. The NYISO considers and ranks each
proposed solution based on its performance under the metrics. Based upon its evaluation of each
viable and sufficient Public Policy Transmission Project, the NYISO staff recommends in the draft
Public Policy Transmission Planning Report what project is the more efficient or cost effective
solution to satisfy the Public Policy Transmission Need, if any. After the draft report is reviewed
through the collaborative governance process and by the Market Monitoring Unit, the NYISO Board
of Directors may approve the report or propose modifications.
1.5 Identifying a Cost Allocation Methodology for the Public Policy Transmission Need
Under the Public Policy Transmission Planning Process and consistent with FERC’s directives
under Order No. 1000, a regulated transmission project that is selected as the more efficient or cost
effective solution to satisfy an identified Public Policy Transmission Need will be eligible to receive
cost allocation and recovery under the OATT. The Public Policy Transmission Planning Process
contains an approved load ratio share cost allocation methodology, and a multi-step process for
identifying any alternative methodology. This process was designed to provide flexibility in
prescribing a methodology that would allocate the costs of a selected Public Policy Transmission
Project consistent with the Public Policy Requirement driving the identified transmission need and
roughly commensurate with the derived benefits. In allocating the costs of the selected Public
Policy Transmission Project, the NYISO will use the default methodology under Attachment Y to the
OATT or an alternative methodology proposed in this process and accepted by FERC. The cost
allocation methodology eventually accepted by the Commission has no bearing on the NYISO’s
selection of the more efficient or cost effective transmission project to meet the Public Policy
Transmission Need.

Western New York Public Policy Transmission Planning Report | 12
2. Western New York Public Policy Transmission Need
2.1 Identification of Western New York Public Policy Transmission Need
The NYISO issued a letter on August 1, 2014, inviting stakeholders and interested parties to
submit proposed transmission needs driven by Public Policy Requirements to the NYISO on or
before September 30, 2014.2 On October 3, 2014, the NYISO filed the proposed needs with the PSC.3
These proposed needs had two common and recurring themes: (i) increase transfer capability
between upstate and downstate, and (ii) mitigate transmission constraints in Western New York to
facilitate full output from the Niagara hydroelectric power plant and imports from Ontario. The PSC
issued notices soliciting public comments on the proposed needs on November 12, 2014 and April
3, 2015, and numerous parties submitted comments.4
On July 20, 2015, the PSC issued an order identifying the relief of congestion in Western New
York, including access to increased output from the Niagara hydroelectric facility and additional
imports of renewable energy from Ontario, as a Public Policy Transmission Need (“Western NY
Need”).5 The PSC noted that congestion in Western New York was adversely impacting the
performance of the bulk power transmission system, by limiting the output of the state’s largest
renewable resource, the Niagara hydroelectric power plant. It further determined that relieving
congestion in Western New York would increase access to additional imports of renewable energy
from Ontario. The PSC noted that “[i]ncreased dispatch of these renewable and economic resources
could produce significant benefits to the State in terms of reduced air emission and energy costs.”6
The PSC determined that significant environmental, economic, and reliability benefits could be
achieved by relieving the transmission congestion identified in Western New York, including access
to increased output from the New York Power Authority (NYPA) Niagara hydroelectric facility,
additional imports of renewable energy from Ontario, and system reliability benefits, specifically,
increased operational flexibility, efficiency, and avoiding the need to maintain generation that
would otherwise retire.
Therefore, the PSC directed the NYISO to consider solutions for increasing Western New York
transmission capability sufficient to ensure the full output from NYPA’s Niagara hydroelectric
2 The NYISO’s letter can be obtained at the following link: http://www.nyiso.com/public/markets_operations/services/planning/planning_studies/index.jsp. 3 The proposed needs and the NYISO’s submission of the needs can be obtained at the following link: http://documents.dps.ny.gov/public/MatterManagement/CaseMaster.aspx?MatterCaseNo=14-E-0454&submit=Search. 4 The notices seeking comments were issued under PSC Case No. 13-E-0488 and PSC Case No. 14-E-0454, and the comments can be obtained from the Department of Public Service website: http://www.dps.ny.gov/. 5 PSC Case No. 14-E-0454, In the Matter of New York Independent System Operator, Inc.’s Proposed Public Policy Transmission Needs for Consideration, Order Addressing Public Policy Requirements for Transmission Planning Purposes (July 20, 2015) (“July 2015 Order”). 6 July 2015 Order, at p 27.

Western New York Public Policy Transmission Planning Report | 13
generating facility (i.e., 2,700 MW including Lewiston Pumped Storage), as well as certain levels of
simultaneous imports from Ontario across the Niagara tie lines (i.e., maximize Ontario imports
under normal operating conditions and at least 1,000 MW under emergency operating conditions).
In this Order, the PSC identified several metrics for consideration in the evaluation of the
proposed solutions to satisfy the Western NY Need, such as changes in production costs, location-
based marginal prices, emissions, Installed Capacity prices, Transmission Congestion Contract
revenues, transmission congestion, impacts on transfer limits, and resource deliverability.7
2.2 Development of Solutions
Throughout the months of August, September, and October 2015, the NYISO performed
analyses to establish a baseline of constraints on the Western New York transmission system
against which proposed projects would be measured. The NYISO presented these analytical
baselines to stakeholders and obtained their feedback at the Electric System Planning Working
Group (ESPWG) and Transmission Planning Advisory Subcommittee (TPAS). Power flow cases
were provided by the NYISO to all qualified Developers to use in developing their projects.
These results confirmed that there is insufficient transmission capability out of the Niagara
area. Figure 2-1, below, depicts the transmission system in Western New York. Table 2-1 and Table
2-2 list the overloaded transmission lines that were identified in the baseline and the maximum
loading observed for the various categories of conditions evaluated, including emergency transfer
criteria and normal transfer criteria. Table 2-1 reports the line loadings observed when the Packard
230 kV #77 and #78 series reactors are bypassed and Table 2-2 reports the line loadings observed
when the series reactors are in-service. Appendix C provides greater detail regarding the nature of
the overloads.8
7 As described in Section 3.3, the NYISO considered the PSC’s additional metrics regarding changes in production costs, location-based marginal prices, emissions, energy deliverability, Transmission Congestion Contract revenues and transmission congestion in the context of the GE MAPS analysis, which provided results for each of these metrics. As set forth in Section 3.3, capacity savings was not a distinguishing factor in selection for the Western New York Need. The NYISO considered impacts on transfer limits across the system throughout its analyses examining and comparing the relative ability and benefits of each viable and sufficient project to meet the need. 8 The full results with the Packard series reactors bypassed are posted on the NYISO’s website at: http://www.nyiso.com/public/webdocs/markets_operations/services/planning/Planning_Studies/Public_Policy_Documents/Western_NY/Western_NY_PPTN_Baseline_Results_2015-10-27_SR-bypassed.xls. The full results with the Packard series reactors in service are posted at: http://www.nyiso.com/public/webdocs/markets_operations/services/planning/Planning_Studies/Public_Policy_Documents/ Western_NY/Western_NY_PPTN_Baseline_Results_2015-10-27_SR-in.xls.

Western New York Public Policy Transmission Planning Report | 14
Figure 2 1: Western New York Transmission Map
Table 2-1: Summary of Baseline Results with Packard Series Reactors Bypassed
N-1 N-1-1 N-1 N-1-1 N-1 N-1-1 N-1 N-1-1 130762 GARDV230 230 130767 STOLE230 230 1 108% 112% 122% 103% 108% 123% 123% 130795 DEPEW115 115 130799 ERIE 115 115 1 101% 101% 101% 130847 ROLL 115 115 130857 STOLE115 115 1 103% 103% 103% 135303 SAWYER77 230 135414 HUNTLEY2 230 1 101% 103% 103% 135303 SAWYER77 230 135415 PACKARD2 230 1 117% 110% 108% 114% 111% 104% 102% 107% 117% 135304 SAWYER78 230 135414 HUNTLEY2 230 2 100% 104% 104% 135304 SAWYER78 230 135415 PACKARD2 230 2 110% 110% 108% 116% 105% 104% 102% 108% 116% 135415 PACKARD2 230 147842 NIAGAR2W 230 1 108% 108% 108% 135415 PACKARD2 230 147842 NIAGAR2W 230 2 108% 103% 108% 108% 135449 GR.I-182 115 135459 NI.B-182 115 1 101% 101% 135450 GRDNVL1 115 135453 LONG-180 115 1 101% 108% 108% 135458 NI.B-181 115 135460 PACK(N)E 115 1 114% 119% 119% 135460 PACK(N)E 115 135538 LONG-182 115 1 104% 104% 135460 PACK(N)E 115 147850 NIAG115E 115 2 111% 111% 135461 PACK(S)W 115 147851 NIAG115W 115 3 101% 121% 121% 135497 ZRMN-133 115 135562 S214-133 115 1 100% 100% 147850 NIAG115E 115 147842 NIAGAR2W 230 1 100% 100%
Monitored Facility Dispatch 1 (230 kV) Dispatch 2 (115 kV)
Max ETC NTC ETC NTC

Western New York Public Policy Transmission Planning Report | 15
Table 2-2: Summary of Baseline Results with Packard Series Rectors In-Service
On November 1, 2015, the NYISO issued a 60-day solicitation for proposed solutions of all
types (transmission, generation, and demand side) to the Western NY Need. The list of the
proposed projects submitted to the NYISO and considered in the Viability and Sufficiency
assessment is included in Table 2-3, below.
N-1 N-1-1 N-1 N-1-1 N-1 N-1-1 N-1 N-1-1 130762 GARDV230 230 130767 STOLE230 230 1 111% 112% 121% 107% 107% 118% 121% 130795 DEPEW115 115 130799 ERIE 115 115 1 122% 118% 122% 118% 122% 130815 HINMN115 115 131611 HARIS115 115 1 100% 100% 130847 ROLL 115 115 130857 STOLE115 115 1 103% 103% 103% 135303 SAWYER77 230 135414 HUNTLEY2 230 1 100% 100% 135327 AM.S-54 115 135450 GRDNVL1 115 1 107% 107% 107% 108% 108% 135415 PACKARD2 230 147842 NIAGAR2W 230 1 100% 100% 135415 PACKARD2 230 147842 NIAGAR2W 230 2 101% 101% 135449 GR.I-182 115 135459 NI.B-182 115 1 101% 101% 135451 HUNTLEY1 115 135498 ZRMN-130 115 1 100% 102% 100% 102% 135451 HUNTLEY1 115 135562 S214-133 115 1 100% 100% 135452 LOCKPORT 115 135876 TELRDTP1 115 1 100% 100% 135454 MLPN-129 115 135461 PACK(S)W 115 1 100% 100% 135455 MLPN-130 115 135461 PACK(S)W 115 1 101% 101% 101% 135458 NI.B-181 115 135460 PACK(N)E 115 1 104% 112% 112% 122% 102% 122% 135460 PACK(N)E 115 135538 LONG-182 115 1 106% 106% 135460 PACK(N)E 115 147850 NIAG115E 115 2 112% 112% 135461 PACK(S)W 115 147851 NIAG115W 115 1 117% 109% 137% 135% 137% 135461 PACK(S)W 115 147851 NIAG115W 115 2 117% 109% 137% 135% 137% 135461 PACK(S)W 115 147851 NIAG115W 115 3 107% 103% 102% 127% 123% 125% 127% 135467 SHAW-103 115 135470 SWAN-103 115 1 101% 101% 135497 ZRMN-133 115 135562 S214-133 115 1 100% 101% 100% 101% 147850 NIAG115E 115 147842 NIAGAR2W 230 1 100% 123% 100% 123%
Monitored Facility Dispatch 1 (230 kV) Dispatch 2 (115 kV)
Max ETC NTC ETC NTC

Western New York Public Policy Transmission Planning Report | 16
Table 2-3: Proposed Projects
Developer Project Name Project ID Category Type Location
(County/State)
NRG Dunkirk Power Dunkirk Gas Addition OPP02 OPPP ST Chautauqua, NY
North America Transmission Proposal 1 T006 PPTP AC Niagara-Erie, NY
North America Transmission Proposal 2 T007 PPTP AC Niagara-Erie, NY, Wyoming, NY
North America Transmission Proposal 3 T008 PPTP AC Niagara-Erie, NY, Wyoming, NY
North America Transmission Proposal 4 T009 PPTP AC Niagara-Erie, NY, Wyoming, NY
ITC New York Development 15NYPP1-1 Western NY AC T010 PPTP AC Niagara-Erie, NY
National Grid Moderate Power Transfer Solution
T011 PPTP AC Niagara-Erie, NY
National Grid High Power Transfer Solution T012 PPTP AC Niagara-Erie, NY
NYPA/NYSEG Western NY Energy Link T013 PPTP AC Niagara-Erie, NY, Wyoming, NY
NextEra Energy Transmission New York
Empire State Line Proposal 1 T014 PPTP AC Niagara-Erie, NY
NextEra Energy Transmission New York Empire State Line Proposal 2 T015 PPTP AC Niagara-Erie, NY
Exelon Transmission Company Niagara Area Transmission Expansion T017 PPTP AC Niagara-Erie, NY
PPTP = Public Policy Transmission Project ST = Steam Turbine OPPP = Other Public Policy Project AC = Alternating Current Transmission
2.3 Viability and Sufficiency Assessment
Through the first quarter of 2016, the NYISO assessed the viability and sufficiency of all
proposed projects. It presented a draft Western New York Public Policy Transmission Need
Viability and Sufficiency Assessment to stakeholders at the ESPWG/TPAS in May 2016. After
receiving and addressing comments from stakeholders, the NYISO posted on its website the final
Viability and Sufficiency Assessment report on May 31, 2016 and filed the same at the PSC in Case
No. 14-E-0454 on June 1, 2016.9, 10 This assessment is included in this report as Appendix B.11
9 The NYISO’s filing can be obtained at the following link: http://documents.dps.ny.gov/public/MatterManagement/CaseMaster.aspx?MatterCaseNo=14-E-0454&submit=Search. 10 On July 29, 2016, the NYISO notified stakeholders and interested parties that although it had acted diligently in administering the current process, it would extend the 2014 cycle of the Public Policy Transmission Planning Process beyond two years as permitted by the tariff. See OATT Section 31.4.1; http://www.nyiso.com/public/markets_operations/services/planning/planning_studies/index.jsp. 11 The NYISO’s “Western New York Public Policy Transmission Need Viability and Sufficiency Assessment” can be obtained at the following link: http://www.nyiso.com/public/markets_operations/services/planning/planning_studies/index.jsp.
Western New York Public Policy Transmission Planning Report | 17
The NYISO determined the following projects are viable and sufficient to satisfy the Western
NY Need:
T006: North America Transmission – Proposal #1
T007: North America Transmission – Proposal #2
T008: North America Transmission – Proposal #3
T009: North America Transmission – Proposal #4
T011: National Grid – Moderate Power Transfer Solution
T012: National Grid – High Power Transfer Solution
T013: NYPA/NYSEG – Western NY Energy Link
T014: NextEra Energy Transmission New York – Empire State Line #1
T015: NextEra Energy Transmission New York – Empire State Line #2
T017: Exelon Transmission Company – Niagara Area Transmission Expansion
In assessing the viability and sufficiency of the proposed projects relative to the New York Bulk
Power Transmission Facilities (BPTF), the NYISO identified remaining overloads on non-BPTF
facilities solely to inform the PSC and local transmission owners of local transmission upgrades that
would be advisable in order for the proposed BPTF projects to fulfill the objectives of the Western
NY Need. The overloads on the non-BTPF facilities did not affect the NYISO’s evaluation of the
proposed projects for their viability and sufficiency. Accordingly, the NYISO stated in its Viability
and Sufficiency Assessment that:
To realize the full capability of the viable and sufficient projects and fulfill the
objectives of the Western New York Public Policy Transmission Need, the NYISO
recommends that any remaining non-BPTF issues also be addressed by the more
efficient or cost effective Public Policy Transmission Project that is ultimately
selected. Specifically, to the extent necessary to address remaining non-BPTF
issues for the specific selected project, the NYISO recommends mitigation of the
Niagara – Packard 115 kV #193 and #194 line overloads by reconductoring the lines
or modification of the Niagara substation configuration, and the NYISO recommends
replacement of limiting terminal equipment for line #54 at the Gardenville 115 kV
station.
Accordingly, the NYISO recommended that the PSC determine that the identified non-BPTF
upgrades should be made to relieve existing congestion on those facilities, and thereby maximize
the benefits of the upgrades to Bulk Power Transmission Facilities and fulfill the objectives of the
Western NY Need.

Western New York Public Policy Transmission Planning Report | 18
2.4 Confirmation of Need for Transmission
On October 13, 2016, following consideration of public comments, the PSC issued an order
confirming the Western NY Need. The October 2016 Order stated that “[t]he Commission continues
to identify congestion relief in Western New York as a Public Policy Transmission Need and directs
the NYISO to proceed with its evaluation and selection under the PPTPP of the more efficient or
cost-effective transmission solution,” and determined that the NYISO should evaluate and select a
transmission solution to fulfill that need.12 The PSC determined that, with respect to acquisition of
rights of way, current non-ownership of essential utility rights-of-way should not disqualify
potential Developers from competing in the NYISO’s evaluation and that utilities with rights-of-way
are expected to bargain in good faith to reach an agreement as to property access and
compensation with the Developer of the Public Policy Transmission Project selected by the
NYISO.13
The PSC further stated that “[t]o ensure the NYISO can adequately consider risk mitigation in
its evaluation, the NYISO should incorporate into its remaining process, as practicable, a mechanism
for implementing risk mitigation measure and cost overrun-sharing incentives.” The PPTPP
provides that the NYISO shall “apply any criteria specified by the Public Policy Requirements or
provided by the PSC and perform the analyses requested by the PSC, to the extent compliance with
such criteria and analyses are feasible.” Per its tariff and FERC orders to date, the NYISO considers
the capital cost estimates for any proposed regulated Public Policy Transmission Project, including
the accuracy of the proposed estimates. the tariff states that cost recovery and cost overrun issues
will be submitted to and decided by FERC.
The October 2016 Order also directed National Grid to undertake the necessary upgrades on
the non-bulk transmission facilities, stating “[t]he Commission further determines that the non-
bulk transmission facility projects identified by the NYISO in its Viability and Sufficiency
Assessment should be undertaken to meet the Public Policy Transmission Need.”14 The PSC
determined that National Grid should receive reimbursement for the costs of the non-BPTF
projects, and that the costs of these projects should not be a distinguishing factor in the selection
process.15
12 PSC Case No. 14-E-0454, In the Matter of New York Independent System Operator, Inc.’s Proposed Public Policy Transmission Needs for Consideration, Order Addressing Public Policy Transmission Need for Western New York (October 13, 2016) (“October 2016 Order”), at p 17. 13 October 2016 Order, at pp 16–17. 14 October 2016 Order, at p 17. 15 October 2016 Order, at p 17.

Western New York Public Policy Transmission Planning Report | 19
2.5 Local Transmission Plan Updates and PSC-Directed Upgrades
Certain system updates were completed in Western New York outside the Public Policy
Transmission Planning Process following the Viability and Sufficiency Assessment. NYSEG updated
its Local Transmission System Plan to upgrade the terminals for the Gardenville – Stolle Road 230
kV Line #66, which were placed in service in October 2016. The South Perry 230/115 kV
transformer was considered in the analysis based upon approval of the System Impact Study by the
Operating Committee in May 2017 and its expected entry into service by 2019. The NYISO also
included certain non-BPTF upgrades directed by the PSC Order issued on October 13, 2016. The
PSC directed National Grid to undertake the upgrades necessary on the Gardenville-Depew 115 kV
#54 line, which is expected to be in service in 2019, and the Niagara-Packard 115 kV #193 line and
#194 line, which National Grid will reconductor during the construction period for the selected
transmission project. The NYISO considered these updates and upgrades in the base cases for all of
the projects on an equal basis. Moreover, consistent with the October 2016 Order, the NYISO did
not use these updates and upgrades as a distinguishing factor between competing projects.16
16 The NYISO identified and backed out those elements of the Developer’s projects that were included to address the pre-existing non-BPTF overloads on lines #54, #193 and #194.

Western New York Public Policy Transmission Planning Report | 20
3. Evaluation for Selection of the More Efficient or Cost Effective
Solution Upon issuance of the October 2016 Order confirming the need for transmission, the NYISO
immediately commenced a detailed evaluation of each viable and sufficient transmission proposal
with the assistance of its independent consultant, Substation Engineering Company (SECO). This
section of the report details the NYISO’s analysis, and the results of its evaluation.
3.1 Overview of Proposed Viable and Sufficient Solutions
The NYISO determined that ten transmission solutions are viable and sufficient. A brief
description of each of the ten viable and sufficient projects is provided below.
3.1.1 T006: North America Transmission – Proposal #1
Figure 3-1 is a map showing the location of the components of the North America
Transmission Proposal #1. The map also shows the locations of the components for the other North
American Transmission Proposals (Proposal #2, Proposal #3, and Proposal #4) described in
Section 3.1.2, Section 3.1.3, and Section 3.1.4.
North America Transmission Proposal #1 includes the following components:
New Dysinger 345 kV Switchyard (loops Niagara-Somerset & Niagara-Rochester 345 kV lines)
New Dysinger-Stolle Road 345 kV line #1
New (third) 345/115 kV transformer at Stolle Road
Below are proposed system upgrades by the Developer:
Depew to Erie 115 kV terminal upgrades
Swann Road to Shawnee Station 115 kV line reconductoring
Roll Road 115/34.5 kV transformer replacement
Lockport to Shaw 115 kV terminal upgrades

Western New York Public Policy Transmission Planning Report | 21
Figure 3-1: Map of North America Transmission Proposals
3.1.2 T007: North America Transmission – Proposal #2
North America Transmission Proposal #2 builds on Proposal #1 by adding a new 345 kV line
between Stolle Road and Gardenville and a new 345/230kV transformer at Gardenville.
North America Transmission Proposal #2 includes the following components:
New Dysinger 345 kV Switchyard (loops Niagara-Somerset & Niagara-Rochester 345 kV lines)
New Dysinger-Stolle Road 345 kV line #1
New Stolle Road-Gardenville 345 kV line
New 345/230 kV transformer at Gardenville 230 kV
Below are proposed system upgrades by the Developer:
Depew to Erie 115 kV terminal upgrades
Swann Road to Shawnee Station 115 kV line reconductoring
Roll Road 115/34.5 kV transformer replacement
Lockport to Shaw 115 kV terminal upgrades

Western New York Public Policy Transmission Planning Report | 22
3.1.3 T008: North America Transmission – Proposal #3
North America Transmission Proposal #3 builds on Proposal #2 by adding a second new 345
kV line between Dysinger and Stolle Road.
North America Transmission Proposal #3 includes the following components:
New Dysinger 345 kV Switchyard (loops Niagara-Somerset & Niagara-Rochester 345 kV lines)
New Dysinger-Stolle Road 345 kV line #1
New Stolle Road-Gardenville 345 kV line
New 345/230 kV transformer at Gardenville 230 kV
Second new Dysinger-Stolle Road 345 kV line #2
Below are proposed system upgrades by the Developer:
Depew to Erie 115 kV terminal upgrades
Swann Road to Shawnee Station 115 kV line reconductoring
Roll Road 115/34.5 kV transformer replacement
Lockport to Shaw 115 kV terminal upgrades
3.1.4 T009: North America Transmission – Proposal #4
North America Transmission Proposal #4 builds on Proposal #3 by adding a new Niagara to
Dysinger 345kV line.
North America Transmission Proposal #4 includes the following components:
New Dysinger 345 kV Switchyard (loops Niagara-Somerset & Niagara-Rochester 345 kV lines)
New Dysinger-Stolle Road 345 kV line #1
New Stolle Road-Gardenville 345 kV line
New 345/230 kV transformer at Gardenville 230 kV
Second new Dysinger-Stolle Road 345 kV line #2
New Niagara-Dysinger 345 kV line
Below are proposed system upgrades by the Developer:
Depew to Erie 115 kV terminal upgrades
Swann Road to Shawnee Station 115 kV line reconductoring
Roll Road 115/34.5 kV transformer replacement
Lockport to Shaw 115 kV terminal upgrades

Western New York Public Policy Transmission Planning Report | 23
3.1.5 T011: National Grid – Moderate Power Transfer Solution
Figure 3-2 is a map showing the location of the components of the National Grid Moderate
Power Transfer Solution. National Grid Moderate Power Transfer Solution includes the following
components:
Reconductoring 115 kV lines (~62 miles worth) notably:
• Niagara/Packard-Gardenville 115 kV (180, 181, 182) reconductoring ("Minimal Solution")
• Niagara-Packard (191, 192) reconductoring
• Packard-Huntley (130, 133) partial reconductoring
• Niagara-Lockport (103, 104) partial reconductoring
Tower separation of 61/64 230 kV lines
Replacement of thermally limiting equipment at Packard, Huntley, Lockport, Robinson Road, Erie Street and Niagara stations
Figure 3-2: Map of National Grid Moderate Power Transfer Solution

Western New York Public Policy Transmission Planning Report | 24
3.1.6 T012: National Grid – High Power Transfer Solution
Figure 3-3 is a map showing the location of the components of the National Grid High Power
Transfer Solution. National Grid High Power Transfer Solution includes the following components:
New Niagara-Gardenville 230 kV line
New Park Club Lane 115 kV switching station (connects to Packard, Stolle Rd., Gardenville)
Reconductoring 115 kV lines (~76 miles worth) notably:
• Niagara/Packard-Gardenville 115 kV (180, 181, 182) reconductoring ("Full solution")
• Niagara-Packard (191, 192) reconductoring
• Packard-Huntley (130, 133) partial reconductoring
• Niagara-Lockport (103, 104) partial reconductoring
• Gardenville-Depew (54) reconductoring
Tower separation of 61/64 230 kV lines
Replacement of thermally limiting equipment at Packard, Huntley, Lockport, Robinson Road, Erie Street and Niagara stations
Figure 3-3: Map of National Grid High Power Transfer Solution

Western New York Public Policy Transmission Planning Report | 25
3.1.7 T013: NYPA/NYSEG – Western NY Energy Link
Figure 3-4 is a map showing the location of the components of the NYPA/NYSEG Western NY
Energy Link Solution. NYPA/NYSEG Western NY Energy Link Solution includes the following
components:
New Dysinger 345 kV Switchyard (loops in Niagara-Somerset & Niagara-Rochester 345 kV lines)
New Dysinger-Stolle Road 345 kV line
Reconductoring Stolle Road-Gardenville 230 kV line
Two new 345/230 kV transformers at Stolle Road
Tower separation of 61/64 230 kV lines at Niagara
New 115 kV PAR at South Perry substation (on South Perry – Meyer 115 kV line)
Figure 3-4: Map of NYPA/NYSEG Western NY Energy Link Solution

Western New York Public Policy Transmission Planning Report | 26
3.1.8 T014: NextEra Energy Transmission New York – Empire State Line #1
Figure 3-5 is a map showing the location of the components of the NextEra Energy
Transmission New York Empire State Line #1 Solution. NextEra Energy Transmission New York
Empire State Line #1 Solution includes the following components:
New Dysinger 345 kV Switchyard (loops in Niagara-Somerset & Niagara-Rochester 345 kV lines, and cuts out the 345 kV line loop to Somerset 345 kV )
New East Stolle Switchyard (near Stolle Road substation)
New Dysinger-East Stolle 345 kV line with 700 MVA PAR on Dysinger end and a shunt reactor at East Stolle
Below are proposed system upgrades by the Developer:
Depew to Erie 115 kV terminal upgrades
Swann Road to Shawnee Station 115 kV (~12 miles line reconductoring)
Stolle Road to Roll Road 115 kV terminal upgrades
100 MVAR shunt reactor at Rochester
Figure 3-5: Map of NextEra Energy Transmission New York Empire State Line Solutions

Western New York Public Policy Transmission Planning Report | 27
3.1.9 T015: NextEra Energy Transmission New York – Empire State Line #2
The NextEra Energy Transmission New York Empire State Line #2 is the same project as T014
except that it does not have the PAR. NextEra Energy Transmission New York Empire State Line #2
Solution includes the following components:
New Dysinger 345 kV Switchyard (loops in Niagara-Somerset & Niagara-Rochester 345 kV lines)
New East Stolle Road Switchyard (near Stolle Road substation)
New Dysinger-East Stolle Road 345 kV line and a shunt reactor at East Stolle Road
Below are system upgrades proposed by the Developer:
Depew to Erie 115 kV terminal upgrades
Swann Road to Shawnee Station 115 kV (~12 miles line reconductoring)
Stolle Road to Roll Road 115 kV terminal upgrades
100 MVAR shunt reactor at Rochester
3.1.10 T017: Exelon Transmission Company – Niagara Area Transmission Expansion
Figure 3-6 is a map showing the location of the major components of the Exelon Transmission
Company Niagara Area Transmission Expansion Solution. Exelon Transmission Company Niagara
Area Transmission Expansion Solution includes the following components:
New Niagara-Stolle Road 345 kV line
New Gardenville-Stolle Road 230 kV line
Reconductoring 115 kV lines
• Packard-Huntley (130, 133) (~19.6 miles of line reconductoring)
• Packard-Niagara Falls Blvd (181) (~3.7 miles of line reconductoring)
• Watch Road-Huntley (133) (~9.8 miles of line reconductoring)
Depew to Erie 115 kV terminal upgrades

Western New York Public Policy Transmission Planning Report | 28
Figure 3-6: Map of Exelon Transmission Company Niagara Area Transmission Expansion Solution
3.2 Overview of Evaluation Assumptions
The process for the evaluation of solutions is described in the NYISO Public Policy
Transmission Planning Process Manual, and evaluates the metrics set forth in the NYISO’s tariff and
the criteria prescribed by the PSC to the extent feasible. Notably, the NYISO’s evaluation of Public
Policy Transmission Projects differs from its evaluation of projects in its other planning processes
because it can give varying levels of consideration to the baseline and the chosen scenarios based
upon the nature of the proposed Public Policy Transmission Projects. In other words, certain
projects may perform differently under normal operating conditions (i.e., the baseline) and other
potential operating conditions. Based upon the particulars of the Public Policy Transmission Need,
the more efficient or cost effective solution may be chosen based upon a scenario or a combination
of scenarios and the baseline cases.
Three major types of analysis were conducted in evaluating quantitative metrics: transfer limit
analysis, resource adequacy analysis, and production cost simulation. The study method,
assumptions, and the metrics evaluated by the study method are described in the following
sections. The results of these analyses are described in Section 3.3.

Western New York Public Policy Transmission Planning Report | 29
3.2.1 Transfer Limit Analysis
Transfer limit analysis evaluates the amount of power that can be transferred across an interface while observing applicable reliability criteria. The results of transfer limit analysis were used in the evaluation of metrics such as cost per MW, operability, and expandability.
Based on the nature of the Western NY Need, the NYISO determined that thermal transfer analysis for the Ontario to New York interface is the most applicable transfer analysis to evaluate the Western New York Public Policy Transmission Projects. The NYISO performed thermal transfer analysis for each proposed project to determine the impact of each project on the ability to transfer power from Ontario to New York across the Niagara ties. The NYISO performed the thermal transfer analysis for the interface in accordance with the Normal Transfer Criteria as defined by the New York State Reliability Council (NYSRC) Reliability Rules. The NYISO used the PowerGEM TARA program to perform the thermal transfer analysis. To determine the thermal transfer limits, the NYISO raised the power flow across the interface by uniformly increasing upstream generation and uniformly decreasing downstream generation. The long-term emergency (LTE) ratings of the BPTF were monitored while simulating design contingency events. During transfer analysis, the NYISO also monitored all 100 kV and above facilities that are not BPTF. Whenever the post contingency power flow on the non-BPTF exceeded short-term emergency (STE) ratings, the NYISO determined if the loss of the non-BPTF would cause other facilities to be overloaded. If the affected facility’s loss caused other non-BPTF to exceed their STE ratings or BPTF to exceed their LTE ratings (consistent with the NYSRC Reliability Rules and Exceptions), the NYISO determined a transfer limit that would allow the system to operate without the loss of multiple transmission facilities.
3.2.1.1 Baseline Transfer Analysis
For purposes of evaluating the proposed solutions, the NYISO performed a baseline transfer analysis on a system that was updated from the case that was used in the Western New York Public Policy Transmission Need Viability and Sufficiency Assessment with the updates and upgrades described in Section 2.5. The NYISO made specific updates to the power flow cases as used in the Viability and Sufficiency Assessment for the baseline transfer analysis. The Viability and Sufficiency Assessment used the NYISO 2014 Reliability Planning Process (2014 RPP) base case system representation of 2024 summer peak load conditions. Appendix B describes the detailed assumptions used in the Viability and Sufficiency Assessment.

Western New York Public Policy Transmission Planning Report | 30
Consistent with the Viability and Sufficiency Assessment, the baseline transfer analysis considered two dispatches with Niagara and Lewiston at full output of 2,700 MW:
Dispatch 1
a. Niagara 230 kV units (8-13) at full output total = 1,320 MW
b. Niagara 115 kV units (1-7) dispatch total = 1,140 MW
c. Lewiston Pumped Storage total = 240 MW
Dispatch 2
a. Niagara 230 kV units (8-13) dispatch total = 920 MW
b. Niagara 115 kV units (1-7) at full output total = 1,540 MW
c. Lewiston Pumped Storage total = 240 MW
The baseline transfer analysis considered two dispatches for wind farms on Stolle Road – Hillside 230 kV path: 0% and 100% of nameplate power.
Developers of Public Policy Transmission Project were given the option to elect whether to model the Packard – Huntley 230 kV series reactors in-service or bypassed. The baseline transfer analysis modeled the series reactor according to the desired status (in-service or bypassed) specified by each Developer.
3.2.1.2 Scenario Transfer Analysis
The NYISO performed a transfer analysis scenario based on the latest 2016 Reliability Planning Process17 (2016 RPP) base case system representation of 2026 summer peak load to determine the performance of the Western New York Public Policy Transmission Projects. The 2016 RPP base case included the latest updates based on the 2016 Load and Capacity Data Report including Gardenville-Stolle Road 230 kV line #66 terminal upgrades and National Grid’s LTP for line #54. Generic upgrades were added in the transfer analysis scenario for Niagara-Packard 115kV lines #193 and #194 by assuming large enough ratings. The transfer analysis scenario also considered the same two dispatches for Niagara and Lewiston, and the same two dispatches for wind farms in Zones A, B, and C as described in Section 3.2.1.1. The 2016 RPP base case modeled the Packard – Huntley 230 kV series reactors in-service. Therefore, the transfer analysis scenario modeled the series reactors in service for all the projects.
17 The 2016 Reliability Needs Assessment is posted at: http://www.nyiso.com/public/webdocs/markets_operations /services/planning/Planning_Studies/Reliability_Planning_Studies/Reliability_Assessment_Documents/2016RNA_Final_Oct18_2016.pdf

Western New York Public Policy Transmission Planning Report | 31
3.2.2 Resource Adequacy Analysis
Resource adequacy is the ability of the electric systems to supply the aggregate electricity
demand and energy requirements of the customers at all times, taking into account scheduled and
unscheduled outages of system elements. The NYISO performed a resource adequacy evaluation of
the New York power system for the Western NY Need. The 2016 RPP base cases were used as a
starting point and the NYCA load forecast was extended to year 2045 to cover the study period. The
New York State bulk power system is planned to meet an Loss of Load Expectation (LOLE) that, at
any given point in time, is less than or equal to an involuntary load disconnection that is not more
frequent than once in every 10 years, or 0.1 events per year. If criteria violations are identified,
various amounts and locations of generic compensatory MW are determined. Compensatory MW
amounts are determined by adding generic capacity resources to zones to effectively satisfy the
needs. The compensatory MW amounts and locations are based on a review of binding
transmission constraints and zonal LOLE determinations in an iterative process to determine
various combinations that will meet reliability criteria. Due to the differing nature of supply and
demand-side resources and transmission constraints, the amounts and locations of resources
necessary to match the level of compensatory MW needs identified will vary.
Table 3-1 shows the pre-project baseline LOLE results for each of the study’s years. LOLE
violations were identified starting in 2031. Generic compensatory MW were added in Zone K,
totaling 250 MW, in different years to address the resource adequacy issues as shown in Table 3-1.
These generic compensatory MW were added to the MAPS database to maintain a reliable system.
The NYISO also performed a resource adequacy analysis scenario, where the Western New
York interfaces were relaxed. The results show no impact to the NYCA LOLE; therefore, any
additional transmission in Western New York will not assist in meeting a resource adequacy need.
The ICAP metric calculated in the CARIS process consists of two steps. First, the MW impact of a
project is determined through the change in system LOLE before and after the project. The MW
impact is indicative of reduced installed capacity requirement made possible by the projects.
Second, the ICAP saving is calculated by translating the MW impact to a dollar amount through two
pricing variations. According to the resource adequacy analysis that relaxed the Western New York
interfaces, the MW impact would be near zero for the Western New York Public Policy
Transmission Projects if the same CARIS methodology was used. Therefore, the level of capacity
savings resulting from each project is not a significant distinguishing factor between the proposed
transmission projects.

Western New York Public Policy Transmission Planning Report | 32
Table 3-1: NYCA LOLE and compensatory MW
Year Baseline LOLE Generic GTs added: MW LOLE after adding generic GTs
2017 0.054 0.054
2018 0.050 0.050
2019 0.054 0.054
2020 0.034 0.034
2021 0.045 0.045
2022 0.047 0.047
2023 0.053 0.053
2024 0.056 0.056
2025 0.062 0.062
2026 0.078 0.078
2027 0.085 0.085
2028 0.087 0.087
2029 0.093 0.093
2030 0.097 0.097
2031 0.105 50 0.095
2032 0.111 50 0.092
2033 0.116 0.095
2034 0.121 50 0.093
2035 0.125 0.097
2036 0.127 0.098
2037 0.131 50 0.093
2038 0.133 0.099
2039 0.135 0.097
2040 0.135 0.099
2041 0.136 0.097
2042 0.136 0.100
2043 0.137 50 0.095
2044 0.137 0.094
2045 0.137 0.093
3.2.3 Production Cost Analysis
Production cost analysis evaluated the proposed Public Policy Transmission Projects and their
impact on NYISO wholesale electricity markets. The results of production cost analysis were used
in the evaluation of metrics such as cost per MW, production cost savings, production cost
saving/cost ratio, system CO2 emission reduction, LBMP, load payment, and performance.

Western New York Public Policy Transmission Planning Report | 33
3.2.3.1 Baseline
The Western NY Need production cost analysis baseline case is derived from the 2016 CARIS
Phase 2 database.18 Updates were made to the system while extensions were made for increasing
the range of the study period (2016 – 2045). t the December 7, 2016 and January 24, 2017
ESPWG/TPAS meetings, the NYISO presented the starting database, updates, and extensions for the
baseline production cost analysis.19
For purpose of evaluating the Western New York Public Policy Transmission Projects,
contingency pairs were used to secure the Ontario to New York interface. Imports from Ontario
Independent Electric System Operator (IESO) into NYISO were modeled as dynamic rather than
capped to a fixed interface limit based on historical flow.
Due to the longer study period of the Western NY baseline case, the load, fuel, and emissions
forecasts were extended. While the fuel and emissions forecasts would affect the four-pool system
in the Northeast (IESO, ISO-NE, NYISO, and PJM), the NYISO was able to model load forecast
extensions only for the NYISO. Load forecasts for the external control areas only range from 2016
to 2024 consistent with the CARIS methodology. Therefore, after 2024, the NYISO held external
control area loads fixed to the 2024 schedule for 2025 – 2045.
The baseline production cost analysis modeled the series reactors on Packard to Huntley 230 kV lines according to the desired status (in-service or bypassed) specified by Developers.
3.2.3.2. Scenarios
At the February 9, 2017 ESPWG meeting, the NYISO solicited from stakeholders the potential
scenarios for evaluating the Western New York Public Policy Transmission Projects. Based on
stakeholder feedback, the NYISO developed scenarios by modifying the baseline assumptions to
evaluate the robustness of the proposed Public Policy Transmission Projects according to the
selection metrics and the impact on NYISO wholesale electricity markets. The following sections
describe the scenarios that assist in understanding the overall performance of the projects under
various conditions. Scenario #1 modifies the baseline assumptions while all the other scenarios are
based off Scenario #1.
18 2016 CARIS Phase 2 assumptions and results are posted at: http://www.nyiso.com/public/webdocs/ markets_operations/committees/bic_espwg/meeting_materials/2016-07-05/CARIS%202%20Database.pdf. 19 The meeting materials are posted at: http://www.nyiso.com/public/webdocs/markets_operations/ committees/bic_espwg/meeting_materials/2016-12-7/WNY_PPTN_Ph2_Assumptions.pdf, andhttp://www.nyiso.com/public/webdocs/markets_operations/committees/bic_espwg/meeting_materials/2017-01-24/2_Updates_WNY_PPTN_Ph2_Assumptions.pdf.

Western New York Public Policy Transmission Planning Report | 34
3.2.3.3.1. Scenario #1: 2017 baseline
The baseline load forecast and fuel costs were updated according to the 2017 Load and Capacity Data Report and the latest natural gas forecast. Table 3-2 and Figure 3-7 show the load and fuel forecast data. Similar to the baseline, this scenario modeled the series reactors on Packard to Huntley 230 kV lines according to the desired status (in-service or bypassed) specified by Developers.
Table 3-2: NYCA Load Forecast
NYCA Energy & Peak Forecast
Year Energy (GWh) Peak (MW)2017 160,477 33,6282018 160,588 33,7082019 160,543 33,7732020 160,375 33,8312021 159,864 33,9262022 159,778 34,0152023 159,899 34,1282024 159,963 34,2292025 160,030 34,3462026 160,106 34,4712027 160,295 34,5742028 160,758 34,8622029 161,235 35,0692030 161,749 35,2772031 162,277 35,4842032 162,876 35,7022033 163,562 35,9352034 164,290 36,1722035 165,053 36,4122036 165,791 36,6412037 166,509 36,8592038 167,232 37,0732039 167,968 37,2842040 168,787 37,5092041 169,588 37,7302042 170,371 37,9462043 171,194 38,1742044 172,030 38,4052045 172,922 38,651
2017 Adjusted Baseline

Western New York Public Policy Transmission Planning Report | 35
Figure 3-7: Natural Gas Forecast (Nominal $)
3.2.3.3.2. Scenario #2: Series reactors in-service
The series reactors on Packard to Huntley 230 kV Lines #77 and #78 entered into service in
2016, with the NYISO having operational control over them. The 2016 RPP base case modeled the
Packard – Huntley 230 kV series reactors in-service. Therefore, the transfer analysis scenario
modeled the series reactors in service for all the projects.
3.2.3.3.3. Scenario #3: Historical IESO-MISO flow modeled
Baseline and Scenario #1 modeled the Ontario Independent Electric System Operator (IESO)-
Midcontinent Independent System Operator (MISO) flow as free-flowing subject to interface limits
and hurdle rates. By comparison, Scenario #3 modeled IESO-MISO flow as scheduled according to
2013 historical flows with the remainder of IESO exports flowing into the NYISO. This scenario
tends to result in higher IESO-NYISO flow and a lower IESO-MISO flow. It also modeled the series
reactors on Packard to Huntley 230 kV lines according to the desired status (in-service or
bypassed) specified by Developers.
0.00
2.00
4.00
6.00
8.00
10.00
12.00
2017
2019
2021
2023
2025
2027
2029
2031
2033
2035
2037
2039
2041
2043
2045
$
2017 Adjusted Baseline NG Fuel Forecast
NG_ALCG
NG_CMBA
NG_DAWN
NG_IQZ2
NG_TCM3
NG_TNZ6
NG_TZ6
NG_TZ6NY

Western New York Public Policy Transmission Planning Report | 36
3.2.3.3.4. Scenarios #4 and #5: High fuel and low fuel
The NYISO also developed high and low fuel costs for the 2017 baseline case consistent with
the fuel forecast methodology used in the CARIS process. Energy Information Administration’s
Annual Energy Outlook forecasts of the annual national delivered price were used to generate Low
and High natural gas price forecasts for each region. These scenarios modeled the series reactors on
Packard to Huntley 230 kV lines according to the desired status (in-service or bypassed) specified
by Developers. Figures 3-8 and 3-9 show the high and low natural gas forecast used in these
scenarios.
Figure 3-8: High Natural Gas Forecast (Nominal $)
Figure 3-9: Low Natural Gas Forecast (Nominal $)

Western New York Public Policy Transmission Planning Report | 37
3.2.3.3.6. Scenarios #6 and #7: High load and low load forecast
The NYISO also developed high and low load forecasts for the 2017 baseline case. Table 3-3
shows the load forecasts used in these scenarios. These scenarios modeled the series reactors on
Packard to Huntley 230 kV lines according to the desired status (in-service or bypassed) specified
by Developers.
Table 3-3: High and Low Load Forecast
NYCA Energy & Peak Forecast
Year Energy (GWh) Peak (MW) Energy (GWh) Peak (MW)2017 163,465 34,247 157,489 33,0092018 163,489 34,472 157,687 32,9442019 163,377 34,690 157,709 32,8562020 163,148 34,902 157,602 32,7602021 162,580 35,155 157,148 32,6972022 162,589 35,452 157,232 32,6152023 162,545 35,737 157,253 32,5192024 162,934 35,971 156,992 32,4872025 163,777 36,269 156,283 32,4232026 164,698 36,571 155,514 32,3712027 165,808 36,852 154,782 32,2962028 167,270 37,317 154,247 32,4062029 168,822 37,702 153,648 32,4352030 170,486 38,089 153,013 32,4652031 172,236 38,474 152,319 32,4952032 174,130 38,869 151,623 32,5352033 175,874 39,280 151,249 32,5902034 177,704 39,695 150,877 32,6492035 179,268 40,113 150,837 32,7112036 181,352 40,519 150,231 32,7622037 183,469 40,914 149,549 32,8042038 185,835 41,304 148,630 32,8422039 187,284 41,691 148,651 32,8772040 188,812 42,090 148,762 32,9272041 190,324 42,487 148,852 32,9732042 191,815 42,878 148,926 33,0142043 193,350 43,282 149,038 33,0662044 194,899 43,689 149,161 33,1212045 196,492 44,109 149,351 33,193
High Load Forecast Low Load Forecast
3.2.3.3.7. Scenario #8: National CO2 removed and series reactors in-service
The baseline and Scenario #1 modeled a national CO2 program starting from 2024, consistent
with the 2016 CARIS Phase 2 database. The NYISO also developed Scenario #8 assuming the
national CO2 program is not in place. In this scenario, the series reactors on Packard to Huntley 230
kV lines were modeled in service for all the projects.

Western New York Public Policy Transmission Planning Report | 38
3.3 Evaluation Metrics
3.3.1 Capital Cost Estimate
The NYISO and its independent consultant, SECO, evaluated each Developer’s capital cost
estimates for their proposed Public Policy Transmission Project for accuracy and reasonableness,
and on a comparative basis with other proposed Public Policy Transmission Projects. Each
Developer was required to submit detailed and credible estimates for the capital costs associated
with the engineering, procurement, permitting, and construction of a proposed transmission
solution. SECO reviewed all the information submitted by the Developers and developed
independent cost estimates for each project based on material and labor cost by equipment,
engineering and design work, permitting, site acquisition, procurement and construction work, and
commissioning needed for the proposed Public Policy Transmission Projects. Appendix D details
the analysis performed by SECO. Table 3-4 summarizes SECO’s overnight capital cost estimates for
each project in 2017 dollars. T014 and T015 also proposed alternative rights of way, so cost
estimates for those projects were also developed. Section 3.3.7 discusses the alternative rights of
way in more details.
Table 3-4: Independent Cost Estimate20
Project ID Independent Cost Estimate: 2017 $M T006 157 T007 278 T008 356 T009 487 T011 177 T012 433 T013 232 T014 181 T014_Alt 219 T015 159 T015_Alt 197 T017 299
3.3.2 Cost Per MW Ratio
The cost per MW ratio metric was calculated by dividing the independent cost estimates from
SECO by the MW value of transfer capability.
20 The costs reflect the System Upgrade Facilities (SUF) identified by the System Impact Study (SIS) for each of the respective projects at the time this report was written. For those projects with an ongoing SIS, the NYISO included a contingency SUF cost for each project. Prior to the release of the draft report on June 30, 2017, only T013 had a completed SIS. Since T013’s SIS did not identify any SUF, the NYISO did not include a contingency SUF cost for that project. On September 15, 2017, the Operating Committee approved the SIS reports for T006, T014, and T015, which do not identify any SUF for those projects. As a result, the NYISO updated the cost estimates for T006, T014, T014_Alt, T015, and T015_Alt by removing the contingency SUF cost of 5 $M per project. These cost updates (which are not reflected in Table 3-4) are relatively small in comparison to total project costs and do not affect the relative ranking of the projects or the NYISO’s recommended selection of T014 as the more efficient and cost effective solution to the Western NY Need.

Western New York Public Policy Transmission Planning Report | 39
3.3.2.1 Cost Per MW: Transfer Limits
For the purpose of calculating cost per MW based on transfer limits, the NYISO calculated the
Ontario to New York thermal transfer limits across the Niagara ties as stated in Section 3.2.1. Table
3-5 and 3-6 summarize the baseline and scenario transfer results.
Table 3-5: 2014 RPP IESO to NYISO Transfer across Niagara Ties
Project ID SR on 77/78 Wind@100% Wind@ 0%
Dispatch 1 Dispatch 2 Dispatch 1 Dispatch 2 T006 Bypassed 611(1) 870(1) 130(1) 388(1) T007 Bypassed 946(1) 1041(2)(A) 695(1) 906(1) T008 Bypassed 1122(2)(A) 1053(2)(A) 952(1) 1152(1) T009 Bypassed 1254(3) 1260(3) 1284(1) 1491(1) T011 In 399(4)(B) 928(6) 28(4)(B) 502(6) T012 In 1026(5) 1020(5) 1332(4)(B) 1968(7) T013 In 1224(3) 1235(3) 1350(4)(B) 1716(8) T014 Bypassed 970(5) 951(5) 730(1) 1033(1) T015 Bypassed 561(1) 842(1) 43(1) 321(1) T017 In 1189(5) 1176(5) 1254(4)(B) 1835(6)
Notes: 1. Packard- Sawyer 230 line 2 (78) at 644 MW LTE rating for L/O Huntley - Packard 230 (77) 2. Station 162 - Station 158 115 (924) at 159 MW STE rating for L/O Meyer 230 straight bus and Meyer-South Perry 115 (934) 3. Wethersfield - South Perry 230 (85/87 tapped at South Perry) at 494 MW LTE rating for L/O stuck breaker 302 at New Rochester
345 (Station 255) 4. Niagara West - Packard 230 line 1(61) at 841 MW STE rating for L/O Tower: Niagara - Packard 230 (62) and BP76B - Packard
230 (BP76) 5. Meyer 230/115/4.5 Transformer at 294 MW LTE rating for L/O stuck breaker at Stoney Ridge 230 Substation 6. Packard- Sawyer 230 line 1 (77) at 644 MW LTE rating for L/O Transformer Bank #3 at Packard 230 Substation 7. Beck - Niagara West 230 (PA27) at 460 MW LTE rating for L/O Beck - Niagara 345 (PA301) 8. Stony Creek - Wethersfield 230 (83) at 479 MW LTE rating L/O stuck breaker 302 at New Rochester 345 (Station 255) A. Limit determined from cascading analysis simulations B. NYSRC Reliability Rules Exception rule #13 applied - Post Contingency Flows on Niagara Project Facilities

Western New York Public Policy Transmission Planning Report | 40
Table 3-6: 2016 RPP IESO to NYISO Transfer across Niagara Ties
Project ID SR on 77/78
Wind@100% Wind@ 0%
Dispatch 1 Dispatch 2 Dispatch 1 Dispatch 2 T006 In 1551(1) 1594(1) 1049(2)(B) 1565(5)
T007 In 1620(1) 1661(1) 1527(2)(B) 2007(7)
T008 In 1665(1) 1703(1) 1840(2)(B) 1977(7)
T009 In 1625(1) 1665(1) 1794(6) 1929(7)
T011 In 339(2)(B) 862(5) -405(2) 69(5)
T012 In 1592(3) 1585(3) 924(2)(B) 1623(8)
T013 In 1510(2)(B) 1619(1) 1120(2)(B) 1679(5)
T014 In 1616(4) 1658(3) 1319(2)(B) 1824(5)
T015 In 1523(4) 1565(4) 991(2)(B) 1534(5)
T017 In 1786(3) 1774(3) 993(2)(B) 1592(5)
Notes: 1. Dysinger - New Rochester 345 (NR2) line 1 at 1501 LTE rating for L/O Somerset - New Rochester 345 (SRI-39) 2. Niagara West - Packard 230 line 1(61) at 841 MW STE rating for L/O Tower: Niagara - Packard 230 (62) and BP76B - Packard 230
(BP76) 3. Meyer 230/115/4.5 Transformer at 294 MW LTE rating for L/O stuck breaker at Stoney Ridge 230 Substation 4. Dysinger - New Rochester 345 (NR2) line 2 at 1501 LTE rating for L/O Dysinger - New Rochester 345 line 1 5. Packard- Sawyer 230 line 1 (77) at 644 MW LTE rating for L/O stuck breaker R3230 at Packard 230 Substation 6. Gardenville 345/230 kV Transformer at 717 MW LTE rating for L/O Tower: Packard - Huntley 230 (77&78) 7. Beck - Niagara 345 line 1 (PA302) at 1132 MW LTE rating for L/O stuck breaker 3008 at Niagara 345 Substation 8. Huntley - Sawyer 230 line 1 (79) at 654 MW LTE rating for L/O stuck breaker R873 at Gardenville 230 Substation B. NYSRC Reliability Rules Exception rule #13 applied - Post Contingency Flows on Niagara Project Facilities
Table 3-7 displays the cost per MW ($M/MW) ratio based on transfer limits. The average limit
(MW) is the average of the Ontario to New York transfer limits that were calculated for each of the
four different dispatch scenarios.

Western New York Public Policy Transmission Planning Report | 41
Table 3-7: Cost Per MW Ratio
3.3.2.2 Cost Per MW Ratio: MAPS results
Table 3-8 presents the cost per MW ratio for both the baseline and Scenario #2 utilizing MAPS
production cost simulations based on the average hourly incremental power flow (MW) from
Niagara generation and Ontario-to-Niagara ties. Note that the values in Table 3-8 are rounded to
two decimal places, while the cost per MW ratio is based on non-rounded calculations.
Average hourly incremental transfer capability: Niagara Gen + Niagara ties (MW) is calculated
in the following steps:
1. For each project & base case study year, find the Annual: Niagara Gen + Niagara Ties
(MWh):
𝐴𝑛𝑛𝑢𝑎𝑙 𝑁𝑖𝑎𝑔𝑎𝑟𝑎 𝐺𝑒𝑛 (𝑀𝑊ℎ, 𝑖𝑛𝑐𝑙𝑢𝑑𝑖𝑛𝑔 𝐿𝑒𝑤𝑖𝑠𝑡𝑜𝑛) + 𝐴𝑛𝑛𝑢𝑎𝑙 𝑁𝑖𝑎𝑔𝑎𝑟𝑎 𝑇𝑖𝑒𝑠 𝐹𝑙𝑜𝑤 (𝑀𝑊ℎ)
= 𝐴𝑛𝑛𝑢𝑎𝑙:𝑁𝑖𝑎𝑔𝑎𝑟𝑎 𝐺𝑒𝑛 + 𝑁𝑖𝑎𝑔𝑎𝑟𝑎 𝑇𝑖𝑒𝑠 (𝑀𝑊ℎ)

Western New York Public Policy Transmission Planning Report | 42
2. For each project & base case study year, convert the annual energy to an hourly average:
𝐴𝑛𝑛𝑢𝑎𝑙:𝑁𝑖𝑎𝑔𝑎𝑟𝑎 𝐺𝑒𝑛 + 𝑁𝑖𝑎𝑔𝑎𝑟𝑎 𝑇𝑖𝑒𝑠 (𝑀𝑊ℎ)# 𝑜𝑓 ℎ𝑜𝑢𝑟𝑠 𝑖𝑛 𝑡ℎ𝑒 𝑦𝑒𝑎𝑟
= 𝐻𝑜𝑢𝑟𝑙𝑦:𝑁𝑖𝑎𝑔𝑎𝑟𝑎 𝐺𝑒𝑛 + 𝑁𝑖𝑎𝑔𝑎𝑟𝑎 𝑇𝑖𝑒𝑠 (𝑀𝑊)
3. Calculate the difference in hourly energy between the project and the base case for each
study year:
�𝑃𝑟𝑜𝑗𝑒𝑐𝑡 𝐻𝑜𝑢𝑟𝑙𝑦:𝑁𝑖𝑎𝑔𝑎𝑟𝑎 𝐺𝑒𝑛 + 𝑁𝑖𝑎𝑔𝑎𝑟𝑎 𝑇𝑖𝑒𝑠 (𝑀𝑊)�
− �𝐵𝑎𝑠𝑒 𝐶𝑎𝑠𝑒 𝐻𝑜𝑢𝑟𝑙𝑦:𝑁𝑖𝑎𝑔𝑎𝑟𝑎 𝐺𝑒𝑛 +𝑁𝑖𝑎𝑔𝑎𝑟𝑎 𝑇𝑖𝑒𝑠 (𝑀𝑊)�
= 𝐻𝑜𝑢𝑟𝑙𝑦 𝐼𝑛𝑐𝑟𝑒𝑚𝑒𝑛𝑡𝑎𝑙:𝑁𝑖𝑎𝑔𝑎𝑟𝑎 𝐺𝑒𝑛 + 𝑁𝑖𝑎𝑔𝑎𝑟𝑎 𝑇𝑖𝑒𝑠 (𝑀𝑊)
4. Calculate the average of the hourly incremental energy for each project over the duration of
their individual study periods:
∑ 𝐻𝑜𝑢𝑟𝑙𝑦 𝐼𝑛𝑐𝑟𝑒𝑚𝑒𝑛𝑡𝑎𝑙:𝑁𝑖𝑎𝑔𝑎𝑟𝑎 𝐺𝑒𝑛 + 𝑁𝑖𝑎𝑔𝑎𝑟𝑎 𝑇𝑖𝑒𝑠 (𝑀𝑊)𝐸𝑛𝑑 𝑦𝑒𝑎𝑟𝑆𝑡𝑎𝑟𝑡 𝑦𝑒𝑎𝑟
20 𝑦𝑒𝑎𝑟𝑠
= 𝐴𝑣𝑒𝑟𝑎𝑔𝑒 𝐻𝑜𝑢𝑟𝑙𝑦 𝐼𝑛𝑐𝑟𝑒𝑚𝑒𝑛𝑡𝑎𝑙:𝑁𝑖𝑎𝑔𝑎𝑟𝑎 𝐺𝑒𝑛 + 𝑁𝑖𝑎𝑔𝑎𝑟𝑎 𝑇𝑖𝑒𝑠 (𝑀𝑊)

Western New York Public Policy Transmission Planning Report | 43
Table 3-8: MAPS cost per MW ratio results
3.3.3 Expandability
In assessing the expandability of the proposed projects, the NYISO considers the feasibility and
ease of physically expanding a facility, which can include consideration of future opportunities to
economically expand a facility and the facilitation of future transmission siting. Such consideration
may include future modifications to increase equipment ratings of the proposed facilities, staging or
phasing of future transmission development, or otherwise benefiting from the proposed facilities
for future reliability or congestion relief purposes. The details are summarized in the following
sections.
3.3.3.1 Physical Expandability
The NYISO contracted the independent consultant, SECO, to perform the assessment based on
the proposed substation design. The possibilities of facilitating future transmission expansion or
generation interconnection as the result of the project proposal are noted in this section. SECO
conducted evaluation of the expansion capability of the Developers’ proposals by using the projects’
information submitted by the Developers during the Viability and Sufficiency Assessment and
additional information, specifically on expandability, provided by Developers in response to a
request for additional information by the NYISO. A summary of SECO’s findings is presented in
Table 3-9.
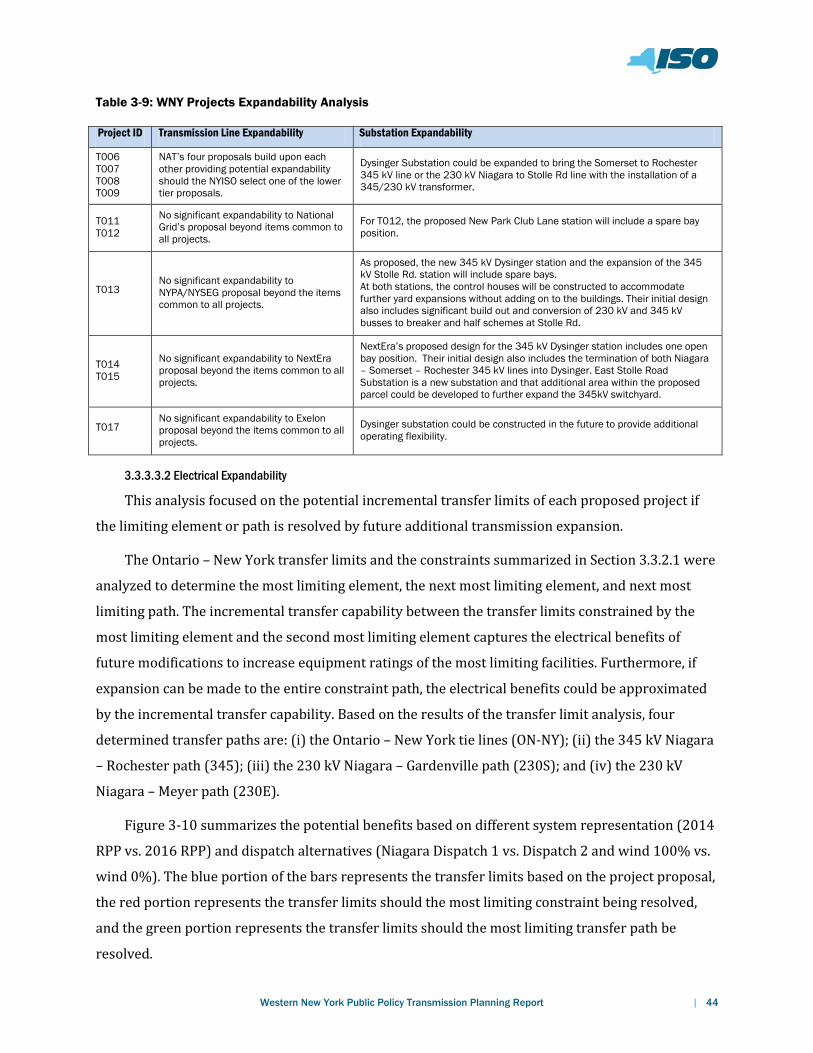
Western New York Public Policy Transmission Planning Report | 44
Table 3-9: WNY Projects Expandability Analysis
Project ID Transmission Line Expandability Substation Expandability
T006 T007 T008 T009
NAT’s four proposals build upon each other providing potential expandability should the NYISO select one of the lower tier proposals.
Dysinger Substation could be expanded to bring the Somerset to Rochester 345 kV line or the 230 kV Niagara to Stolle Rd line with the installation of a 345/230 kV transformer.
T011 T012
No significant expandability to National Grid’s proposal beyond items common to all projects.
For T012, the proposed New Park Club Lane station will include a spare bay position.
T013 No significant expandability to NYPA/NYSEG proposal beyond the items common to all projects.
As proposed, the new 345 kV Dysinger station and the expansion of the 345 kV Stolle Rd. station will include spare bays. At both stations, the control houses will be constructed to accommodate further yard expansions without adding on to the buildings. Their initial design also includes significant build out and conversion of 230 kV and 345 kV busses to breaker and half schemes at Stolle Rd.
T014 T015
No significant expandability to NextEra proposal beyond the items common to all projects.
NextEra’s proposed design for the 345 kV Dysinger station includes one open bay position. Their initial design also includes the termination of both Niagara – Somerset – Rochester 345 kV lines into Dysinger. East Stolle Road Substation is a new substation and that additional area within the proposed parcel could be developed to further expand the 345kV switchyard.
T017 No significant expandability to Exelon proposal beyond the items common to all projects.
Dysinger substation could be constructed in the future to provide additional operating flexibility.
3.3.3.3.2 Electrical Expandability
This analysis focused on the potential incremental transfer limits of each proposed project if
the limiting element or path is resolved by future additional transmission expansion.
The Ontario – New York transfer limits and the constraints summarized in Section 3.3.2.1 were
analyzed to determine the most limiting element, the next most limiting element, and next most
limiting path. The incremental transfer capability between the transfer limits constrained by the
most limiting element and the second most limiting element captures the electrical benefits of
future modifications to increase equipment ratings of the most limiting facilities. Furthermore, if
expansion can be made to the entire constraint path, the electrical benefits could be approximated
by the incremental transfer capability. Based on the results of the transfer limit analysis, four
determined transfer paths are: (i) the Ontario – New York tie lines (ON-NY); (ii) the 345 kV Niagara
– Rochester path (345); (iii) the 230 kV Niagara – Gardenville path (230S); and (iv) the 230 kV
Niagara – Meyer path (230E).
Figure 3-10 summarizes the potential benefits based on different system representation (2014
RPP vs. 2016 RPP) and dispatch alternatives (Niagara Dispatch 1 vs. Dispatch 2 and wind 100% vs.
wind 0%). The blue portion of the bars represents the transfer limits based on the project proposal,
the red portion represents the transfer limits should the most limiting constraint being resolved,
and the green portion represents the transfer limits should the most limiting transfer path be
resolved.

Western New York Public Policy Transmission Planning Report | 45
Figure 3-10: Electrical Expandability Analysis
0200400600800
1000120014001600180020002200
T006 T007 T008 T009 T011 T012 T013 T014 T015 T017
D1 - Wind 100% Transfer Limits
Most Limiting 2nd Most limiting Element 2nd Most Limiting Path
0200400600800
1000120014001600180020002200
T006 T007 T008 T009 T011 T012 T013 T014 T015 T017
D2 - Wind 100% Transfer Limits
Most Limiting 2nd Most limiting Element 2nd Most Limiting Path
0200400600800
1000120014001600180020002200
T006 T007 T008 T009 T011 T012 T013 T014 T015 T017
D1 - Wind 0% Transfer Limits
Most Limiting 2nd Most limiting Element 2nd Most Limiting Path
0200400600800
1000120014001600180020002200
T006 T007 T008 T009 T011 T012 T013 T014 T015 T017
D2 - Wind 0% Transfer Limits
Most Limiting 2nd Most limiting Element 2nd Most Limiting Path
0200400600800
1000120014001600180020002200
T006 T007 T008 T009 T011 T012 T013 T014 T015 T017
D1 - Wind 100% Transfer Limits
Most Limiting 2nd Most limiting Element 2nd Most Limiting Path
0200400600800
1000120014001600180020002200
T006 T007 T008 T009 T011 T012 T013 T014 T015 T017
D2 - Wind 100% Transfer Limits
Most Limiting 2nd Most limiting Element 2nd Most Limiting Path
-600-200200600
1000140018002200
T006 T007 T008 T009 T011 T012 T013 T014 T015 T017
D1 - Wind 0% Transfer Limits
Most Limiting 2nd Most limiting Element 2nd Most Limiting Path
0200400600800
1000120014001600180020002200
T006 T007 T008 T009 T011 T012 T013 T014 T015 T017
D2 - Wind 0% Transfer Limits
Most Limiting 2nd Most limiting Element 2nd Most Limiting Path
2014 RPP Expandability Results 2016 RPP Expandability Results

Western New York Public Policy Transmission Planning Report | 46
Table 3-10: Electrical Expandability Summary
Project T006 T007 T008 T009 T011 T012 T013 T014 T015 T017
Most limiting
transfer path 345, 230S
345, 230S,
ON-NY,115
345, 230S,
ON-NY,115
345, 230S,
ON-NY
230E
230S
230E,
230S, ON-
NY
230S, 345
230E
345, 230E,
230S
345, 230S 230E,230S
3.3.3.3.3 Summary of Expandability Assessment
The NYISO used the assessment of incremental transfer limits as a proxy to determine the
network strength and potential benefits if these project proposals could be expanded based on their
substation designs. While not explicitly studied in the evaluation, the transfer limit analysis
indicates that significant amounts of existing and potential new renewable resources in Ontario and
Western NY could be made available to the overall New York Control Area.
To summarize, the project proposals that has substation design with potentials to
accommodate transmission expansion to significantly increase transfer limits are considered more
favorable and ranked as “Good”. However, if the transfer limits could be increased significantly but
the current proposals by Developers do not have readily available options, those projects are
ranked as “Fair”.
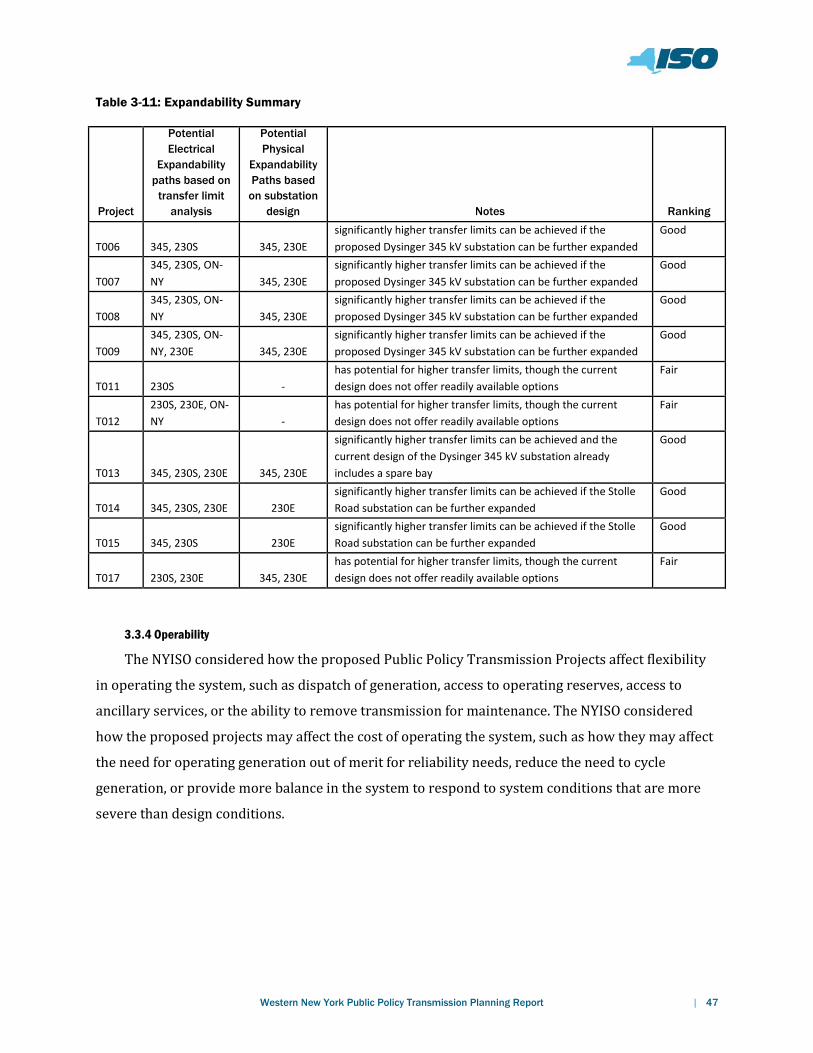
Western New York Public Policy Transmission Planning Report | 47
Table 3-11: Expandability Summary
Project
Potential Electrical
Expandability paths based on
transfer limit analysis
Potential Physical
Expandability Paths based
on substation design Notes Ranking
T006 345, 230S 345, 230E significantly higher transfer limits can be achieved if the proposed Dysinger 345 kV substation can be further expanded
Good
T007 345, 230S, ON-NY 345, 230E
significantly higher transfer limits can be achieved if the proposed Dysinger 345 kV substation can be further expanded
Good
T008 345, 230S, ON-NY 345, 230E
significantly higher transfer limits can be achieved if the proposed Dysinger 345 kV substation can be further expanded
Good
T009 345, 230S, ON-NY, 230E 345, 230E
significantly higher transfer limits can be achieved if the proposed Dysinger 345 kV substation can be further expanded
Good
T011 230S - has potential for higher transfer limits, though the current design does not offer readily available options
Fair
T012 230S, 230E, ON-NY -
has potential for higher transfer limits, though the current design does not offer readily available options
Fair
T013 345, 230S, 230E 345, 230E
significantly higher transfer limits can be achieved and the current design of the Dysinger 345 kV substation already includes a spare bay
Good
T014 345, 230S, 230E 230E significantly higher transfer limits can be achieved if the Stolle Road substation can be further expanded
Good
T015 345, 230S 230E significantly higher transfer limits can be achieved if the Stolle Road substation can be further expanded
Good
T017 230S, 230E 345, 230E has potential for higher transfer limits, though the current design does not offer readily available options
Fair
3.3.4 Operability
The NYISO considered how the proposed Public Policy Transmission Projects affect flexibility
in operating the system, such as dispatch of generation, access to operating reserves, access to
ancillary services, or the ability to remove transmission for maintenance. The NYISO considered
how the proposed projects may affect the cost of operating the system, such as how they may affect
the need for operating generation out of merit for reliability needs, reduce the need to cycle
generation, or provide more balance in the system to respond to system conditions that are more
severe than design conditions.

Western New York Public Policy Transmission Planning Report | 48
3.3.4.1 Controllability
Two project proposals include controllable elements: T013 and T014. T013 proposes to add a
PAR at South Perry 115 kV substation, while T014 proposes a PAR at Dysinger 345 kV substation.
In particular, the proposed 700 MVA PAR in T014 could regulate the direction and amount of MW
flowing on the new 345 kV path between Dysinger and Stolle substation, and thus offer an
additional degree of controllability to accommodate different system configurations.
3.3.4.2 Impact to Grid Operations during Construction
The projects that propose to upgrade or expand the existing facilities will likely require longer
outages of the lines and substations during construction. For example, until the 345 kV Dysinger
substation proposed by some Developers would be constructed and energized, the 230 kV lines
would be the most constrained elements of Western New York. Long outages of these existing
facilities during construction would likely result in higher congestion cost and increasing
complexity to operate the grid. Specifically, outages of 230 kV lines #61 Niagara – Packard, #64
Niagara – Robinson Road, and #66 Gardenville – Stolle Road have extensive impacts based on
current operating experience.
Table 3-12: Impact to Grid Operations during Construction
Project Impact level during construction
Potential Impacted Facilities During Construction
T006 Low 345 kV substations: Niagara, Somerset, Rochester, Stolle Road
T007 Medium 345 kV substations: Niagara, Somerset, Rochester, Stolle Road
230 kV substation: Gardenville
T008 Medium 345 kV substations: Niagara, Somerset, Rochester, Stolle Road
230 kV substation: Gardenville
T009 Medium 345 kV substations: Niagara, Somerset, Rochester, Stolle Road
230 kV substation: Gardenville
T011 High 230 kV substation: Niagara, Packard, Robinson Road
T012 High 230 kV substation: Niagara, Packard, Robinson Road, Gardenville
T013 High 345 kV substations: Niagara, Somerset, Rochester, Stolle Road
230 kV substation: Niagara, Packard, Robinson Road, Gardenville, Stolle Road
T014 Low 345 kV substations: Niagara, Somerset, Rochester, Stolle Road
T015 Low 345 kV substations: Niagara, Somerset, Rochester, Stolle Road
T017 Medium 345 kV substations: Niagara, Stolle Road
230 kV substation: Gardenville, Stolle Road

Western New York Public Policy Transmission Planning Report | 49
3.3.4.3 Substation Configuration Assessment
The operability of the proposals was evaluated by the NYISO and also by the independent
consultant, SECO. The following factors were considered in evaluating each of the proposals:
1. Level of Integration: Operational preference is for a project to integrate with the existing
transmission system to the maximum extent possible. A project using an existing right-of-
way (ROW) should not bypass existing substations on the ROW except for reasons such as
short circuit limitations, space limitations, and design perspective where a new substation
is desirable.
2. Substation Design Configuration: Operational preference is for substation designs in the
following order, notwithstanding the cost of the project: double-breaker-double-bus, a
breaker-and-a-half, ring bus, main and transfer bus, sectionalized bus, and straight (single)
bus.
3. Control of Power Flow: From an operations perspective, a project is preferable if it has the
ability to control power flow on the transmission network using devises such as: PAR(s),
HVDC capability, FACTS devices, series capacitor compensation, and (to a lesser extent)
series reactors compensation.
4. Transfer Capability Impact with Project Component out of Service: From an operations
perspective, it is desirable for a project not to lose its improvement to transfer capability as
a result of the loss of the project’s sub-component.
Two substations are most notable in this assessment: Stolle 345 kV and Dysinger 345 kV
substation (if applicable). Based on the substation configuration, the findings and comparisons are
summarized in Table 3-13 for Stolle Road 345 kV Substation and Table 3-14 for the new Dysinger
345 kV Substation. “N/A” is noted if a project does not propose modification or new additions to
these new substations.

Western New York Public Policy Transmission Planning Report | 50
Table 3-13: Stolle Road 345 kV Substation Arrangement Comparison
Project # of new Lines and
breakers
# of new Transformers (TR) Proposed
Configuration
Notes
T006 1 line,
3 (2 new) breakers
New third 345/115 kV TR
connected to Stolle 115
kV
Ring Three 345/115 kV TR share one breaker at the Stolle
345 kV substation. No connection to Stolle 230 kV
substation.
T007 2 lines,
4 (3 new) breakers
New 345/230 kV TR
connected to Gardenville
Ring Existing two 345/115 kV TRs continue to share one
breaker at the Stolle 345 kV substation
T008 3 lines,
8 (7 new) breakers
New 345/230 kV TR
connected to Gardenville
Breaker & Half Existing two 345/115 kV TRs continue to share one
breaker at the Stolle 345 kV substation
T009 3 lines,
8 (7 new) breakers
New 345/230 kV TR
connected to Gardenville
Breaker & Half Existing two 345/115 kV TRs continue to share one
breaker at the Stolle 345 kV substation
T011 N/A
T012 N/A
T013 1 line,
10 (9 new) breakers
Two 345/230 kV TR
connected to Stolle 230
kV
Breaker & Half Propose to separate the two existing 230/115 kV TRs
by placing additional series breakers in between. The
two 345/230 kV TRs are separated by new breakers.
T014 3 lines,
5 (4 new) breakers
0 Ring Existing two 345/115 kV TRs continue to share one
breaker at the Stolle 345 kV substation. No
connection to Stolle 230 kV substation.
T015 3 lines,
5 (4 new) breakers
0 Ring Existing two 345/115 kV TRs continue to share one
breaker at the Stolle 345 kV substation. No
connection to Stolle 230 kV substation.
T017 1 line,
2 (1new) breakers
0 Straight Bus Existing two 345/115 kV TRs continue to share one
breaker at the Stolle 345 kV substation. No
connection to Stolle 230 kV substation.
T017 proposes the simplest solution with a single breaker to connect the new line from
Dysinger substation. While the design is sufficient to meet reliability standards, it offers less
operating flexibility. T013 proposes the most reliable and flexible system by placing transformers
on separate breakers.

Western New York Public Policy Transmission Planning Report | 51
Table 3-14: Dysinger 345 kV Substation Arrangement Comparison
Developer # of new Lines and breakers Proposed
Configuration
Notes
T006 5 lines,
8 breakers
breaker & half,
3 bays
Developer proposes completing all site work and fencing for
ultimate build-out of the substation. Control house will include
space for future expansion.
T007 5 line,
8 breakers
breaker & half,
3 bays
Developer proposes completing all site work and fencing for
ultimate build-out of the substation. Control house will include
space for future expansion.
T008 6 lines,
9 breakers
breaker & half,
3 bays
Developer proposes completing all site work and fencing for
ultimate build-out of the substation. Control house will include
space for future expansion.
T009 7 lines,
11 breakers
breaker & half,
4 bays
Developer proposes completing all site work and fencing for
ultimate build-out of the substation. Control house will include
space for future expansion.
T011 N/A
T012 N/A
T013 5 lines,
8 breakers
breaker & half,
3 bays
Developer’s proposed layout is based on a known design utilized at
a existing substation, and states the switchyard will be designed
with space for additional bays. Control house will include space for
future expansion.
T014 7 lines, 11 breakers, 700
MVA phase shifting
transformer
breaker & half,
4 bays
Developer states that additional area within the proposed parcels
could be developed to provide a 230 kV ring bus if necessary.
T015 7 lines,
11 breakers
breaker & half,
4 bays
Developer states that additional area within the proposed parcels
could be developed to provide a 230 kV ring bus if necessary.
T017 N/A N/A N/A
T014 and T015 are the only two projects that propose to cut out the 345 kV line loop to
Somerset 345 kV substation and bring both 345 kV lines from Somerset 345 kV substation into the
Dysinger 345 kV substation. This proposal not only shortens the electrical distance (also known as
equivalent impedance) from Niagara to Rochester 345 kV, but it also provides additional operating
flexibility.
3.3.4.4 Dispatch Flexibility
The network configuration, load levels, and generation available for dispatch vary from day to
day and sometimes from second to second. While the transfer limit analysis was conducted for the
peak load condition assuming all generation available, the analysis in this section identified the
range of the incremental transfer limits that could vary due to generation dispatch.

Western New York Public Policy Transmission Planning Report | 52
A set of transfer limits with a small standard deviation indicates that the transfers are not
strongly affected by changes in the system’s generation dispatch. A small deviation also
demonstrates the incremental transfer limit that the proposed project addition is likely to maintain.
In contrast, a set of transfer limits with a large standard deviation means that the project’s ability to
deliver power is sensitive to the system’s generation dispatch.
The transfer limit analysis was performed on the four dispatch sensitivities, and the resulting
average transfer limits along with the standard deviation of the transfer limits are summarized in
the table below.
Table 3-15: Impact to Grid Operations
Project ID 2014 RPP Transfer Limits 2016 RPP Transfer Limits Average Standard Deviation Average Standard Deviation
T006 500 316 1,440 261 T007 897 146 1,704 210 T008 1,070 89 1,796 142 T009 1,322 113 1,753 138 T011 464 370 216 529 T012 1,336 446 1,431 338 T013 1,381 231 1,482 251 T014 921 132 1,604 210 T015 442 341 1,403 275 T017 1,364 316 1,536 373

Western New York Public Policy Transmission Planning Report | 53
3.3.4.5 Benefits under Maintenance Conditions
This analysis calculates the N-1 transfer capability of Tier 1 projects under different system
maintenance conditions by using optimal N-1-1 transfer limits. The N-1-1 transfer analysis
optimally shifts generation from Ontario to New York while securing New York elements both pre-
and post-contingency. When an overload cannot be mitigated, the optimal transfer limit is
determined. Any proposed PARs were optimized to maximize the transfer limits.
Based on the 2016 RPP case (wind at 100%, Niagara Dispatch 1, and series reactors on
Packard-Huntley 230 kV in-service), the below table shows the N-1-1 transfer limits. All Tier 1
projects improve system performance relative to the base case, and T014 shows better
performance than other Tier 1 projects under most of the maintenance conditions.
Table 3-16: N-1-1 Transfer Capability
Maintenance Conditions IESO-NYISO Transfer Limits
Base T006 T013 T014 T015
No maintenance outage 772 (1) 1890 (1) 1767 (1) 1861 (9) 1848 (1)
Packard - Huntley 230 kV 77 -1416 (2) 857 (6) 1090 (8) 1379 (10) 1074 (8)
Niagara - Packard 230 kV 61 -138 (3) 950 (7) 914 (7) 1335 (7) 979 (7)
Niagara - Robinson 230 kV 64 24 (4) 1141 (1) 1135 (1) 1476 (1) 1128 (1)
Stolle – Dysinger 345 kV new line - - 792 (1) 821 (1) 880 (1) 884 (1)
Stolle – 5 Mile 345 kV Line 29 768 (1) 1631 (1) 1594 (1) 1793 (1) 1512 (1)
Stolle – Gardenville 230 kV Line 66 -545 (5) 1139 (1) 1143 (1) 1321 (11) 1121 (1)
Stolle 345/115 XFMR(s) 768 (1) 1393 (1) 1712 (1) 1796 (1) 1369 (1)
Niagara - Dysinger 345 kV new line #1 - - 1060 (12) 1142 (1) 1121 (12) 1107 (12)
Notes: (1) Niagara - Packard 230 (61) at 847 MW STE rating for T:62&BP67
(2) Stolle - Gardenville 230 (66) at 574 MW LTE rating for SB:PA230_R0306 (3) Niagara - Packard 230 (62) at 847 MW Normal rating for pre 2nd contingent (4) Niagara 230/115 Transformer 1 at 288 MW STE rating for T:77&78 (5) Packard - Sawyer 230 kV (77) at 644 MW LTE rating for SB:PA230_R0306 (6) Packard - Sawyer 230 kV (78) at 644 MW LTE rating for SB:DYS345:CB2 (7) Niagara 230/115 Transformer 1 at 288 MW STE rating for SB:PA230_R506 (8) Packard - Sawyer 230 kV (78) at 644 MW LTE rating for T:66&705 (9) Niagara - Beck 345 kV (H302) at 1132 MW LTE rating for SB:NIAG345_3008 (10) Packard - Sawyer 230 kV (78) at 644 MW LTE rating for STOLLERD 115-4 (11) Meyer 230/24.5 XFMR at 294 LTE rating for L/O:Canandaigua - Stoney Ridge 230 (68) (12) Niagara 230/115 kV Transformer at 288 MW STE rating for L/O Niagara - Dysinger 345 line #2

Western New York Public Policy Transmission Planning Report | 54
3.3.4.6 Summary of Operability Assessment
Table 3-17: Operability Summary
Project Configuration Dispatch Flexibility Controllability Impact Level
during Construction
Ranking
T006 Enhance 345 kV network connectivity in Western NY
Facilitate significant amount of power transfer, and moderately sensitive to generator dispatches
none Low Good
T007 Enhance 345 kV and 230 kV network connectivity in Western NY
Facilitate significant amount of power transfer, and moderately sensitive to generator dispatches
none Medium Good
T008 Enhance 345 kV and 230 kV network connectivity in Western NY
Facilitate significant amount of power transfer, and less sensitive to generator dispatches
none Medium Good
T009 Enhance 345 kV and 230 kV network connectivity in Western NY
Facilitate significant amount of power transfer, and less sensitive to generator dispatches
none Medium Good
T011 adequate; advantageous by separating the two lines 61 and 64 on a common tower
Facilitate small amount of power transfer, and extremely sensitive to generator dispatches
none High Fair
T012
Enhance 230 kV network connectivity in Western NY; advantageous by separating the two lines 61 and 64 on a common tower
Facilitate significant amount of power transfer, and very sensitive to generator dispatches
none High Good
T013
Enhance 345 kV and 230 kV network connectivity in Western NY; advantageous Stolle substation design by separating the 345/115 kV transformers
Facilitate significant amount of power transfer, and moderately sensitive to generator dispatches
The proposed 115 kV PAR at South Perry substation can control the direction and amount of power on the 115 kV path
High Good
T014
Enhance 345 kV network connectivity in Western NY; advantageous Dysinger substation design by connecting to Somerset 345 kV substation
Facilitate significant amount of power transfer, and moderately sensitive to generator dispatches
The proposed 345 kV PAR at Dysinger substation can control the direction and amount of power on the new 345 kV path
Low Excellent
T015
Enhance 345 kV network connectivity in Western NY; advantageous Dysinger substation design by connecting to Somerset 345 kV substation
Facilitate significant amount of power transfer, and moderately sensitive to generator dispatches
none Low Good
T017
Enhance 345 kV network connectivity in Western NY; less advantageous straight bus design at Stolle Road 345 kV substation
Facilitate significant amount of power transfer, and very sensitive to generator dispatches
none Medium Fair

Western New York Public Policy Transmission Planning Report | 55
3.3.5 Performance
For the Western NY Need, the performance metric is primarily concerned with obtaining full
output from Niagara and maximizing import capability from Ontario. Table 3-18 lists the annual
flows across the Niagara tie lines plus Niagara generation for each of the projects. This table also
presents the annual flows across the Dysinger East interface. The Dysinger East interface only
captures the flows of transmission facilities within New York State from Zone A to Zones B and C;
the interface does not capture all flows out of Zone A. The flows are from the MAPS Scenario 2
(series reactors on Packard – Huntley 230 kV lines in service). The year 2025 was chosen as the
evaluation year as all projects would be online at this time. The energy flow from New York to PJM
West is similar for Tier 1 projects with an average increase of approximately 800 GWh in 2025.
Table 3-18: Interface flows in 2025
Project ID Niagara Gen + Niagara Ties (GWh) Dysinger East
(GWh) T006 24,165 5,962 T007 24,191 5,968 T008 24,208 5,852 T009 24,368 5,984 T011 23,089 6,717 T012 23,654 6,802 T013 24,198 6,006 T014 24,309 6,237 T015 24,251 6,070 T017 24,224 6,264
3.3.6 Production Cost
Presented in this section are the production cost results for the Western New York Public
Policy Transmission Projects. Each entry in the following tables represents the differences between
the pre-project and post-project over the duration of a project’s study period. The study period
begins with the proposed in-service date by the Developer and goes out 20 years. Entries with a
dollar value are listed as 2017 millions of dollars. The discount rate used to calculate present value
is 6.843% consistent with the 2016 CARIS Phase 2 database. Scenarios were used to distinguish
projects and measure the performance robustness. Blank entries mean that a certain scenario was
not a distinguishing factor for that particular project. In general, a negative value (listed in red) is a
more positive outcome for the various metrics (i.e., the system benefits from the reduction in
production cost, lower LBMPs, and reduced emissions).

Western New York Public Policy Transmission Planning Report | 56
Tables 3-19 and 3-20 contain the production cost saving in 2017 millions of dollars. Tables
3-21 through 3-24 list the percentage change in zonal LBMP based on the baseline or scenarios
presented. Tables 3-25 through 3-28 show the load payment change in 2017 millions of dollars.
Table 3-29 has the NYCA demand congestion change in 2017 millions of dollars. Lastly, Table 3-30
demonstrates the change in CO2 emission for the system.

Western New York Public Policy Transmission Planning Report | 57
Table 3-19: NYCA Production Cost Saving in 2017 M$
Project ID Baseline 2017
Baseline
SR on 77/78 In-
service
Historical IESO-MISO
Flow Modeled
High Fuel Low Fuel High
Load Low
Load
National CO2 Removed and SR on 77/78
In-service
Based off 2017 Baseline T006 (100) (101) (209) (116) (106) T007 (139) (149) (231) (193) (203) (139) (159) (136) T008 (175) (195) (230) (261) T009 (216) (241) (269) (322) T011 3 1 1 (5) T012 (55) (75) (75) (172) T013 (205) (229) (229) (308) (296) (210) (277) (185) (138) T014 (201) (207) (274) (243) (239) (181) (219) (192) (210) T015 (101) (99) (225) (98) (108) T017 (168) (207) (207) (335) (288) (172) (278) (147) (127)
An additional scenario, which models the Series Reactors on 77/78 in-service and historical IESO-MISO flow, was performed for
several projects. The results of production cost changes are shown in Table 3-20.

Western New York Public Policy Transmission Planning Report | 58
Table 3-20: NYCA Production Cost Saving in 2017 M$ for SR In-service and Historical IESO-MISO
Table 3-21: Baseline LBMP Change in %
T006 (289)T013 (308)T014 (338)T015 (304)
Project ID SR In-service and Historical IESO-MISO
Project West Genesee Central NorthMohawk Valley Capital
Hudson Valley Millwood Dunwoodie NY City Long Island
T006 (1.59)% 0.73% 0.36% 0.44% 0.38% 0.02% 0.05% 0.04% 0.04% 0.07% 0.01%T007 (2.20)% 0.84% 0.43% 0.55% 0.48% 0.11% 0.13% 0.13% 0.13% 0.11% 0.03%T008 (2.23)% 1.15% 0.68% 0.80% 0.73% 0.35% 0.36% 0.35% 0.35% 0.21% 0.10%T009 (1.84)% 1.41% 0.97% 1.14% 1.03% 0.71% 0.69% 0.68% 0.68% 0.38% 0.23%T011 (0.21)% 0.07% 0.03% 0.02% 0.02% 0.02% 0.01% 0.01% 0.01% 0.01% 0.02%T012 (2.42)% 0.89% 0.47% 0.48% 0.47% 0.34% 0.32% 0.33% 0.32% 0.16% 0.10%T013 (2.11)% 1.31% 0.87% 0.93% 0.89% 0.53% 0.53% 0.52% 0.51% 0.27% 0.17%T014 (1.21)% 0.53% 0.44% 0.70% 0.55% 0.34% 0.39% 0.40% 0.40% 0.21% 0.13%T015 (0.96)% 0.25% 0.12% 0.30% 0.17% (0.06)% (0.02)% (0.03)% (0.02)% 0.02% 0.00%T017 (1.76)% 1.77% 1.11% 1.14% 1.10% 0.89% 0.81% 0.80% 0.79% 0.38% 0.26%

Western New York Public Policy Transmission Planning Report | 59
Table 3-22: Scenario 1 (2017 Baseline) LBMP Change in %
Table 3-23: Scenario 2 (SR on 77/78 in for all projects) LBMP Change in %
Project West Genesee Central NorthMohawk Valley Capital
Hudson Valley Millwood Dunwoodie NY City Long Island
T006 (1.83)% 0.66% 0.31% 0.38% 0.31% (0.08)% (0.05)% (0.06)% (0.07)% (0.01)% (0.02)%T007 (2.71)% 0.73% 0.30% 0.41% 0.34% (0.07)% (0.05)% (0.06)% (0.06)% 0.00% (0.03)%T008 (3.02)% 0.91% 0.40% 0.51% 0.45% 0.08% 0.08% 0.07% 0.06% 0.05% 0.03%T009 (2.79)% 1.07% 0.57% 0.74% 0.64% 0.33% 0.31% 0.31% 0.30% 0.17% 0.15%T011 (0.21)% 0.08% 0.03% 0.02% 0.02% 0.02% 0.01% 0.01% 0.00% 0.02% 0.02%T012 (3.14)% 0.70% 0.23% 0.23% 0.23% 0.13% 0.08% 0.09% 0.08% 0.04% 0.06%T013 (2.91)% 1.05% 0.57% 0.63% 0.59% 0.25% 0.24% 0.23% 0.23% 0.10% 0.11%T014 (1.61)% 0.37% 0.29% 0.53% 0.39% 0.17% 0.21% 0.21% 0.22% 0.12% 0.11%T015 (1.13)% 0.18% 0.08% 0.23% 0.11% (0.14)% (0.10)% (0.11)% (0.11)% (0.03)% (0.02)%T017 (2.91)% 1.42% 0.70% 0.71% 0.69% 0.52% 0.42% 0.41% 0.41% 0.18% 0.20%
Project West Genesee Central NorthMohawk Valley Capital
Hudson Valley Millwood Dunwoodie NY City Long Island
T006 (3.02)% 1.17% 0.52% 0.62% 0.56% 0.24% 0.23% 0.23% 0.22% 0.10% 0.09%T007 (2.94)% 1.18% 0.64% 0.75% 0.69% 0.34% 0.32% 0.32% 0.31% 0.16% 0.15%T008 (2.97)% 1.21% 0.67% 0.77% 0.71% 0.36% 0.35% 0.34% 0.33% 0.17% 0.14%T009 (2.71)% 1.19% 0.69% 0.85% 0.76% 0.46% 0.44% 0.43% 0.43% 0.22% 0.20%T011 (0.21)% 0.08% 0.03% 0.02% 0.02% 0.02% 0.01% 0.01% 0.00% 0.02% 0.02%T012 (3.14)% 0.70% 0.23% 0.23% 0.23% 0.13% 0.08% 0.09% 0.08% 0.04% 0.06%T013 (2.91)% 1.05% 0.57% 0.63% 0.59% 0.25% 0.24% 0.23% 0.23% 0.10% 0.11%T014 (2.50)% 0.54% 0.23% 0.45% 0.33% 0.17% 0.17% 0.18% 0.18% 0.09% 0.09%T015 (2.74)% 0.67% 0.24% 0.44% 0.33% 0.14% 0.12% 0.13% 0.12% 0.03% 0.05%T017 (2.91)% 1.42% 0.70% 0.71% 0.69% 0.52% 0.42% 0.41% 0.41% 0.18% 0.20%

Western New York Public Policy Transmission Planning Report | 60
Table 3-24: Scenario 8 (no National CO2 and SR on 77/78 in for all projects) LBMP Change in %
Table 3-25: Baseline Load Payment Change in 2017 M$
Project West Genesee Central NorthMohawk Valley Capital
Hudson Valley Millwood Dunwoodie NY City Long Island
T006 (2.41)% 0.81% 0.23% 0.57% 0.38% (0.56)% (0.39)% (0.40)% (0.40)% (0.16)% (0.17)%T007T008T009T011T012T013 (2.13)% 0.58% 0.21% 0.48% 0.32% (0.54)% (0.39)% (0.40)% (0.40)% (0.17)% (0.16)%T014 (1.67)% 0.06% (0.09)% 0.36% 0.13% (0.51)% (0.34)% (0.33)% (0.33)% (0.08)% (0.09)%T015 (2.10)% 0.28% (0.02)% 0.40% 0.17% (0.46)% (0.34)% (0.34)% (0.35)% (0.13)% (0.10)%T017 (1.53)% 0.84% 0.15% 0.36% 0.22% (0.54)% (0.42)% (0.43)% (0.44)% (0.20)% (0.19)%
Project West Genesee Central NorthMohawk Valley Capital
Hudson Valley Millwood Dunwoodie NY City Long Island
T006 (110) 37 39 12 21 (1) 2 1 1 30 4T007 (175) 47 37 14 25 6 7 2 4 41 6T008 (177) 64 57 20 34 22 20 5 12 66 17T009 (140) 80 82 27 46 52 43 10 26 135 40T011 (9) 4 2 0 1 2 (1) 1 (1) 7 4T012 (219) 54 41 11 19 25 21 5 14 64 22T013 (181) 76 69 23 40 38 32 8 19 100 36T014 (89) 29 42 17 26 23 23 6 14 70 22T015 (51) 11 15 8 11 (8) (2) (1) (2) 11 2T017 (137) 97 98 25 45 64 49 12 30 130 47

Western New York Public Policy Transmission Planning Report | 61
Table 3-26: Scenario 1 (2017 Baseline) Load Payment Change in 2017 M$
Table 3-27: Scenario 2 (SR on 77/78 in for all projects) Load Payment Change in 2017 M$
Project West Genesee Central NorthMohawk Valley Capital
Hudson Valley Millwood Dunwoodie NY City Long Island
T006 (137) 36 38 11 19 (9) (3) (1) (2) 7 (2)T007 (233) 44 26 11 20 (11) (5) (1) (3) 2 (4)T008 (260) 54 34 13 23 2 3 0 2 17 6T009 (237) 64 49 18 31 23 19 5 12 71 26T011 (10) 5 3 0 1 2 (1) 1 (1) 9 4T012 (299) 46 18 5 9 8 4 1 4 15 14T013 (266) 65 43 16 29 17 14 4 9 47 23T014 (131) 21 29 13 19 9 11 3 7 42 15T015 (69) 9 13 7 9 (15) (6) (2) (5) (1) (3)T017 (249) 84 65 16 29 40 26 7 17 72 36
Project West Genesee Central NorthMohawk Valley Capital
Hudson Valley Millwood Dunwoodie NY City Long Island
T006 (275) 69 52 15 28 17 14 4 9 50 20T007 (268) 73 56 19 33 24 21 5 13 72 30T008 (261) 73 58 19 34 26 22 5 14 74 28T009 (230) 72 60 21 35 35 29 7 18 92 38T011 (10) 5 3 0 1 2 (1) 1 (1) 9 4T012 (299) 46 18 5 9 8 4 1 4 15 14T013 (266) 65 43 16 29 17 14 4 9 47 23T014 (229) 33 20 11 15 9 9 2 7 39 15T015 (252) 42 23 11 16 8 6 2 6 18 13T017 (249) 84 65 16 29 40 26 7 17 72 36

Western New York Public Policy Transmission Planning Report | 62
Table 3-28: Scenario 8 (no National CO2 and SR in for all projects) Load Payment Change in 2017 M$
Project West Genesee Central NorthMohawk Valley Capital
Hudson Valley Millwood Dunwoodie NY City Long Island
T006 (181) 42 24 14 20 (53) (27) (8) (18) (38) (20)T007T008T009T011T012T013 (157) 31 9 12 18 (52) (29) (8) (18) (45) (18)T014 (123) 3 (9) 9 8 (50) (26) (7) (15) (23) (13)T015 (159) 16 0 10 11 (45) (26) (7) (15) (39) (10)T017 (95) 42 15 8 11 (43) (26) (7) (16) (52) (22)

Western New York Public Policy Transmission Planning Report | 63
Table 3-29: NYCA Demand Congestion Change in 2017 M$
Table 3-30: System CO2 Emission Change (1000 tons)
3.3.7 Property Rights and Routing
For each project, the NYISO reviewed whether the Developer already possesses the right of
way (ROW) necessary to implement the project or has specified a plan or approach for determining
routing and acquiring property rights. In assessing the availability of real property rights for each
proposed project, the NYISO relied on its independent consultant, SECO, along with the knowledge
of the New York State Department of Public Service (DPS) and information provided by the
Transmission Owner(s) in the applicable Transmission District(s). The NYISO and SECO also
reviewed, in consultation with the DPS, transmission routing studies provided by Developers that
SR on 77/78 In-service
Historical IESO-MISO
Flow Modeled
High Fuel
Low Fuel
High Load
Low Load
National CO2 Removed and SR on 77/78 In-service
T006 (413) (474) (713) (1,367) (827)T007 (530) (608) (735) (1,767) (677) (564) (735) (485)T008 (607) (645) (727) (1,819)T009 (663) (670) (704) (1,690)T011 (11) (13) (13) (54)T012 (470) (475) (475) (1,293)T013 (681) (710) (710) (1,797) (640) (705) (753) (616) (724)T014 (457) (479) (582) (1,184) (368) (471) (460) (449) (604)T015 (313) (344) (647) (1,056) (713)T017 (591) (577) (577) (1,662) (436) (657) (636) (528) (468)
Project ID Baseline 2017
Baseline
Based off 2017 Baseline
SR on 77/78 In-service
Historical IESO-MISO
Flow Modeled
High Fuel
Low Fuel
High Load
Low Load
National CO2 Removed and SR on 77/78 In-service
T006 (12,802) (11,692) (11,390) (12,733) (6,871)T007 (13,323) (12,109) (11,582) (15,639) (7,502) (12,585) (16,971) (11,278)T008 (12,766) (11,720) (11,023) (19,032)T009 (11,874) (11,373) (11,061) (20,967)T011 (980) (378) (378) (1,004)T012 (3,976) (2,017) (2,017) (6,603)T013 (12,564) (11,305) (11,305) (19,182) (3,541) (13,647) (16,732) (11,056) (7,505)T014 (6,059) (6,473) (7,362) (12,050) (1,202) (6,452) (6,049) (4,860) (177)T015 (10,892) (10,067) (10,681) (12,482) (4,747)T017 (9,982) (11,104) (11,104) (19,795) (2,312) (14,851) (19,068) (10,102) (7,625)
Based off 2017 Baseline
Project ID Baseline 2017
Baseline

Western New York Public Policy Transmission Planning Report | 64
may identify routing alternatives and land-use or environmentally sensitive areas, such as
wetlands, agriculture, and residential areas.
SECO reviewed the Developers’ property rights acquisition plans associated with the proposals
using the Developers’ projects information submitted in the Viability and Sufficiency Assessment
process and responses provided by Developers to a request for additional information relating to
property rights and transmission siting.
SECO found that the following items were common among all proposals in their property rights
acquisition process:
Use existing ROW as much as practicable.
Where additional ROWs must be acquired, it will be accomplished through arm’s length negotiation with property owners.
If negotiations are unsuccessful, the property will be acquired through eminent domain.
All Developers have completed preliminary routing of proposed lines.
All of the non-incumbent Developers claim the following two common rights to assist in
obtaining property:
Developers cite the December 17, 2015 PSC order (Case 12-T-0502) related to the AC Transmission proceeding as having applicability to this project in terms of obtaining access to the incumbent utility ROW. In that order, the PSC stated its expectation that incumbent transmission owners will act in a reasonable manner to negotiate access to and usage of their ROWs for the selected transmission project.
If negotiations with private land owners are unsuccessful, Developers have asserted that they believe that under New York State Law they would have or obtain eminent domain authority after certification of a route by the PSC.
Concerning routing, SECO reviewed Developers’ proposals for routing their transmission lines
and substations to identify where new property rights would need to be acquired. SECO derived
estimates for property from recent comparable sales and tax assessments in the town and county
where the property would be located.
A summary of SECO’s review on property rights for all projects is presented in Table 3-31.
Table 3-32 presents summary results for new transmission line ROW. Details on Substation
property analysis can be found in Appendix D.
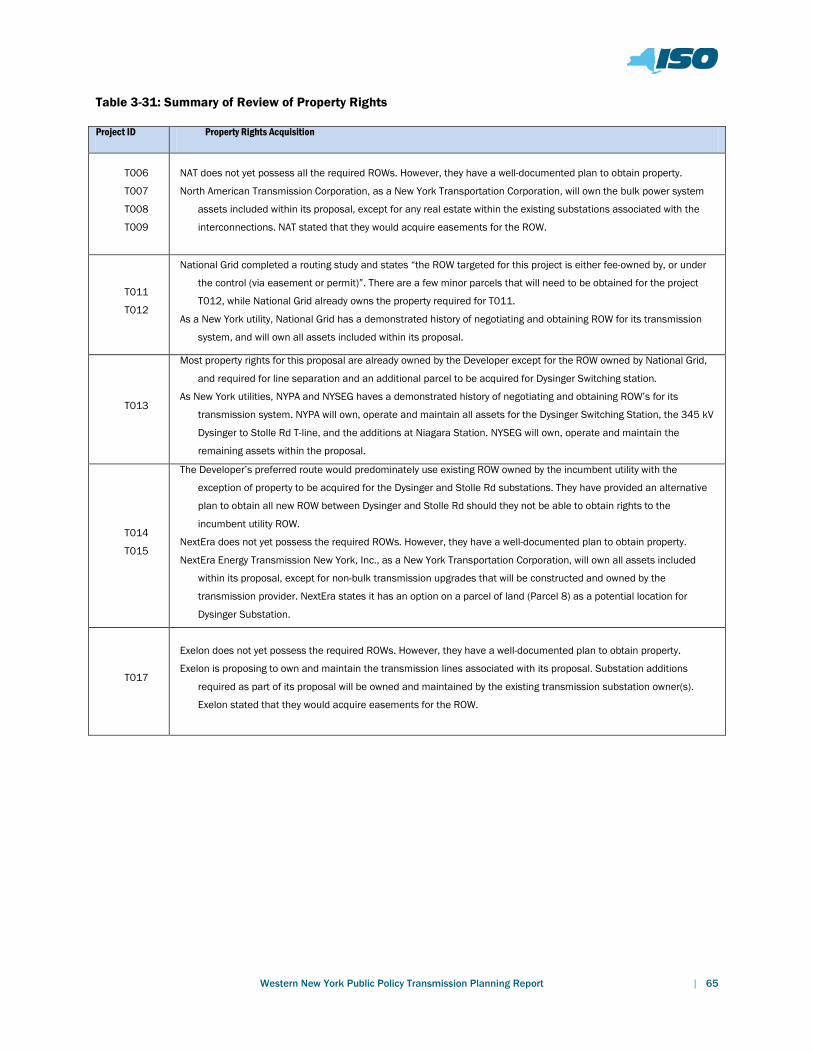
Western New York Public Policy Transmission Planning Report | 65
Table 3-31: Summary of Review of Property Rights
Project ID Property Rights Acquisition
T006
T007
T008
T009
NAT does not yet possess all the required ROWs. However, they have a well-documented plan to obtain property.
North American Transmission Corporation, as a New York Transportation Corporation, will own the bulk power system
assets included within its proposal, except for any real estate within the existing substations associated with the
interconnections. NAT stated that they would acquire easements for the ROW.
T011
T012
National Grid completed a routing study and states “the ROW targeted for this project is either fee-owned by, or under
the control (via easement or permit)”. There are a few minor parcels that will need to be obtained for the project
T012, while National Grid already owns the property required for T011.
As a New York utility, National Grid has a demonstrated history of negotiating and obtaining ROW for its transmission
system, and will own all assets included within its proposal.
T013
Most property rights for this proposal are already owned by the Developer except for the ROW owned by National Grid,
and required for line separation and an additional parcel to be acquired for Dysinger Switching station.
As New York utilities, NYPA and NYSEG haves a demonstrated history of negotiating and obtaining ROW’s for its
transmission system. NYPA will own, operate and maintain all assets for the Dysinger Switching Station, the 345 kV
Dysinger to Stolle Rd T-line, and the additions at Niagara Station. NYSEG will own, operate and maintain the
remaining assets within the proposal.
T014
T015
The Developer’s preferred route would predominately use existing ROW owned by the incumbent utility with the
exception of property to be acquired for the Dysinger and Stolle Rd substations. They have provided an alternative
plan to obtain all new ROW between Dysinger and Stolle Rd should they not be able to obtain rights to the
incumbent utility ROW.
NextEra does not yet possess the required ROWs. However, they have a well-documented plan to obtain property.
NextEra Energy Transmission New York, Inc., as a New York Transportation Corporation, will own all assets included
within its proposal, except for non-bulk transmission upgrades that will be constructed and owned by the
transmission provider. NextEra states it has an option on a parcel of land (Parcel 8) as a potential location for
Dysinger Substation.
T017
Exelon does not yet possess the required ROWs. However, they have a well-documented plan to obtain property.
Exelon is proposing to own and maintain the transmission lines associated with its proposal. Substation additions
required as part of its proposal will be owned and maintained by the existing transmission substation owner(s).
Exelon stated that they would acquire easements for the ROW.

Western New York Public Policy Transmission Planning Report | 66
Table 3-32: Summary of Review of new Transmission Lines Routing
3.3.8 Potential Construction Delay
The NYISO evaluated Developers’ schedules for project completion first as part of the Viability
and Sufficiency Assessment to determine whether projects were feasible. During the evaluation
stage, the NYISO conducted a more in-depth analysis of the project schedules of the viable and
sufficient transmission projects to determine the accuracy of schedules provided to the NYISO and
the likelihood of project delay. For this purpose, the NYISO used the more detailed engineering and
design information as required in Section 31.4.8.1.7 of the OATT.
The NYISO contracted SECO to evaluate the schedules for each proposed Public Policy
Transmission Project for potential construction delay. SECO focused on the proposed durations of
the tasks in each Developer’s project schedule. Based on this evaluation, SECO independently
determined its own time estimates for each project schedule and compared it to the Developer’s
proposed project duration. SECO conducted this evaluation based on its expertise and experience
with transmission lines and substation projects in New York State and by comparison to actual
AREA (ACRES)
AREA (ACRES)
AREA (ACRES)
AREA (ACRES)
AREA (ACRES)
COST
T006 North American Transmission (Proposal 1)
Dysinger SS to Stolle Rd SS - 19.98 miles
0.68 0.68 0.68 4,376$ ROW GAP
Dysinger SS to Stolle Rd SS - 19.98 miles
0.68 0.68 ROW GAP
Stolle Rd SS to Gardenvil le SS - 12.84 miles
67.56 40.27 70.83 178.66 ROW W/ 2 HOUSES AND 2 COMM BLDGS
Dysinger SS to Stolle Rd SS - 19.98 miles
0.68 0.68 ROW GAP
Stolle Rd SS to Gardenvil le SS - 12.84 miles
67.56 40.27 70.83 178.66 ROW W/ 2 HOUSES AND 2 COMM BLDGS
Dysinger SS to Stolle Rd SS - 19.98 miles
0.68 0.68 ROW GAP
Stolle Rd SS to Gardenvil le SS - 12.84 miles
67.56 40.27 70.83 178.66 ROW W/ 2 HOUSES AND 2 COMM BLDGS
Niagara to Dysinger - 27.161.56 0.82 2.38 ROW GAP
T011 National Grid (Moderate Transfer)
No New Lines
T012 National Grid (High Transfer)
Niagara to Gardenvil le - 36.2 miles
3.97 14.01 17.98 17.98 172,069$ ROW GAP
T013 NYPA and NYSEG Dysinger to Stolle - 20.6 miles
0.68 0.68 0.68 4,376$ ROW GAP
NextEra Energy Dysinger SS to Stolle Rd SS - 19.93 miles
0.68 0.68 0.68 4,376$ ROW GAP
NextEra Energy (Alternative) Dysinger SS to Stolle Rd SS - 21.66 miles
33.71 120.66 97.51 251.88 251.88 7,606,569$ ROW W/ 5 HOUSES
NextEra Energy Dysinger SS to Stolle Rd SS - 19.93 miles
0.68 0.68 0.68 4,376$ ROW GAP
NextEra Energy (Alternative) Dysinger SS to Stolle Rd SS - 21.66 miles
33.71 120.66 97.51 251.88 251.88 7,606,569$ ROW W/ 5 HOUSES
Niagara to Stolle - 47.12 miles
4.25 3.48 45.67 53.40 53.40 408,382$ ROW GAP
Stolle Rd SS to Gardenvil le SS - 12.10 miles
40.56 62.3 38.37 141.23 141.23 6,609,030$ ROW W/ 4 HOUSES AND 1 COMM BLDG
T014
T017 Exelon Transmission
T015
NEW RIGHT OF WAY (ROW)COMMER
North American Transmission (Proposal 3)T008
SEGMENT
T009North American Transmission (Proposal 4)
T007North American Transmission (Proposal 2)
PROPOSAL DEVELOPER
181.72 7,522,784$
RESIDENTISUB-
TOTAL COMMENTSAGRICULTTOTAL ROW REQUIRED
179.34 7,471,224$
179.34 7,471,224$

Western New York Public Policy Transmission Planning Report | 67
Article VII projects completed. Appendix D provides greater details on the evaluation of the project
schedules.
Summary results of the evaluation of the project schedules are presented in Table 3-33. The
independent minimum duration was calculated using what the review team considered to be the
minimum duration for Article VII application preparation, the anticipated time for the Article VII
approval process, ROW procurement where significant, and the anticipated time for construction of
the project. The independent minimum duration is the best case and is shown for comparative
purposes. The independent duration estimate is calculated using the anticipated time for Article VII
application preparation, Article VII approval process, ROW procurement, and construction.
Table 3-33: Results of Evaluation of the Projects Schedules
Project ID Independent
Minimum Duration Estimate: months
Independent Anticipated
Duration Estimate: months
T006 40 43 T007 59 63 T008 65 69 T009 71 75 T011 57 57 T012 60 60 T013 44 55 T014 40 49 T014_Alt 49 53 T015 40 49 T015_Alt 49 53 T017 66 82
3.4 Consequences for Other Regions
In addition to its evaluation to identify the more efficient or cost effective solution to the
identified Public Policy Transmission Need, the NYISO also coordinates with neighboring regions to
identify the consequences, if any, of the proposed transmission solutions on the neighboring
regions using the respective planning criteria of such regions.
Through the NYISO Transmission Expansion and Interconnection Process and the associated
System Impact Studies, the NYISO consulted with the IESO and PJM concerning any potential

Western New York Public Policy Transmission Planning Report | 68
impacts due to the proposed Western New York Public Policy Transmission Projects. System
Impact Studies for Tier 1 projects were all approved by the NYISO Operating Committee with no
adverse impacts identified.
3.5 Impact on Wholesale Electricity Markets
The NYISO evaluates the impact of proposed viable and sufficient Public Policy Transmission
Projects on its wholesale electricity markets, using economic metrics including change in
production cost, congestion, and load payments.21 Based on the transfer and production cost
analysis results described in Sections 3.3.2 and 3.3.6, the proposed transmission projects all tend to
increase the Ontario to New York transfer capability and reduce congestion. Therefore, the NYISO
staff has determined that the viable and sufficient Public Policy Transmission Projects proposed to
address the Western NY Need will have no adverse impact on the competitiveness of the New York
wholesale electricity markets. Rather, the transmission projects all tend to improve the
competitiveness of the NYISO’s markets by increasing system transfer capability, allowing more
resources and suppliers to compete to serve loads. The review from the NYISO’s Market Monitoring
Unit is included in Appendix E.22
3.6 Non-BPTF Upgrades Addressed by National Grid
In accordance with the PSC’s October 2016 Order, National Grid identified the non-BPTF
projects that it will undertake to upgrade its Niagara – Packard Line #193 and Niagara – Packard
Line #194 115 kV transmission lines. National Grid reported to the NYISO that it will reconductor
those lines, in addition to replacing approximately 17 towers and other hardware, and make
associated substation changes. In evaluating each Developer’s project in relation to achieving the
objectives of the Western NY Need on the BPTF, the NYISO modeled these upgrades as completed in
the evaluation of each proposed transmission project. Based upon the information from National
Grid on reconductoring the #193 and #194 lines, the relief of the pre-existing non-BPTF overloads
will be undertaken in the same manner regardless of which proposed project is selected by the
NYISO. In its order confirming the Western NY Need, the PSC determined that the costs of resolving
the non-BPTF overloads should not be a distinguishing factor among project proposals.23
Accordingly, the NYISO did not include the costs of reconductoring the #193 and #194 lines, or the
costs of any other non-BPTF project elements that were included to address the identified non-
21 See OATT Sections 31.4.10 and 31.4.8.1.9. 22 See OATT Section 31.4.11.1 (“[T]he draft report will be provided to the Market Monitoring Unit for its review and consideration”). 23 October 2016 Order, at p 17.

Western New York Public Policy Transmission Planning Report | 69
BPTF overloads, in comparing the costs of Developers’ projects.24
3.7 Evaluation of Interaction with Local Transmission Owner Plans
In its Public Policy Transmission Planning Process, the NYISO is required to review the Local
Transmission Owner Plans (LTPs)25 as they relate to the BPTF to determine whether any proposed
regional Public Policy Transmission Project on the BTPF can: (i) more efficiently or cost-effectively
satisfy any local needs driven by a Public Policy Requirement identified in the LTPs, or (ii) might
more efficiently or cost-effectively satisfy the identified regional Public Policy Transmission Need
than any local transmission solutions driven by Public Policy Requirements identified in the LTPs.
The Transmission Owners’ current LTPs have not identified any needs driven by a Public
Policy Requirement in New York State. Accordingly, the NYISO determined that there are no
proposed regional Public Policy Transmission Projects that could more efficiently or cost-
effectively satisfy a need driven by a Public Policy Requirement identified in an LTP. In the absence
of any public policy needs in the LTPs, it is also not necessary for the NYISO to determine whether a
regional transmission project would more efficiently or cost effectively satisfy such a transmission
need on the BPTF than a local transmission solution.
In the transfer analysis described in Section 3.2.1, the NYISO monitored the non-BPTF portion
of the Bulk Electric System (BES) up to STE ratings and determined if the loss of the non-BPTF
element would cause other facilities to be overloaded. The NYISO also performed transfer analysis
monitoring the non-BPTF portion of the BES to LTE ratings. Under such conditions, some Western
New York 115 kV lines are overloaded at certain Ontario to New York transfer levels. The Western
New York Public Policy Transmission Projects reduce the overloads on the 115 kV lines, but they do
not necessarily eliminate the overloads at certain transfer levels. Therefore, Transmission Owners
may identify additional 115 kV upgrades in future LTPs.
24 The NYISO readily identified and backed out those elements of the Developer’s projects that were included to address the pre-existing non-BPTF overloads on lines #54, #193 and #194. 25 See OATT Section 31.2.1.1.2.1.

Western New York Public Policy Transmission Planning Report | 70
4. Conclusions and Recommendations
4.1 Summary of Project Evaluations
In determining which of the proposed Public Policy Transmission Projects is the more efficient
or cost effective solution to satisfy the Public Policy Transmission Need, the NYISO considers each
Public Policy Transmission Project’s total performance under all of the selection metrics (described
in Section 3 of this report). The evaluation includes scenarios which modify the assumptions to
evaluate the proposed Public Policy Transmission Projects according to the selection metrics and
the impact on NYISO wholesale electricity markets.
4.1.1 Summary of Evaluation Results
Below is a brief summary of the evaluation results for each of the ten Western NY Public Policy
Transmission Projects.26
T006: North America Transmission Proposal 1
Dysinger – Stolle Road 345 kV line proposed on existing ROW, and a new 345/115 kV transformer proposed at Stolle Road substation;
The estimated cost by SECO is the lowest;
The estimated project schedule by SECO is the shortest at 40 months;
The cost per MW ratio is relatively lower, and the production cost saving over cost ratio is relatively higher;
Good operability and expandability.
T007: North America Transmission Proposal 2
Dysinger - Stolle Road and Stolle Road - Gardenville 345 kV lines proposed on existing and new ROW;
The estimated cost by SECO is in the middle of the range;
The estimated project schedule by SECO is 59 months;
The cost per MW ratio is relatively lower, and the production cost saving over cost ratio is on the average side;
Good operability and expandability.
26 The evaluation metrics are listed in no particular order.

Western New York Public Policy Transmission Planning Report | 71
T008: North America Transmission Proposal 3
Two Dysinger - Stolle Road 345 kV lines and one Stolle Road - Gardenville 345 kV line proposed on existing and new ROW;
The estimated cost by SECO is on the high side of the range;
The estimated project schedule by SECO is 65 months;
The cost per MW ratio and production cost saving over cost ratio are on the average side;
Good operability and expandability.
T009: North America Transmission Proposal 4
Two Dysinger - Stolle Road 345 kV lines, one Stolle Road - Gardenville 345 kV line, and one Niagara - Dysinger 345 kV line proposed on existing and new ROW;
The estimated cost by SECO is the highest;
The estimated project schedule by SECO is the longest at 71 months;
The cost per MW ratio is above average, and the production cost saving over cost ratio is below average;
Good operability and expandability.
T011: National Grid Moderate Power Transfer Solution
115 kV system upgrades proposed on existing ROW, and 61/64 tower separation proposed;
The estimated cost by SECO is one of the lowest;
The estimated project schedule by SECO is 57 months;
The cost per MW ratio is the highest, and production cost saving over cost ratio is the lowest;
Fair operability and expandability.
T012: National Grid High Power Transfer Solution
Niagara - Gardenville 230 kV line proposed on existing ROW, 115 kV system upgrades proposed on existing ROW, and 61/64 tower separation proposed;
The estimated cost by SECO is one of the highest;
The estimated project schedule by SECO is 60 months;
The cost per MW ratio is close to average, and the production cost saving over cost ratio is well below average;
Good operability and fair expandability.

Western New York Public Policy Transmission Planning Report | 72
T013: NYPA/NYSEG Western NY Energy Link
Dysinger–Stolle Road 345 kV line proposed on existing ROW, two 345/230 kV transformers added at Stolle Road substation, and reconductoring of Stolle Road–Gardenville 230 kV line proposed;
The estimated cost by SECO is in the middle of the range;
The estimated project schedule by SECO is one of the shortest at 44 months;
The cost per MW ratio is relatively lower, and the production cost saving over cost ratio is relatively higher;
Good operability and expandability.
T014: NextEra Energy Transmission New York Empire State Line Proposal 1
Dysinger- East Stolle Road 345 kV line proposed on existing ROW or new ROW as an alternative;
The estimated cost by SECO is one of the lowest;
The estimated project schedule by SECO is the shortest at 40 months;
The cost per MW ratio is relatively lower, and the production cost saving over the cost ratio is the highest when considering the various scenarios evaluated;
Excellent operability and expandability.
T015: NextEra Energy Transmission New York Empire State Line Proposal 2
Dysinger-East Stolle Road 345 kV line proposed on existing ROW or new ROW as alternative;
The estimated cost by SECO is one of the lowest;
The estimated project schedule by SECO is the shortest at 40 months;
The cost per MW ratio is relatively lower, and the production cost saving over the cost ratio is relatively higher;
Good operability and expandability.
T017: Exelon Transmission Company Niagara Area Transmission Expansion
Niagara - Stolle Road 345 kV line proposed on existing and new ROW;
The estimated cost by SECO is in the middle of the range;
The estimated project schedule by SECO is one of the longest at 66 months;
The cost per MW ratio and production cost saving over the cost ratio are average ;
Fair operability and expandability.

Western New York Public Policy Transmission Planning Report | 73
Table 4-1 provides a summary of results for each metric evaluated for the Western NY Need
and is color-coded such that the best values are highlighted green, average values are highlighted in
yellow, and low values are highlighted in red. This table does not comprehensively cover all
evaluations documented in this report, but offers a high-level summary of the relative performance
of each project for each metric using the primary study assumptions. No single metric or set of
assumptions acts as a deciding factor in determining the more efficient or cost effective
transmission solution.

Western New York Public Policy Transmission Planning Report | 74
Table 4-1: Summary of Results
Notes:(1) Transfer scenario with series reactors on Packard-Huntley lines in-service for all projects(2) MAPS scenario 2 with series reactors on Packard-Huntley lines in-service for all projects

Western New York Public Policy Transmission Planning Report | 75
4.1.2 Tiered Ranking
Based on the NYISO staff’s consideration of all the evaluation metrics for efficiency or cost
effectiveness, the Western New York Public Policy Transmission Projects are divided into two tiers
based on their performance relative to their cost. Three metrics that significantly impacted this
tiered ranking for these proposed transmission projects are (1) the total capital cost, (2) the
production cost savings relative to the total capital cost, and (3) the cost per MW ratio for the
increased Ontario to New York thermal transfer limits over the Niagara Ties. Projects T006, T013,
T014, and T015 are Tier 1 projects because they have the lowest comparative capital costs, highest
production cost savings relative to their capital costs, and the lowest cost per MW of transfer
capability, as well as overall superior performance on all of the metrics, as documented above.
The objective of this planning process under FERC Order No. 1000 is to identify the more
efficient or cost effective transmission solution to the identified need, which does not necessarily
equate to the least cost solution. However, the total capital cost of the project is a highly important
factor to consider independently and in considering the project’s electric system performance. The
four Tier 1 projects are among the five lowest cost projects. Other Tier 2 projects may be less
expensive but have fewer benefits or may be more expensive without having sufficient
corresponding benefits. These observations are captured primarily through the projects’
production cost savings and transfer limit increases.
While there is no requirement for any project to exceed any specific threshold for the ratio of
production cost savings over the total capital cost of the project, a ratio value greater than or equal
to 1.0 indicates significant economic advantages for such a project. The four Tier 1 projects achieve
significant production cost savings resulting in a ratio of 1.0 or greater, while the remaining Tier 2
projects result in a ratio lower than 1.0 due to less benefits and/or higher costs.
For the purpose of calculating cost per MW, the NYISO calculated the Ontario to New York
thermal transfer limits across the Niagara ties for each project and compared that to the total
capital cost, as described in Section 3. NYISO staff observed a tight grouping of the same four Tier 1
projects in the range of 0.11 to 0.16 $M/MW, while other projects exhibited diminishing MW
benefits for each dollar spent. These findings support assigning the top four projects to Tier 1.

Western New York Public Policy Transmission Planning Report | 76
Listed below are the two Tiers and the projects assigned to each category:27
Tier 1 projects:
T006: North America Transmission Proposal 1
T013: NYPA/NYSEG Western NY Energy Link
T014: NextEra Energy Transmission New York Empire State Line Proposal 1
T015: NextEra Energy Transmission New York Empire State Line Proposal 2
Tier 2 projects:
T007: North America Transmission Proposal 2
T008: North America Transmission Proposal 3
T009: North America Transmission Proposal 4
T011: National Grid Moderate Power Transfer Solution
T012: National Grid High Power Transfer Solution
T017: Exelon Transmission Company Niagara Area Transmission Expansion
4.2 Ranking
Based on consideration of all the evaluation metrics for efficiency or cost effectiveness, together
with input from stakeholders, the NYISO staff ranked the ten projects. The relative ranking was first
developed by comparing projects’ performance in pairs, and then the differences were identified to
distinguish projects.
Critical comparison and the resulting ranking are summarized below for the projects in Tier 1:
T014 and T015 are identical projects except that T014 includes a PAR at Dysinger 345 kV substation. The benefits provided by tying seven 345 kV lines into a single hub and from installing the PAR far exceed the cost to procure the equipment. These benefits include increased production cost saving, increased transfer capability, and improved operability for the system. As a result, T014 was ranked higher than T015.
T015 and T006 are comparable in project design and in many metrics. However, T015 cuts out the 345 kV loop to Somerset and results in greater production cost saving relative to cost especially in MAPS scenario 2 (series reactors on Packard – Huntley 230 kV lines in service). Therefore, T015 was ranked higher than T006.
T006 was compared against T013. With the NYISO-controlled series reactors on Packard-Huntley 230 kV lines in-service, T006 performs better in cost per MW and production cost saving relative to the cost. Therefore, T006 was ranked higher than T013.
27 The individual lists are in order by project number; the order is not indicative of their final ranking.

Western New York Public Policy Transmission Planning Report | 77
T013 was compared against T014. T014 has better operability with the 345 kV PAR and cuts out the 345 kV loop to Somerset. Moreover, the production cost savings over cost ratios among different scenarios are higher than T013. Therefore, T014 was ranked higher than T013.
Comparison among Tier 2 projects was also conducted and summarized below:
T007, T008, and T009 were also proposed by North American Transmission with increasing network components, project costs, and project schedule. The increasing components do provide additional benefits, but the incremental benefits are not sufficient to offset the additional project cost and the risk associated with acquiring extra ROW.
T017 was compared against T008 and T009. T017 performs better than T008 and T009 in cost per MW metric, and it also performs better in production cost saving relative to the cost. However, T008 and T009 demonstrate better operability and expandability, and thus T017 was ranked between T008 and T009.
T012 demonstrates certain benefits in some metrics, but its performance is not great relative to its high cost. Therefore, T012 was ranked lower than all of the projects except for T011.
While T011 strengthens the 115 kV network in Western New York, it is not very efficient or cost effective in improving the bulk system performance.
Taking all the metrics into consideration, the overall ranking of the projects is summarized in
Table 4-2.
Table 4-2: Overall Ranking
Tier Ranking Project ID Developer Project Name
1
1 T014 NextEra Energy Transmission New York Empire State Line Proposal 1
2 T015 NextEra Energy Transmission New York Empire State Line Proposal 2
3 T006 North America Transmission Proposal 1
4 T013 NYPA/NYSEG Western NY Energy Link
2
5 T007 North America Transmission Proposal 2
6 T008 North America Transmission Proposal 3
7 T017 Exelon Transmission Company Niagara Area Transmission Expansion
8 T009 North America Transmission Proposal 4
9 T012 National Grid High Power Transfer Solution
10 T011 National Grid Moderate Power Transfer Solution

Western New York Public Policy Transmission Planning Report | 78
4.3 Selection Recommendation
Based on consideration of all the evaluation metrics for efficiency or cost effectiveness,
together with input from stakeholders, the NYISO staff recommends for selection T014 – Empire
State Line Proposal 1 as the more efficient or cost effective transmission solution to satisfy the
Western New York Public Policy Transmission Need. Based on the project schedule evaluated by
SECO, the in-service date for the selected project is June 2022.
Compared with other Tier 1 projects, T014 more efficiently utilizes both the existing and
proposed transmission facilities. The proposed Dysinger substation would become the new 345 kV
hub in Western New York where seven 345 kV lines are connected, and electrically reduce the
distance for the existing Niagara to Rochester 345 kV transmission corridor. The proposed PAR at
the Dysinger substation provides additional operational flexibility by providing a new level of
controllability to power flows on the 345 kV network. Furthermore, the estimated overnight capital
cost for T014 is among the lowest of the Tier 1 projects. Combining the physical design and the
overnight capital cost, T014 demonstrates relatively lower cost per MW ratio among the projects
and the highest production cost saving over the cost ratio across all scenarios. Even when the
proposed PAR is bypassed, T014 still demonstrates significant benefits. Based on SECO’s evaluation,
there are no critical risks identified regarding siting, equipment procurement, real estate
acquisition, construction, and scheduling. Therefore, the NYISO staff determined that T014 is both
the more efficient and cost effective transmission solution to satisfy the Western NY Public Policy
Transmission Need.
4.4 Next Steps
Following the approval of this report by the Board of Directors, the NYISO will tender a
Development Agreement to the Developer of the selected transmission project that is based upon
the project in service date.28 The Development Agreement will reflect a project milestone schedule
under which the Developer of the selected project will complete the interconnection process, apply
for Article VII siting and other necessary permits and authorizations, enter into an Operating
Agreement with the NYISO, and bring the project into service.
28 See OATT Section 31.4.12.2.

Western New York Public Policy Transmission Planning Report | 79
Appendices
Appendix A – Public Policy Transmission Planning Process Glossary
Appendix B – Western New York Public Policy Transmission Planning Need Viability and Sufficiency
Assessment
Appendix C – Phase 2 Selection Assumptions
Appendix D – SECO Report
Appendix E – Market Monitoring Unit Report
Appendix F – Additional Analysis Results