westlife development limited - aceanalyser meet/105533_20141107.pdf · • this document or...
TRANSCRIPT

Westlife Development Limited November 2014
1
• This document or presentation has been prepared by, and is proprietary to, Westlife Development Limited and its subsidiary (“The Company”)
• This presentation does not constitute or form part of any offer or invitation to sell, or any solicitation of any offer to purchase or subscribe for or otherwise
acquire, any securities in the Company or in the other entities referred to herein or in its or their respective affiliates or associates, nor shall it or any part of it
form the basis of or be relied on to any extent or in any manner in connection with any contract therefore or in relation thereto
• The information and opinions contained in this presentation are provided as at the date of this presentation and are subject to change without notice. The
information in this presentation has not been verified by the Company, its advisors or any other person and is subject to updating, revision and amendment.
No representation or warranty, express or implied, has been, is or will be given by the Company, any of its affiliates or any of their respective advisers,
directors, officers, employees, associates or agents, as to the accuracy, reliability or completeness of the information or opinions contained in this
presentation or in any revision of the presentation or of any other written or oral information made or to be made available to any interested party and no
reliance should be placed on them. To the extent permitted by law or regulation, none of them accepts any liability whatsoever for any loss howsoever
arising, directly or indirectly, to any extent and in any manner whatsoever to any person from any use of this presentation nor its contents or any part
thereof have been cleared or approved by any regulatory, statutory or government authority, agency or body located in any country, territory or
jurisdiction and that none of the aforesaid shall be responsible to any extent or in any manner for the same
• Neither this presentation nor any copy of it may be taken, transmitted or distributed, directly or indirectly, into Canada, Australia, Japan, South Africa, the
United Kingdom and the Republic of Ireland or the United States of America, its territories or possession or passed to US persons (as defined in Regulation S of
the United States Securities Act of 1933 (as amended)), United States residents, corporations or other entities or individuals or entities in Japan, Canada, Australia, South Africa, the United Kingdom or the Republic of Ireland, save pursuant to an applicable exemption. Neither this presentation nor any copy of
it may be taken or transmitted into any jurisdiction outside India or distributed to persons with addresses outside India. Distribution on this presentation in the
United States may constitute a violation of United States securities law and the distribution of this presentation in or to persons subject to such other
jurisdictions set out may be restricted by law set out herein may be restricted by law and persons into whose possession this document comes should inform
themselves about, and observe, any such jurisdictions. Any failure to comply with these restrictions may constitute a violation of the laws of the relevant
jurisdiction, attracting penal consequences
• This presentation contains forward-looking statements in the nature of certain operational and financial projections, and those who view or access or come
across this presentation are cautioned that actual results could differ from those in such projections
• All those who view or who otherwise come across or who have otherwise have access to this presentation shall, in consideration of being made aware of
the contents hereof, be irrevocably bound to keep such contents strictly confidential and not disclose them to any extent in any manner to any third party.
• All those who may view or come across or otherwise have access to this presentation shall be irrevocably deemed to have been fully aware of and to
have fully understood and accepted this disclaimer
disclaimer
2

Highest Annual Sales Per Store
Fortune India 2011
Interbrand 2013 World’s 7th most valuable brand
Most Admired Company – Fortune 2014
McDonald’s leads globally
3
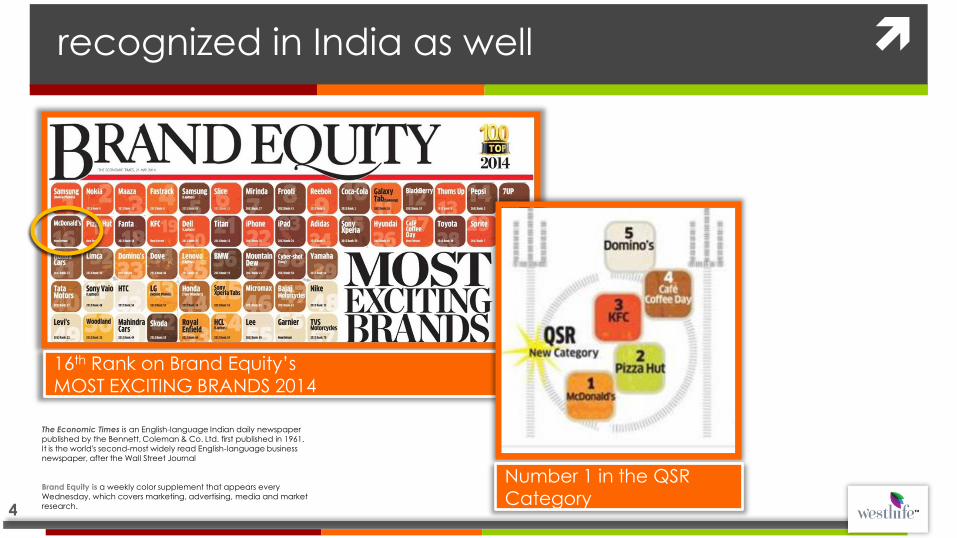
16th Rank on Brand Equity’s MOST EXCITING BRANDS 2014
The Economic Times is an English-language Indian daily newspaper
published by the Bennett, Coleman & Co. Ltd. first published in 1961.
It is the world's second-most widely read English-language business
newspaper, after the Wall Street Journal
Brand Equity is a weekly color supplement that appears every
Wednesday, which covers marketing, advertising, media and market
research.
Number 1 in the QSR Category
recognized in India as well
4

HRPL BACKGROUND :
•Started as a Joint Venture in 1995 •Ownership status changed to DL* in May 2010 •DL develops sites at their own cost and pays
a royalty
MFA# KEY HIGHLIGHTS : •Right to own and operate McDonald’s
restaurants in Western and Southern India until 2030
• HRPL pays royalty and fees to McDonald’s
Corporation
First Restaurant in
Mumbai, 1996
HARDCASTLE RESTAURANTS
PVT. LTD.
(HRPL )
West and South
CONNAUGHT PLAZA
RESTAURANTS PVT. LTD.
(CPRL)
North and East
*DL: Development Licensee A Development Licensee, in the context of McDonald’s, means an entity which is granted franchise rights, by McDonald’s Corporation or its affiliates, to own and operate McDonald’s restaurants, to adopt and use the McDonald’s system to develop and run McDonald’s restaurants in a given area, and to advertise and use the McDonald’s brand name and trademarks for products sold at such restaurants. •Map of India is indicative # MFA : Master Franchise Agreement
5

ownership structure
Westlife Development Ltd
(BSE : 505533)
100% Hardcastle
Restaurants Pvt. Ltd.
FII and Public
38% Promoter
Group
62%
Shareholding Pattern*
*As at Sep 30, 2014
• On 19 July, 2013, Bombay High Court approved a scheme of arrangement making HRPL a direct subsidiary of Westlife Development. Post issuance of shares pursuant to the scheme, the number of shares expanded to ~155 Mio. Also, on July 23rd, the Board of Westlife approved a preferential allotment of ~5.4m equity shares to Arisaig India Fund at an issue price of Rs. 333.05 per share aggregating to Rs. 1.8bn (~US$30m) • Post the Preferential allotment, Arisaig India Fund had ~3.47% stake invested at a valuation of Rs. 50+ Billion. The fund raised would be used for financing the capital expenditure, working capital requirements and general corporate purposes of the Company and its subsidiaries
6

building the eco system 1995-2012
1995-2012
Glocal 1995-96
Building the
FOUNDATION 1997-2003
GROWING the Category
2003-2012
7

building the eco system
glocal: cultural sensitivity
Only country to have
SEPARATE Vegetarian and
Non Vegetarian Kitchens
8

building the eco system
glocal: menu localization
Local tastes like “Aloo Tikki” in a uniquely McDonald’s form
Adapting popular
forms like the
PUFF
McAloo Tikki
Chicken McGrill
Pizza McPuff
9

building the eco system
glocal: building a local supply chain
Developed a
cold chain
Global suppliers with
local production
Creating direct linkage
to the farms
10
Over 95% localization

building the eco system
glocal: developing sustainable unit economics
• Local supply chain for equipment
• Right Sizing Restaurants • Optimizing Kitchen Capacity
• Over 95% of produce locally sourced
• Tax Rationalization • Increased supplier capacity through
3rd party business
2003
1996
2003
-X%
2240 basis points improvement 1X
0.4X
Average Development Cost Restaurant Operating Margins
19
96
* Graphs not to scale, for representational purpose only
11

creating the category Quick Service Restaurants (QSR)
12

creating the category
nascent category in 2003
Eating out was an
occasion
Of the 100 eating
occasions in a month, people were eating
out only 3 times*
‘Housewives’
Our Number 1 competitor
* Source: Brand Track, Mumbai
13

creating the category
driving up the average unit volume
CONVENIENCE For servicing all
occasions
VALUE For driving new
users and
frequency
MENU To provide
modern choices
for all day parts
14

creating the category
value: building block approach
Everyday
Affordability Filling
Affordable
Meals Place
to
refuel
2004 2009 2012
15

creating the category
through new stores and brand extensions
McDelivery Breakfast Kiosk
For all OCCASIONS that
the customer eats out
And for all
DAY PARTS
Across CUSTOMER segments
18
55
130
1996-2003 2004-2008 2009-2012
Store Count
16

creating the category
menu: modern choices with taste that consumers like
Chicken
McNuggets
2010
McFlurry
2011
McEgg
2012 Spice Fest
2012
McSpicy
2011
McAloo Tikki
2004
Breakfast
2009
17

creating the category
we drove the growth in the category
3
7.8
2003 2012
IEO Monthly Frequency, MUMBAI
1x
1.74 x
2003 2012
HRPL Average Volume Growth
Per Annum
(INR Mio)
* Source: Brand Track, Mumbai
IEO : Informal eating Out
18

grow and dominate 2013 onwards
19

changing profile of category
QSR moved
from being an
occasion to a
destination to
refuel
As a Fad As a
status symbol
As a
necessity
2003 2009 2014
20
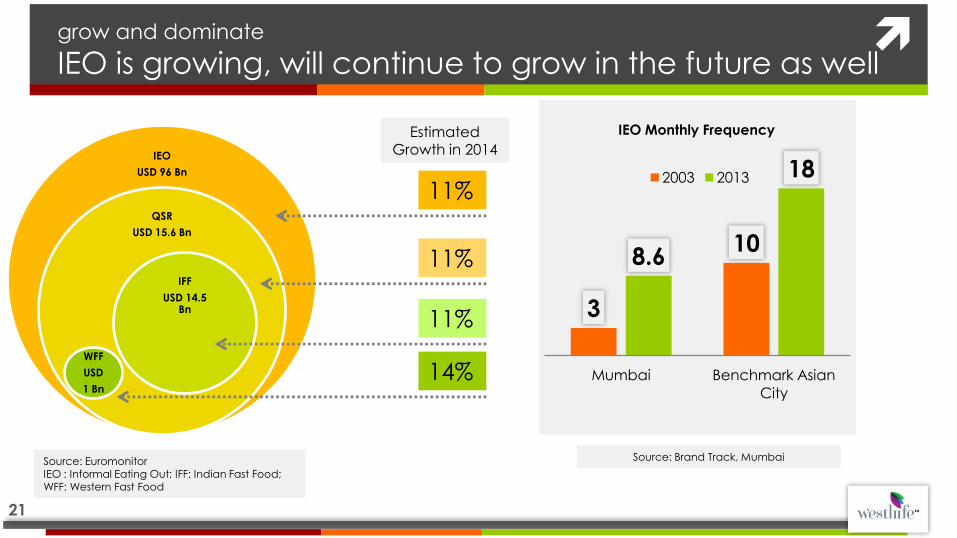
IEO
USD 96 Bn
QSR
USD 15.6 Bn
IFF
USD 14.5 Bn
WFF
USD
1 Bn
11%
11%
11%
14%
Estimated Growth in 2014
grow and dominate
IEO is growing, will continue to grow in the future as well
3
10 8.6
18
Mumbai Benchmark Asian
City
IEO Monthly Frequency
2003 2013
Source: Euromonitor IEO : Informal Eating Out; IFF: Indian Fast Food; WFF: Western Fast Food
Source: Brand Track, Mumbai
21

60% of the population below
the age of 30
Western fast food driven by
Teens and YANKS
Macro factors will drive further growth
1x
1y 1z
1.7x
1.8y 2.8z
IEO IFF WFF
2008 2013
Source: Euromonitor Graph not to scale, for representation purpose only
22 22

levers for growth over the next 5 years
23

levers for growth
1. Broadening Accessibility
3. Margin
Expansion
2. Growing Baseline
Sales
4. Growth through people
24

broadening accessibility
Grow store
footprint
Unit
Economics
25
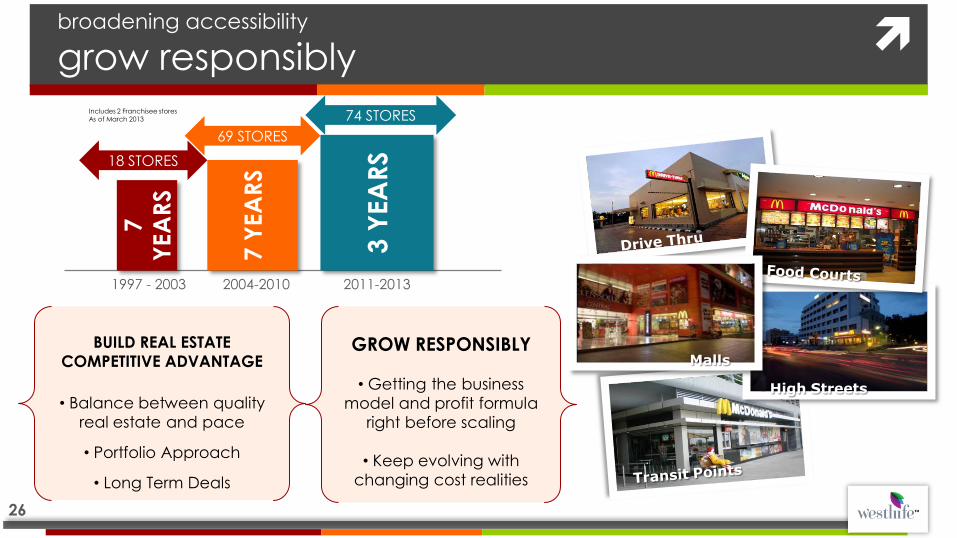
High Streets
broadening accessibility
grow responsibly
BUILD REAL ESTATE
COMPETITIVE ADVANTAGE
• Balance between quality
real estate and pace
• Portfolio Approach
• Long Term Deals
Includes 2 Franchisee stores As of March 2013
Malls GROW RESPONSIBLY
• Getting the business
model and profit formula
right before scaling
• Keep evolving with
changing cost realities
7
YEA
RS
7 Y
EA
RS
3 Y
EA
RS
18 STORES
69 STORES
74 STORES
1997 - 2003 2004-2010 2011-2013
26

broadening accessibility
building unit economics
Average investment of INR 25-30 Mio
Stores typically need 2-3 years to establish,
depending upon the brand
awareness in the city
Year 3:
Sales: INR 40-50 Mio
Cash ROI: 22% - 25%

1/3 of Key,
Core and Non Core Cities Un-
penetrated
Balance
Potential of
600+ stores
Basis Global Index of an Asian city
1.32 restaurants per 100,000 people
190 Cities untapped in our region, since
current presence in 20 cities
broadening accessibility
improve brand access

Tamil Nadu
12 Stores
Chattisgarh 0 Stores
Madhya Pradesh 3 Stores
Kerala 3 Stores
Gujarat 22 Stores
Telangana 17 Stores
Karnataka 44 Stores
Maharashtra
91 Stores
Significant potential in existing towns
and cities
Most cities and towns significantly
under penetrated
Indicates the number of stores in each state as
of September 2014 29

7 Y
EA
RS
7 Y
EA
RS
3 Y
EA
RS
1997 - 2003 2004-2010 2011-2013
NEX
T 5
YEA
RS
175 – 250 Stores
74 STORES
69 STORES
18 STORES
2014 Onwards
175 - 250 new stores over the next 5 years
30
Years denote fiscal years

growing base line
Value
Menu
Brand
Extensions
31

Making the brand ACCESSIBLE in NEW MARKETS
providing VALUE FOR MONEY, not a price point
Ad
din
g N
EW
USER
S t
o t
he
bra
nd
in
EX
ISTI
NG
ma
rke
ts
32

growing base line
new menu platforms
Platforms that leverage EXISTING
INVESTMENTS and capacity
Providing modern choices to
consumers of today
33

growing base line
brand extensions
Brand extensions will continue to add to the baseline as our
offerings and reach grow
75-150 McCafé's over the next 3-5 years
24/7 McDelivery Service Breakfast Dessert Kiosks 34

re-imaging with brand extensions
Modernize the customer experience through restaurant re-imaging initiatives
Providing contemporary restaurant designs & relevant
experience to our consumers
35

Base Line Value Menu Brand
Extensions
QSC Increased
Base Line
growing base line
through occasions, day parts and customer segments
Graph not to scale, for representation purpose only
36
margin expansion
37

margin expansion
operating leverage
Bulk of the cost incurred for operating In Store
Adding brand extensions helps grow sales, while optimizing assets
Diagram representative, not indicative of size of impact
In-store Business
McCafé
24 Hours
Breakfast McDelivery
Menu Management
Leverage cost
through scale
via effective
supply chain
management

margin expansion
operating leverage
Building block on margin
All levers of the
business model
coming together
EBITDA Gross
Margin
Operating
Leverage
Royalty G&A EBITDA
Graph not to scale, for representation purpose only
39

people
40
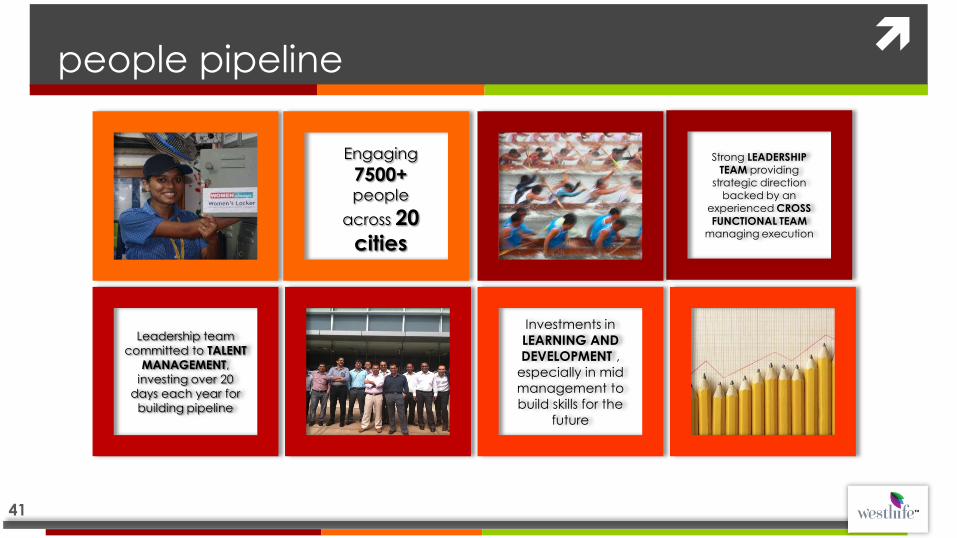
people pipeline
Strong LEADERSHIP TEAM providing
strategic direction backed by an
experienced CROSS
FUNCTIONAL TEAM managing execution
Leadership team
committed to TALENT
MANAGEMENT,
investing over 20
days each year for
building pipeline
Investments in
LEARNING AND
DEVELOPMENT ,
especially in mid
management to
build skills for the
future
Engaging
7500+ people
across 20
cities
41
42
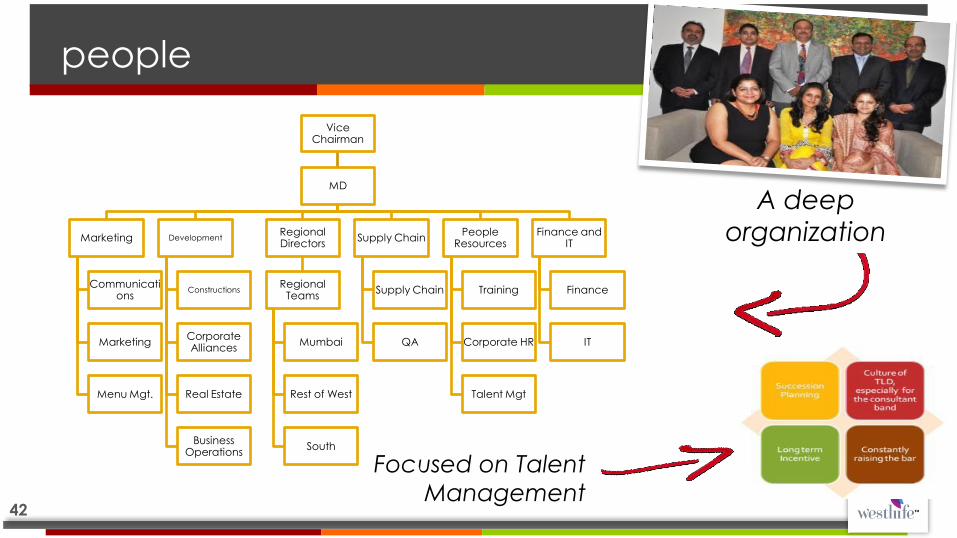
Vice Chairman
MD
Marketing
Communications
Marketing
Menu Mgt.
Development
Constructions
Corporate Alliances
Real Estate
Business Operations
Regional Directors
Regional Teams
Mumbai
Rest of West
South
Supply Chain
Supply Chain
QA
People Resources
Training
Corporate HR
Talent Mgt
Finance and IT
Finance
IT
people
A deep
organization
Focused on Talent
Management

175-250 new stores
in the next 5 years
Growing baseline
Margin Expansion
People
in summary
43

financial summary
44

store growth, sales and comparable sales trends
55 74 87 107 130
161 184
10 20 14 21 24
32 29
-100
-80
-60
-40
-20
0
20
40
0
20
40
60
80
100
120
140
160
180
200
FY08 FY09 FY10 FY11 FY12 FY13 FY14
Total Stores New Stores
1,604 2,104 2,772 3,793
5,445
6,810
7,384
41%
31% 32% 37%
44%
25% 8%
0%
5%
10%
15%
20%
25%
30%
35%
40%
45%
50%
(1,000)
-
1,000
2,000
3,000
4,000
5,000
6,000
7,000
8,000
FY08 FY09 FY10 FY11 FY12 FY13 FY14
Sales ( INR Mio) Sales Growth %
29% CAGR
45
19% 9% 12%
17% 22%
6%
-6% FY08 FY09 FY10 FY11 FY12 FY13 FY14
Comps%

margin trajectory
46
54.7%
56.0% 56.7%
57.1%
55.6% 55.0%
57.0%
53.5%
54.0%
54.5%
55.0%
55.5%
56.0%
56.5%
57.0%
57.5%
FY08 FY09 FY10 FY11 FY12 FY13 FY14
Gross Margin %
76 52 120 400
672 627 490
4.8% 2.5%
4.4%
10.5% 12.3%
9.2%
6.6%
0.0%
2.0%
4.0%
6.0%
8.0%
10.0%
12.0%
14.0%
-
100
200
300
400
500
600
700
800
FY08 FY09 FY10 FY11 FY12 FY13 FY14
INR Mio
EBITDA EBITDA %

general & administration (G&A)
-
1,000
2,000
3,000
4,000
5,000
6,000
7,000
8,000
0.00%
1.00%
2.00%
3.00%
4.00%
5.00%
6.00%
7.00%
8.00%
9.00%
10.00%
FY09 FY10 FY11 FY12 FY13 FY14
G&A Headcount 47

established model for tapping into the
potential
Real Estate
portfolio array
Provides competitive
differentiation
World’s
Largest QSR Brand
Brand connect with the target audience
Favorite Place and way
to eat
48
Indigenous Supply Chain for competitive
advantage
Farm to FORK

thank you
49