westminster housing market analysis november
TRANSCRIPT

Westminster Housing Markets Analysis
Summary Report
Clients: City of Westminster December 2014
Berkshire House
252-256 Kings Road, Reading RG1 4HP
T: 0118 938 0940
M: 07881 348 244
Wessex Economics Ltd Berkshire House 252-256 Kings Road Reading RG1 4HP T: 0118 938 0940 Contact: [email protected]

Westminster Housing Market Analysis November 2014
Westminster Housing Market Analysis November 2014
Table of Contents
1. Introduction .............................................................................................................................................................. 3
2. National Planning Policy Guidance ........................................................................................................................... 4
3. The Distinctive Characteristics of the Westminster Housing Market ....................................................................... 5
4. Overview of Housing Requirements and Housing Delivery ..................................................................................... 6
5. Affordable Delivery, Future Requirements and Maximsing Supply ......................................................................... 9
6. Student Housing ...................................................................................................................................................... 13
7. The Mayor’s Housing Strategy ................................................................................................................................ 13

Westminster Housing Market Analysis November 2014

Westminster Housing Market Analysis November 2014
3
1. Introduction
1.1 This report was commissioned by the City of Westminster to inform the development of housing
polices in Westminster. Wessex Economics was asked to research and provide policy advice on a
range of topics. The overall scope of work can be summarised in the form of 7 questions:
Is the methodology for housing market analysis set out in National Planning Policy Guidance
appropriate given the many unique features of the housing market Westminster?
What are the distinctive characteristics of the Westminster housing market that need to be
given special consideration in developing housing and planning strategy for the City?
What quantum of housing is required over the next 20 years in Westminster to meet
demographic needs and how does this compare with past patterns of housing delivery?
What is the need for affordable housing, including the overall number of homes required, and
the size, type and tenure mix of such housing?
Given the presence of many major Higher Education Institutions in the City, is there a need to
provide additional student housing in Westminster?
What are the longer term prospects for change in the housing market in Westminster? What are
the drivers of change and areas of uncertainty?
What are the implications of the Mayor’s emerging Housing Strategy?
1.2 Throughout this report reference is made to a number of types of housing that can be differentiated
in terms of the types of household they are intended to accommodate. Figure 1 provides a glossary
of different terms used in the report.
Figure 1: Glossary of Housing Terminology
1. Market Housing: Existing or new homes built that are sold without any restriction on who buys them.
They may be bought by owner occupiers or investors, so market homes will either be owner occupied or privately rented property.
2. Affordable Housing: Housing that is provided to eligible households whose needs are not met by the market, with eligibility determined with regard to local incomes and local house prices. This includes social rented, affordable rented and intermediate housing (see definitions below).
3. Social Rented Housing: Housing owned by local authorities and private registered providers for which
guideline target rents are determined through the national rent regime. Such rents are set at below market rents and rental increases are set by a Government determined formula. In the Mayor’s emerging housing strategy this form of housing is broadly equivalent to what the Mayor refers to as ‘capped affordable rent housing’ (see below).
4. Affordable Rented Housing: Affordable rented housing is let by local authorities or private registered
providers of social housing to households who are eligible for social rented housing. Affordable rented housing is subject to rent controls that require a rent to be no more than 80% of the local market rent (including service charges, where applicable). In the Mayor’s emerging housing strategy this form of housing is broadly equivalent to what the Mayor refers to as ‘discounted affordable rent housing’.
5. Social Housing: This phrase is used to cover both social rented housing and affordable rented housing.
To a large extent these two housing tenures are very similar in that both may be used to house people in similar circumstances.
6. Intermediate Housing: homes for sale or rent provided at a cost above social rent, but below market

Westminster Housing Market Analysis November 2014
4
levels subject to the criteria in the Affordable Housing definition above. These can include shared ownership (part ownership, part rent) or shared equity (where part of the equity in the home is owned by someone other than the occupier), other low cost homes for sale and intermediate rent, but not affordable rented housing. In the Mayor’s emerging housing strategy, the Mayor’s reference to Low Cost Home Ownership (LCHO) falls under this category of intermediate housing.
7. Private Rented Housing (PRS) Housing for Benefit Claimants: Private Rented Sector (PRS) housing
occupied by those who receive Housing Benefit to enable them to pay their rent to a private sector landlord. Generally those occupying PRS Housing for Benefit Claimants have a similar profile to those housed in social rented and affordable rented housing.
8. Housing Requirement: The overall requirement for new homes, both market and affordable housing, in
a particular Local Authority Borough, within a defined time frame.
9. Housing Need: The number of people in need of affordable housing. This is broken down into the need for subsidised rent housing, comprising social rented, affordable rented, and PRS housing for benefit claimants; and the need/demand for intermediate housing, which may be further broken down into demand/need for LCHO and intermediate rent products.
The Mayor’s Housing Strategy sets out proposals for three types of affordable housing provision, but uses slightly different terminology and indicates both the type of affordable housing product and who the Mayor envisages will be housed by each product. The way that each product is described is set out below. The text in bold is how each product is referred to in this report. A. The Mayor’s LCHO product: Low Cost Home Ownership is to account for 40% of the Mayor’s
affordable housing target. This will ‘primarily be flexible low cost home ownership products. This will be a mixture of shared ownership, shared equity, rent-to-save, or other intermediate models’
B. The Mayor’s Capped Affordable Rent Product: Half of the affordable homes to rent (30% of the Mayor’s affordable housing target) are to be provided at capped rents targeted at those most in need.
C. The Mayor’s Discounted Affordable Rent: The other half of all affordable homes to rent (30% of the Mayor’s affordable housing target) are to be provided at discounted rents, set at no more than 80 per cent of market rent and prioritised for working households.
Sources: Wessex Economics (1, 7, 8, 9); National Planning Policy Framework Annex 2 (2, 3, 4, 6); GLA, Homes for Londoners – the Mayor’s Housing Strategy, draft April 2014.
2. National Planning Policy Guidance
2.1 National Planning Policy Guidance (NPPG) was published in March 2014. It distils 200 pages of
previous guidance of into just 21 pages. The guidance provides much more freedom to local
authorities over how to make an objective assessment of the ‘development needs for housing (both
market and affordable)’. The Guidance indicates that what is expected of local authorities is an
objective and evidence based assessment that identifies ‘the future quantity of housing needed,
including a breakdown by type, tenure and size’.
2.2 However, the NPPG presumes the assessment is being undertaken for the Housing Market Area,
stating that ‘the need for housing in the context of the guidance refers to the scale and mix of housing
and the range of tenures that is likely to be needed in the housing market area over the plan period’.
The appropriate level at which a Strategic Housing Market Assessment (SHMA) should be prepared is
therefore for London as a whole. The Westminster housing market is just one part of the London-
wide housing market.

Westminster Housing Market Analysis November 2014
5
2.3 London is unique in England in having a two tier planning system, with the GLA responsible for
strategic planning. The National Planning Policy Framework (NPPF) and NPPG do not directly
address the respective responsibilities of GLA and Boroughs in Plan making. The GLA clearly has
primary responsibility for preparing a SHMA, since it is the only authority capable of taking a full
London-wide view of the housing needs of the market area as a whole; and the legislative basis of
the GLA means that Boroughs have to prepare their plans in accordance with the London Plan.
2.4 The Greater London SHMA1 makes it clear that London Boroughs are responsible for identifying
housing requirements at a local or sub-regional level in the context of London Plan policy. The NPPG
acknowledges that many housing market areas may have smaller sub-markets with distinctive
features – which is certainly true of Westminster; and that it is appropriate to evidence how those
distinctive features shape the pattern of demand and supply for housing within those sub-market
areas.
2.5 The NPPG is not prescriptive, and therefore allows CoW to identify the particular nature of the
housing market in its area and to craft policies in the light of this analysis. However, these will need
to be in broad conformity to the London Plan. The emphasis of the NPPG is simply that policies must
be based on evidence, and any departures from standard methodologies justified. CoW is therefore
free to determine what evidence it needs to provide to support its housing policies, subject to the
overall requirement of conformity with the London Plan.
3. The Distinctive Characteristics of the Westminster Housing Market
3.1 There is now a well-established and generally accepted methodology for the objective assessment of
overall housing requirements, and the approach can be deemed to be robust at the Housing Market
Area level. The approach becomes less robust when applied to a particular part of the Housing
Market Area, particularly in an area such as London, where the interaction between different sub-
markets is very complex. It is less easy to anticipate future patterns of change in areas with mobile
residents and high levels of ‘churn’.
3.2 The City of Westminster is one such area. Population change in Westminster is subject to much
greater uncertainty than in most other local authority areas due to high levels of both domestic and
international in and out migration. Data on migration is much less robust than the components of
natural population change (births and deaths) and is much less predictable because migration,
particularly international migration, is very susceptible to political and economic change.
3.3 The scale of migration into and out of Westminster is simply illustrated. In 2011 Westminster had a
population of around 120,000 people. In the year to April 2011 around 11% of the population of
Westminster moved out of the City (24,750 people), and 37,400 people moved into the City, the
equivalent of 17% of the April 2011 population. Another 6% of people moved within the City. With
such large annual migration flows, even small changes in the age, sex, and income profile of migrants
can generate significant change in the resident profile of the City. They can also lead to quite rapid
change in other factors, such as birth rates, that determine anticipated population growth.
1 The London 2013 Strategic Housing Market Assessment, GLA, January 2014

Westminster Housing Market Analysis November 2014
6
3.4 Migration patterns at the London level over the past 5 years have been markedly different to those
prevailing in the 5 years before 2008. Prior to the economic downturn in 2008, there was a pattern
of large scale net out-migration of Londoners into the Greater South East; since 2008 these numbers
have dropped significantly. If migration were to revert to the pre-2008 trend, GLA estimate there
would be a need to build 35,000 homes per annum in London over the next 20 years. If the
migration trends remain as they have been since after 2008, the requirement is for 46,000 homes
per annum. A high level of uncertainty therefore characterises forward planning for housing in
London.
3.5 Demographic projections only deal in the age and sex profile of the population and different
household types. A big challenge in projection methodology in a place such as Westminster is how
wealth and income is clearly a major factor in determining who lives and who owns residential
property in Westminster. Changing patterns of home ownership reflected in changing tenure
patterns also have a significant impact on who lives in Westminster. In the last decade, the private
rented sector has grown significantly, and now accounts for 43% of all households (compared to 32%
in 2001), and the proportion of households with permanent residents who are owner occupiers has
fallen from 34% to 30%.
3.6 Around 12% of all homes in Westminster are recorded as having no permanent residents. This is
another feature of the Westminster housing market that distinguishes it from other parts of London
and the rest of the country. The extent to which new homes are bought by those who do not occupy
them on a permanent basis is not known. However, to the extent that this is the case, then these
new homes cannot be regarded as contributing to the demographically assessed need for new
homes in London.
3.7 To summarise, the task of anticipating the pattern of population and household growth in
Westminster is made much harder than in many other parts of London and the UK by high levels of
international and domestic migration, the significant number of homes that are not in permanent
occupation, and the fact that Westminster is just part of the UK’s largest housing market – London.
This would indicate the value of flexibility in strategy development and regular monitoring of change
in the City.
4. Overview of Housing Requirements and Housing Delivery
4.1 The GLA have prepared London wide and Borough level demographic projections through to 2036.
GLA’s central scenario for London indicates a demographically driven requirement for provision of
40,000 additional homes per annum in the period 2011-36, but with a much higher average annual
requirement in the first 10 years of the period (50,000 new homes 2011-16, and 43,000 homes pa in
2016-21).
4.2 The latest GLA thinking, undertaken as part of the process of Further Alterations to the London Plan
(FALP), implies a requirement to provide around 49,000 to 62,000 new homes in London per annum,
which includes allowance for catch up on the backlog of under-provision. The new GLA Strategic
Housing Land Availability Assessment identifies capacity for only 42,000 dwellings pa – some 7,000
and 20,000 homes per annum short of assessed need.
Westminster Housing Market Analysis November 2014
7
4.3 Moreover delivery in London has not averaged more than 25,000 homes per annum over the past
decade and longer. These statistics highlight that there is little point at the London level debating
whether the requirement is 40,000 homes or 60,000 homes per annum. The challenge across
London, which applies equally across the whole of England, is about maximising delivery. Similar
considerations apply in Westminster.
4.4 Demographic projections indicate that the City of Westminster needs to plan for provision of some
740 dwellings per annum (dpa) in the period 2011 to 2036, albeit that the requirement is for 1,100
dpa in the period 2011-16, and 800 dpa in the period 2016-212. These figures compare with the
target for provision of 770 dpa contained within the current (2011) London Plan.
4.5 Over the last 14 years, an average of 1,044 housing units per annum have been delivered, comprised
of an annual average total of 823 new self-contained homes, 68 non-self-contained housing units,
and 154 vacant properties brought back into use3. Over the medium term CoW has therefore been
able to deliver more homes than required by the current London Plan and at a higher rate than the
demographically driven long term requirement.
4.6 The GLA has undertaken a high level assessment of capacity for new housing development as part of
the pan-London Strategic Housing Land Availability Assessment (SHLAA), and has agreed with CoW
that there is capacity to deliver 1,068 additional homes per annum in Westminster. The figure of
1,068 homes includes all sources of supply including non-self-contained units and success in bringing
empty property back into use.
4.7 Were Westminster to adopt a target of delivering 1,068 additional housing units per annum, this
would represent a modest 2% uplift on the 14 year average annual rate of delivery (1,044 units pa).
Based on the 10 year average annual rate of delivery (1,017 units pa), the uplift would be a more
substantive 5% increase, but this includes the period covered by the recent market downturn. The
target of delivering 1,068 additional housing units is therefore challenging, but not out of touch with
what has been delivered over the medium term in the City.
4.8 Achievement of the 1,068 target for additional housing supply will be assisted by the fact that the
demand for market homes from investors and owner occupiers in Westminster is robust, and likely
to remain so into the future. However, the development process is complex in Westminster because
of the dense urban character of the city, and the interaction between residential and commercial
development markets.
4.9 It must also be acknowledged that the housebuilding industry is currently facing delays in delivery of
materials, skills shortages and cost pressures, at current levels of output. It could take time to build
up to delivery of 1,068 units per annum. Thus, to hit the overall targets for the period 2011-2036,
output might have to exceed the annual average for a number of years to compensate for any years
in which output is below average.
4.10 For all practical purposes the CoW has no control over the occupation or ownership of housing in the
market sector. Specifically CoW has no control over:
whether existing or new homes are bought by investors or owner occupiers;
2 Source: GLA 2013 Round, Household Projections, Central Projections, Wessex Economics – see Main Report, Figure 6
3 Source: City of Westminster

Westminster Housing Market Analysis November 2014
8
whether owner occupied property is lived in permanently or only on an occasional basis (12% of
the housing stock has no permanent occupation);
who lives in privately rented housing, except in so far as it might take on tenancies or enter in
contracts to use privately owned property for housing those in need; or
private sector rents or prices.
4.11 The sole area where the CoW has influence (by and large, not control) over the private sector
housing market is the type of new homes built, the size of new homes, and conversions to residential
use or in sub-division of existing homes. This influence/control is exercised through planning policies
(for example CoW’s Family Housing Zones) and the development control system.
4.12 Analysis of demographic data on household size does not provide any significant insight into the size
and type of market dwellings which will be in demand in Westminster, since demand is driven more
by investors than owner occupiers, and many of these are overseas buyers. In the owner occupied
sector demand is driven as much by income and wealth as household size.
4.13 The development sector will accurately reflect patterns of demand in terms of the proposals it brings
forward for new housing developments. While CoW may appropriately seek to change the dwelling
mix in development schemes, to call for major change in the housing mix of new market homes
would need a very robust evidence base if the developer were to oppose such a change. This
evidence base does not currently exist.
4.14 Seeking major change to development proposals in terms of the size mix of dwellings could also
affect development viability, and hence work against the objective of maximising housing delivery in
Westminster and maximising affordable housing contributions. Therefore there must be robust
reasons for seeking to change the size mix of dwellings in proposals put forward for private housing
development.
4.15 The only issue where CoW should consider whether to seek to change the size mix of residential
development proposals is where development proposals that contain flats with very large floor
plates. The size of such flats mean that the floor area of one flat could be used to secure two, three,
or more conventionally sized flats. Such schemes are uncommon, but not unknown, in Westminster.
4.16 Such proposals reflect demand and offer the developer a premium, but there is an opportunity cost
in terms of achieving policy objectives, since only one unit is developed where 2, 3, or more units
could have been delivered. They contribute less to meeting ‘conventional’ demand and to delivery
of housing targets, and the council loses out on New Homes Bonus which is paid for every new
home.
4.17 The judgement to be made with respect to these development proposals is whether the economic
benefits in attracting investment by High Net Worth Individuals who purchase super-sized
properties, almost certainly from overseas, who will make occasional use of the property, outweigh
the opportunity costs of reduced provision for conventional demand. This is a value judgement
essentially between the economic benefits to London of the expenditure by the owners of such
property versus maximising supply of housing for conventional demand.
Westminster Housing Market Analysis November 2014
9
4.18 The report ‘The Prime Residential Market in Westminster’ prepared by Ramidus sets out the
economic benefits associated with the buyers of these sorts of property.
5. Affordable Delivery, Future Requirements and Maximising Supply
5.1 Over the past 10 years delivery of affordable housing units (social rent and intermediate homes) has
accounted for about 24% of total new housing completions in Westminster4. This is broken down
into provision of social and affordable rent homes which have accounted for 18% of new homes
built; with intermediate housing accounting for around 6% of new homes built.
5.2 If affordable homes were to account for the same percentage of the net additional housing supply
delivered in the future, and the 1,068 target is achieved, this would deliver around 255 new
affordable homes per annum, broken down roughly into 195 social/affordable rent homes and 60
intermediate tenure homes.
5.3 Figure 2 presents a simple estimate of the need for social and intermediate housing which is broadly
based on the process set out in the NPPG. These estimates are based on best readily available data
but, as with all estimates of housing need and demand, are highly uncertain as they rely on a range
of inputs and use a short period of history to project forward over a long period of time. These
estimates are also highly sensitive to changes in the economic and policy environment and increase
radically if less conservative assumptions are made e.g. on the anticipated future growth of the
waiting list. Wessex Economics therefore consider this a minimum estimate of housing need. It will
be important to monitor changes in need given future uncertainties.
5.4 The estimate of the need for social housing in Figure 2 (column A) takes account of the current need
for social housing (social and affordable rent) as represented by the backlog of households on the
CoW waiting list; and estimates future needs using household projections and assumptions about
the proportion of households unable to meet their needs in the market. The supply of social homes
through re-let is also taken into account to identify how much additional social housing is needed to
meet current and newly arising need. It assumes that the backlog of current need will be addressed
over the plan period (20 years).
5.5 This suggests that around 180 additional homes are needed each year to accommodate households
unable to meet their own needs in the market. In absolute terms, the requirement to provide 180
social homes per annum is around 20% higher than what has been delivered in terms of new social
housing over the last 10 years.
4 Based on delivery of new self-contained homes.
Westminster Housing Market Analysis November 2014
10
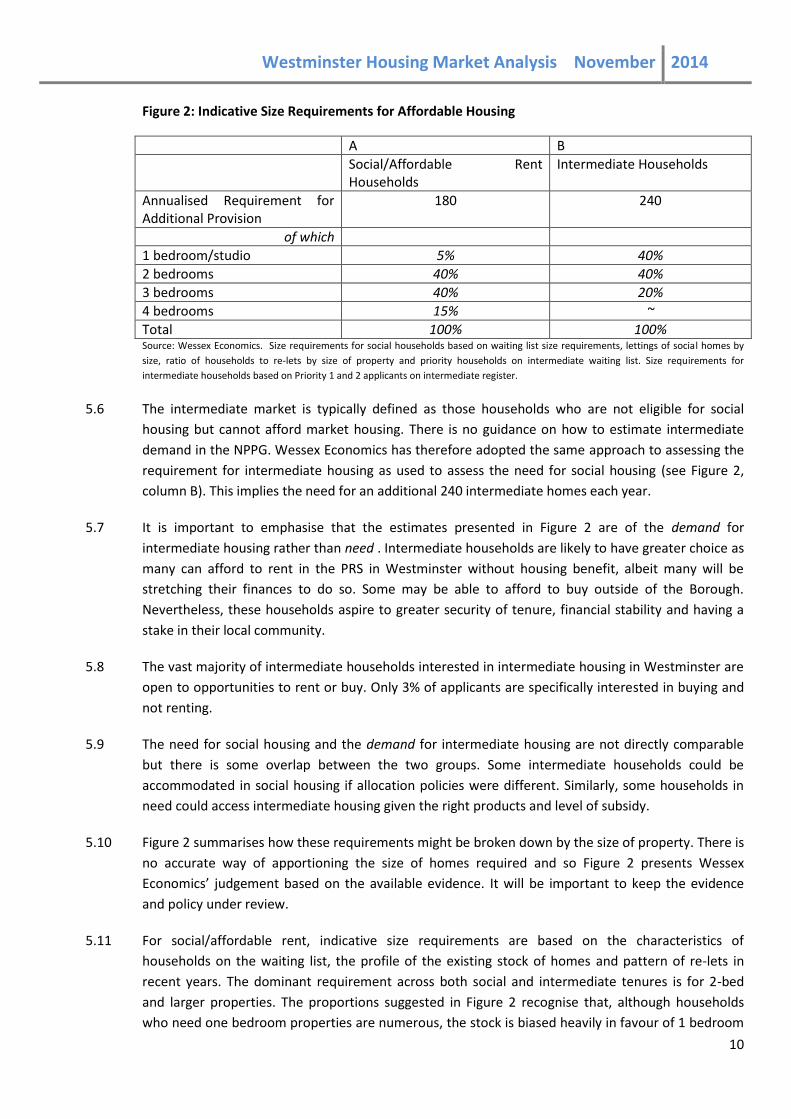
Figure 2: Indicative Size Requirements for Affordable Housing
A B
Social/Affordable Rent Households
Intermediate Households
Annualised Requirement for Additional Provision
180 240
of which
1 bedroom/studio 5% 40%
2 bedrooms 40% 40%
3 bedrooms 40% 20%
4 bedrooms 15% ~
Total 100% 100% Source: Wessex Economics. Size requirements for social households based on waiting list size requirements, lettings of social homes by
size, ratio of households to re-lets by size of property and priority households on intermediate waiting list. Size requirements for
intermediate households based on Priority 1 and 2 applicants on intermediate register.
5.6 The intermediate market is typically defined as those households who are not eligible for social
housing but cannot afford market housing. There is no guidance on how to estimate intermediate
demand in the NPPG. Wessex Economics has therefore adopted the same approach to assessing the
requirement for intermediate housing as used to assess the need for social housing (see Figure 2,
column B). This implies the need for an additional 240 intermediate homes each year.
5.7 It is important to emphasise that the estimates presented in Figure 2 are of the demand for
intermediate housing rather than need . Intermediate households are likely to have greater choice as
many can afford to rent in the PRS in Westminster without housing benefit, albeit many will be
stretching their finances to do so. Some may be able to afford to buy outside of the Borough.
Nevertheless, these households aspire to greater security of tenure, financial stability and having a
stake in their local community.
5.8 The vast majority of intermediate households interested in intermediate housing in Westminster are
open to opportunities to rent or buy. Only 3% of applicants are specifically interested in buying and
not renting.
5.9 The need for social housing and the demand for intermediate housing are not directly comparable
but there is some overlap between the two groups. Some intermediate households could be
accommodated in social housing if allocation policies were different. Similarly, some households in
need could access intermediate housing given the right products and level of subsidy.
5.10 Figure 2 summarises how these requirements might be broken down by the size of property. There is
no accurate way of apportioning the size of homes required and so Figure 2 presents Wessex
Economics’ judgement based on the available evidence. It will be important to keep the evidence
and policy under review.
5.11 For social/affordable rent, indicative size requirements are based on the characteristics of
households on the waiting list, the profile of the existing stock of homes and pattern of re-lets in
recent years. The dominant requirement across both social and intermediate tenures is for 2-bed
and larger properties. The proportions suggested in Figure 2 recognise that, although households
who need one bedroom properties are numerous, the stock is biased heavily in favour of 1 bedroom

Westminster Housing Market Analysis November 2014
11
properties, lettings are most frequent amongst this type of accommodation and the greatest
pressure is on the larger housing stock. For this reason, Wessex Economics suggest that the focus is
on the provision of 2 and 3 bedroom properties as the first priority. There is very significant pressure
on 4 bedroom properties but relatively fewer numbers are needed.
5.12 The proportions suggested for intermediate housing are based on the size requirements of priority
households (Category 1 and 2) and therefore those most likely to be allocated an intermediate
property rather than the totality of intermediate households that are registered with the CoW.
Focusing on the latter would imply the need for a much greater proportion (60% +) of 1 bedroom
properties to address demand from single people who make up the vast majority of those registered.
5.13 It will be no surprise that there is a large requirement for additional social housing and a substantial
demand for intermediate housing. Evidence of the urgent need for more social housing is provided
by the fact that CoW is housing 2,400 households in temporary accommodation. It is estimated that
the direct gross cost of providing temporary housing is £38m per annum.
5.14 It may be that the numbers of households in temporary accommodation will fall if CoW decides to
use new powers to discharge fully its duty to homeless households by offering private rented sector
accommodation. Hitherto homeless households have been able to turn down this offer and accept
temporary accommodation if a suitable permanent social rented home is unavailable. 5.15
However, in the recent past the availability of private rented housing for those in receipt of housing
benefit has fallen significantly. The number of people living in the private rented sector in
Westminster who claim housing benefits fell by 2,700 households over the period 2011-14, a fall of
around one third. If this trend continues, then this reduces the ability of CoW to accommodate
those in housing need by offering private rented sector accommodation.
5.16 It is reasonable to expect that the amount of private rented sector housing in Westminster
affordable to people on benefits will continue to decline, before it stabilises. This is the likely
consequence of rising private sector rents in Westminster; strong demand from tenants not in
receipt of housing benefit; the overall £26,000 cap on benefits; and changes to the Local Housing
Allowance system, particularly the proposal for direct payment of Housing Benefit/Universal Credit
to tenants rather than landlords.
5.17 The net effect of reduced supply of private rented accommodation in Westminster to house those on
benefit is to reduce supply of housing for low income groups; but the overall ability of CoW to
discharge its duty to homeless households through the offer of a private rented property is hard to
judge.
5.18 In view of these pressures, the CoW needs to maximise the delivery of affordable homes for those
unable to meet their needs in the market. This will be achieved by seeking to maximise housing
delivery as a whole and ensuring that affordable housing obligations are set at a level consistent with
maximising affordable housing output.
5.19 However, consideration also needs to be given to the provision of intermediate housing to meet
other policy objectives around aspiration for home ownership and stability through ownership or
security of tenure. The need to plan for employment and economic development also puts pressure

Westminster Housing Market Analysis November 2014
12
on the use of the scarce development capacity of Westminster. The CoW will need to balance
achievement of different development objectives.
5.20 In deciding how to maximise affordable housing provision judgements will have to be made about
the threshold at which affordable housing obligations come into force (currently 1,000 sq m of new
residential floorspace, or 10 additional units), the strategic proportion sought (currently 30%) and
the impact that these obligations may have on the viability of development and therefore the
volume of all forms of housing that is delivered.
5.21 Three clear conclusions emerge from the analysis of the overall requirement for new homes in
Westminster and the analysis of the need for affordable housing.
5.22 First, there is a need to maximise the delivery of new homes (market and affordable) in
Westminster. The GLA has identified that the capacity to deliver new homes in London falls short of
projected household growth. GLA and CoW have jointly identified capacity for supply of an
additional 1,068 housing units per annum in Westminster. This is only slightly higher than the
quantum of additional housing supply delivered over the past 14 years, 1,044 units per annum.
However, the challenge of securing higher levels of delivery should not be underestimated. There is
a significant challenge for CoW to work with developers and the GLA to boost the volume of housing
delivery to achieve the emerging target for new homes.
5.23 Second, there is a need to maximise the availability of social housing in Westminster either through
new development or provision of subsidy (housing benefit) to those living in market rent housing.
The scale of housing need in Westminster is such that it will be challenging for CoW to meet priority
housing needs in Westminster through new building given its current statutory responsibilities.
Recent changes to the Housing Benefit system (the overall benefit cap and the rent caps), mean that
its ability to address housing need by housing those in need in the private rent sector within
Westminster has fallen and can be expected to fall further; though some relief may come from the
new ability to discharge the Council’s duty to homeless people by offering appropriate housing in the
private rented sector.
5.24 Third, the Mayor’s Housing Strategy highlights the requirement for provision of intermediate
housing in London and gives high priority to delivery of such housing. The CoW has also worked to
support the development of intermediate housing over many years to meet a number of housing
objectives. Yet the stock of intermediate housing is a small fraction of the stock of social rented
housing. Around 1.5% of all household are either shared owners or are tenants living in
intermediate rented accommodation. This compares to 26% of all households who rent from a
social landlord. Consideration needs therefore to be given to how available resources should be
divided between meeting the considerable need for social housing and meeting the requirement for
intermediate housing.
5.25 There is no conflict in such a strategy to maximise the delivery of both market and affordable homes,
since the primary mechanism for delivery of new affordable homes is through the requirement that
a proportion of all residential developments of 1,000 sq m or more provide an element of affordable
housing. This provision is generally to be made on-site, but, by agreement, may be provided off-site
elsewhere in Westminster. Where this is not possible a financial contribution in lieu of provision of
affordable housing can be made to the City Council’s Affordable Housing Fund (AHF). The AHF is

Westminster Housing Market Analysis November 2014
13
used to support delivery of additional affordable homes in Westminster, including development by
City West Homes.
5.26 Thus, the development of market housing is the principal way by which both sites and subsidy are
secured to deliver affordable housing in Westminster, though an element of subsidy will come
through the Mayor’s Affordable Housing Programme. Additional affordable housing can be
delivered through new building or purchase of existing properties. Some contribution to overall
housing requirements can also be achieved by bringing empty homes back into use, and
development of non self-contained housing units, such as hostels. This leads to an obvious
conclusion, that CoW needs to be satisfied that it is securing the largest contribution to the provision
of affordable housing through its Affordable Housing Policy taking into account the overall impact of
all development obligations on viability, and hence delivery of new homes as a whole.
6. Student Housing
6.1 It is estimated that around 18,000 students aged over 18 live in Westminster. These 18,000 students
living in Westminster represent just 3% of all post-18 students living in London, but 8% of
Westminster’s resident population. In London as a whole, students aged over 18 account for around
6% of the London population.
6.2 Students are therefore over-represented among the Westminster population compared to a London-
wide benchmark. This probably reflects a general pattern of students aged over 18 being more
strongly represented in inner London than outer London, given the concentration of HEIs in the
central area, and the larger stock of private rented housing in inner London Boroughs compared with
outer London Boroughs.
6.3 While Westminster has a relatively large number of resident students, the vast majority (at least
85%) of students studying at Westminster HEIs live outside Westminster. Just as workers commute
into the central areas of London from cheaper residential areas, so the majority of students
commute to study (though it is not known how many students study at Westminster HEI campuses
outside the City).
6.4 For CoW to justify special policies to support provision of student housing in the City, at the expense
of conventional housing for the rest of the market, there would have to be convincing evidence that
the current relationship between where students live and where they study is having adverse
consequences. Wessex Economics would recommend that CoW undertake additional research on
this issue in conjunction with Westminster-based HEIs.
7. The Mayor’s Housing Strategy
7.1 The Mayor’s Housing Strategy has five key priorities:
increasing supply to levels not seen since the 1930s
better support for working Londoners and helping more of them into home ownership
improving the private rented sector and promoting purpose-built and well managed private
rented housing
pushing for a new long-term financial solution for London Government to drive housing delivery
Westminster Housing Market Analysis November 2014
14
bringing forward land for development and accelerating the pace of housing delivery through
Housing Zones and the London Housing Bank.
7.2 The broad thrust of the Mayor’s Housing Strategy is supporting Londoners who work and increasing
the supply of intermediate housing. A key dimension of the Mayor’s Housing Strategy of relevance
to the CoW is the proposal that, in future, resources for affordable housing will be divided up
between three different affordable housing products.
7.3 The Mayor’s proposal is to deliver 17,000 new affordable homes broken down as follows:
40% Low Cost Home Ownership (LCHO)
30% Capped Affordable Rents for low income, benefit dependent households
30% Discounted Affordable Rents, which the Mayor’s strategy indicates will be focused on low
income working households.
7.4 It may well not be appropriate for CoW to seek to replicate in Westminster precisely the split
between different affordable housing products, given the special characteristics of the City. In
particular it is not likely to be practicable or appropriate to deliver low cost home ownership
products in Westminster in large numbers. Instead CoW may wish to build upon its existing
programme of investing in expanding its portfolio of intermediate rent homes.
7.5 The CoW may therefore want to negotiate with GLA to ensure the provision of a programme of
intermediate rented homes aimed at working Londoners on low incomes, in lieu of LCHO units.
Given the pressure on social housing, it is quite probable that the Discounted Affordable Rent
product will have to be focused on meeting CoW statutory housing obligations. Alternatively, CoW
may well need to also seek to negotiate a higher level of provision of Capped Affordable Rent
properties and a lower level of Discounted Affordable Rents properties, given the way that Housing
Benefit caps interact with rents.
7.6 With respect to other elements of the Mayor’s Housing Strategy, Wessex Economics would make the
following observations:
Given the robust ‘for sale’ market in Westminster and high land values, it is unlikely that a
significant volume of Build for Rent schemes will be brought forward in Westminster. Build for
Rent schemes will tend to be most attractive in regeneration areas, and initially are most likely
to come forward on publicly owned land.
The Major’s Housing Zone proposals could provide interesting opportunities for co-investment
in affordable housing, if CoW decides to pursue the option of out-of-Borough development,
discussed later in this summary report.
The Mayor proposes that there should be devolution of property taxes to the London
Government and enhanced borrowing powers for the GLA and Boroughs. CoW would have an
interest in how any devolution of property taxes is shared between GLA and the Boroughs.