westrock keybanc's basic materials and packaging...
TRANSCRIPT
WestRock
KeyBanc's Basic Materials and
Packaging ConferenceSeptember 14, 2016
2
Forward-looking Statements
This presentation contains forward-looking statements within the meaning of the Private Securities Litigation Reform Act of 1995, including but not limited to
the statements on the slides entitled “WestRock – Building a Growing Paper and Packaging Leader”, “Creating Value”, “Generating Solid Free Cash Flow
and Expanding Profitability Margins”, “Executing on Core Packaging Business and Footprint Opportunities”, “Making Strategic Investments Focused on
Growth and Value Creation”, “Executing Balanced Capital Allocation Strategy Focused on Value Creation” and “Synergy and Performance Improvements”
that give guidance or estimates for future periods as well as statements regarding, among other things, that we have an unmatched ability to provide our
breadth of product offerings, capabilities and geographic reach to our customers; we are on track to achieve our $1 billion synergy and business performance
improvement target by end of fiscal 2018; we estimate annualized run-rate savings of ~$500 million by end of fiscal 2016; we estimate Adjusted Free Cash
Flow in fiscal 2016 of at least $1 billion; we expect 8.6% of Free Cash Flow Yield in fiscal 2016; the Cenveo integration is going well and we are integrating
25K tons of paperboard; we see continued strong economic and real estate trends in Charleston, SC; we expect to complete monetization of our land
portfolio over the next 24 to 30 months; we expect total gross proceeds of approximately $600 million to be split with various joint venture partners, and
approximately $275 – $300 million of after-tax cash flow with more than one-half of the cash flow expected to be realized by end of fiscal 2017; and our
expectations regarding the composition of our three-year synergy and performance improvement target.
Forward-looking statements are based on our current expectations, beliefs, plans or forecasts and are typically identified by words or phrases such as "may,"
"will," "could," "should," "would," "anticipate," "estimate," "expect," "project," "intend," "plan," "believe," "target," "prospects," "potential" and "forecast," and
other words, terms and phrases of similar meaning. Forward-looking statements involve estimates, expectations, projections, goals, forecasts, assumptions,
risks and uncertainties. We caution readers that a forward-looking statement is not a guarantee of future performance and that actual results could differ
materially from those contained in the forward-looking statement. With respect to these statements, we have made assumptions regarding, among other
things, the results and impacts of the merger of MeadWestvaco and RockTenn; economic, competitive and market conditions generally; volumes and price
levels of purchases by customers; competitive conditions in our businesses and possible adverse actions of their customers, competitors and suppliers.
Further, our businesses are subject to a number of general risks that would affect any such forward-looking statements including, among others, decreases
in demand for their products; increases in energy, raw materials, shipping and capital equipment costs; reduced supplies of raw materials; fluctuations in
selling prices and volumes; intense competition; the potential loss of certain customers; the scope, costs, timing and impact of any restructuring of our
operations and corporate and tax structure; the occurrence of a natural disaster or other unanticipated problems such as labor difficulties, equipment failure
or unscheduled maintenance and repair, which could result in operational disruptions of varied duration; our desire or ability to continue to repurchase
company stock; and adverse changes in general market and industry conditions. Such risks and other factors that may impact management's assumptions
are more particularly described in our filings with the Securities and Exchange Commission, including in Item 1A under the caption "Risk Factors" in our
Annual Report on Form 10-K for the fiscal year ended September 30, 2015. The information contained herein speaks as of the date hereof and WestRock
does not have or undertake any obligation to update or revise its forward-looking statements, whether as a result of new information, future events or
otherwise.

3
Disclaimer; Non-GAAP Financial Measures
We may from time to time be in possession of certain information regarding WestRock that applicable law would not
require us to disclose to the public in the ordinary course of business, but would require us to disclose if we were
engaged in the purchase or sale of our securities. This presentation shall not be considered to be part of any
solicitation of an offer to buy or sell WestRock securities. This presentation also may not include all of the
information regarding WestRock that you may need to make an investment decision regarding WestRock
securities. Any investment decision should be made on the basis of the total mix of information regarding WestRock
that is publicly available as of the date of the decision.
We report our financial results in accordance with accounting principles generally accepted in the United States
("GAAP"). However, management believes certain non-GAAP financial measures provide users with additional
meaningful financial information that should be considered when assessing our ongoing performance. Management
also uses these non-GAAP financial measures in making financial, operating and planning decisions and in
evaluating our performance. Non-GAAP financial measures should be viewed in addition to, and not as an
alternative for, our GAAP results. The non-GAAP financial measures we present may differ from similarly captioned
measures presented by other companies. See the Appendix for details about these non-GAAP financial measures,
as well as the required reconciliations.
4
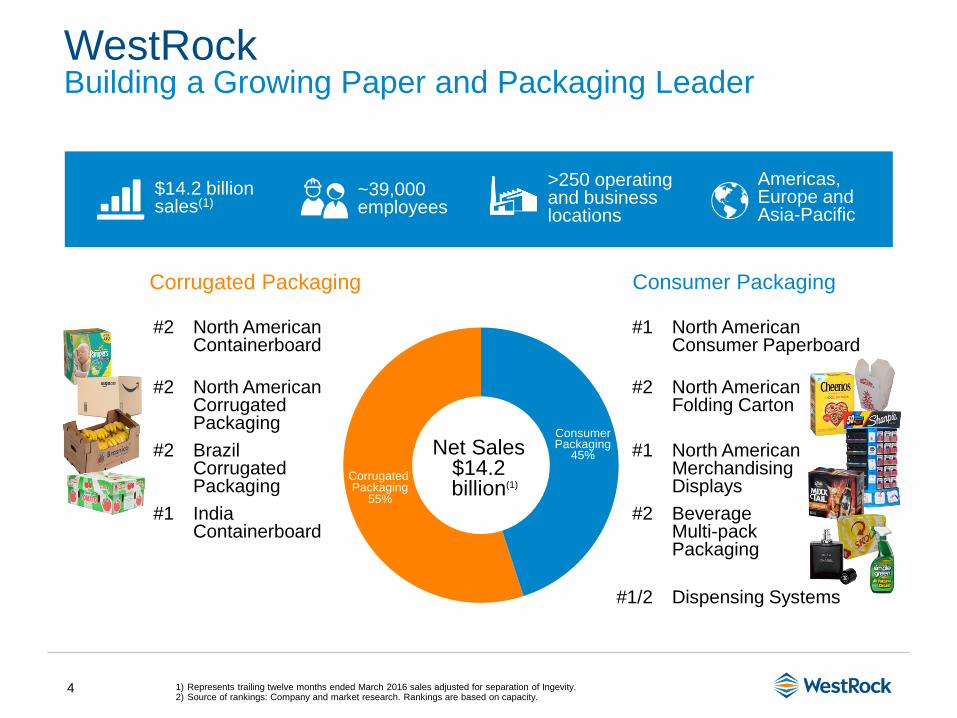
Corrugated Packaging Consumer Packaging
#2 North American Containerboard
#1 North American Consumer Paperboard
#2 North American Corrugated Packaging
#2 North American Folding Carton
#2 Brazil Corrugated Packaging
#1 North American Merchandising Displays
#1 India Containerboard
#2 BeverageMulti-pack Packaging
#1/2 Dispensing Systems
Consumer Packaging
45%Net Sales$14.2billion(1)
WestRockBuilding a Growing Paper and Packaging Leader
~39,000 employees
Americas, Europe and Asia-Pacific
$14.2 billion sales(1)
>250 operating and business locations
1) Represents trailing twelve months ended March 2016 sales adjusted for separation of Ingevity.2) Source of rankings: Company and market research. Rankings are based on capacity.
Corrugated Packaging
55%

5
Generate significant free cash flow and shareholder value
Creating Value
Differentiated StrategyIntegration
Execution
Synergies and
Performance
Improvement
Balanced
Capital
Allocation
Successfully
pursuing a
differentiated
strategy based
on delivering
winning
solutions to our
customers
Seeing the
benefit of
WestRock’s
breadth of
offering,
capabilities and
footprint in the
market
Excellent
progress in
merger
integration and
creation of
WestRock
organization,
culture and
capabilities
On track to
deliver
$1 billion of
productivity
improvements
by end of FY18
Investing in our
business and
returning
capital to
shareholders
6
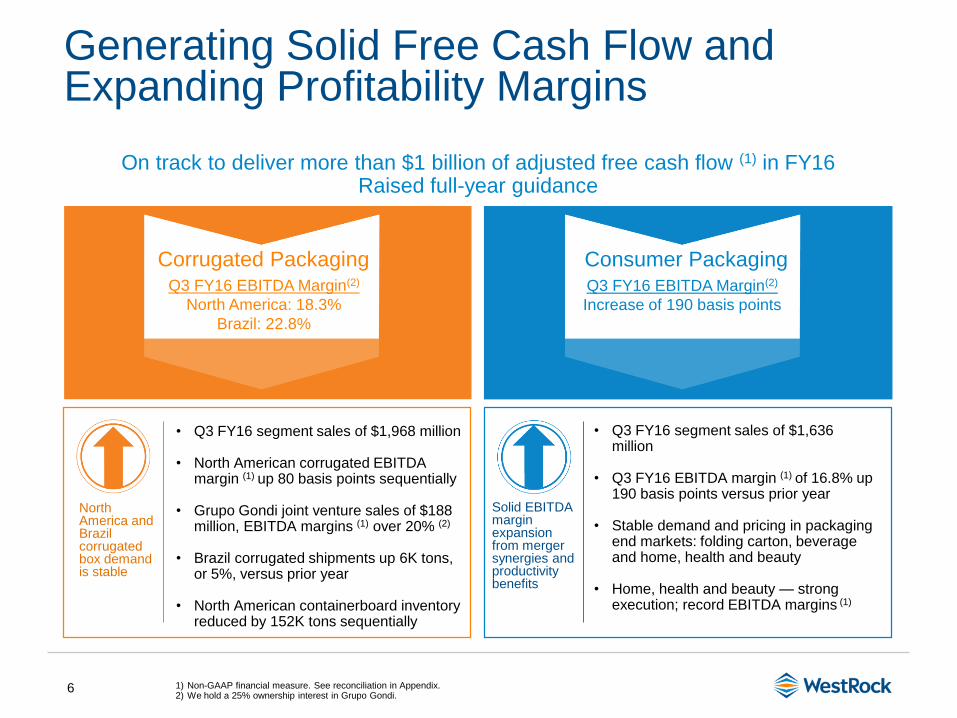
North America and Brazil corrugated box demand is stable
Solid EBITDA margin expansion from merger synergies and productivity benefits
• Q3 FY16 segment sales of $1,968 million
• North American corrugated EBITDA margin (1) up 80 basis points sequentially
• Grupo Gondi joint venture sales of $188 million, EBITDA margins (1) over 20% (2)
• Brazil corrugated shipments up 6K tons, or 5%, versus prior year
• North American containerboard inventory reduced by 152K tons sequentially
• Q3 FY16 segment sales of $1,636 million
• Q3 FY16 EBITDA margin (1) of 16.8% up 190 basis points versus prior year
• Stable demand and pricing in packaging end markets: folding carton, beverage and home, health and beauty
• Home, health and beauty — strong execution; record EBITDA margins (1)
Generating Solid Free Cash Flow and Expanding Profitability Margins
On track to deliver more than $1 billion of adjusted free cash flow (1) in FY16Raised full-year guidance
Q3 FY16 EBITDA Margin(2)
North America: 18.3%
Brazil: 22.8%
Consumer PackagingQ3 FY16 EBITDA Margin(2)
Increase of 190 basis points
1) Non-GAAP financial measure. See reconciliation in Appendix.2) We hold a 25% ownership interest in Grupo Gondi.
Corrugated Packaging
7
What we have done, and what we are doing post merger…

8
Completed
• Closed four containerboard mills to balance WestRock containerboard system and improve profitability
‒ Newberg, OR
‒ Coshocton, OH
‒ Uncasville, CT
‒ Vapi, India
• Completed two acquisitions and invested in one joint venture to strengthen and optimize our packaging business
• Separated Ingevity, WestRock’s Specialty Chemicals business; separation completed on May 15, 2016
• Completed review and accelerating monetization of Land and Development assets in Charleston, SC; expected after tax cash flow of approximately $275 – $300 million; more than one-half expected to be realized by end of FY17
In Process
• Monitoring entire portfolio of assets for efficiency, cost improvement and value creation opportunities
• Evaluating further growth opportunities
Executing on Core Packaging Business and Footprint Opportunities
9
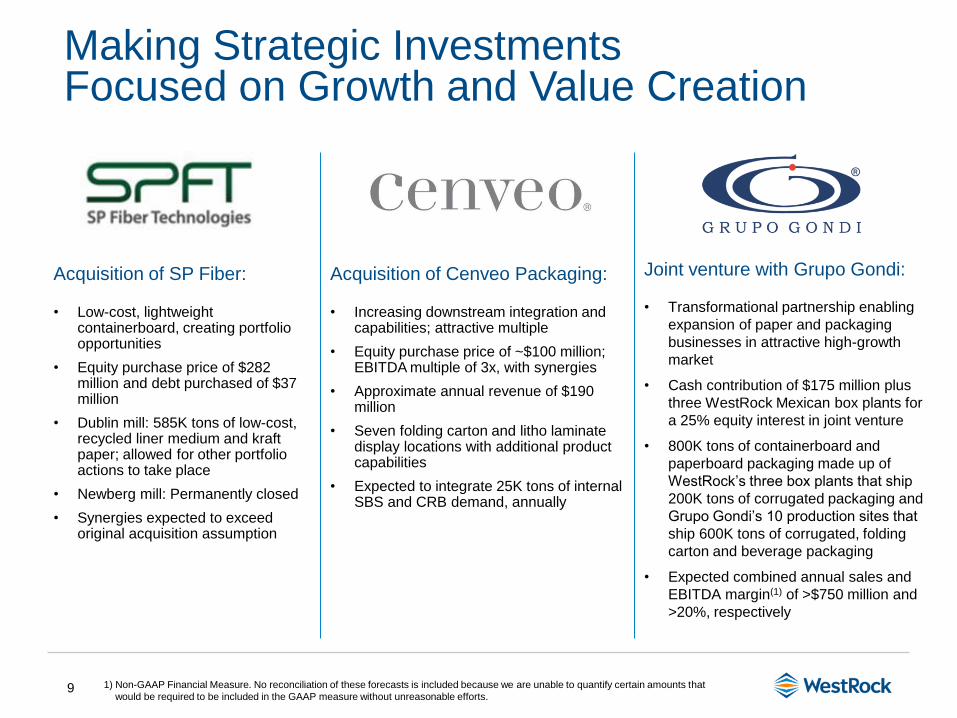
Acquisition of SP Fiber:
• Low-cost, lightweight containerboard, creating portfolio opportunities
• Equity purchase price of $282 million and debt purchased of $37 million
• Dublin mill: 585K tons of low-cost, recycled liner medium and kraft paper; allowed for other portfolio actions to take place
• Newberg mill: Permanently closed
• Synergies expected to exceed original acquisition assumption
Acquisition of Cenveo Packaging:
• Increasing downstream integration and capabilities; attractive multiple
• Equity purchase price of ~$100 million; EBITDA multiple of 3x, with synergies
• Approximate annual revenue of $190 million
• Seven folding carton and litho laminate display locations with additional product capabilities
• Expected to integrate 25K tons of internal SBS and CRB demand, annually
Joint venture with Grupo Gondi:
• Transformational partnership enabling
expansion of paper and packaging
businesses in attractive high-growth
market
• Cash contribution of $175 million plus
three WestRock Mexican box plants for
a 25% equity interest in joint venture
• 800K tons of containerboard and
paperboard packaging made up of
WestRock’s three box plants that ship
200K tons of corrugated packaging and
Grupo Gondi’s 10 production sites that
ship 600K tons of corrugated, folding
carton and beverage packaging
• Expected combined annual sales and
EBITDA margin(1) of >$750 million and
>20%, respectively
1) Non-GAAP Financial Measure. No reconciliation of these forecasts is included because we are unable to quantify certain amounts that
would be required to be included in the GAAP measure without unreasonable efforts.
Making Strategic Investments Focused on Growth and Value Creation

10
Executing Balanced Capital Allocation Strategy Focused on Value Creation
1) At end of Q3 FY16. Excludes merger-related share repurchases for $668 million. 2) Calculated as annual dividend of $1.50 divided by closing share price on 9/9/2016 of $46.49.3) Source: Bloomberg. As at close of 9/9/2016.
Capital Expenditures$841 million
35%
Dividends$384 million
16%
Stock Repurchases$613 million
25%
M&A$588 million
24%
Capital Allocated Since
Merger (1)
$2.4 billion
• Annual dividend of $1.50 per share
• Current dividend yield of 3.2% (2)
• Current S&P 500 dividend yield of 2.0% (3)
• Maintenance capital expenditures: ~60%
• Cost reduction or strategic capital expenditures: ~40%
• 12.4 million shares repurchased
• Q4 FY15: $328 million
• YTD FY16: $285 million
• Acquisition of SP Fiber:
$315 million
• Acquisition of Cenveo
Packaging: $98 million
• JV with Grupo Gondi:
$175 million
11
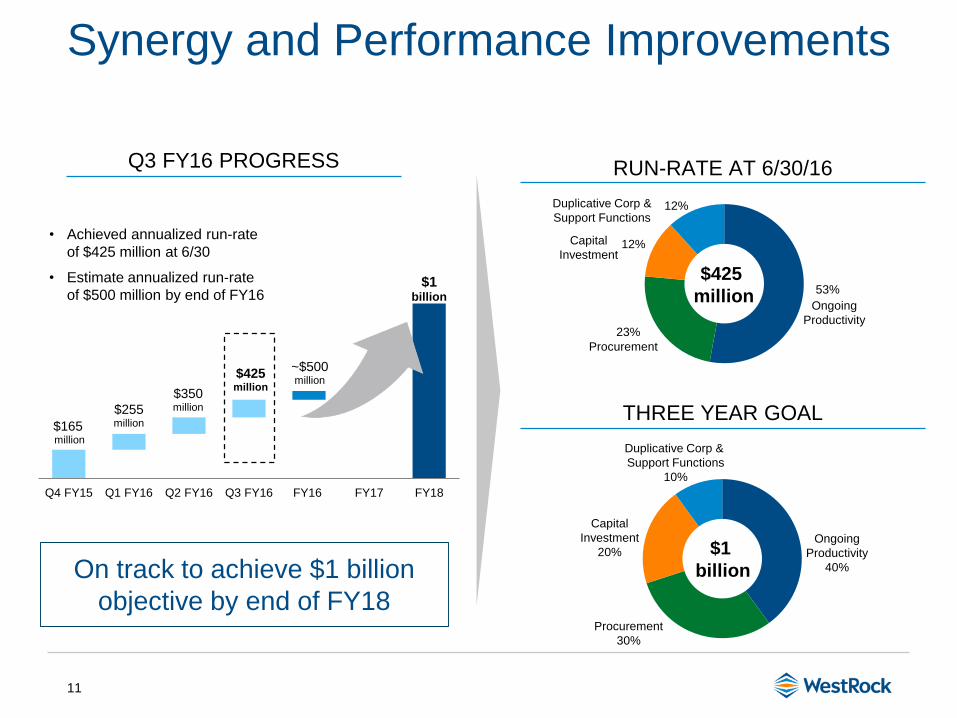
Synergy and Performance Improvements
On track to achieve $1 billion
objective by end of FY18
$165million
$1billion
$255million
$350million
$425million
~$500million
Q4 FY15 Q1 FY16 Q2 FY16 Q3 FY16 FY16 FY17 FY18
• Achieved annualized run-rate
of $425 million at 6/30
• Estimate annualized run-rate
of $500 million by end of FY16
Q3 FY16 PROGRESS
(1)
(1)
53%
23%
12%
12%
Procurement
Capital
Investment
Ongoing
Productivity
Duplicative Corp &
Support Functions
$1
billion
RUN-RATE AT 6/30/16
THREE YEAR GOAL
$425
million
Duplicative Corp &
Support Functions
10%
Capital
Investment
20%
Procurement
30%
Ongoing
Productivity
40%
12
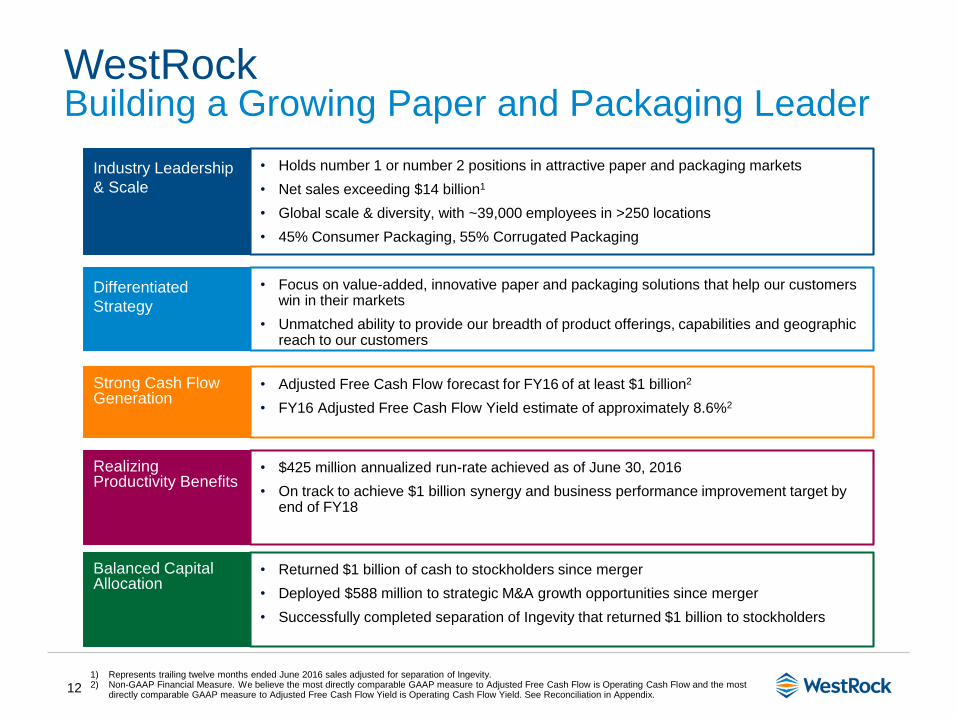
WestRockBuilding a Growing Paper and Packaging Leader
1) Represents trailing twelve months ended June 2016 sales adjusted for separation of Ingevity.2) Non-GAAP Financial Measure. We believe the most directly comparable GAAP measure to Adjusted Free Cash Flow is Operating Cash Flow and the most
directly comparable GAAP measure to Adjusted Free Cash Flow Yield is Operating Cash Flow Yield. See Reconciliation in Appendix.
Industry Leadership
& Scale
• Holds number 1 or number 2 positions in attractive paper and packaging markets
• Net sales exceeding $14 billion1
• Global scale & diversity, with ~39,000 employees in >250 locations
• 45% Consumer Packaging, 55% Corrugated Packaging
Differentiated
Strategy
• Focus on value-added, innovative paper and packaging solutions that help our customers win in their markets
• Unmatched ability to provide our breadth of product offerings, capabilities and geographic reach to our customers
Strong Cash Flow Generation
• Adjusted Free Cash Flow forecast for FY16 of at least $1 billion2
• FY16 Adjusted Free Cash Flow Yield estimate of approximately 8.6%2
Realizing Productivity Benefits
• $425 million annualized run-rate achieved as of June 30, 2016
• On track to achieve $1 billion synergy and business performance improvement target by end of FY18
Balanced Capital Allocation
• Returned $1 billion of cash to stockholders since merger
• Deployed $588 million to strategic M&A growth opportunities since merger
• Successfully completed separation of Ingevity that returned $1 billion to stockholders
13
Appendix

14
Non-GAAP Financial Measures
Credit Agreement EBITDA
“Credit Agreement EBITDA” is calculated in accordance with the definition contained in our Credit Agreement. Credit Agreement EBITDA is
generally defined as Consolidated Net Income plus: consolidated interest expense, income taxes of the consolidated companies determined in
accordance with GAAP, depreciation and amortization expense of the consolidated companies determined in accordance with GAAP, loss on
extinguishment of debt and financing fees, certain non-cash and cash charges incurred, including goodwill impairment, certain restructuring and
other costs, merger / acquisition and integration costs, charges and expenses associated with the write-up of inventory acquired and other
items. LTM Credit Agreement EBITDA margin is calculated by dividing LTM Credit Agreement EBITDA by Net Sales adjusted for Trade Sales.
Adjusted Free Cash Flow
Free Cash Flow is defined as Cash Provided by Operating Activities, excluding after-tax cash restructuring costs minus capital expenditures.
Free Cash Flow Yield is defined as Free Cash Flow divided by Market Capitalization (Shares Outstanding as of 7/29/2016 times Share Price as
of 9/9/2016). We believe the most directly comparable GAAP measure is net cash provided by operating activities. Management believes this is
an important measure in evaluating our financial performance and measures our ability to generate cash without incurring additional external
financings.
Total Funded Debt and Leverage Ratio
“Total Funded Debt” is calculated in accordance with the definition contained in our Credit Agreement. Total Funded Debt is generally defined
as aggregate debt obligations reflected in our balance sheet less the stepped up value of said debt, less non-recourse debt except for
Securitization related debt, less trade payables related debt that may be recharacterized as debt, less insurance policy loans to the extent offset
by assets of the applicable insurance policies, obligations with the hedge adjustments resulting from terminated and existing fair value interest
rate derivatives or swaps, if any, less certain cash, plus additional outstanding letters of credit not already reflected in debt and certain
guarantees.
Our management uses Credit Agreement EBITDA and Total Funded Debt to evaluate compliance with our debt covenants and borrowing
capacity available under our Credit Agreement, as a measure of operating performance and to compare to our target Leverage Ratio of 2.25x –
2.50x. Management believes that investors also use these measures to evaluate our compliance with our debt covenants and available
borrowing capacity. Borrowing capacity is dependent upon, in addition to other measures, the “Credit Agreement Debt/EBITDA ratio” or the
“Leverage Ratio,” which is defined as Total Funded Debt divided by Credit Agreement EBITDA. As of the June 30, 2016 calculation, our
Leverage Ratio was 2.33 times. While the Leverage Ratio under the Credit Agreement determines the credit spread on our debt we are not
subject to a Leverage Ratio cap. The Credit Agreement is subject to a Debt to Capitalization and Consolidated Interest Coverage Ratio, as
defined in the Credit Agreement.
15
Non-GAAP Financial Measures (cont.)
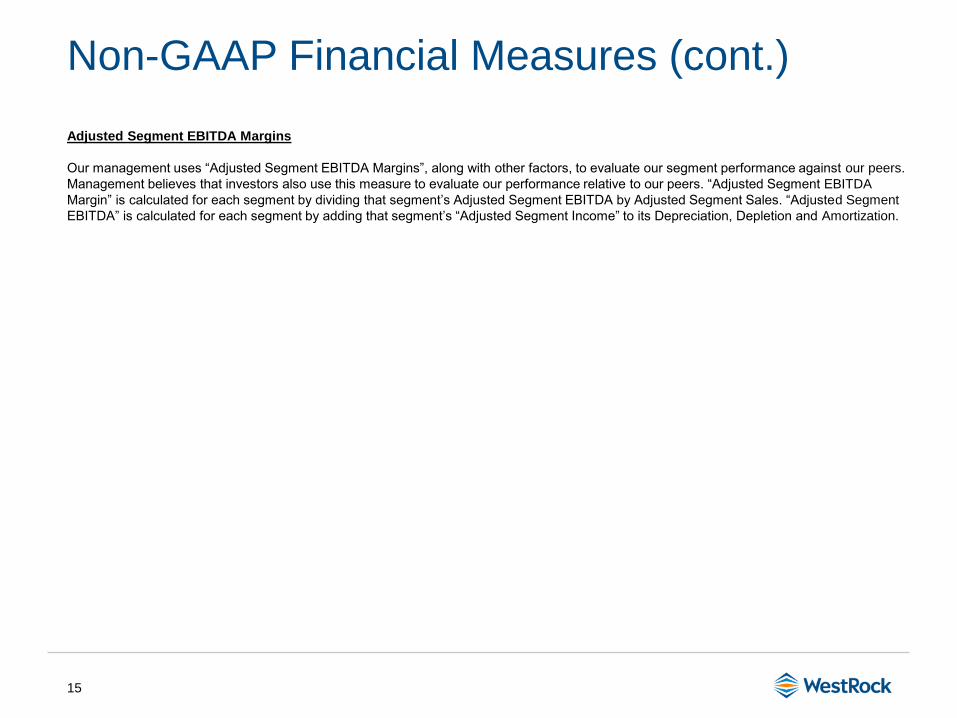
Adjusted Segment EBITDA Margins
Our management uses “Adjusted Segment EBITDA Margins”, along with other factors, to evaluate our segment performance against our peers.
Management believes that investors also use this measure to evaluate our performance relative to our peers. “Adjusted Segment EBITDA
Margin” is calculated for each segment by dividing that segment’s Adjusted Segment EBITDA by Adjusted Segment Sales. “Adjusted Segment
EBITDA” is calculated for each segment by adding that segment’s “Adjusted Segment Income” to its Depreciation, Depletion and Amortization.
16
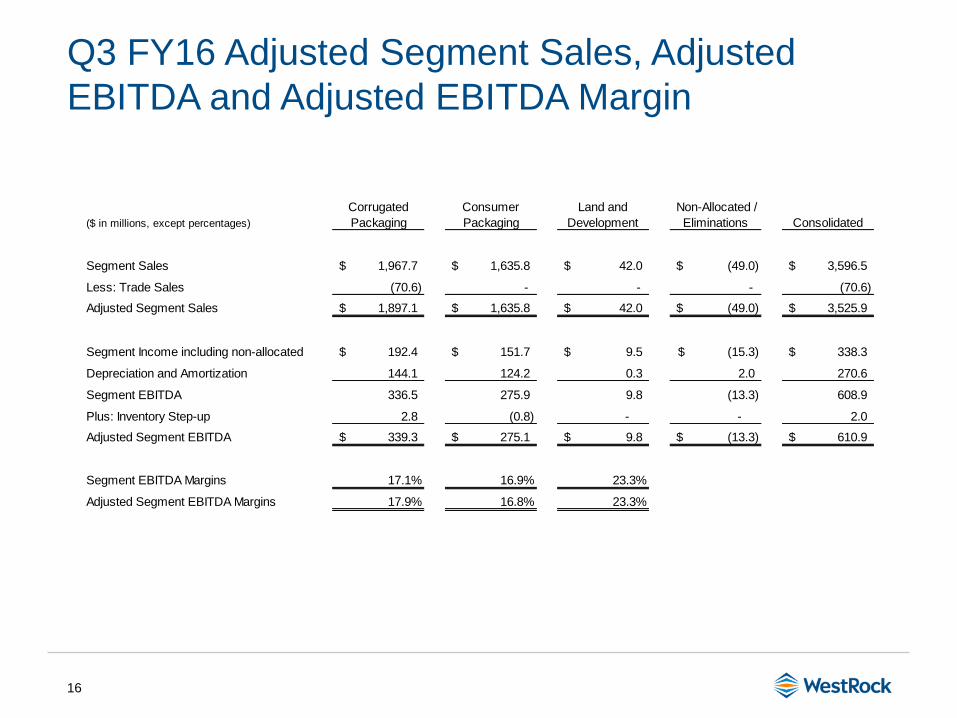
Q3 FY16 Adjusted Segment Sales, Adjusted
EBITDA and Adjusted EBITDA Margin
($ in millions, except percentages)
Corrugated
Packaging
Consumer
Packaging
Land and
Development
Non-Allocated /
Eliminations Consolidated
Segment Sales 1,967.7$ 1,635.8$ 42.0$ (49.0)$ 3,596.5$
Less: Trade Sales (70.6) - - - (70.6)
Adjusted Segment Sales 1,897.1$ 1,635.8$ 42.0$ (49.0)$ 3,525.9$
Segment Income including non-allocated 192.4$ 151.7$ 9.5$ (15.3)$ 338.3$
Depreciation and Amortization 144.1 124.2 0.3 2.0 270.6
Segment EBITDA 336.5 275.9 9.8 (13.3) 608.9
Plus: Inventory Step-up 2.8 (0.8) - - 2.0
Adjusted Segment EBITDA 339.3$ 275.1$ 9.8$ (13.3)$ 610.9$
Segment EBITDA Margins 17.1% 16.9% 23.3%
Adjusted Segment EBITDA Margins 17.9% 16.8% 23.3%

17
Q3 FY16 Corrugated EBITDA Margins
($ in millions, except percentages) North America Brazil OtherCorrugated
Packaging
Segment Sales 1,761.4$ 92.3$ 114.0$ 1,967.7$
Less: Trade Sales (70.6) - - (70.6)
Adjusted Segment Sales 1,690.8$ 92.3$ 114.0$ 1,897.1$
Segment Income 177.5$ 9.2$ 5.7$ 192.4$
Depreciation and Amortization 129.6 11.8 2.7 144.1
Segment EBITDA 307.1 21.0 8.4 336.5
Plus: Inventory Step-up 2.8 - - 2.8
Adjusted Segment EBITDA 309.9$ 21.0$ 8.4$ 339.3$
Segment EBITDA Margins 17.4% 22.8% 7.4% 17.1%
Adjusted Segment EBITDA Margins 18.3% 22.8% 7.4% 17.9%
Q3 FY15 - RKT + MWV
($ in millions, except percentages) North America OtherCorrugated
Packaging Brazil Other
Corrugated
Packaging Corrugated Packaging
Segment Sales 1,797.3$ 90.0$ 1,887.3$ 101.8$ 21.3$ 123.1$ 2,010.4$
Less: Trade Sales (78.5) - (78.5) - - - (78.5)
Adjusted Segment Sales 1,718.8$ 90.0$ 1,808.8$ 101.8$ 21.3$ 123.1$ 1,931.9$
Segment Income 214.5$ 2.5$ 217.0$ 19.0$ (3.5)$ 15.5$ 232.5$
Depreciation & Amortization 119.8 2.6 122.4 7.6 1.2 8.8 131.2
Adjusted Segment EBITDA 334.3$ 5.1$ 339.4$ 26.6$ (2.3)$ 24.3$ 363.7$
Adjusted Segment EBITDA Margins 19.4% 5.7% 18.8% 26.1% -10.8% 19.7% 18.8%
Q3 FY16
Q3 FY15 - RKT Q3 FY15 - MWV
18
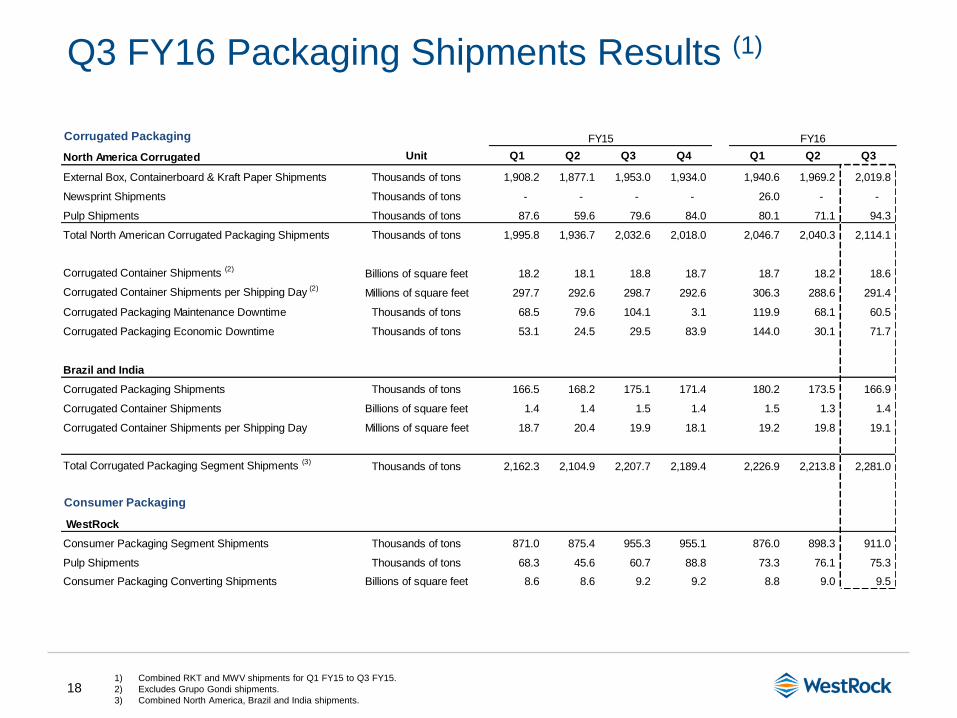
Q3 FY16 Packaging Shipments Results (1)
1) Combined RKT and MWV shipments for Q1 FY15 to Q3 FY15.
2) Excludes Grupo Gondi shipments.
3) Combined North America, Brazil and India shipments.
Corrugated Packaging
North America Corrugated Unit Q1 Q2 Q3 Q4 Q1 Q2 Q3
External Box, Containerboard & Kraft Paper Shipments Thousands of tons 1,908.2 1,877.1 1,953.0 1,934.0 1,940.6 1,969.2 2,019.8
Newsprint Shipments Thousands of tons - - - - 26.0 - -
Pulp Shipments Thousands of tons 87.6 59.6 79.6 84.0 80.1 71.1 94.3
Total North American Corrugated Packaging Shipments Thousands of tons 1,995.8 1,936.7 2,032.6 2,018.0 2,046.7 2,040.3 2,114.1
Corrugated Container Shipments (2)Billions of square feet 18.2 18.1 18.8 18.7 18.7 18.2 18.6
Corrugated Container Shipments per Shipping Day (2)Millions of square feet 297.7 292.6 298.7 292.6 306.3 288.6 291.4
Corrugated Packaging Maintenance Downtime Thousands of tons 68.5 79.6 104.1 3.1 119.9 68.1 60.5
Corrugated Packaging Economic Downtime Thousands of tons 53.1 24.5 29.5 83.9 144.0 30.1 71.7
Brazil and India
Corrugated Packaging Shipments Thousands of tons 166.5 168.2 175.1 171.4 180.2 173.5 166.9
Corrugated Container Shipments Billions of square feet 1.4 1.4 1.5 1.4 1.5 1.3 1.4
Corrugated Container Shipments per Shipping Day Millions of square feet 18.7 20.4 19.9 18.1 19.2 19.8 19.1
Total Corrugated Packaging Segment Shipments (3)Thousands of tons 2,162.3 2,104.9 2,207.7 2,189.4 2,226.9 2,213.8 2,281.0
Consumer Packaging
WestRock
Consumer Packaging Segment Shipments Thousands of tons 871.0 875.4 955.3 955.1 876.0 898.3 911.0
Pulp Shipments Thousands of tons 68.3 45.6 60.7 88.8 73.3 76.1 75.3
Consumer Packaging Converting Shipments Billions of square feet 8.6 8.6 9.2 9.2 8.8 9.0 9.5
FY15 FY16

19
WRK
($ in millions, except percentages) LTM Q3 FY16
Income from Continuing Operations 348.5$
Interest Expense, Net 185.9
Income Taxes 186.0
Depreciation, Depletion and Amortization 1,069.8
Additional Permitted Charges 553.7
LTM Credit Agreement EBITDA 2,343.9$
Net Sales 14,176.2$
Less: Trade Sales (280.7)
Net Sales Adjusted for Trade Sales 13,895.5$
LTM Credit Agreement EBITDA Margin 16.9%
Q3 FY16 LTM Credit Agreement EBITDA, Net
Sales and LTM Credit Agreement EBITDA Margin
1) Additional Permitted Charges includes among other items, $422 million of restructuring and other costs, net and $70 million pre-tax expense for inventory
stepped-up in purchase accounting.
(1)

20
Q3 and YTD FY16 Adjusted Free Cash Flow
($ in millions) Q3 FY16 YTD FY16
Cash Flow from Operations 531.6$ 1,306.8$
Less: Capital Expenditures (196.3) (614.7)
335.3 692.1
Plus: Restructuring and Other Costs, Net of Tax 37.9 113.2
Adjusted Free Cash Flow 373.2$ 805.3$
21
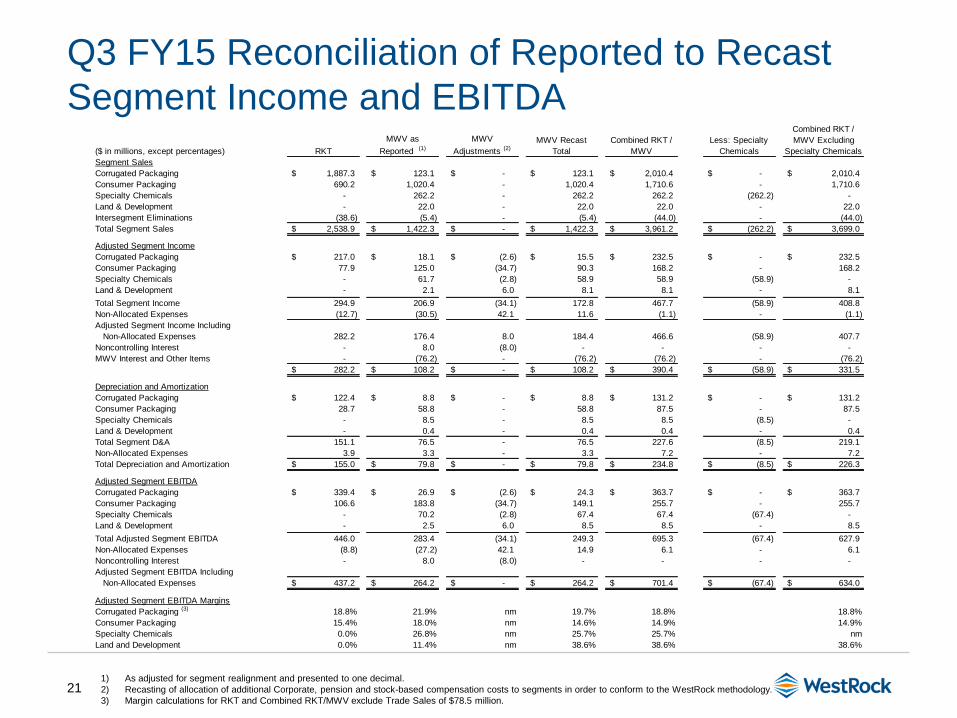
Q3 FY15 Reconciliation of Reported to Recast
Segment Income and EBITDA
1) As adjusted for segment realignment and presented to one decimal.
2) Recasting of allocation of additional Corporate, pension and stock-based compensation costs to segments in order to conform to the WestRock methodology.
3) Margin calculations for RKT and Combined RKT/MWV exclude Trade Sales of $78.5 million.
($ in millions, except percentages) RKT
MWV as
Reported (1)
MWV
Adjustments (2)
MWV Recast
Total
Combined RKT /
MWV
Less: Specialty
Chemicals
Combined RKT /
MWV Excluding
Specialty Chemicals
Segment Sales
Corrugated Packaging 1,887.3$ 123.1$ -$ 123.1$ 2,010.4$ -$ 2,010.4$
Consumer Packaging 690.2 1,020.4 - 1,020.4 1,710.6 - 1,710.6
Specialty Chemicals - 262.2 - 262.2 262.2 (262.2) -
Land & Development - 22.0 - 22.0 22.0 - 22.0
Intersegment Eliminations (38.6) (5.4) - (5.4) (44.0) - (44.0)
Total Segment Sales 2,538.9$ 1,422.3$ -$ 1,422.3$ 3,961.2$ (262.2)$ 3,699.0$
Adjusted Segment Income
Corrugated Packaging 217.0$ 18.1$ (2.6)$ 15.5$ 232.5$ -$ 232.5$
Consumer Packaging 77.9 125.0 (34.7) 90.3 168.2 - 168.2
Specialty Chemicals - 61.7 (2.8) 58.9 58.9 (58.9) -
Land & Development - 2.1 6.0 8.1 8.1 - 8.1
Total Segment Income 294.9 206.9 (34.1) 172.8 467.7 (58.9) 408.8
Non-Allocated Expenses (12.7) (30.5) 42.1 11.6 (1.1) - (1.1)
Adjusted Segment Income Including
Non-Allocated Expenses 282.2 176.4 8.0 184.4 466.6 (58.9) 407.7
Noncontrolling Interest - 8.0 (8.0) - - - -
MWV Interest and Other Items - (76.2) - (76.2) (76.2) - (76.2)
282.2$ 108.2$ -$ 108.2$ 390.4$ (58.9)$ 331.5$
Depreciation and Amortization
Corrugated Packaging 122.4$ 8.8$ -$ 8.8$ 131.2$ -$ 131.2$
Consumer Packaging 28.7 58.8 - 58.8 87.5 - 87.5
Specialty Chemicals - 8.5 - 8.5 8.5 (8.5) -
Land & Development - 0.4 - 0.4 0.4 - 0.4
Total Segment D&A 151.1 76.5 - 76.5 227.6 (8.5) 219.1
Non-Allocated Expenses 3.9 3.3 - 3.3 7.2 - 7.2
Total Depreciation and Amortization 155.0$ 79.8$ -$ 79.8$ 234.8$ (8.5)$ 226.3$
Adjusted Segment EBITDA
Corrugated Packaging 339.4$ 26.9$ (2.6)$ 24.3$ 363.7$ -$ 363.7$
Consumer Packaging 106.6 183.8 (34.7) 149.1 255.7 - 255.7
Specialty Chemicals - 70.2 (2.8) 67.4 67.4 (67.4) -
Land & Development - 2.5 6.0 8.5 8.5 - 8.5
Total Adjusted Segment EBITDA 446.0 283.4 (34.1) 249.3 695.3 (67.4) 627.9
Non-Allocated Expenses (8.8) (27.2) 42.1 14.9 6.1 - 6.1
Noncontrolling Interest - 8.0 (8.0) - - - -
Adjusted Segment EBITDA Including
Non-Allocated Expenses 437.2$ 264.2$ -$ 264.2$ 701.4$ (67.4)$ 634.0$
Adjusted Segment EBITDA Margins
Corrugated Packaging (3) 18.8% 21.9% nm 19.7% 18.8% 18.8%
Consumer Packaging 15.4% 18.0% nm 14.6% 14.9% 14.9%
Specialty Chemicals 0.0% 26.8% nm 25.7% 25.7% nm
Land and Development 0.0% 11.4% nm 38.6% 38.6% 38.6%
22
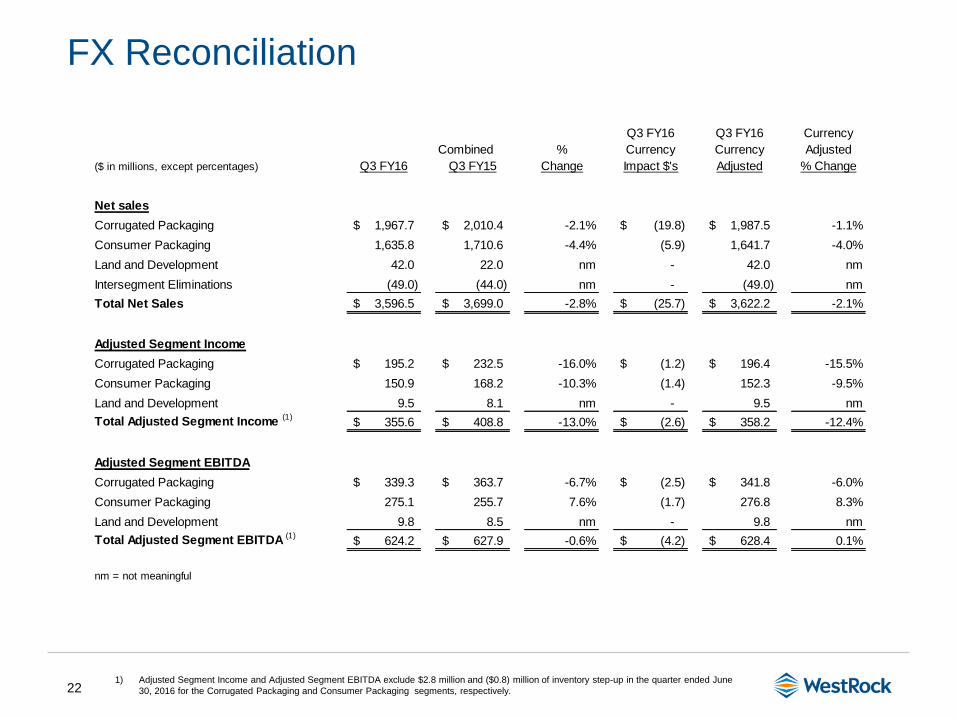
FX Reconciliation
1) Adjusted Segment Income and Adjusted Segment EBITDA exclude $2.8 million and ($0.8) million of inventory step-up in the quarter ended June
30, 2016 for the Corrugated Packaging and Consumer Packaging segments, respectively.
Q3 FY16 Q3 FY16 Currency
Combined % Currency Currency Adjusted
($ in millions, except percentages) Q3 FY16 Q3 FY15 Change Impact $'s Adjusted % Change
Net sales
Corrugated Packaging 1,967.7$ 2,010.4$ -2.1% (19.8)$ 1,987.5$ -1.1%
Consumer Packaging 1,635.8 1,710.6 -4.4% (5.9) 1,641.7 -4.0%
Land and Development 42.0 22.0 nm - 42.0 nm
Intersegment Eliminations (49.0) (44.0) nm - (49.0) nm
Total Net Sales 3,596.5$ 3,699.0$ -2.8% (25.7)$ 3,622.2$ -2.1%
Adjusted Segment Income
Corrugated Packaging 195.2$ 232.5$ -16.0% (1.2)$ 196.4$ -15.5%
Consumer Packaging 150.9 168.2 -10.3% (1.4) 152.3 -9.5%
Land and Development 9.5 8.1 nm - 9.5 nm
Total Adjusted Segment Income (1)355.6$ 408.8$ -13.0% (2.6)$ 358.2$ -12.4%
Adjusted Segment EBITDA
Corrugated Packaging 339.3$ 363.7$ -6.7% (2.5)$ 341.8$ -6.0%
Consumer Packaging 275.1 255.7 7.6% (1.7) 276.8 8.3%
Land and Development 9.8 8.5 nm - 9.8 nm
Total Adjusted Segment EBITDA (1)624.2$ 627.9$ -0.6% (4.2)$ 628.4$ 0.1%
nm = not meaningful

23
FY16 FCF Yield Forecast
(in millions, except percentages)
WestRock FY16 Free Cash Flow Guidance $1,000
WestRock Shares Outstanding as at 7/29/2016 251.5
WestRock Share Price as at 9/9/2016 $46.49
WestRock Market Capitalization $11,692
Implied WestRock FY16 Free Cash Flow Yield 8.6%
WRK
FY16 Guidance

24
Forecasted FY16 Major Consumption Volumes and
FX by Currency
Major Annual Consumption Volumes Units
Recycled Fiber (tons millions) 5.1
Wood (tons millions) 31.2
Natural Gas (cubic feet billions) 68
Diesel (gallons millions) 73
Electricity (kwh billions) 4.7
Polypro/Polyethylene (lbs millions) 97
Caustic Soda (tons thousands) 208
Starch (lbs millions) 532
Annual Consumption Volumes FX By Currency in Q3
USD88%
CAD4%
EUR3%
BRL2%
Other3%
Revenue by
Transaction
Currency
Sensitivity Analysis
CategoryIncrease in Spot
Price
Annual EPS
Impact
Recycled Fiber (tons millions) +$10.00 / ton ($0.11)
Natural Gas (cubic feet billions) +$0.25 / MMBTU ($0.04)
FX Translation Impact+10% USD
Appreciation($0.05 - $0.06)
