wfleabase.org/docs/tilemeseq0905.pdf notes and statistics on base level expression may 2009don...
TRANSCRIPT

wfleabase.org/docs/tileMEseq0905.pdf
Notes and statistics on base level expression
May 2009Don Gilbert Biology Dept., Indiana University

wfleabase.org/docs/tileMEseq0905.pdf
2007: Tile expression
DrosMel tiled by Affymetrix, finds new genes (blue) and known (orange)
.

wfleabase.org/docs/tileMEseq0905.pdf
Precision improves ’06-’09
Measuring expression over gene structures, Nimblegen (08) has higher precision than Affy (06/07)RNA-Seq (09) has higher precision than Nimblegen
.

wfleabase.org/docs/tileMEseq0905.pdf
…
microarray statistics for base level expression?

wfleabase.org/docs/tileMEseq0905.pdf
Gene or Base expression?
• Base-level expression (tiles, rna-seq) calculate like gene differential expression (DE)• Per tile, per RNA-seq contig or per base: treatment - control
• Combine for tiles over gene• Independent (technically) observations, but biologically related• Increase DF, Power with longer gene
• How to combine?• As independent replicates: gene > (tiles, technical, bio replicates)?
• As nested block: gene > tiles > replicates ?
• As gene average: gene = mean(tiles) > replicates ?
• Compare with gene-level stats…

wfleabase.org/docs/tileMEseq0905.pdf
Gene or Base expression?
Base level tests find expression better than gene average
Base level sensitivity= 42%, Gene level sensitivity= 38% Both have specificity= 37% Sensitivity = 1 - false rejection; Specificity = 1 - false discovery

wfleabase.org/docs/tileMEseq0905.pdf
Gene or Base expression?
DE is consistent over gene span though expression Ave changes; gene-level measure can miss this.
Expression over gene span, treatment(red) vs control(green) with 3 replicates

wfleabase.org/docs/tileMEseq0905.pdf
…
gene structures & expression

wfleabase.org/docs/tileMEseq0905.pdf
Sequence normalizing?
Idea is to remove sequence (GC) effects on probe hyb. score
TileScope; Royce TE, Rozowsky JS, and Gerstein, MB. (2007). Assessing the need for
sequence-based normalization in tiling microarray experiments. Bioinformatics, 23, 988-997.
QuickTime™ and a decompressor
are needed to see this picture.
wfleabase.org/docs/tileMEseq0905.pdf
Sequence normalizing?
Sequence-normalizing also removes Exon/Intron signal !
QuickTime™ and a decompressor
are needed to see this picture.
QuickTime™ and a decompressor
are needed to see this picture.Don’t use it (TileScope’s quantilenorm) .. or other sequence adjustments of expression, unless gene structure signals are included.

wfleabase.org/docs/tileMEseq0905.pdf
Intron-Exon Detection
Nimblegen and Solexa tile/base expression detects gene structure, on average, fairly well.

wfleabase.org/docs/tileMEseq0905.pdf
Intron-Exon Update
Newest RNA-Seq finds intron/exon very well
(Stranded RNA-Seq, modEncode Gingeras lab, March 2009 )
wfleabase.org/docs/tileMEseq0905.pdf
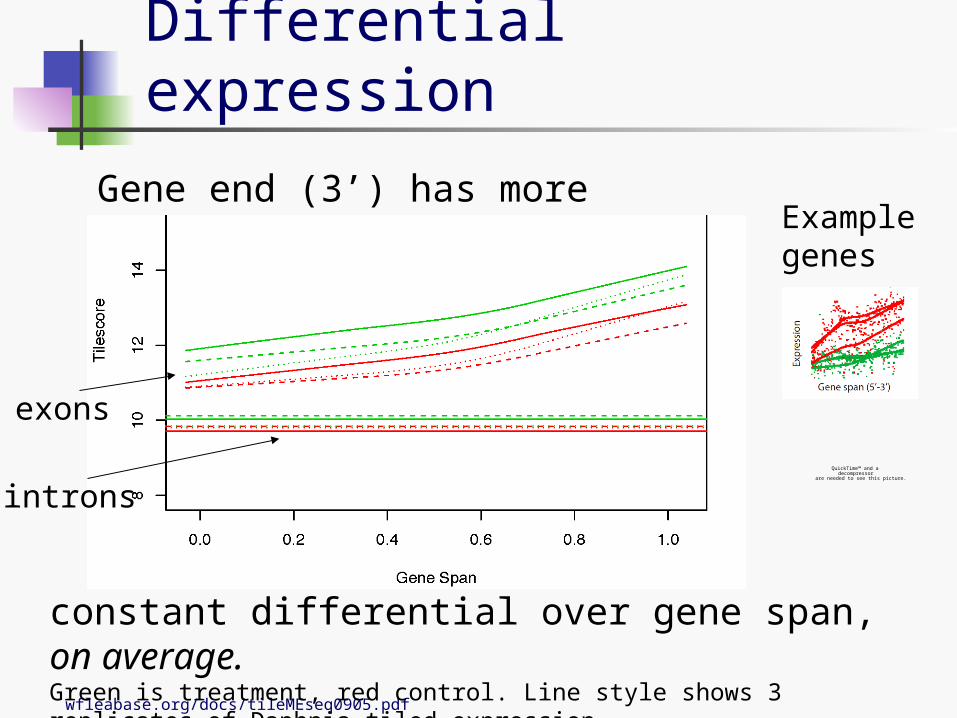
Differential expression
Gene end (3’) has more expression, but
constant differential over gene span, on average. Green is treatment, red control. Line style shows 3 replicates of Daphnia tiled expression.
QuickTime™ and a decompressor
are needed to see this picture.
Examplegenes
introns
exons

wfleabase.org/docs/tileMEseq0905.pdf
Diff. Expr. distributions
Introns show a null DE distribution, genes and TAR regions are wider. Use introns as baseline for statistics?
Genes Introns TARsPred
Sex
Metal

wfleabase.org/docs/tileMEseq0905.pdf
…
multiple testing corrections

wfleabase.org/docs/tileMEseq0905.pdf
Multiple statistic tests• Problem: perform 20,000 tests and p-values hit laws of
chance. Pr = 0.05 can happen 1,000 times by chance (false discovery, FDR).
• DrosMel Affy line t-tests: 2,284,383 / 5,395,023 = 0.42 Sig• Bonferroni: conservative = 0.03 Sig• Benjamini & Hochberg: p.adjust(p,’BH’) = 0.35 Sig• qvalue(p) : distribution based = 0.41 Sig
Storey, JD and R Tibshirani, 2003. Statistical significance for genomewide studies. PNAS 100:9440-
9445
• SAM permutation qvalue• However, p.adjust meant for 100’s of tests, not Millions
• Drosmel modEncode case: 1900 pairwise Affy cell line (62 cells) DE comparisons x 14,000 genes = 26,600,000 t-tests

wfleabase.org/docs/tileMEseq0905.pdf
Multiple DE tests : Daphnia
• Much different corrections for experiments on same genes • Daphnia DE: 3 expt.s (trt - con), 25000 genes, 3 replicates
• Predate, Metal genes have low expression, important to detect
Sex Predate Metals
P<0.05 6733 832 2502
%P 28 3 10
%BH 19 0 0
%Qvalue 21 0 0
max P|Q 1e-2 1e-4 1e-4

wfleabase.org/docs/tileMEseq0905.pdf
Multiple statistic tests
• “Statisticians have turned p-value corrections into an industry, but they are really more of a band-aid than a solution”*
• What about false rejection (FRR; type II error)?• Balance errors, false rejection maybe more important
• Solution #1: test fewer, directed hypotheses
• Solution #2: measure error rate on knowns, eg. prediction of “known” genes
• Solution #3: known null hypothesis, eg. introns*http://www.bioconductor.org/workshops/2009/SeattleApr09/DiffExpr/

wfleabase.org/docs/tileMEseq0905.pdf
QuickTime™ and a decompressor
are needed to see this picture.
1900 pairwise Affy cell line DE comparisons x 14,000 genes = 26,600,000 t-tests

wfleabase.org/docs/tileMEseq0905.pdf
Hypotheses of interest are fewer: ~100s cells x 14,000 genes ~ 2 Million tests
QuickTime™ and a decompressor
are needed to see this picture.

wfleabase.org/docs/tileMEseq0905.pdf
Summary
1. Base-level expression (tiles, rna-seq) measures gene expression better
• Balances sensitivity (false rejection) with specificity (false discovery)
2. Base-level expression measures gene structures well
• On average, and precision is improving for individual genes.
3. Multiple test corrections are needed but problematic
• False discovery corrections for millions of tests leads to false rejections.
• Determine empirical error rates where possible

wfleabase.org/docs/tileMEseq0905.pdf
End note
Summary pageswfleabase.org/genome-summaries/tile-expression/
insects.eugenes.org/species/data/dmel5/modencode/
Genome expression mapsinsects.eugenes.org:8091/gbrowse/cgi-bin/gbrowse/drosmelme/
• expression in 52 cell lines (affy) and more precise solexa & nimblegen for a few cell lines
insects.eugenes.org:8091/gbrowse/cgi-bin/gbrowse/daphnia_pulex8/• expression among 4 treatment groups (sex, metal stress, biotic predator);
nimblegen